Reading view

Shiba Inu Price Prediction, Will $0.0000095 Support Prevent a Breakdown?

Shiba Inu Price

The post Shiba Inu Price Prediction, Will $0.0000095 Support Prevent a Breakdown? appeared first on Coinpedia Fintech News

Shiba Inu has once again captured the spotlight, but this time not just for its meme status. The last few weeks have painted a turbulent picture for SHIB price, shifting sentiment from hopeful recovery to cautious defense at critical support zones. 

As market fatigue sets in across the meme coin sector, traders are monitoring every technical move, questioning whether the Shiba Inu price can truly break free from its bearish grip or if further declines await.

Shibarium TVL

One of the most pressing narratives surrounding the Shiba Inu price is the struggle of its layer-2 solution, Shibarium. As per DeFillama, the Shibarium network’s total value locked stands at just $883,449, barely holding above the $1 million mark. This figure has been sliding since February’s peak above $6 million. 

Shibarium TVL 29-10-25

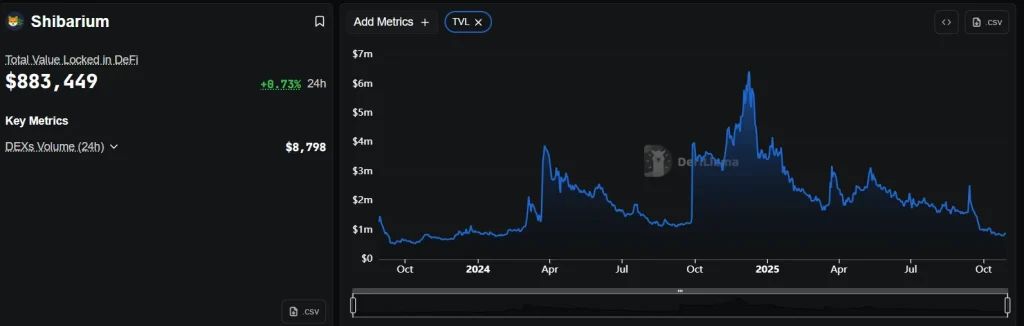
The lackluster TVL signals that DeFi adoption on Shibarium is falling short and thus fails to validate the long-term utility narrative for SHIB. Successively, the low DEX volume ($8,798 in 24 hours) further confirms that on-chain activity is muted.

SHIB Price Analysis

Zooming into the charts, SHIB price currently sits at $0.00001018, marking a -1.14% drop in the last day. Trading volume in the past 24 hours totals $151 million, down 2.89%, hinting at weakening enthusiasm among both buyers and sellers. The price bounced off a 24-hour low at $0.00001002 and failed to clear resistance near its daily high of $0.00001041.

SHIB price 29-10-25

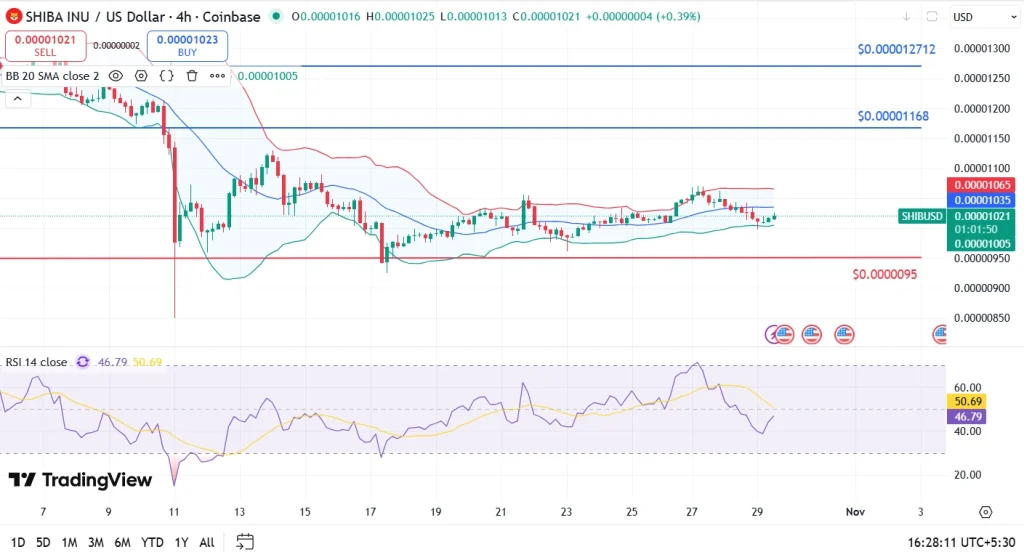
A pivotal technical observation is that SHIB broke below its 7-day SMA at $0.00001021. This move, coupled with rejection at the 23.6% Fibonacci retracement level $0.000011688, reflects persistent selling pressure from bears. Both MACD and RSI indicators paint a cautious outlook, with MACD showing weak bullish momentum and RSI lingering near 41, leaving room for further downside. 

Most importantly, traders are consistently defending the key $0.0000095 support level. Although recovery attempts are stalling beneath the 200-day SMA at $0.000012712. The presence of a death cross since September reinforces the idea that bearish sentiment is still firmly in control.

FAQs

What is the current SHIB price trend?

The SHIB price trades below its weekly average, facing resistance at the 23.6% Fibonacci level. Weak technical indicators and a death cross imply a bearish trend for now.

Is Shiba Inu gaining DeFi traction through Shibarium?

Shibarium’s TVL remains below $1 million, signaling weak utility growth and limited DeFi adoption. Most activity in the ecosystem is muted, dampening its utility-driven upside.

Pi Coin Price Shoots Up 15% Amid ISO 20022 Buzz, What’s Next?

Pi Network News

The post Pi Coin Price Shoots Up 15% Amid ISO 20022 Buzz, What’s Next? appeared first on Coinpedia Fintech News

Today pi coin price has stirred up excitement with a sharp jump. After trading sideways, Pi price suddenly broke out on strong trading volume and is trending higher. The catalyst? Pi Network just joined the ISO 20022 group, a move that caught the market’s attention. 

This fresh alignment with global banking standards, coupled with a big reduction in tokens on exchanges. Moreover, a technical breakout, has transformed pi coin’s near-term outlook. As curiosity around ISO 20022 and pi coin price today grows, I’ll walk you through what’s driving this run and whether momentum can last.

Pi Coin Price Analysis

The Pi price has been on a roll, gaining +15.4% over the past 24 hours and +29.69% for the week. Today Pi Network price is $0.2638, rebounding after dipping to a 24 hour low of $0.2276 and peaking at $0.2706. The daily market cap stands at $2.18 billion, while trading volumes have cooled to $94.31 million, down 15.58% as some traders take profits.

Pi Coin price 29-10-25

On the technical side, the Pi network price had been stuck in a week-long range. Squeezed between key support at $0.23 and resistance at $0.28. As the ISO 20022 news landed, buyers overwhelmed the sell wall at $0.28, pushing the price to new short-term highs.

Supporting this bullishness is a sharp drop in exchange supply. Data shows that roughly 10 million PI tokens left exchange wallets, which typically signals stronger hands are accumulating and less coin is available for quick sale. This supply crunch can amplify price swings.

Can the rally continue? Momentum looks healthy for now, but Pi coin faces the next resistance at $0.3626. If broader crypto markets cooperate and the project delivers further institutional progress, today Pi coin price could grind higher. Watch $0.23 as critical support if the rally fades, but so far, sentiment feels upbeat.

FAQs

Why is Pi Coin price going up?

Pi Network’s price jump was driven by Pi Network joining the ISO 20022 banking standards group. Combined with a technical breakout above $0.28 resistance and a shrinking exchange supply.

How important is ISO 20022 compliance for Pi Coin?

ISO 20022 aligns Pi Network with global banking systems, putting it in the same league as XRP and Stellar.

Is now a good time to buy Pi coin?

Momentum is currently strong thanks to bullish news and shrinking sell-side supply. However, the market remains volatile, so it’s wise to watch for a confirmed trend.

Hedera Price Breaks $0.20, Is $0.233 the Next Stop?

HBAR Price Prediction

The post Hedera Price Breaks $0.20, Is $0.233 the Next Stop? appeared first on Coinpedia Fintech News

If you have been tracking the markets lately, you probably noticed that Hedera’s price just pulled off an impressive rally. HBAR price soared more than 10% in a single day and nearly 18.5% in a week. It has climbed above the important $0.20 level for the first time in months. 

Why did this happen? The answer lies in the following 3 events. First, the much-anticipated launch of the Canary HBAR ETF (HBR) on Nasdaq opened the doors for institutional investors. Second, HBAR staged a breakout above major technical barriers, invalidating a long-standing bearish pattern. Finally, the broader altcoin rotation worked in HBAR’s favor.

HBAR Price Analysis

HBAR’s recent price action paints a striking picture of bullish revival. The current price sits at $0.2007, up over 10% in the last 24 hours and nearly 18.5% for the week. The surge comes with a robust 24-hour trading volume of $580.6 million and a market cap of $8.53 billion.

One of the most significant signals was the break above the 23.6% Fibonacci retracement level at $0.20116. This breakout also coincided with the price crossing above both its 30-day SMA at $0.19255 and the upper Bollinger Band, confirming that momentum shifted to the bulls. Additionally, the MACD histogram flipped positive (+0.0025).

HBAR price analysis 28-10-25

On the sentiment side, HBAR’s surge invalidated a bearish descending channel. While the trend looks strong, the 14-day RSI sits at 48.45, which is considered neutral territory. This suggests there’s still room for upside before the token enters overbought conditions. The next test for the bulls is clear, immediate resistance looms at $0.233, the July swing high. If HBAR conquers this level, momentum could draw further inflows.

FAQs

What caused the recent HBAR price spike?

The HBAR rally is mainly driven by the new Canary HBAR ETF (HBR) launching on Nasdaq, a technical breakout above major resistance, and capital rotating from Bitcoin into altcoins.

Is HBAR’s current breakout sustainable?

HBAR’s breakout is supported by high trading volume, strong technical signals, and a neutral RSI. However, a retest of support levels may occur if bullish momentum fades.

What price levels should I watch next?

Traders should watch $0.233 as the next resistance. Support sits near $0.1925 (30-day SMA) and $0.1847, while holding above these keeps the bullish case intact.

Bitcoin Cash Price Breaks $550, Is the $615 Target Next?

Bitcoin Cash Price Breaks $550, Is the $615 Target Next?

The post Bitcoin Cash Price Breaks $550, Is the $615 Target Next? appeared first on Coinpedia Fintech News

Bitcoin Cash has burst back into the spotlight with a sharp upward move that is catching traders’ attention. In just one day, the BCH price has climbed 6.64% to $558.91, and in the past week alone, it’s rallied an impressive 16.28%. With the market cap pushing $11.17 billion and 24-hour trading volume spiking 65% to $774.45 million, Bitcoin Cash is showing real momentum. 

What’s behind this comeback? First, fears of a $4 billion Bitcoin and BCH sale have eased now that repayments from the long-awaited Mt. Gox case are delayed until 2026. That has taken a big supply shock off the table for now. Adding fuel to the rally, T. Rowe inclusion of BCH in its crypto ETF filing is being seen as a nod of institutional validation.

BCH Price Analysis

Looking at the charts, Bitcoin Cash price has punched through both the 7-day and 30-day SMAs. It is now standing clear above $497.86 and $536.94. At $558.91, BCH is trading close to its daily peak of $564.25, miles above the session low of $536.57. The RSI14 sits at 58.45, which gives a neutral-to-bullish read. The MACD histogram has turned positive with a +5.82 print, supporting the bullish view.

BCH price 27-10-25

A rising 24-hour volume, up nearly 66%, confirms that buyers are not just optimistic but also backing their conviction with real capital. Price is currently challenging the 23.6% Fibonacci retracement level at $577.32. This is a critical area, a clear close above $577 could open the door for a move toward the next resistance zone at $615. Contrarily, the $534 support level will be closely watched. Holding above it keeps the uptrend intact, while a break back below could lead to profit-taking.

The current backdrop suggests that traders are eyeing a potential bullish continuation, provided that volume stays high and no negative headlines emerge. With institutional interest growing and technicals aligning, Bitcoin Cash price prediction models are becoming increasingly optimistic for the week ahead. However, markets can turn quickly, so monitoring key levels and adjusting risk is crucial.

FAQs

What is driving Bitcoin Cash’s latest price rally?

This move is fueled by a mix of positive technical signals, a significant drop in sell-off fears due to the Mt. Gox repayment delay. And growing institutional interest as justified by ETF filings mentioning BCH.

What key levels should BCH traders watch?

Critical resistance sits at $577 and $615. Support is at $534. A close above $577 may trigger further gains, while a slip below $534 could spark selling.

Is the trend for BCH likely to remain bullish?

Momentum is bullish with rising volume and positive MACD. Still, staying above $534 is crucial for the rally to continue. A move below could stall upward momentum.

❌