Reading view

Sui Price Prediction 2025, 2026 – 2030: SUI Price To Hit $5 Soon?

Price Prediction SUI

The post Sui Price Prediction 2025, 2026 – 2030: SUI Price To Hit $5 Soon? appeared first on Coinpedia Fintech News

Story Highlights

  • The live price of SUI crypto is  $ 2.62083633.
  • The SUI price is expected to reach a high of $7.01 in 2025.
  • With a potential surge, the price may reach $23.77 by 2030.

SUI, a next-gen Layer-1 blockchain, is rapidly gaining traction with its focus on scalability, seamless user experience, and Web3 integration via ZkLogin. Sui has quickly gained a strong position in the crypto market. Recently, Grayscale expanded its focus on the Sui ecosystem by launching two new trusts, DeepBook and Walrus. These products give accredited investors direct exposure to tokens within Sui’s DeFi ecosystem.

After a terrifying run due to token unlocks and broader market turmoil. Sui has made an impressive comeback on its price chart and is now changing hands at $2.63, which is 1.48% higher than its previous day’s value.

What Is CoinPedia’s Sui Price Prediction for November 2025?

The price of 1 Sui token could surge to a maximum of $3.42 by the end of November 2025.

Sui Price Today

Cryptocurrency Sui
Token SUI
Price $2.6209 up 0.64%
Market Cap$ 9,502,862,312.82
24h Volume$ 855,506,915.1753
Circulating Supply3,625,742,933.0756
Total Supply10,000,000,000.00
All-Time High$ 5.3519 on 06 January 2025
All-Time Low$ 0.3643 on 19 October 2023

Sui Price Chart

Sui Price Chart All Time 9-10-25

Technical Analysis

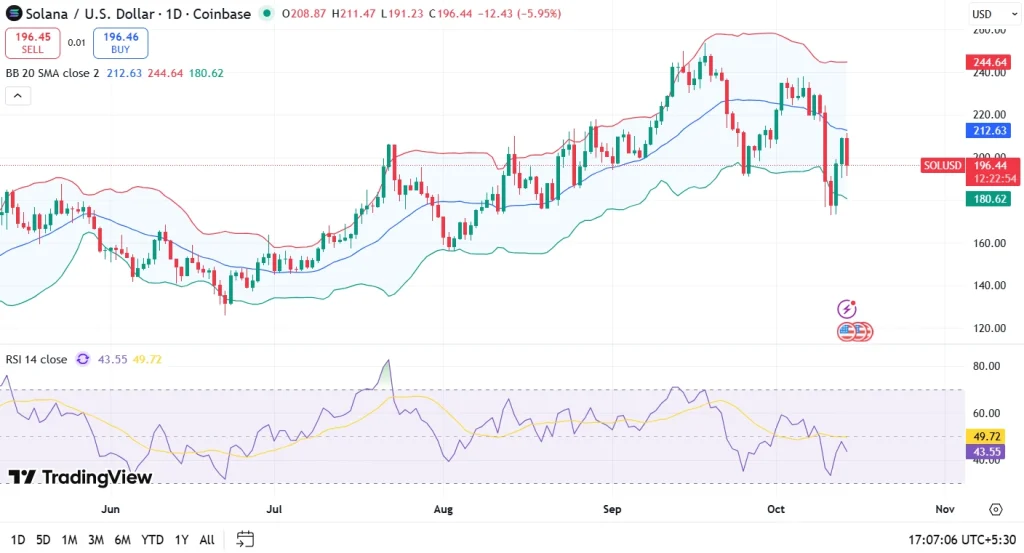
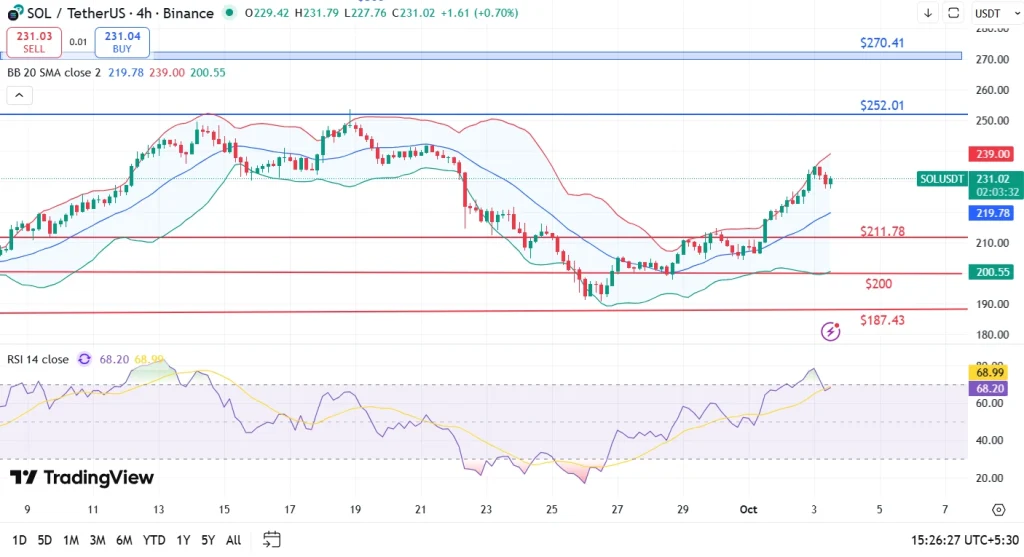
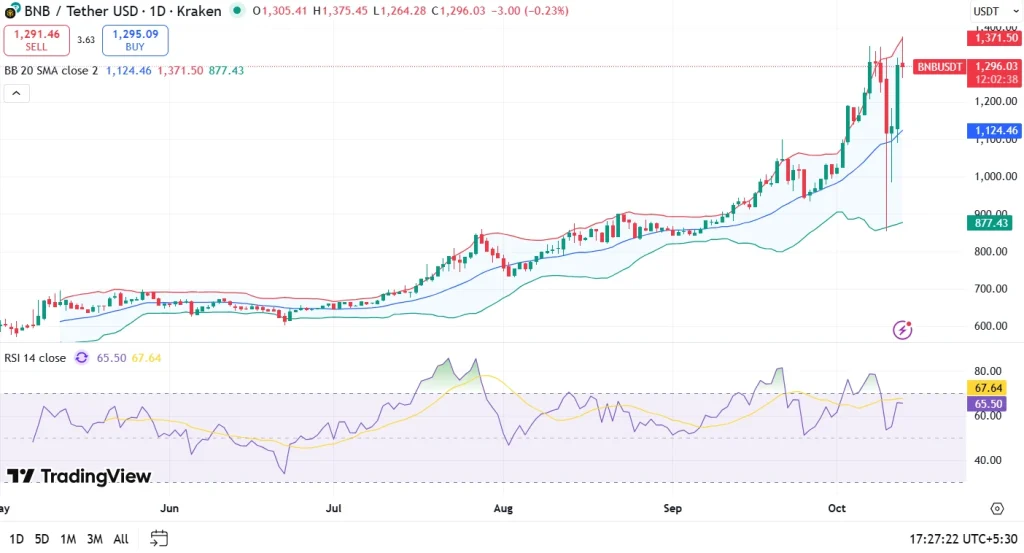
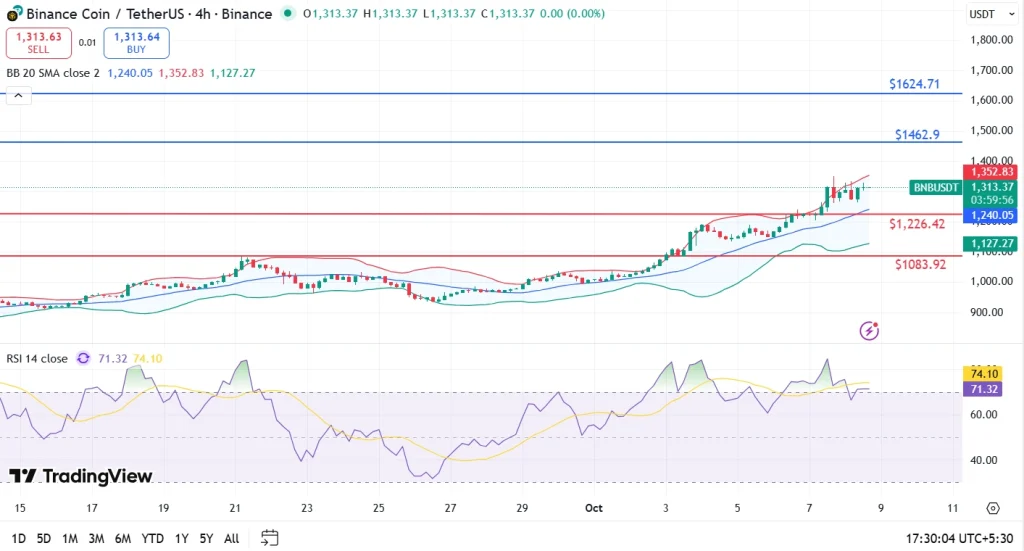
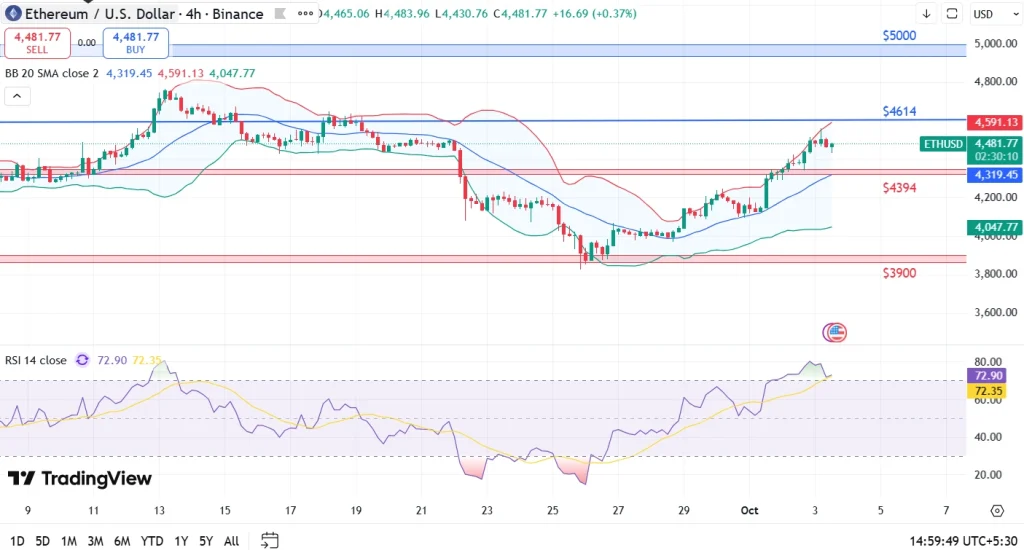
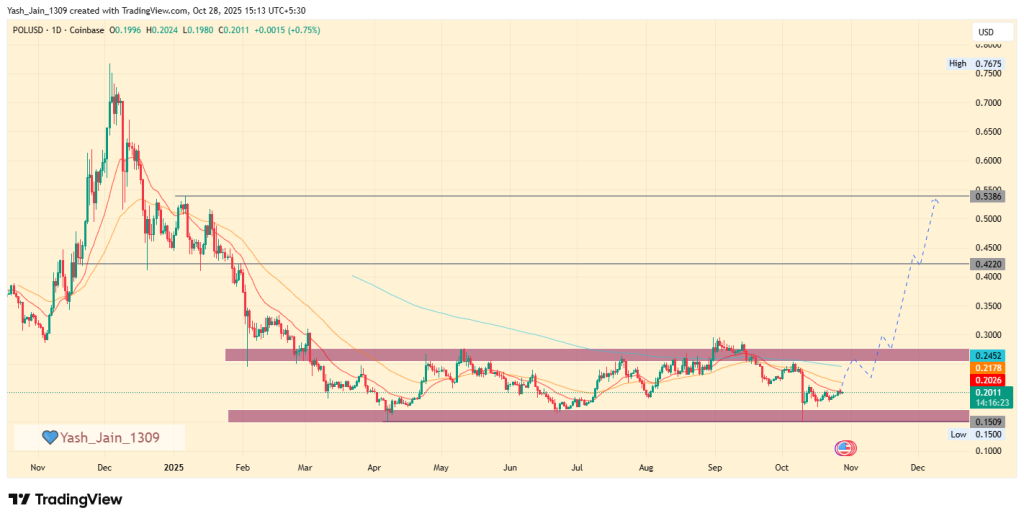
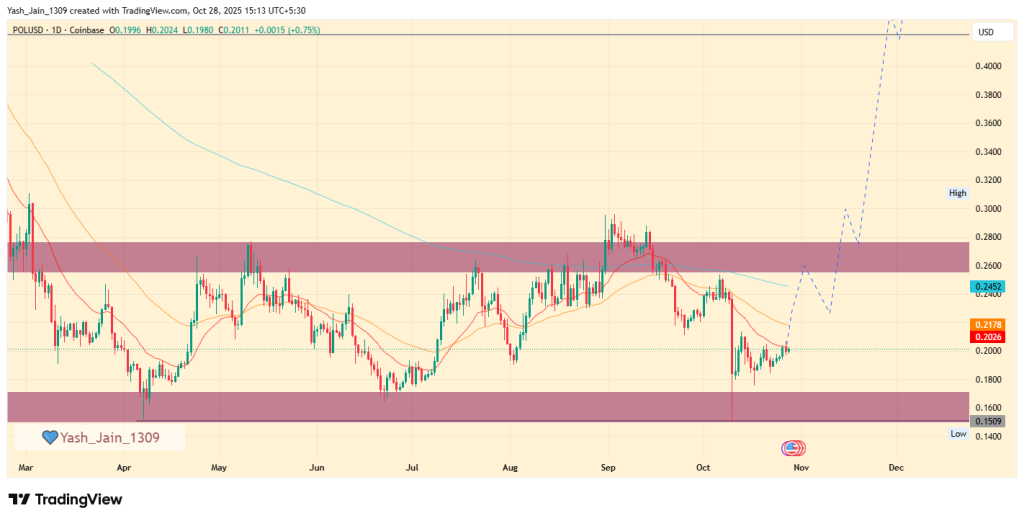
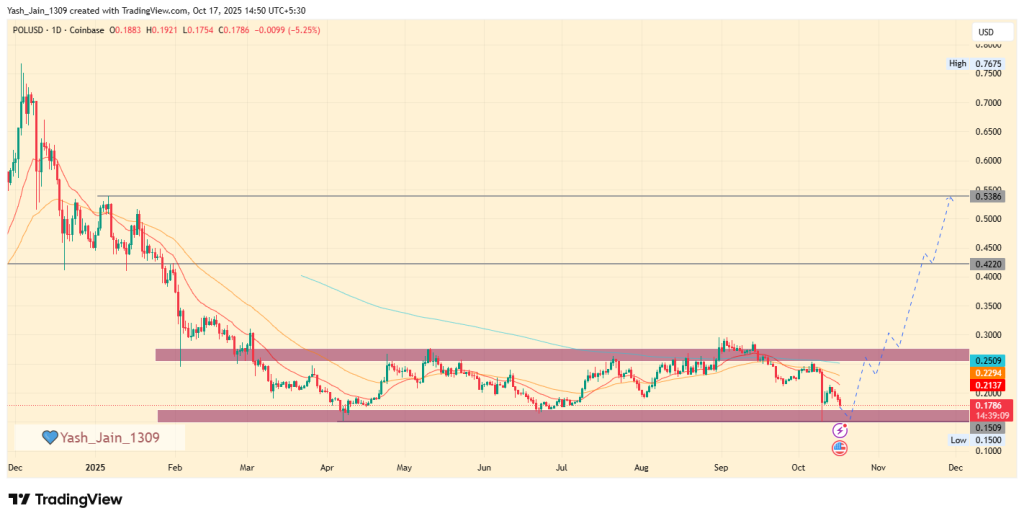
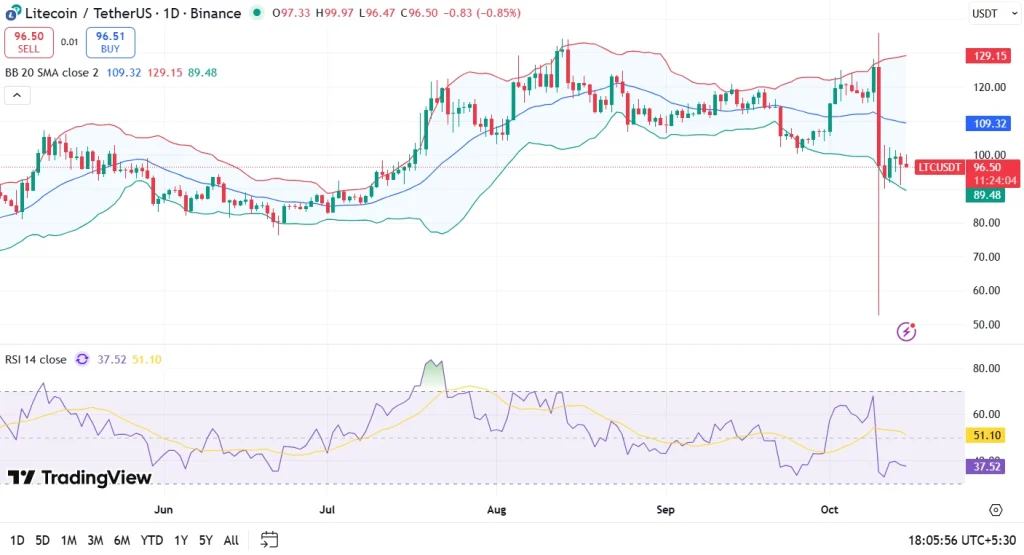
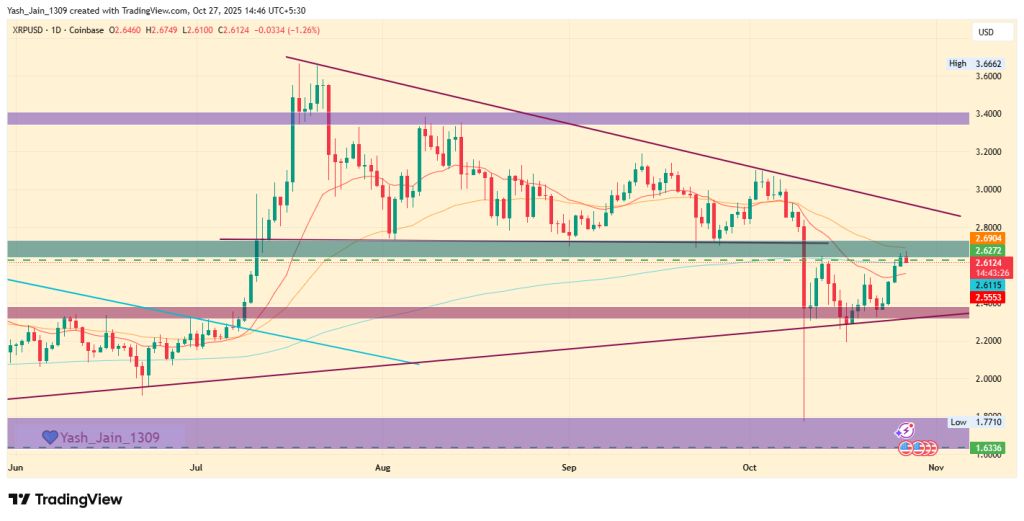
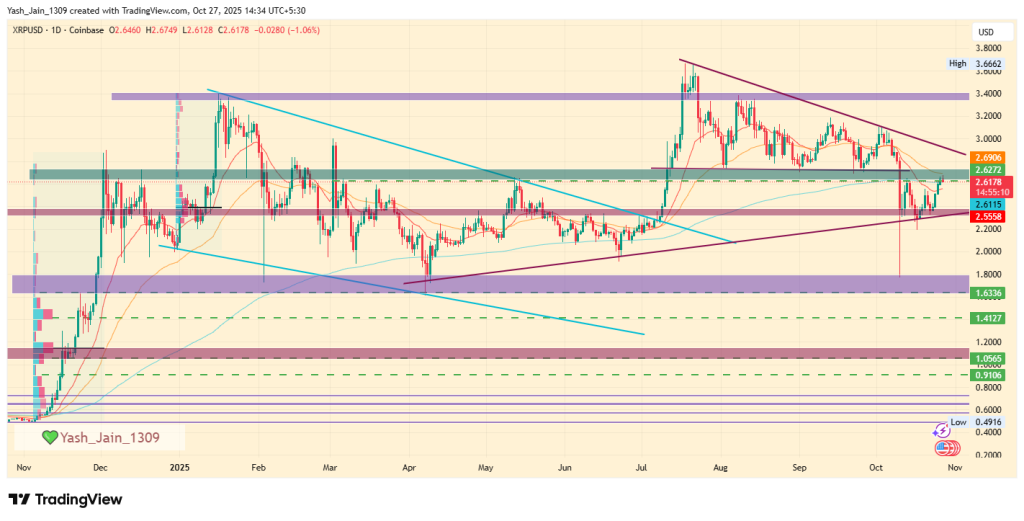
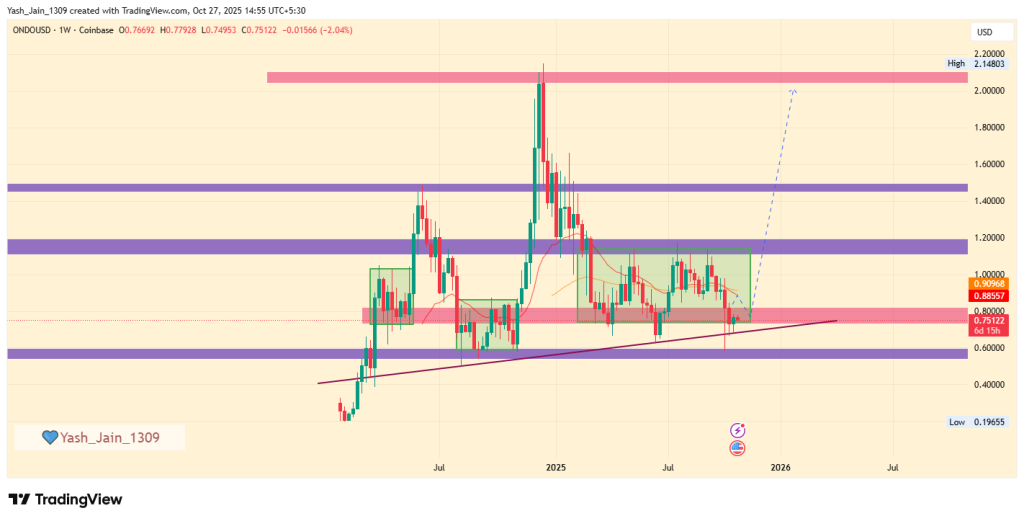
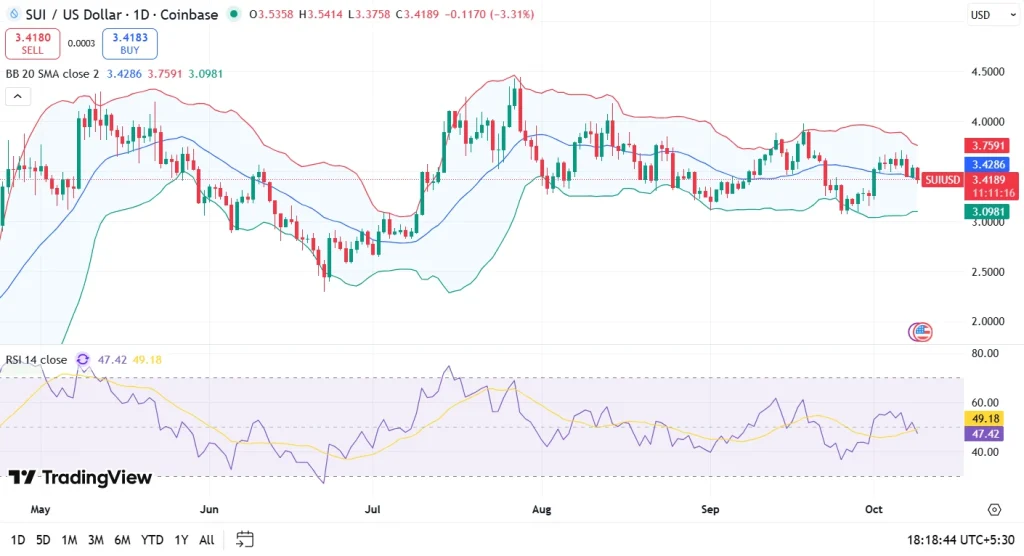
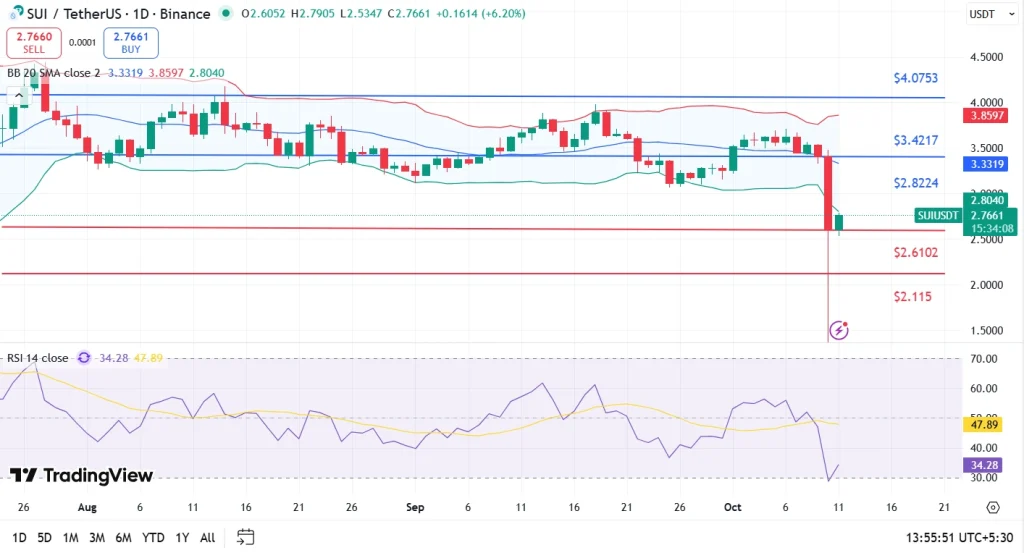
Sui is trading near $2.63 after a sharp breakdown below both the middle and lower Bollinger Bands. Technicals indicate:

Key Support: $2.3550 (recent wick low), $2.70 zone (current price reaction)
Resistance: $2.8012 (middle Bollinger Band), $3.3322 (20-day SMA), $3.8631 (upper Bollinger Band)
Indicators: RSI at 31.25 signals oversold conditions, with a steep downward slope showing strong bearish momentum.

Sui Short-Term Price Prediction

Sui Price Prediction November 2025

Sui is likely to remain volatile in November 2025 amid recent bearish momentum and oversold RSI readings. Expected price range: potential low near $2.115, average around $2.91, and possible high at $3.42 if buyers return. Unless a reversal occurs, price action may struggle above $3.00, with ongoing downside risks in the near term.

Sui Oct price chart 11-10-25
MonthPotential LowPotential AveragePotential High
November$2.115$2.91$3.42

Sui Price Prediction 2025

ETF interest is also rising. The SEC moved forward with Canary Capital’s proposal, while 21Shares is also under review. Though decisions are delayed until January 2026, the ongoing discussions could heat up if the U.S. takes a crypto-friendly regulatory path.

Sui Network plans a $320 million token unlock by the end of 2025. The forecast of this altcoin for 2025 suggests a new all-time high with a potential high of $7.01, assuming the bullish sentiment sustains. However, with a short correction, it may reach a potential low of $3.84, making an average of $5.42.

YearPotential LowPotential AveragePotential High
2025$3.84$5.42$7.01

Also, read our Solana Price Prediction 2025, 2026 – 2030!

Sui Crypto Medium-Term Price Prediction

YearPotential Low ($)Potential Average ($)Potential High ($)
20265.167.219.26
20276.399.1611.94

Sui Token Price Outlook 2026

The SUI coin token projection for the year 2026 could range between $5.16 to $9.26, and the average price of the altcoin could be around $7.21.

Sui Price Target 2027

SUI crypto price for the year 2027 could range between $6.39 to $11.94, and the average price of this crypto token could be around $9.16.

Sui Long-Term Price Prediction

YearPotential Low ($)Potential Average ($)Potential High ($)
20287.9812.6815.38
20299.4714.5819.69
203012.6318.2023.77

Sui Coin Price Forecast 2028

Sui project can make a potential high of $7.98 in 2027, with a potential low of $15.38, leading to an average price of $12.68.

Sui Token Price Prediction 2029

The forecast of this token for the year 2029 could range between $9.47 to $19.69, and the average coin price could be around $14.58.

Sui Price Prediction 2030

With an established position in the market, altcoins’ potential high for 2030 is projected to be $23.77. On the flip side, a potential low of $12.63 will result in an average price of $18.20.

SUI Price Prediction 2031, 2032, 2033, 2040, 2050

Based on the historic market sentiments and trend analysis of the altcoin, here are the possible Sui price targets for the longer time frames.

YearPotential Low ($)Potential Average ($)Potential High ($)
203116.3823.0929.81
203221.2729.8138.35
203328.0938.9249.76
204082.45130.64178.84
2050496.64802.181,107.73

Check out, Avalanche Price Prediction 2025, 2026 – 2030!

Market Sentiments

Firm Name202520262030
Wallet Investor$8.38$11.84
PricePrediction.net$1.64$2.41$10.83
DigitalCoinPrice$11.49$16.35$34.39
VanEck $16

CoinPedia’s Sui Price Prediction

Coinpedia’s price prediction for SUI is highly bullish as the price is displaying a constant uptrend. This suggests that the price may reach new swing highs during the upcoming time.

With the ongoing Sui crypto update, the price is predicted to be a high of $7.01, with an average price of $5.42.

CoinPedia expects the Price to reach $7.01 by the year-end.

YearPotential LowPotential AveragePotential High
2025$3.84$5.42$7.01
Never Miss a Beat in the Crypto World!

Stay ahead with breaking news, expert analysis, and real-time updates on the latest trends in Bitcoin, altcoins, DeFi, NFTs, and more.

FAQs

Is Sui cryptocurrency a good investment?

Yes, the SUI blockchain is one of the most prominent projects and is projected to gain significant value in the coming time.

Will SUI reach $10 in 2025?

With a bullish surge, the altcoin may hit a high of $7.01 this year.

Sui price prediction for the next 5 years?

Considering the Sui long-term price prediction, it may reach a high of $23.77 by 2030.

Does Sui have a future?

With the rising popularity of the Sui token, this project may achieve the $23.77 mark by 2030.

What is the price prediction for the Sui coin?

The Sui project is targeted to conclude the year 2028 with a trading price of $15.38.

Will Sui Cryptocurrency rise?

With active development on the SUI coin exchange, this crypto token is predicted to outperform some major cryptocurrencies in the coming years.

How much would the price of SUI be in 2040?

As per our latest Sui price analysis, the SUI could reach a maximum price of $178.84.

How much will the Sui coin price be in 2050?

By 2050, a single SUI price could go as high as $1,107.73.

Solana Price Prediction 2025, 2026 – 2030: SOL Price Targets $500 Next?

price prediction solana (sol)

The post Solana Price Prediction 2025, 2026 – 2030: SOL Price Targets $500 Next? appeared first on Coinpedia Fintech News

Story Highlights

  • Solana Price Today is  $ 200.74643390.
  • Solana coin price could reach a potential high of $400 in 2025.
  • With a potential surge, the SOL price could hit $1,351 by 2030.

Solana has been quietly building momentum, proving that its network strength is not just hype but backed by real numbers. Over the last quarter, its DeFi ecosystem expanded rapidly, drawing strong attention from investors.

Talking about Solana news, Grayscale has opened up staking for its Solana Trust (GSOL), which lets its investors earn SOL rewards via conventional brokerage accounts. This, coupled with Q3 network upgrades, monthly DEX volumes, and a TVL surge, these developments are fueling bullish momentum and positioning Solana as a top Ethereum alternative.

Following this, crypto investors are storming Google with questions like “Will Solana Go Back Up?” or “How high can Solana go?” and “Will SOL price reach $500 this altcoin season?” To answer more such questions, we bring to you our latest Solana price prediction 2025, 2026 – 2030.

Solana Price Today

Cryptocurrency Solana
Token SOL
Price $200.7464 up 0.57%
Market Cap$ 110,350,550,631.66
24h Volume$ 6,483,584,520.4725
Circulating Supply549,701,175.1960
Total Supply612,847,388.3837
All-Time High$ 294.3349 on 19 January 2025
All-Time Low$ 0.5052 on 11 May 2020

Solana Price Chart

Sol price chart 14-10-25

Technical Analysis

Solana (SOL) is currently trading near $202, having recently retraced from highs around $211.11. Technicals indicate:

  • Key support is at $181, resistance zones are at $212 and $244.​
  • Price remains below 50-day ($212) and 200-day ($172) moving averages​​
  • RSI at 43.5 signals neutral-to-weak buying pressure.​​
  • MACD stays bearish, highlighting further downside risk.​
  • A move above $212 could revive bullish sentiment

Solana Short-Term Price Prediction

Solana Price Prediction for November 2025

SOL price is showing strength after winning over key levels. The RSI signals weak buying conditions, suggesting potential short-term pullback. If $200 breaks, the next support lies near $187.43. The resumption of the uptrend could push prices toward $252.01, then eventually to $270.41.

SOL Price Analysis 3-10-25
MonthPotential LowPotential AveragePotential High
November$187$210$229

Solana Price Prediction 2025

Looking ahead, the Alpenglow upgrade, expected late 2025 or early 2026, will finalize blocks in about 150 milliseconds and simplify Solana’s consensus process. This could unlock real-time settlement for payments and derivatives, though short-term risks remain given past network stability issues.

Institutional players are already taking positions. Companies like Bit Mining, Upexi, and DeFi Development Corp together hold over 3.5 million SOL, worth more than $591 million. With technical upgrades, new partnerships, and rising investor interest, analysts see 2025 as a year of major potential.

If the market favors the bulls, the Solana coin price could breach its current all-time high and head toward a new high of $400. Conversely, stricter regulations or a network congestion setback could pull the price toward its annual low of $250. Considering the present market sentiment, the SOL crypto could settle with an average trading price of around $325.

YearPotential LowPotential AveragePotential High
2025$250$325$400

Also, read Ethereum Price Prediction 2025, 2026 – 2030!

SOL Medium-Term Price Prediction

YearPotential Low ($)Potential Average ($)Potential High ($)
2026310410510
2027389506623

Solana Price Forecast 2026

By the Solana Price Prediction 2026, the potential low price of Solana crypto could be $310, with an average price projected at $410 and a potential high of $510.

SOL Price Analysis 2027

Moving on to Solana Price Prediction 2027, the potential low price for SOL is estimated at $389, while the average price is predicted to be around $506. The potential high price for SOL in 2027 is projected to reach $623.

Solana Long-Term Price Prediction

YearPotential Low ($)Potential Average ($)Potential High ($)
2028476622769
2029597772948
20307161,0331,351

Solana Coin Price Prediction 2028

As per the Solana Price Prediction 2028, the potential low price for SOL is expected to be $476, with an average price of $622. Further, the potential high price for SOL during this year is projected to reach $769.

SOL Coin Price Prediction 2029

Looking ahead to 2029, the Solana price targets a potential low of $597, with an average price of $772. Moreover, the potential high price for SOL in 2029 can reach $948.

Solana Price Prediction 2030

For Solana Price Prediction 2030, we estimate a potential low at $716, with an average price of $1,033. The potential high price for Solana in 2030 is projected to reach $1,351.

Solana (SOL) Price Projection 2031, 2032, 2033, 2040, 2050

YearPotential Low ($)Potential Average ($)Potential High ($)
20319361,3511,766
20321,1961,6972,198
20331,5662,4173,269
20405,0918,39411,698
205023,35847,90872,459

Market Analysis

Firm Name202520262030
Changelly$228.37$280.81$1,136
Coincodex$291.49$186.25$447.82
Binance$202.18$212.29$258.04

Raoul Pal’s Bold Outlook: Solana Price Prediction Of A Potential 20X Rally:

Raoul Pal, founder of Real Vision, predicts a potential 20x rally for Solana. He attributes this to Solana’s advanced blockchain technology, growing ecosystem, and rising investor interest. 

If Pal’s prediction holds true, Solana’s price could exceed $400 in the coming months, a significant surge from its previous peak. Despite market trends, Solana has shown resilience, maintaining a strong performance with consistent buying pressure.

CoinPedia’s Solana (SOL) Price Prediction

With the improving network conditions of Solana and the slow but steady rise in the DeFi sector, the SOL prices project a bullish future.

According to CoinPedia’s formulated Solana price prediction 2025, the price might surge to $400. On the flip side, a failure to sustain recovery will plunge Solana prices to $250 during that year.

YearPotential LowPotential AveragePotential High
2025$250$325$400

Also, read our Tron Price Prediction 2025, 2026 – 2030!

Never Miss a Beat in the Crypto World!

Stay ahead with breaking news, expert analysis, and real-time updates on the latest trends in Bitcoin, altcoins, DeFi, NFTs, and more.

FAQs

Will Solana reach a new ATH in 2025?

According to our Solana price prediction 2025, the altcoin might chug up to a maximum of $400 by 2025.

Could Solana reach $1,000 by 2030?

As per our Solana price prediction 2030, with a potential surge, the price of SOL could reach a maximum of $1,351.

Will Solana reclaim its crown of being an Ethereum killer?

Solana stock, with its strengths in fundamentals, still holds significant prominence. That said, we can expect its glory to shine brighter with resolutions to shortcomings and major Solana news.

Will Solana enter the top-3 cryptos in terms of market capitalization in 2025?

Solana holds the potential to climb higher on the market cap rankings. The digital asset could make it to the target if it does not fall to negative criticism.

What is the Solana Foundation?

The Solana Foundation is dedicated to growing the Solana network into the world’s most decentralized and censorship-resistant blockchain.

How much would the price of Solana be in 2040?

As per our latest SOL price analysis, Solana could reach a maximum price of $11,698.

How much will the SOL price be in 2050?

By 2050, a single Solana price could go as high as $72,459.

Binance Coin Price Prediction 2025, 2026 – 2030: Will BNB Hit $1000?

price prediction Binance coin

The post Binance Coin Price Prediction 2025, 2026 – 2030: Will BNB Hit $1000? appeared first on Coinpedia Fintech News

Story Highlights

  • Binance Coin Price Today is  $ 1,141.24943561.
  • The BNB price prediction anticipates a potential high of $2,292 in 2025.
  • Binance price may reach a maximum of $17,085.94 by 2030.

Binance Coin, after facing the brunt of the crypto market downturn, has made fresh highs to mark a new all-time high at $1370.55. Successively, at the time of press, BNB coin is being sold across exchanges for $1090.42

Amid the changing landscape, the Binance Coin fundamentals remain solid. However, the underlying uncertainties amid the global tensions raise questions like, “Is Binance safe or not?” or “Will Binance go higher in 2025?”

To answer these questions and provide a clear view of the BNB price action, we present our latest Binance Coin (BNB) Price Prediction 2025, 2026 – 2030.

BNB Price Today

Cryptocurrency BNB
Token BNB
Price $1,141.2494 down -0.13%
Market Cap$ 157,193,681,244.02
24h Volume$ 3,401,049,563.6926
Circulating Supply137,738,233.50
Total Supply137,738,233.50
All-Time High$ 1,370.5460 on 13 October 2025
All-Time Low$ 0.0961 on 01 August 2017
*The statistics are from press time.

Binance Coin Price Chart

BNB price analysis 13-10-25

Technical Analysis

  • Resistance levels stand near $1,370 as the recent peak, with further resistance around $1,400.
  • Key support is identified around $1,000, where a breakout occurred.
  • The 50-day moving average is climbing steadily at approximately $941.76, while the 200-day average also trends upward near $736.19, indicating strength in both short and long terms.
  • Overall, the short-term outlook favors continued gains, but the elevated technical readings call for caution as a pullback could happen near resistance.

Binance Coin Short-Term Price Prediction

BNB Coin Price Prediction for November 2025

BNB is showing strong bullish momentum, if buyers sustain above $1,300, the next upside targets are $1,462 and $1,624. However, rejection from the current trend channel could trigger a short-term pullback toward $1,226 or even $1,083. Overall, the October 2025 outlook stays bullish as long as BNB holds above $1,200, with a potential low at $1,180, an average near $1,350, and a high around $1,620.

BNB Oct 8 Price Prediction
MonthPotential LowPotential AveragePotential High
November$1180$1350$1620

Binance Coin Price Prediction 2025

Now, attention has shifted to VanEck’s proposed BNB ETF in the U.S. If approved by late 2025 or early 2026, it could attract both institutional and retail investors, fueling more demand. With over 5,000 dApps and $8.1 billion in total value locked, the chain continues to grow.

That being said, the investors can anticipate the BNB coin price reaching a new All-Time High of $2,292. On the flip side, the Binance crypto may experience a low of $761 during that year. Considering the buying and selling pressure, the 3rd largest cryptocurrency could conclude the year 2025 with an average price of $926.

YearPotential LowPotential AveragePotential High
2025$761$926$2,292

Curious if Bitcoin will hit $100K as the crypto bull run begins? Find out more about Coinpedia’s Bitcoin price prediction.

BNB Crypto Medium-Term Price Prediction

YearPotential Low ($)Potential Average ($)Potential High ($)
20261,1252,2503,375
20271,687.503,3755,062.50

Binance Coin Price Forecast 2026

By late 2026, BNB’s price could climb to a high of $3,375. However, the price might dip to $1,125, with an average value of $2,250 throughout the year.

BNB Coin Price Prediction 2027

In 2027, BNB’s price is anticipated to hit a peak of $5,062.50. On the downside, the price could fall to $1,687.50, with an average of $3,375.

Binance Coin Long-Term Price Prediction

YearPotential Low ($)Potential Average ($)Potential High ($)
20282,531.255,062.507,593.75
20293,796.887,593.7511,390.63
20305,695.3111,390.6317,085.94

Binance Crypto Price Projection 2028

By the close of 2028, BNB’s price may reach a high of $7,593.75. If market conditions worsen, it could drop to $2,531.25, with an average price of $5,062.50.

BNB Crypto Price Prediction 2029

In 2029, BNB could continue its upward momentum, potentially reaching $11,390.63. However, it may see a low of $3,796.88, with an average price of $7,593.75.

Binance Coin Price Prediction 2030

As 2030 begins, BNB crypto could hit a new high of $17,085.94. Conversely, it may bottom out at $5,695.31, with an average price of $11,390.63.

Binance Price Projection 2031, 2032, 2033, 2040, 2050

Based on the historic market sentiments and trend analysis of the altcoin, here are the possible BNB coin price targets for the longer time frames.

YearPotential Low ($)Potential Average ($)Potential High ($)
20318,542.9717,085.9425,628.91
203212,814.4525,628.9138,443.36
203319,221.6838,443.3657,665.04
2040145,519.24291,038.49436,557.73
20501,131,478.372,262,956.733,394,435.10

What Does The Market Say?

Firm Name202520262030
Changelly$608.66$1,219$6,344
Coincodex$1,119.10$592.92$1,305.46
Binance$608.63$639.06$776.79

CoinPedia’s Binance (BNB) Coin Price Prediction

Despite the growing troubles of workforce reduction, regulatory scrutiny, and frequent executive departures, the Binance ecosystem is expanding. With its research in product innovations and new token listings, Binance Exchange has the highest trading volume.

As per CoinPedia’s Binance (BNB) coin price prediction, the price of $BNB crypto will increase to $2,292 in 2025.

YearPotential LowPotential AveragePotential High
2025$761$926$2,292

Is BNB a Profitable Investment?

Yes, BNB crypto is a profitable investment for the long term. Several initiatives, such as the auto-burn mechanism, contribute to reducing its supply and potentially increasing its value over time.

CoinPedia has dedicated a team of expert analysts to cover the possible crypto price prediction and sum it all up in one place, just for you!

Key Factors & Risks

  • Regulatory scrutiny of Binance operations globally poses ongoing compliance and legal challenges.
  • Expanding the BNB Chain ecosystem demands continuous innovation to maintain a competitive advantage.
  • Network upgrades like Lorenz and Maxwell forks enhance scalability but require successful implementation.
  • Market shifts, including macroeconomic trends and institutional demand, impact BNB price volatility.
  • Concentrated BNB holdings by Binance create potential supply and liquidity risks.
  • Investor sentiment and social media hype contribute to price swings and short-term volatility.
Never Miss a Beat in the Crypto World!

Stay ahead with breaking news, expert analysis, and real-time updates on the latest trends in Bitcoin, altcoins, DeFi, NFTs, and more.

FAQs

What was the initial price of Binance Coin (BNB)?

The initial price of Binance Coin (BNB) at the time of the ICO was $0.15.

What is the all-time low (ATL) price of Binance Coin (BNB)?

The all-time low price of Binance Coin was $0.09611 on August 01, 2017.

What could be the maximum trading price of Binance Coin by the end of 2025?

As per our BNB price prediction 2025, the maximum trading price of $BNB could potentially reach $2,292 in 2025.

How high could the BNB price reach by the end of 2030?

The price of the digital asset could reach a potential high of $17,085.94 by 2030.

What is the all-time high (ATH) price of Binance Coin (BNB)?

The all-time high price of Binance Coin was $793.35 on December 04, 2024.

Is BNB a good investment?

Yes, BNB is a profitable investment for the long term. With initiatives such as auto-burn, numerous projects, and growing prominence, we could find it bearing fruit.

How much would the price of Binance be in 2040?

As per our latest BNB price analysis, Binance could reach a maximum price of $436,557.73.

How much will the BNB price be in 2050?

By 2050, a single Binance price could go as high as $3,394,435.10.

Ethereum Price Prediction 2025, 2026 – 2030: Can ETH Reach $10k?

Ethereum price prediction

The post Ethereum Price Prediction 2025, 2026 – 2030: Can ETH Reach $10k? appeared first on Coinpedia Fintech News

Story Highlights

  • The Ethereum price today is  $ 4,120.17714018.
  • ETH price with a potential surge could hit $6,925 in 2025.
  • The price of Ethereum could reach a high of $15,575 by 2030.

Amidst the turn of events, most cryptocurrencies are riding the bullish wave. And Ethereum, too, is receiving volumes. The Ethereum price today is $4150, with an intraday price change of -0.27%. Curious about where the ETH price is heading in the long run? Read our latest Ethereum price prediction for potential price targets.

What will be the ETH Price tomorrow?

Based on the current price trend, the ETH price tomorrow could range between $4,000 and $4,200.

Ethereum Price Today

Cryptocurrency Ethereum
Token ETH
Price $4,120.1771 down -0.82%
Market Cap$ 497,297,675,153.58
24h Volume$ 29,770,225,928.8059
Circulating Supply120,698,129.7731
Total Supply120,698,129.7731
All-Time High$ 4,953.7329 on 24 August 2025
All-Time Low$ 0.4209 on 21 October 2015

Ethereum Price Chart

ETH price chart 8-10-25

Technical Analysis

  • Key Support: $3,500
  • Resistance: $4,300, psychological $5,000 level
  • Indicators: RSI shows bullish momentum

ETH Short-Term Price Prediction

Ethereum Price Prediction November 2025

ETH Price Prediction 3-10-25

Ethereum is trading short of its strong resistance at $5,000 and $5,250, while support holds at $3,762. For November 2025, if bullish momentum continues, ETH could test $5,250 as the potential high. On the downside, if selling pressure intensifies, the price might revisit $4,144 as a potential low. Considering the current trend and RSI near 46.5, the average price is expected to be around $4,700, assuming consolidation within the current range before a major breakout.

MonthPotential LowPotential AveragePotential High
November$4,144$4,700$5,250

Ethereum Price Prediction 2025

A spot-ETH ETF could be the next major milestone. If approved, it may attract billions in capital. On top of that, institutional activity is growing. Layer-2 growth and big firms like State Street and PayPal are also building on Ethereum. The next big step is the Fusaka upgrade, coming in November 2025. Before that, Pectra will roll out in Q4, with long-term changes like Verkle Trees and danksharding ahead. These will make Ethereum faster and cheaper.

Ethereum price has been trading in a symmetric triangle pattern since early 2021, a breakout could lead to the ETH coin price hitting a new all-time high of $9,428.11. Conversely, rising uncertainty or any unfavorable global economic events could pull the ETH price toward its annual low of $3,142.70. That being said, it could average out at around $6,285.41.

YearPotential LowPotential AveragePotential High
2025$3,142.70$6,285.41$9,428.11

Ethereum Medium-Term Price Prediction

YearPotential Low ($)Potential Average ($)Potential High ($)
20264,714.059,428.1114,142.16
20277,071.0814,142.1621,213.24

ETH Price Prediction 2026

By 2026, the value of Ethereum is expected to reach a high of $14,142.16. On the other hand, the Ethereum price might drop to $3,142.70, with an average of $6,285.41.

Ethereum Price Forecast 2027

The Ethereum 2027 forecast expects the ETH coin price to make a new all-time high at $21,213.24. However, a correction based on market shortcomings may drive the ETH crypto to $7,071.08, with an average of $14,142.16.

Ethereum Long-Term Price Prediction

YearPotential Low ($)Potential Average ($)Potential High ($)
202810,606.6221,213.2431,819.86
202915,909.9331,819.8647,729.79
203023,864.9047,729.7971,594.69

ETH Price Prediction 2028

In 2028, the chances of Ethereum dominating the crypto market rise as the ETH price potentially makes a new high at $31,819.86. On the other hand, the altcoin might fall to $10,606.62, making an average of $21,213.24.

Ethereum Price Forecast 2029

Approaching its all-time high of $47,729.79 in 2029, the Ethereum price is expected to surpass the psychological barrier of $40,000. In case of a correction, $ETH may reach a low of $15,909.93, with an average price of $31,819.86.

Ethereum Price Prediction 2030

As per our Ethereum Price Prediction 2030, the ETH crypto price is projected to reach a new all-time high of $71,594.69 in 2030, with a potential low of $23,864.90 and an average price of $47,729.79.

Ether Price Prediction 2031, 2032, 2033, 2040, 2050

Based on the historic market sentiments and trend analysis of the largest altcoin by market capitalization, here are the possible Ethereum price targets for the longer time frames.

YearPotential LowAverage PricePotential High
203135,797.3571,594.69107,392.04
203253,696.02107,392.04161,088.06
203380,544.03161,088.06241,632.09
2040~1,376,550~2,753,110~4,128,680
2050~79,396,500~158,793,000~238,189,500

CoinPedia’s Ethereum Price Prediction

With factors like the growing Ethereum network, rising inflows, broader market recovery, and increased adoption, the ETH price will likely give multi-fold returns in 2025.

As per CoinPedia’s Ethereum price prediction 2025, the Bulls can hit $9,428.11 in 2025. Conversely, a rise in FUD amongst investors and a lack of updates could curb the value of 1 ETH at $3,142.70.

YearPotential LowPotential AveragePotential High
2025$3,142.70$6,285.41$9,428.11

Market Analysis

Firm Name202520262030
Changelly$4,012.41$5,375$24,196
Coincodex$6,540.51$3,816.62$6,660.08
Binance$3,499.54$3,674.52$4,466.40
VanEck$6,000

Ethereum price could shoot to $5,500 soon and $12,000 by 2025

-Tom Lee

*The Ethereum forecast mentioned above is the average targets set by the respective firms.

Never Miss a Beat in the Crypto World!

Stay ahead with breaking news, expert analysis, and real-time updates on the latest trends in Bitcoin, altcoins, DeFi, NFTs, and more.

Key Factors & Risks

  • Regulatory uncertainty from SEC delays and new global frameworks.
  • Centralization risk driven by institutional validators and staking growth.
  • Rapid ecosystem expansion with security token adoption and active staking.
  • Vulnerability to macroeconomic shifts like Fed policy changes and market sentiment.
  • Ongoing privacy and censorship risks from stricter compliance protocols.

FAQs

What is the ETH price prediction for 2025?

As per our Ethereum price forecast 2025, the ETH price could reach a maximum of $9,428.11.

What will Ethereum be in 5 years?

According to our Ethereum Price Prediction 2030, the ETH coin price could reach a maximum of $71,594.69 by 2030.

Is it better to buy Bitcoin or Ethereum?

While Ethereum is trusted for its stout fundamentals, Bitcoin continues to dominate with its widespread adoption.

Will Ethereum Go Back Up?

The $ETH price is expected to go up as the FUD settles and the altcoin season kicks off.

What is Ethereum 2.0?

Ethereum 2.0 is an updated version of the existing Ethereum blockchain, which aims to increase the efficiency, scalability, and speed of the Ethereum network.

Is ETH a good investment?

As the altcoin season begins, the short-term gains make Ethereum a lucrative buying option. However, the long-term promises of this programmable blockchain make it a viable long-term crypto investment. 

How much would the price of Ethereum be in 2040?

As per our Ethereum price prediction 2040, Ethereum could reach a maximum price of $4,128,680.

How much will the ETH coin price be in 2050?

By 2050, a single Ethereum price could go as high as $238,189,500.

ETH
BINANCE

Cardano Price Prediction 2025, 2026 – 2030: Will ADA Price Hit $2?

Cardano Price Prediction

The post Cardano Price Prediction 2025, 2026 – 2030: Will ADA Price Hit $2? appeared first on Coinpedia Fintech News

Story Highlights

  • The live price of the Cardano token is  $ 0.66412299.
  • ADA Price prediction suggests potential to reach $2.05 by year-end 2025.
  • Long-term forecasts indicate ADA could hit $10.25 by 2030.

The Cardano price prediction for 2025 is generating significant buzz in the crypto market, particularly as we have entered Q3 2025 with July. The transformative Plomin Hard Fork, implemented in Q1, has played a crucial role in this momentum, especially with the announcement of full decentralized governance.

This landmark upgrade has reinforced Cardano’s commitment to community-driven innovation, leading to a strengthening of its internal ecosystem. Even bigger institutions like Grayscale have been applauding the project’s vision and gave 1/5th allocation in its fund.

Industry leaders like IOHK and EMURGO are also actively advancing the Cardano ecosystem. EMURGO’s partnership with Ctrl Wallet on July 2, 2025, has enhanced Cardano’s interoperability, enabling connections to over 2,300 blockchains. 

Moreover, community-driven initiatives focusing on scalability, privacy through the Midnight chain, and integration with Bitcoin DeFi are paving the way for substantial growth.

Additionally, Bloomberg analysts have raised odds of potential spot ADA ETF approvals, and strong technical indicators signaling positive trends, investor enthusiasm is at an all-time high. Questions abound: “Will Cardano spearhead the altcoin movement?” and “What heights can ADA reach by 2050?” Explore this Cardano price prediction for 2025 and beyond, filled with expert insights and ambitious forecasts.

Coinpedia’s Cardano Price Prediction 2025

Cardano (ADA) is predicted to reach a potential high of $2.05 in 2025, driven by hopes of ETF approval, full decentralization after the Plomin Hard Fork, and increasing institutional interest. However, if ADA fails to hold above key support, it may range between $0.85 and $1.25.

Cardano Price Today

Cryptocurrency Cardano
Token ADA
Price $0.6641 down -1.95%
Market Cap$ 23,811,770,669.51
24h Volume$ 878,152,462.6427
Circulating Supply35,854,459,397.4189
Total Supply44,994,478,516.77
All-Time High$ 3.0992 on 02 September 2021
All-Time Low$ 0.0174 on 01 October 2017

Cardano Price Prediction November 2025

Cardano Price Prediction November 2025

ADA’s strong 2025 expectations faltered, with Q1-Q3 dominated by a sustained correction that wiped out most prior gains. This decline has forced price action back to a critical juncture. The recent volatility kicked off in Q4, even pushing ADA sharply down to the crucial $0.60 support level.

Despite this, the optimism remains high due to the technical structure as evidenced on ADA price chart the price action has perfectly performed a retest of the support line of a multi-month symmetrical triangle pattern 

This consolidation suggests that the momentum is coiling for a major move. ADA’s immediate fate rests entirely on defending the $0.60 support floor.

That said, a sustained defence of the $0.60 floor and a subsequent breakout above the triangle’s upper resistance could validate the bullish thesis, which could target a significant recovery rally.

For now, November is predicted to be an important month, and $0.85 could be retested; there is also a chance that it might even close above $0.85 on a daily basis in November.

However, if the ADA price dips below the $0.60 level, the symmetrical triangle setup will be invalidated, likely paving the way for a decline toward the long-term low of $0.27.

Cardano Price
Price PredictionPotential Low ($)Average Price ($)Potential High ($)
November 2025$0.25$0.92$1.32

Cardano AI Price Prediction For October 2025

SourceLow PriceAverage PriceHigh Price
Gemini$0.85 – $0.95$1.00 – $1.20$1.30 – $1.50+
BlackBox$0.65$1.00$1.50
ChatGPT$0.75$0.95$1.25

ADA Price Prediction 2025

Cardano has long prioritized decentralization, and the Q1 2025 Plomin hard fork pushed it even further. Unlike many blockchains, Cardano places control in the hands of users rather than central entities. This is evident in CoinCarp’s rich list, where the top 100 addresses hold just 22% of the mainnet supply, which is far less than most altcoins.

ADA Price Prediction 2025

Technically, if ADA price intends for a long-term rally, then a break above the $1.10–$1.20 range, strong retail participation will be key. A major catalyst could be the approval of an ADA ETF, expected by year-end, which could attract billions in inflows. Another would be a global attraction in the sector with BTC continuing northward moves.

Therefore, if ADA holds above its Q1 2025 high, it has a strong chance of retesting the $2.05 mark before the year ends.

ScenarioPotential LowAverage PricePotential High 
Without ETF Approval$0.85$1.10$1.25
With ETF Approval + Retail Surge$1.20$1.65$2.05
Bullish Breakout (with ETF & macro support)$1.50$2.05$2.80

Cardano (ADA) Price Prediction 2026 – 2030

Price PredictionPotential Low ($)Average Price ($)Potential High ($)
20262.753.003.25
20274.504.755.00
20285.255.505.75
20296.757.257.75
20309.009.7510.25

This table, based on historical movements, shows ADA prices to reach $10.25 by 2030 based on compounding market cap each year. This table provides a framework for understanding the potential Cardano price movements. Yet, the actual price will depend on a combination of market dynamics, investor behavior, and external factors influencing the cryptocurrency landscape.

Cardano Price Prediction 2031, 2032, 2033, 2040, 2050

YearPotential Low ($)Potential Average ($)Potential High ($)
203110.5011.0011.25
203213.7514.2514.75
203317.5018.5019.75
204034.2551.7569.25
2050128.25228.75329.50

Based on the historic market sentiments and trend analysis of the altcoin, here are the possible Cardano price targets for the longer time frames.

Market Analysis

Firm Name202520262030
Changelly$0.752$1.18$6.05
Coincodex$0.79$0.53$0.89
Binance$0.79$0.83$1.01

*The aforementioned targets are the average targets set by the respective firms.

Coinpedia’s Price Analysis provides you with the latest content on the recent market trend that enables you to get closer to the price movements & actions of the various cryptocurrencies.

Never Miss a Beat in the Crypto World!

Stay ahead with breaking news, expert analysis, and real-time updates on the latest trends in Bitcoin, altcoins, DeFi, NFTs, and more.

FAQs

How high could Cardano go by the end of 2025?

According to our Cardano price prediction, the altcoin’s price could hit a maximum of $2.05 in 2025. 

What is the price of one ADA token?

At the time of writing, the price of 1 Cardano ADA token was  $ 0.66412299

Is Cardano a good investment in 2025, amidst newer higher-performing entrants?

Cardano is an underrated investment and has a high chance of performing in the next couple of years, considering the plethora of applications.

Is Cardano dead?

Cardano is not dead, as it is witnessing major developmental upgrades, which could boost ADA’s price in the near future. 

Can Cardano overtake Ethereum?

Even the most bullish of Cardano supporters acknowledge that Cardano will only potentially surpass Ethereum within 18 to 20 years.

How much would the price of Cardano be in 2040?

As per our latest ADA price analysis, Cardano could reach a maximum price of $69.33.

How much will the ADA coin price be in 2050?

By 2050, a single Cardano price could go as high as $329.56.

How much is 1 Cardano worth in Canada?

At the time of press, the Cardano price CAD is $0.9141.

Polygon (MATIC) Price Prediction 2025, 2026 – 2030: Will MATIC Price Surge to $1?

Polygon Price Prediction 2025-2030

The post Polygon (MATIC) Price Prediction 2025, 2026 – 2030: Will MATIC Price Surge to $1? appeared first on Coinpedia Fintech News

Story Highlights

  • The live price of the Polygon coin is  $ 0.21819891.
  • POL price predictions for 2025 suggest potential highs of $0.7655.
  • Long-term forecasts indicate POL could reach $4.94 by 2030.

Polygon (POL) has a mind-blowing Layer-2 scaling solution project for Ethereum, which is primarily designed to address slow speeds and the network’s high transaction fees. 

As a result, Polygon is seen as a revolutionary framework for developers and users, as it attracts by offering a more efficient Ethereum experience, which is the reason contributing to POL’s price value, too.

Through, POL, which is its native token (formerly MATIC), is utilized for transaction fees and network governance, in the framework of interconnected Ethereum-compatible blockchain networks. 

Its use case makes it an attractive altcoin, and even its token POL price is attracting attention. The coin is expected to show a surge in the coming sessions, but it would require a technical eye to understand. 

Therefore, if you are curious about whether the POL price can rebound to $1. Will Polygon go up? And is Polygon a good investment? We bring our Polygon Price Prediction for 2025 – 2030 to explore the POL price prediction.

Polygon Price Today

Cryptocurrency Polygon
Token MATIC
Price $0.2182 up 2.88%
Market Cap$ 402,374,198.74
24h Volume$ 1,217,344.7306
Circulating Supply0.00
Total Supply10,000,000,000.00
All-Time High$ 2.92 on 27 December 2021
All-Time Low$ 0.0030 on 10 May 2019

Polygon Price Prediction November 2025 

Polygon price prediction for November 2025 (POL) suggests that a reversal rally could occur soon, as most of the price action seen in 2025 was a consolidation movement within a range-bound border between $0.16 and $0.26. 

Polygon Price Prediction November 2025

Since it has been coiling for many months, price action is critical. The larger the coil, the greater the rally, so November is crucial as it will determine how the year concludes.

Additionally, the $0.26 hurdle is a critical juncture; retesting and breaching it is a key prediction for November. As long as it sustains above $0.26, the target for November would be $0.42.

However, if it fails to retest due to a lack of bullish demand, the consolidation may continue for the remainder of the month.

Polygon Price Chart
MonthPotential Low ($)Potential Average ($)Potential High ($)
Polygon Price Action November 2025$0.10$0.20$0.40

POL Token Analysis 2025

Throughout 2025, the POL token (formerly MATIC) has experienced a significant downfall, with its price declining by more than 60% from an annual high of $0.76. 

This fall was largely influenced by broader macroeconomic shifts, as a result saw its steepest losses in the first half of the year. But the second half of 2025 has marked a change in momentum, as the token has stopped forming new lows. 

The bullish hopes for the third quarter are rising as POL is inching higher with a key pattern’s assistance.

Polygon Price Prediction 2025

The majority of 2025 saw Polygon (POL) consolidate within a defined range. Although a bullish awakening occurred in Q3, pushing the price to a high of $0.29 in mid-September, this moment proved brief. As aggressive profit-taking accelerated from mid-September onward, completely reversing the rally and smashing the price down to the range’s lower border by mid-October. This move places POL at a critical juncture, facing a decisive retest of multi-month support.

This is the third time POL has revisited this support block, following successful bounces in both April and June. The established pattern suggests that every previous touch of this lower border has been met with significant demand, pushing the price back toward the upper range boundary at $0.26. 

Based on this compelling historical examples of this year, the odds are high that POL will stage another reversal in the remaining days of October, aiming to revisit the $0.26 level. Flipping and sustaining a daily close above this upper border would give the bulls the upper hand and allow POL to target higher resistance levels at $0.4220 and potentially $0.5386 before the end of the quarter.

While the probability of a reversal from this historically strong support is high, the market risk cannot be ignored. The current retest represents a high-stakes scenario. Should the critical support fail and the price mark a new swing low, it would invalidate the current consolidation pattern. In this bearish event, the price could accelerate downward, leading to a new yearly low forming well below the $0.1500 mark.

POLUSD Price Chart
YearPotential Low ($)Potential Average ($)Potential High ($)
Polygon Price Action 2025$0.15$0.26$0.53

Polygon Price Prediction 2026 – 2030

YearPotential Low ($)Potential Average ($)Potential High ($)
Polygon Price Action 2026$0.18870$0.47179$0.75488
POL Price Prediction 2027$0.30194$0.75488$1.20782
Polygon Crypto Price Forecast 2028$0.48311$1.20782$1.93252
POL Coin Price Projection 2029$0.77297$1.93252$3.09205
Polygon Price Prediction 2030$1.23676$3.09205$4.94729

This table, based on historical movements, shows POL price to reach $4.94 by 2030 based on compounding market cap each year. This table provides a framework for understanding the potential POL price movements. Yet, the actual price will depend on a combination of market dynamics, investor behavior, and external factors influencing the cryptocurrency landscape.

Polygon Price Action 2026

Anticipating further expansion, MATIC’s potential high for 2026 is projected to be $0.75488, while the potential low is estimated at $0.18870, resulting in an average price of $0.47179.

POL Price Prediction 2027

MATIC crypto can make a potential high of $1.20782 in 2027, with a potential low of $0.30194, leading to an average price of $0.75488.

Polygon Crypto Price Forecast 2028

As the POL price progresses, the potential high price for 2028 is projected to be $1.93252, with a potential low of $0.48311, resulting in an average price of $1.20782.

MATIC Coin Price Projection 2029

Polygon coin price potential high for 2029 could be $3.09205, while a potential low of $0.77297, with an average price of $1.93252.

Polygon Price Prediction 2030

With an established position in the market, POL’s potential high for 2030 is projected to be $4.94729. On the flip side, a potential low of $1.23676 will result in an average price of $3.09205.

Market Analysis

Firm Name202520262030
CoinCodex$ 0.71$ 0.50$ 0.90
Binance$0.24$0.26$0.31
Flitpay$6.25$4$10.4

CoinPedia’s MATIC Price Prediction

Coinpedia’s price prediction for Polygon is bullish, suggesting the MATIC crypto price may reach new swing highs and possibly surpass its all-time high in the near future.

The Polygon Price Forecast 2025 predicts a swing high of $0.47181, with an average price of $0.29488.

YearPotential LowPotential AveragePotential High
2025$0.11795$0.29488$0.47181
Never Miss a Beat in the Crypto World!

Stay ahead with breaking news, expert analysis, and real-time updates on the latest trends in Bitcoin, altcoins, DeFi, NFTs, and more.

FAQs

Is MATIC a good investment?

Yes, it is a profitable investment, but the digital asset should be under due consideration for the long term. 

How high can Polygon MATIC price go by 2025?

According to our MATIC price prediction, the altcoin could reach a maximum of $0.47181 by 2025. With a potential surge, the price could go as high as $4.94731 by 2030.

Is Polygon better than Solana?

While it is not a direct apples-to-apples comparison, as one is a layer-2 and the other is a layer-1.

How high can Polygon MATIC transactions go?

At its best, it can process 65,000 transactions per second.

Why Polygon is faster than Ethereum?

The major functionality of this altcoin is to enable the multichain Ethereum ecosystem. It provides a network that offers interoperability between previous and present infrastructure scenarios of Ethereum.

Can polygon hit $100?

As per our MATIC price prediction, $100 dollars target is possible over the next 18 years.

Has MATIC changed to POL?

Yes, MATIC has been upgraded to POL as the network token for Polygon.

MATIC
BINANCE

Hedera Price Prediction 2025, 2026 – 2030: Will HBAR Price Hit $0.5?

Hedera Price Prediction 2024, 2025-2030

The post Hedera Price Prediction 2025, 2026 – 2030: Will HBAR Price Hit $0.5? appeared first on Coinpedia Fintech News

Story Highlights

  • The live price of Hedera crypto is  $ 0.20506791.
  • Hedera Price prediction highlights HBAR could reach $0.750 by the end of 2025 if bullish trends continue.
  • The Long-term forecasts suggest HBAR could hit $2.20 by 2030, indicating stable growth potential.

Hedera has been making waves in the cryptocurrency space, with a fast and secure blockchain that offers a distinct approach to transaction processing compared to Ethereum and other smart contract chains. It’s permission-only, meaning the blockchain is managed by private companies. Limiting what types of decentralised applications are allowed is what makes Hedera stand out from the rest.

Having entered the top 20 digital assets by market cap in 2024, it is now eyeing a potential leap into the top 10 by the end of 2025. Hedera has also recently ramped up its development activities for its ecosystem. Its ecosystem is strengthening, despite its capped price action. With increasing real-world use cases, institutional interest, and strategic partnerships, many are closely tracking HBAR price chart 2025 to gauge how high the token can rise.

With major companies like Google, IBM, and Chainlink Labs backing the project, and discussions about SEC approved HBAR ETF would flood string liquidity. Many are intrigued that: Will the HBAR Price Reach $1? Let’s discuss this in our Hedera price prediction 2025 article.

Hedera Price Today

Cryptocurrency Hedera
Token HBAR
Price $0.2051 up 14.64%
Market Cap$ 8,710,306,730.66
24h Volume$ 906,994,647.9130
Circulating Supply42,475,229,929.1494
Total Supply50,000,000,000.00
All-Time High$ 0.5701 on 16 September 2021
All-Time Low$ 0.0100 on 02 January 2020

Hedera Price Analysis 2025: A Look Back at HBAR’s Volatile First Half

Hedera price USD began the year on a high note, peaking at $0.40 in mid-January before a steady decline took it to a low of $0.125 in early April. This downturn was caused by external factors and waning investor interest, reflected in a decrease in the Total Value Locked (TVL). 

But this tide turned in the second week of April. As a broader crypto market rally helped HBAR price break free from the wedge, it bounced off a significant support zone that had previously fueled a late 2024 rally. This support, confirmed by the Fixed Range Volume Profile (FRVP) indicator, suggested strong institutional buying interest. The momentum propelled HBAR on a remarkable surge of nearly 80%, from $0.125 to $0.228 by mid-May

Unfortunately, this rebound was cut short by escalating geopolitical tensions, which pushed HBAR back to its April lows by the end of June. During this time, the price formed another parallel declining wedge.

Hedera Price Prediction 2025

Hedera Price Prediction 2025

The second half of the year started strong, with HBAR posting a significant rally in July from the $0.12 to $0.14 demand zone up to $0.30. 

However, this upward move was firmly rejected at a critical resistance point, which strongly aligned with the upper boundary of a descending triangle established since early 2025. 

This rejection fueled a sharp decline throughout August and September, which worsened further with a critical liquidation event on October 10th, momentarily pushing the price below the demand zone to $0.10. 

This dip was quickly absorbed by institutional buyers, leading to a recovery attempt that failed to flip $0.20 psychological resistance, but after a decent consolidation below this hurdle buyers accumulated it and on October 28th it saw an near 20% rise that pushed its price to $0.22, this occurred as the much-anticipated launch of the Canary HBAR ETF (HBR) on Nasdaq opened the doors for institutional investors.

Now, it’s approaching once again the upper border of this multi-month pattern, and odds suggest that if sustained bullish momentum continues, a breakout could occur this time, and November could be the biggest month.

For price to rally, HBAR/USD needs to clear the short-term resistance at $0.24 and aim for $0.30. Once it sustains above $0.30 with a daily close, then the year-end target could be near $0.40. 

Conversely, losing the $0.19 recently formed support would indicate that the major demand is present in the $0.12-$0.13 area. However, losing that support level would also confirm a deeper bearish trend, potentially leading to retreats toward $0.07 and, ultimately, the $0.04 support level.

HBAR Price Prediction November 2025: What’s Next for Hedera?

The HBAR price is rising to test the upper border of the multi-month descending triangle after receiving positive news about the HBAR ETF from Canary. It is retreating in October to the key $0.12–$0.14 demand area after its rally stalled at the multi-month descending triangle resistance near $0.30 in July. 

This upcoming retest is critical because a successful hold could launch a short-term move to $0.30 in November and potentially $0.40 by year-end. Failure to hold the demand $0.19 could pull its price back to $0.12-$0.13 demand area.

HBAR Price Prediction November 2025
MonthPotential LowPotential AveragePotential High
HBAR Price Prediction November 2025$0.125$0.27$0.40

HBAR Price Prediction 2026 – 2030

YearPotential LowPotential AveragePotential High
2026$0.45$0.80$1.05
2027$0.60$0.95$1.20
2028$0.65$1.10$1.40
2029$0.70$1.35$1.60
2030$0.95$1.70$2.20

HBAR Price Prediction 2026

Moving forward to 2026, forecast prices and technical analysis project that Hedera’s price is expected to reach a minimum of $0.45. The price could escalate to $1.05 on the higher end, with an average trading price hovering around $0.80.

HBAR Price Forecast 2027

Looking ahead to 2027, the optimism around Hedera will lead to steady growth. Hence, the HBAR price is forecasted to reach a low of $0.60, with a potential high touching $1.20 and an average forecast price of $0.95.

Hedera Price Forecast 2028

As we advance to 2028, with moderate gains, the HBAR predictions indicate that the price of a single HBAR could reach a minimum of $0.65, with the ceiling potentially rising to $1.40. Within the range, the average price will be $1.10.

HBAR Price Target 2029

By the time 2029 rolls around, it’s predicted that Hedera’s price will maintain its upward trajectory, reaching a minimum of $0.70, with the maximum price possibly reaching $1.60 and an average of $1.35, reflecting cautious optimism.

Hedera Price Prediction 2030

By the end of this decade, HBAR is predicted to touch its lowest price at $0.95, aiming for a high of $1.70 and an average price of $2.20. Hence, the prediction suggests stable long-term growth for Hedera’s market value.

Market Analysis

Firm202520262030
Changelly$0.259$0.370$1.74
priceprediction.net$0.27$0.40$1.99
DigitalCoinPrice$0.43$0.50$1.07

Coinpedia’s Hedera Price Prediction

By the end of 2025, the recovery run in HBAR prices is expected to continue with a gradual rise in momentum. Hence, by the end of 2025, Coinpedia’s HBAR price forecast expects a potential high of $0.80 with a solid support at $0.40, making an average of $0.60.

YearPotential LowPotential AveragePotential High
2025$0.40$0.60$0.80
Never Miss a Beat in the Crypto World!

Stay ahead with breaking news, expert analysis, and real-time updates on the latest trends in Bitcoin, altcoins, DeFi, NFTs, and more.

FAQs

Is HBAR investment a profitable one?

Yes, the stout fundamentals of the network make HBAR a good investment, but for the long term. 

What price can HBAR reach by the end of 2025?

Analysts forecast HBAR could peak at $0.75 by the end of 2025, with averages near $0.40 and lows at $0.15.

How many transactions can Hedera process in one second?

The network can process over 10,000 transactions in one second. 

How high will the HBAR price climb by the end of 2030?

By 2030, HBAR is forecast to reach highs of $2.20, averaging around $1.70 with lows near $0.95.

Where can I trade HBAR?

HBAR is available for trade across leading cryptocurrency exchange platforms such as Binance, Coinbase, Zebpay, etc…

Litecoin LTC Price Prediction 2025, 2026 – 2030: Can Litecoin Reach $1000 Dollars?

Litecoin Price Prediction

The post Litecoin LTC Price Prediction 2025, 2026 – 2030: Can Litecoin Reach $1000 Dollars? appeared first on Coinpedia Fintech News

Story Highlights

  • Litecoin price today  $ 99.77567182
  • Litecoin price may reach a potential high of around $231.21 this year.
  • The LINK price, with a potential surge, could hit $1,755.77 by 2030.

Litecoin has quietly been one of the strongest performers this year. Since January, it has gained traction with growing adoption, solid transaction volume, and renewed investor interest. According to the Litecoin Foundation, over 12% of all Litecoin transactions ever made have occurred in 2025 alone. That’s more than 300 million transactions, making it one of the most-used cryptocurrencies for real-world payments.

The key questions that investors are keen on include: Is it a good time to invest in Litecoin? Or Will Litecoin (LTC) cross $250 in 2025? Such questions put the Litecoin price prediction under the indecisive box. So, let’s head on to the latest Litecoin (LTC) price prediction 2025, 2026 – 2030, and the years between them!

Litecoin Price Today

Cryptocurrency Litecoin
Token LTC
Price $99.7757 down -0.23%
Market Cap$ 7,628,473,906.47
24h Volume$ 873,599,476.4745
Circulating Supply76,456,251.9835
Total Supply84,000,000.00
All-Time High$ 412.9601 on 10 May 2021
All-Time Low$ 1.1137 on 14 January 2015

Can Litecoin Be Halved? When is the Next Litecoin Halving Event?

Yes, Litecoin can be halved, employing a mechanism similar to Bitcoin’s that reduces the block reward by half approximately every four years. The most recent Litecoin halving occurred in August 2023, successfully completing the procedure. The next Litecoin halving event is estimated to take place in July 2027.  

Litecoin Price Chart

Litecoin Price Chart 15-10-25

Litecoin (LTC) is trading near $98.56, sitting well below the 20-day SMA at $109.32. Technicals indicate:

  • Key Support: $89.48 (lower Bollinger Band), recent wick near $55.00
  • Resistance: $109.32 (20-day SMA), $129.15 (upper Bollinger Band)
  • Indicators: RSI at 37.52 shows bearish conditions, with the market approaching oversold levels.

LTC Short-Term Price Prediction

Litecoin Price Prediction for October 2025

Based on the current 4-hour Litecoin price chart, LTC shows consolidation near $97 with resistance at $103 and support around $93.36. The RSI at 43 suggests mild bearish momentum, while Bollinger Bands indicate low volatility before a potential breakout. If market sentiment improves, LTC could retest $110–$121 levels.

Litecoin Price Prediction for October 2025
MonthPotential LowPotential AveragePotential High
October$92$108$128

LTC Price Prediction 2025

Litecoin is a feasible alternative to Bitcoin in all aspects, which makes it attractive to many traders. There’s also growing optimism around a potential Litecoin Spot ETF approval by October 2025. With the CFTC recognizing Litecoin as a commodity, its regulatory standing is clearer, encouraging investor trust. If major financial institutions collaborate with Litecoin, then the price could soar to $231.21 in 2025. 

If the market crashes in the coming years, then the price of Litecoin could drop to $77.07. However, long-term investors are likely to hold on to the currency, so the average price of LTC is expected to be $154.14.

YearPotential LowPotential AveragePotential High
2025$77.07$154.14$231.21

Litecoin Mid-Term Price Prediction

YearPotential Low ($)Potential Average ($)Potential High ($)
2026$115.61$231.21$346.82
2027$173.42$346.82$520.23

LTC Price Prediction 2026

By 2026, LTC’s potential low price could be $115.61, with an average price projected at $231.21, and a high price of $346.82.

Litecoin Price Analysis 2027

In 2027, Litecoin is forecasted to potentially reach a low price of $173.42, an average price of $346.82, and a high price of $520.23.

Litecoin Long-Term Price Prediction

YearPotential Low ($)Potential Average ($)Potential High ($)
2028$260.13$520.23$780.34
2029$390.20$780.34$1,170.51
2030$585.30$1,170.51$1,755.77

LTC Price Prediction 2028

Moving into 2028, the potential low price for Litecoin using price prediction will be $260.13, while the average price is expected to be around $520.23. The potential high price for LTC in 2028 is estimated to reach $780.34.

Litecoin Price Forecast 2029

Looking ahead to 2029, Litecoin has the potential to reach a low price of $390.20, an average price of $780.34, and a high price of $1,170.51.

Litecoin Price Prediction 2030

Finally, in 2030, Litecoin price prediction anticipates a low price of $585.30, an average price of $1,170.51, and a high price of $1,755.77.

Litecoin Market Analysis

Firm Name202520262030
Wallet Investor$110.74$94.44
priceprediction.net$209.82$310.85$1,441
DigitalCoinPrice$290.04$412.95$857.18

*The targets above are the average targets set by the respective firms.

CoinPedia’s Litecoin Price Prediction

According to CoinPedia’s formulated Litecoin price prediction, several well-known institutions may invest in and accept LTC as payment in the future. Moreover, the increasing number of events that can directly affect the LTC price will improve social sentiment.

If the coin gains some hype in the coming months, then the LTC price can hit $231.21 in 2025. However, a rise in bearish influence can drop Litecoin to $77.07 by the end of 2025.

YearPotential LowPotential AveragePotential High
2025$77.07$154.14$231.21
Never Miss a Beat in the Crypto World!

Stay ahead with breaking news, expert analysis, and real-time updates on the latest trends in Bitcoin, altcoins, DeFi, NFTs, and more.

FAQs

How high can the Litecoin price go by the end of 2025?

The price of LTC could possibly reach its maximum of $231.21 this year.

What could be the maximum trading price of Litecoin by the end of 2030?

With a potential surge, the price of Litecoin may reach a maximum trading price of $1,755.77 during the year 2030.

Is Litecoin a good investment?

Yes, Litecoin can be a good investment option if you are considering it for the long term.

Can Litecoin be halved? When is the next Litecoin halving event taking place?

Yes, Litecoin can be halved, it was in August 2023 when it had completed the halving procedure. The next LTC halving event will take place in July of 2027.

How to buy Litecoin?

Litecoin can be traded across exchanges like Binance, Bitrue, Coinbase Pro, OKEx, and HitBTC, amongst others.

Polkadot Price Prediction 2025, 2026 – 2030: Will DOT Price Cross $10?

Polkadot Price Prediction

The post Polkadot Price Prediction 2025, 2026 – 2030: Will DOT Price Cross $10? appeared first on Coinpedia Fintech News

Story Highlights

  • The live price of the Polkadot crypto token is  $ 3.12209908.
  • Polkadot price can reach a maximum of $10.40 in 2025.
  • DOT price is expected to approach its $78.98 mark by the year 2030.

Polkadot began with a bold goal, to bring blockchains together. In 2025, that goal is being realized in new ways. Now ranked 28th by market cap with over $5.1 billion, DOT is showing signs of renewed momentum.

Polkadot is entering a transformative phase in 2025. Between August 11 and 18, 2.3 million DOT tokens worth $9.41 million, about 0.15% of the total supply, were released. This event could add short-term selling pressure. Despite this, the network is thriving. TokenTerminal data shows monthly active users are near record highs.

So, where could DOT go from here? This Polkadot price prediction dives into key catalysts, expert forecasts, and whether 2025 could be the year DOT finally breaks out.

Polkadot Price Today

Cryptocurrency Polkadot
Token DOT
Price $3.1221 down -2.65%
Market Cap$ 5,088,208,861.13
24h Volume$ 203,842,629.7934
Circulating Supply1,629,739,714.0694
Total Supply1,629,739,714.0694
All-Time High$ 55.0050 on 04 November 2021
All-Time Low$ 1.4104 on 10 October 2025

Polkadot Price Chart

DOT price chart- -

Technical Analysis

  • Polkadot (DOT) trades near $3.14 after recent selling pressure.​
  • Key support sits at $3.00, resistance is at $3.86 and $4.28.​​
  • Price remains below the 50-day SMA ($3.95) and 200-day SMA ($4.28), confirming a bearish short-term setup.​​
  • RSI is 34.7, suggesting sellers still control momentum, but levels are approaching oversold territory.​​
  • MACD is bearish, backing continued downside momentum.​​
  • Short-term outlook remains bearish, until support holds and buying interest returns.

Polkadot Short-Term Price Prediction

Polkadot Price Prediction 2025

Polkadot 2.0 went live on August 6, 2025 bringing elastic scaling and upgraded cross-chain communication, giving more flexibility to parachains. The upgrade also moves toward full EVM compatibility, set to be complete by year-end. 

Data reveals the network is active and stable, with over 50% of DOT’s supply staked. While it has not been in the spotlight during the recent altcoin surge, its strong staking rate and expanding ecosystem position it well for a possible breakout when sentiment turns positive.

Polkadot (DOT) could surge to $10.4 by late 2025, with a potential low of $3.47 and an average price of $6.93.

YearPotential LowPotential AveragePotential High
2025$3.47$6.93$10.4

Also, read Binance Price Prediction 2025, 2026-2030!

DOT Mid-Term Price Targets

YearPotential Low ($)Potential Average ($)Potential High ($)
20265.2010.4015.60
20277.8015.6023.40

DOT Coin Price Prediction 2026

Like Bitcoin’s, broader crypto market conditions and coin price movements still drive much of the overall token price. However, Polkadot’s price for 2026 is projected to range between $5.20 and $15.60, with an average price of $10.40.

Polkadot Price Forecast 2027

Progress made in the Polkadot ecosystem of complementary blockchains, enabling seamless interoperability, will increase the token price. Hence, the Polkadot price forecast for 2027 is projected to range between $7.80 and $23.40, with an average price of $15.60.

Polkadot Long-Term Price Prediction

YearPotential Low ($)Potential Average ($)Potential High ($)
202811.7023.4035.10
202917.5535.1052.65
203026.3352.6578.98

DOT Price Analysis 2028

The growth of built applications, smart contracts usage, and overall transaction activity on the Polkadot network will fuel the token price. Further, DOT crypto price prediction for 2028 is projected to range between $11.70 and $35.10, with an average price of $23.40.

DOT Coin Price Prediction 2029

Polkadot’s price for 2029 is projected to range between $17.55 and $52.65, with an average price of $35.10.

Polkadot Price Prediction 2030 

Polkadot’s price for 2030 is projected to range between $26.33 and $78.98, with an average price of $52.65.

Market Analysis

Firm Name202520262030
Wallet Investor$10.23$11.025
priceprediction.net$6.03$8.59$42.60
DigitalCoinPrice$20.71$29.01$58.88
VanEck$36.36

*The targets mentioned above are the average targets set by the respective firms.

CoinPedia’s DOT Price Prediction

Polkadot might receive notable impetus from its new parachains, as the industry has seen with Moonbeam. If the digital asset receives the much-needed sentimental boost from the investors, then the DOT prices will reach $10.40 in 2025.

On the flip side, if the sentiments of marketers fall prey to bearish trends. The Polkadot coin price could take a downswing to $3.47.

Coinpedia’s DOT Price Prediction expects the DOT coin price to reach $6.93 in 2025.

YearPotential LowPotential AveragePotential High
2025$3.47$6.93$10.40

Also, Check Out: UniSwap Price Prediction 2025, 2026-2030: Will UNI Coin Price Record New Yearly High Soon?

Never Miss a Beat in the Crypto World!

Stay ahead with breaking news, expert analysis, and real-time updates on the latest trends in Bitcoin, altcoins, DeFi, NFTs, and more.

FAQs

What is the current price of the Polkadot (DOT) token?

At the time of writing, the price of one DOT token was  $ 3.12209908.

Is Polkadot a good investment in 2025?  

Yes, Polkadot shows strong 2025 potential with upgrades, staking, and ETF buzz boosting investor appeal.

How high can the Polkadot price go by the end of 2025?

According to our Polkadot price prediction. If the bulls take charge, the price of DOT could reach $10.4 in 2025.

What will be the maximum price of Polkadot coin by the year 2030?

With a potential surge, the altcoin could achieve a high of $79 during the year 2030.

Is DOT an ERC-20 token?

No, DOT is not an ERC-20 token but a digital asset built and developed on the Polkadot blockchain.

How to buy DOT?

DOT is available for trade on leading cryptocurrency exchanges like  Binance, FTX, Huobi, and Kraken, amongst others.

Has Polkadot 2.0 been released?

Polkadot 2.0 isn’t live yet, mainnet launch expected in Aug–Sep 2025.

Zcash Price Prediction 2025, 2026 – 2030: Is ZEC A Good Investment?

Zcash Price Prediction

The post Zcash Price Prediction 2025, 2026 – 2030: Is ZEC A Good Investment? appeared first on Coinpedia Fintech News

Story Highlights

  • The live price of the Zcash token is  $ 358.14734673
  • The average price target for 2025 is $317.74, with highs possibly stretching to $526.61.
  • By 2030, the ZEC price could surge toward $1,648.05 if adoption and privacy narratives strengthen.

Zcash is a privacy-focused cryptocurrency project that prioritizes anonymity and financial security through zk-SNARK zero-knowledge proof technology. Unlike networks like Bitcoin and Ethereum, ZEC transactions can be shielded, keeping details such as sender, receiver, and transaction amount private, while still validating activity on a public blockchain.

Launched in 2016 from Bitcoin’s codebase, ZEC offers both transparent transactions similar to Bitcoin and fully private transactions. This dual-mode system makes ZEC unique in the privacy coin sector, giving users the choice of compliance-friendly transparency or robust confidentiality.

With increasing debates around financial surveillance, CBDCs, and the balance between freedom and regulation, ZEC has re-emerged as a hedge against regulatory overreach. Keen on hodling ZEC tokens, but worried about its long-term growth? Read this ZCash price prediction 2025-2030.

Zcash Price Today

Cryptocurrency Zcash
Token ZEC
Price $358.1473 up 16.18%
Market Cap$ 5,831,459,916.87
24h Volume$ 1,518,177,867.8175
Circulating Supply16,282,292.6655
Total Supply16,282,292.6655
All-Time High$ 5,941.7998 on 29 October 2016
All-Time Low$ 15.9691 on 05 July 2024

ZCash Price Chart

ZEC price chart

Technical Analysis

Zcash (ZEC) is trading at $348.21, rallying strongly above the 20-day SMA at $253.94. Technicals indicate:

  • Key Support: $174.67 (lower Bollinger Band), $333.21 (recent breakout zone)
  • Resistance: $333.21 (upper Bollinger Band), $359.90 (recent high)
  • Indicators: RSI at 73.96 signals overbought territory, suggesting caution for continued upside.

ZCash Short-Term Price Prediction

ZEC Price Prediction 2025

Zcash shows strong institutional momentum with Grayscale’s Zcash Trust launch and Hyperliquid’s leveraged ZEC futures spiking volumes to $1.28B. Despite a bearish long/short ratio at 0.74, spot market participation remains vital to sustain gains. Privacy demand fuels ZEC’s rise alongside Monero and Dash amid CBDC debates, though only 20% supply is shielded. That being said, ZEC’s 2025 price is forecast between $108.87 and $526.61, averaging $317.74.

YearPotential Low ($)Potential Average ($)Potential High ($)
2025108.87317.74526.61

Also Read: Monero (XMR) Price Prediction 2025, 2026-2030

ZEC Mid-Term Price Prediction

YearPotential Low ($)Potential Average ($)Potential High ($)
2026163.31326.61689.92
2027244.96489.92734.88

ZCash Price Forecast 2026

In 2026, ZEC could range between $163.31 and $689.92, with an average price near $326.61. Growth would depend on derivatives markets stabilizing and shielded adoption rising.

ZEC Crypto Price Analysis for 2027

By 2027, ZEC’s potential average price could touch $489.92, with a floor near $244.96 and a bullish ceiling at $734.88. Regulatory battles, particularly in the EU, may create turbulence, but increasing decentralization efforts may offset risks.

ZCash Long-Term Price Prediction

YearPotential Low ($)Potential Average ($)Potential High ($)
2028367.44734.881102.32
2029551.161102.321653.48
2030824.021648.052472.07

ZCash Price Prediction 2028

Assuming steady user adoption, ZEC could average $734.88 in 2028, trading between $367.44 and $1,102.32. If more of ZEC’s circulating supply becomes shielded, demand may accelerate.

ZEC Price Outlook for 2029

In 2029, ZEC might consolidate around $1,102.32, with lows near $551.16 and highs at $1,653.48. Growing concerns over CBDCs and surveillance could make privacy assets a mainstream hedge.

ZEC Price Prediction 2030

Looking to 2030, ZEC could average $1,648.05, climbing from lows of $824.02 to highs of $2,472.07. If ZEC survives regulatory headwinds and proves indispensable in financial privacy, this decade could mark its strongest adoption cycle.

CoinPedia’s Zcash Price Prediction

Considering the growing Zcash network upgrade and the upcoming announcement, CoinPedia’s formulated a ZEC price prediction. The price might reach $526.61 mark by the end of 2025.

If the network fails to execute its plan, then the price can flip into a bearish trap and dip below $108.87. Considering the everyday buy and sell pressure, and keeping the above factors in mind. The average price by the end of 2025 would be around $317.74.

YearPotential Low ($)Potential Average ($)Potential High ($)
2025108.87317.74526.61

Also Read: Ethereum Price Prediction 2025, 2026-2030

What Does The Market Say?

First Name202520262030
DigitalCoinPrice$326$385$1110
priceprediction.net$212$331$1054
CoinCodex$219$296$993

*The targets mentioned above are the average targets set by the respective firms.

Never Miss a Beat in the Crypto World!

Stay ahead with breaking news, expert analysis, and real-time updates on the latest trends in Bitcoin, altcoins, DeFi, NFTs, and more.

FAQs

What is the Zcash price prediction in 2025?

Based on anticipated network progress, the Zcash (ZEC) price prediction for 2025 ranges widely, with a potential high between $108 and $526 and an average expected price of around $317.

How much will Zcash be worth in 2030?

We are optimistic about the long-term potential, the ZEC token could trade for well over $2472 by 2030.

What factors influence Zcash’s future price?

Price depends on network upgrades, cross-chain adoption, overall crypto market trends, investor sentiment, and regulatory developments.

Is Zcash a good long-term investment?

Zcash offers strong privacy tech and capped supply, making it appealing for long-term holders, though volatility and regulatory risks remain.

Ripple XRP Price Prediction 2025, 2026-2030: Will XRP Reach $5?

Ripple XRP Price Prediction

The post Ripple XRP Price Prediction 2025, 2026-2030: Will XRP Reach $5? appeared first on Coinpedia Fintech News

Story Highlights

  • The Live Price Of XRP  $ 2.61804229
  • Predictions suggest XRP could reach $5.05 by the end of 2025.
  • Long-term projections show XRP could hit $26.50 by 2030 and $526 by 2050.

XRP price currently stands at $2.99, with a market capitalization of $179.79 billion. Analysts and AI forecasts alike suggest that XRP could reach $5.05 by the end of 2025. Long-term XRP price predictions also place it as high as $26.50 by 2030, with an ultra-bullish target of $526 by 2050.

Ripple (XRP) remains one of the top five crypto assets in the world, gaining traction as institutional adoption ramps up and its prolonged legal battle approaches resolution. Since President Trump’s return to office, XRP has seen a resurgence in on-chain activity, investor sentiment, and speculation around potential ETF approval.

In July 2025, XRP marked a new all-time high of $3.66, coinciding with the ProShares Ultra XRP ETF launch. As more asset managers have filed for the ETF approval race, the crypto community is now asking: How high can XRP go?

XRP Price Today

Cryptocurrency XRP
Token XRP
Price $2.6180 down -0.47%
Market Cap$ 157,127,775,692.44
24h Volume$ 4,476,366,643.2068
Circulating Supply60,017,279,517.00
Total Supply99,985,778,283.00
All-Time High$ 3.8419 on 04 January 2018
All-Time Low$ 0.0028 on 07 July 2014

XRP Price Prediction For November 2025

October began with a sharp decline in XRP price USD to $1.75, which invalidated the descending triangle pattern. This drop was triggered by an unexpected announcement from Donald Trump regarding 100% tariffs on China.

However, institutional funds quickly stepped in, viewing it as a blue chip investment, which led to a strong recovery on XRP price chart, bringing the price back up to $2.49 by October 11th. The XRP price then stabilized around the $2.40 area for a few days, and by the end of October, it was attempting to recover its previous range of $2.70-$2.75.

Also, on October 29th, an important news event is anticipated, with a higher probability of a 0.25% basis point rate cut. If this occurs, November could see prices break above $3.00. Conversely, if the momentum fails and the price declines again, a breakdown may become inevitable.

XRP Price Prediction November 2025
MonthPotential LowPotential AveragePotential High
October 2025$1.50$3.00$4.00

XRP Price Predictions for October 2025 by AI Platforms

PlatformLow PriceAverage PriceHigh Price
Claude$3.00 – $3.15$3.50 – $4.00$7.50 – $8.20
Blackbox$2.50$3.50$5.00
Gemini$3.00 – $4.00$4.50 – $6.00$6.50 – $8.00+

XRP Price Prediction 2025

XRP initiated a strong rally after breaking a multi-month falling wedge, peaking at $3.66 in July. However, the subsequent correction formed a short-term descending triangle that ultimately failed to hold crucial support.

This support failed due to geopolitical news, which triggered a massive liquidation event, causing a swift 40% crash from the triangle’s base, driving XRP to a $1.75 low and invalidating the short-term structure. 

But, at this event, the Institutional funds viewed the XRP dip as an opportunity, accumulating the asset and catalyzing a quick bounce back above $2.40 by mid-October. This crash appears to have been a significant liquidity sweep, clearing out overleveraged traders.

The XRP crypto’s current technical outlook indicates that it is currently defending a critical long-term trendline of support that originates from the April lows. This maintains the integrity of the long-term falling wedge breakout, which now hinges entirely on this trendline holding.

Additionally, the XRP price is currently approaching the $2.70-$2.75 zone, which it lost during the October bearish fall. However, for an upward momentum to resume, the XRP price in USD must regain and sustain the $2.70–$2.75 zone, which acts as a pivotal resistance-to-support level. The XRP price forecast for 2025 suggests that a success here could confirm the end of the correction, opening the path for a retest of the $3.66 high and establishing a potential Q4 target of $5.00.

XRP Price Prediction 2025

However, the XRP price analysis for 2025 also indicates a crucial downside risk, as a failure of the current long-term trendline support could signal the full structural failure of the bullish thesis. Such a breakdown would initiate a sharp downward acceleration toward deeper support levels.

YearPotential LowPotential AveragePotential High
2025$2.05$3.45$5.05

XRP Price Analysis 2025 : Onchain Outlook

The XRP Ledger: DEX Transaction Count chart indicates a significant bullish divergence starting from May 2025. While the price is consolidating, the activity in decentralised exchanges (DEX) is increasing sharply.

The high transaction volume, which includes both orders placed and cancelled, shows that experienced traders are actively positioning themselves and adding liquidity in anticipation of a future price movement.

XRP Price Analysis 2025 Onchain Outlook

As a result, this on-chain metric suggests that the market is preparing for a powerful and sustainable rally in the XRP price.

Ripple XRP Price Prediction 2026 – 2030

YearPotential Low ($)Potential Average ($)Potential High ($)
XRP Price Prediction 20265.506.258.50
Ripple Price Prediction 20277.009.013.25
XRP Price Prediction 202811.2513.7516.00
XRP Price Prediction 202914.2516.5021.50
XRP Price Prediction 203017.0019.7526.50

This table, based on historical movements, shows XRP price prediction 2030 to reach $26.50 based on compounding market cap each year. This table provides a framework for understanding the potential XRP price movements. Yet, the actual price will depend on a combination of market dynamics, investor behavior, and external factors influencing the cryptocurrency landscape.

Ripple (XRP) Price Projection 2031, 2032, 2033, 2040, 2050

Based on historic price sentiments and XRP’s rising popularity, here are the XRP future price projections beyond 2030, where Ripple price forecasts suggest that it has become more speculative. Therefore, assuming continued adoption and dominance, XRP may see aggressive valuations in the decades ahead.

YearPotential Low ($)Potential Average ($)Potential High ($)
203125.0029.5035.25
203231.5036.7541.25
203335.7542.2547.75
204097.50135.50179.00
2050219.25331.50526.00

A look at this table, highlights the XRP price prediction 2040 and XRP price prediction 2050 potential high ambitious targets but this reflect a transformative vision for XRP as a dominant global payment player.

Market Analysis

Firm Name202520262030
Changelly$2.05$3.49$17.76
Coincodex$2.38$1.83$1.66
Binance$2.16$2.27$2.76

Institutions XRP Price Target For 2025

Name2025
Standard Chartered$5.50
Sistine Research$33 to $50
Never Miss a Beat in the Crypto World!

Stay ahead with breaking news, expert analysis, and real-time updates on the latest trends in Bitcoin, altcoins, DeFi, NFTs, and more.

FAQs

How much will XRP reach in 2025?

Analysts and AI forecasts project XRP could reach $5.05 by the end of 2025, driven by ETF approvals, partnerships, and regulatory clarity.

How much will 1 XRP be worth in 2030?

Based on compounding growth and adoption, projections estimate XRP could trade around $26.50 by 2030, with averages near $19.75.

What is the highest XRP can go?

The highest speculative target is $526 by 2050, though nearer-term all-time highs (~$3.66) and 2025 targets (~$5.05) are more grounded in current trends.

Can XRP make you a millionaire?

Hypothetically, yes—if XRP reaches $500+ and an investor holds a significant amount (e.g., 2,000 XRP). However, this is speculative and depends on extreme long-term growth.

Is XRP a Good Investment?

XRP is considered a strong investment due to its institutional adoption, regulatory progress, and role in cross-border payments. However, it carries volatility risks like all cryptocurrencies.

Ondo Price Prediction 2025, 2026 – 2030: Can Ondo Hit $10?

Ondo Price Prediction 2024 - 2030: Will ONDO Price Hit $1?

The post Ondo Price Prediction 2025, 2026 – 2030: Can Ondo Hit $10? appeared first on Coinpedia Fintech News

Story Highlights

  • The live price of Ondo Price is  $ 0.74939085
  • Ondo price could reach a high of $0.80 to $2.05.
  • With a potential surge, Ondo crypto price may hit $9.30 by 2030.

ONDO Finance in the RWA sector is a hot topic, investors are closely eyeing its future potential. Especially as its native token ONDO continues to build credibility and momentum through high-profile developments.

Moreover, Ondo Finance is known to be a leading RWA provider on the Solana chain and it is witnessing growing institutional interest, ONDO has solidified itself as a major player in the Real World Asset (RWA) space.

With such attraction, ONDO price prediction 2025 is what analysts and retail investors are intrigued about. But how far can it go from here? Let’s dive into the detailed ONDO price forecast from 2025 to 2030.

Ondo Price Today

Cryptocurrency Ondo
Token ONDO
Price $0.7494 up 0.83%
Market Cap$ 2,367,406,273.63
24h Volume$ 113,780,778.3264
Circulating Supply3,159,107,529.00
Total Supply10,000,000,000.00
All-Time High$ 2.1413 on 16 December 2024
All-Time Low$ 0.0835 on 18 January 2024

ONDO Price Analysis 2025

The biggest rise in the ONDO price was when Donald Trump won the election last year, hitting $2.148 by mid-December on Coinbase. Since then, it has continuously declined, and by April 2024, it fell to a low of $0.70.

In the entire Q2, it has seen its price action trapped in a range, despite being a leading performer in tokenized RWA’s based on Coingecko’s report that came in June 2025.

In Q2, many were anticipating that this altcoin could at least gain like last year’s first half movement, but met with a strong supply level by mid-May and declined. 

By the third week of June, it fell 35% from the mid-May high, hitting $0.61, due to geopolitical uncertainty. The H1 closed negatively, but ceasefire news between the US, Israel, and Iran gave relief to investors, and they turned their hopes to H2.

ONDO Price Targets November 2025

The price action for ONDO throughout 2025 has been defined by a deep consolidation box, firmly capped by the $1.10 resistance. Quarters two and three proved to be no different, maintaining the tight range, yet a pattern of deliberate liquidity hunting has been the dominant theme.

The token has consistently targeted the $0.70 support area, using it as a repeated point of leverage to trigger retail stop-losses. This ‘shakeout’ maneuver was seen clearly in April and June, but it intensified in October, culminating in the largest liquidation event of the year. This aggressive dip drove ONDO down to $0.60.

Crucially, the subsequent immediate recovery by the bulls that pushed ONDO straight back above the $0.70 support strongly reinforces the thesis. It seems this was not a genuine breakdown, but a strategic move to clean out weak hands before a major rally. This pattern frequently precedes when a significant upward expansion is about to come.

The decisive moment seems like it is now here, as October is about to end with an important key event which is a fed rate cut of 0.25% basis point. This could be a catalyst where it could retest the $1.10 range’s upper border.

For ONDO to enter its next phase of price discovery, the $1.10 resistance must be flipped and held with conviction. If bulls can sustain a close above $1.10 in November, establishing it as new support, the path could open rapidly to targets at $1.50 and potentially as high as $2.10 before the year is complete. 

However, the failure to break the $1.10 ceiling will prolong the accumulation phase and risks another deep retest of the lower support levels.

ONDO Price Chart
MonthPotential LowPotential AveragePotential High
ONDO Price November 2025$0.80$1.00$1.29

ONDO Price Prediction 2025

ONDO Price Prediction 2025

Looking at the broader, long-term chart for ONDO, there’s a significant observation on the weekly chart that firmly indicates that the longer a price consolidates, the more powerful the eventual breakout tends to be. This was clearly demonstrated by ONDO’s price action in 2024, and the weekly chart also confirms the strength of its key support levels.

Similarly, this technical setup, combined with growing fundamentals, clearly paints an optimistic picture for ONDO crypto. The increase in institutional collaborations and retail adoption, along with favorable external market factors, is bolstering the current momentum.

Bullish Scenario: If this positive pressure continues, and ONDO can achieve a daily close above the $1.16 resistance level in Q4, it could pave the way for a retest of $2.10 by year-end.

Bearish Scenario: However, if the multi-month support at $0.80 is breached, ONDO could find its next supports at $0.66 and $0.45, where new buying interest could emerge.

YearPotential LowPotential AveragePotential High
2025$0.80$1.20$2.10

ONDO Price Analysis: Onchain Outlook

The on-chain data indicates that although the price is currently capped and has been consolidating for several months, the on-chain metrics have strengthened significantly despite the weak ONDO price action. 

Since January 2024, the number of confirmed transactions sent to a project’s contracts has increased. By October 2025, the project had surpassed 1.2 million transactions, making it the second-largest project for real-world asset (RWA) issuance after BitGo.

ONDO On Chain Data

Additionally, the Ondo TVL (Total Value Locked) metric indicates that the total USD value of outstanding tokens across Ondo’s tokenized yield product has reached an all-time high of $1.4 billion. This suggests that adoption is increasing, as well as the influx of funds into ONDO at a favorable rate.

ONDO Cryptocurrency Price Target 2026 – 2030

YearPotential Low ($)Potential Average ($)Potential High ($)
20261.652.754.15
20272.203.655.25
20282.954.306.90
20294.755.608.45
20305.357.459.30

Ondo Coin Future Forecast 2026

The price projection of ONDO crypto for 2026 could range between $1.65 to $4.15, with an average trading price of roughly $2.75.

Ondo Token Price Prediction 2027

This altcoin could hit a potential high of $5.25 in 2027, with a potential low of $2.20, and an average price of $3.65.

ONDO Price Prediction Next Bullrun 2028

By 2028, forecasts indicate a potential low of $2.95 and a high of $6.90. This could bring the average price to $4.30.

Ondo Price Forecast Long-term 2029

During 2029, the price of the Ondo token is anticipated to reach a minimum of $4.75, with a maximum of $8.45, and an average price of $5.60.

ONDO Coin Price Growth Potential 2030

ONDO coin price may reach a high of $9.30 in 2030. With a potential low of $5.35. With this, the average price could settle at around $7.45.

Market Analysis

Firm Name202520262030
Changelly$1.32$1.87$8.26
priceprediction.net$1.34$2.03$8.43
DigitalCoinPrice$2.01$2.29$5.01

CoinPedia’s Ondo Price Targets

CoinPedia’s price prediction for Ondo is extremely volatile. This is due to this altcoin’s highly fidgety nature. If the crypto market successfully regains momentum, this ETH-based token may surge toward a new high.

With this, the Ondo Price Prediction for this year could range between $3.05 as its high and $1.19 as its potential low.

We expect the Ondo Price to reach $3.05 in 2025.

YearPotential LowPotential AveragePotential High
2025$1.19$2.12$3.05

Also read, Arbitrum Price Prediction 2025, 2026 – 2030!

Never Miss a Beat in the Crypto World!

Stay ahead with breaking news, expert analysis, and real-time updates on the latest trends in Bitcoin, altcoins, DeFi, NFTs, and more.

FAQs

How much is Ondo crypto worth today?

At the time of writing, the price of the Ondo token was  $ 0.74939085.

What is ondo in crypto?

Ondo project is a Decentralized Financial (DeFi) platform. It is known to offer risk-isolated, fixed-yield loans backed by yield-generating cryptocurrency assets.

Where is the Ondo coin listed?

The token is available for buying and selling on all the major centralized exchange platforms.

Can Ondo reach $100?

For the Ondo token to reach $100, it will require a surge of 9800.99% from its current valuation.

How to buy Ondo crypto?

One can buy, hold, or sell Ondo crypto tokens by creating a wallet on a centralized cryptocurrency exchange.

When was Ondo Crypto launched?

The project made its presence in 2021. However, its native token “ONDO” made its first appearance in 2024.

Will the ONDO price increase?

With a potential surge, this altcoin may record a high of $11.75 during 2030 with an average trading price of $9.30.

MYX Finance Price Prediction 2025 – 2030: Can MYX Sustain Its Explosive Growth?

Price Prediction myx finance

The post MYX Finance Price Prediction 2025 – 2030: Can MYX Sustain Its Explosive Growth? appeared first on Coinpedia Fintech News

Story Highlights

  • The Live Price Of MYX Is  $ 2.88667526
  • With innovation in cross-chain derivatives and rising on-chain activity, MYX could reach $26 by 2025 and up to $50 by 2030 if momentum continues.
  • MYX surged over 20,000% from June lows to September highs, making it one of the year’s best performers.

MYX Finance (MYX) has emerged as one of 2025’s most remarkable tokens, by delivering parabolic gains in just a matter of months. From trading under $0.05 in June to reaching a new all-time high above $19 in September, MYX has quickly become one of the year’s top performers in the DeFi space.

This meteoric rise has raised the question in the community: Can MYX maintain its momentum, or is the token due for a much deeper correction? 

As its decentralized futures exchange is surging in activity by offering advanced cross-chain derivatives trading, MYX is positioning itself as a next-generation platform within decentralized finance. In this article, we’ll explore the fundamentals of MYX Finance, analyze recent market performance, and provide a detailed MYX price prediction 2025 to 2030.

MYX Finance Price Today

Cryptocurrency MYX Finance
Token MYX
Price $2.8867 down -1.82%
Market Cap$ 594,959,427.92
24h Volume$ 37,718,216.7450
Circulating Supply206,105,423.70
Total Supply1,000,000,000.00
All-Time High$ 19.0135 on 11 September 2025
All-Time Low$ 0.0467 on 19 June 2025

What is MYX Finance?

MYX Finance is known as a decentralized futures exchange designed to make derivatives trading more accessible, efficient, and user-friendly to the people who want’s to trade. 

Unlike other traditional platforms, MYX incorporates a uniquely brought Chain-Abstracted Wallet that allows traders to move seamlessly across blockchains without manual bridging. 

Its simplicity has an innovative two-layer account model that ensures users maintain custody of funds while enabling gasless transactions through a relayer network.

The another highlights that makes MYX more attractive is that this exchange supports leverage of up to 50x with zero slippage, powered by its matching pool mechanism. This enhances efficiency and reduces trading risks. 

As a reason why, in September, high-profile token listings happened, such as WLFI. This listing in particular have expanded the platform’s ecosystem and drawn more liquidity into the protocol.

Fundamental Growth and Ecosystem Strength

With the recent October crash, many are thinking MYX is done for, but it’s the exact opposite because the price action might not be supporting now due to macro factors, but fundamentals have never been better.

As MYX Finance’s explosive growth is firmly rooted in robust on-chain fundamentals, moving beyond mere speculation. The platform has demonstrated consistent and significant expansion in user activity, evidenced by its surging monthly trading volume. This volume more than doubled during the year, climbing from $51 billion in January 2025 to $106.39 billion by the mid of october.

Also, Earnings have more than doubled in the same period, jumping from $18 million to $46.432 million.

MYX Finance On Chain Data

Similarly, Total Value Locked (TVL) has seen explosive growth, climbing from $7.4 million at the start of the year to near $58 million by September. This trajectory demonstrates increasing trust and adoption, with new listings playing a significant role in accelerating growth.

If this momentum continues, MYX Finance could regain its lost levels once it regains macro support.

MYX Price Prediction 2025

MYX Finance experienced a truly explosive second half of 2025. Following a multi-month period of consolidation, the token initiated its initial breakout in August, successfully establishing a foothold above the crucial $2 level. 

This momentum accelerated dramatically in September, driven by a sector-wide surge across exchange tokens. What followed was a near-parabolic rally that culminated in MYX setting a staggering all-time high (ATH) of $19.90 on September 11th, marking a historic period of price discovery.

However, After the ATH, a sustained period of profit-taking saw MYX consolidate in a broad, yet heavily contested, range between $8 and $19. This period of distribution was violently settled on October 10th-11th when a catastrophic, market-wide liquidation cascade wiped out billions in leveraged long positions.

MYX Price Chart

This brutal shakeout decimated investor accounts and pushed the MYX token back to square one at $1.40. The over 90% decline from the top range effectively served to fill the entirety of the September price action gap, leading many to label the move as a major pump-and-dump cycle.

Despite the seismic volatility, the bulls have since shown remarkable resilience, successfully reclaimed their position near $2.80 to $3 after the crash to $1.40, but then price action underwent a sideways range. This suggests that a renewed demand zone is forming post-shakeout, and this range could serve as a new accumulation point for bulls. 

The immediate trajectory for MYX is clear: a sustained push higher through the remainder of November will see the token retest the key resistance pivot at $9, but before that $ the 4.40 and $6.40 hurdles need to be clear first. With a sustained momentum, if MYX price flips that level, it would unlock a clear path toward revisiting the prior ATH zone of $19 by year-end. 

Conversely, a failure to hold current demand will inevitably push MYX back toward lower support structures, requiring a full re-evaluation of its market structure.

MYX November Analysis

October began with profit selling but a catastrophic, market-wide liquidation cascade (Oct 10-11) crashed MYX from $17 to a low of $1.40.

The token has since shown resilience, reclaiming the $3 level, which indicates the formation of a renewed demand zone post-shakeout.

The immediate target for the rest of the month is to retest $9 resistance; failure to hold current demand risks a retreat to lower support structures

MYX Finance (MYX) Price Prediction Table (2025-2030)

YearMinimum PriceAverage PriceMaximum Price
2025$9.00$15.00$26.00
2026$10.50$18.00$30.00
2027$12.00$24.50$37.00
2028$15.50$29.00$42.00
2029$19.00$35.00$46.00
2030$21.00$38.00$50.00

Looking beyond 2025, MYX Finance’s future will largely depend on whether it can sustain user growth, expand its ecosystem, and maintain competitive advantages in DeFi trading. As long as the platform continues to capture trading volume and revenues, MYX is well positioned to grow steadily.

By 2026, MYX could stabilize within the $18-$30 range. In the following years, increasing institutional adoption of decentralized derivatives could push MYX toward higher valuations, potentially reaching $50 by 2030.

This table provides a framework for understanding the potential MYX price movements. Yet, the actual price will depend on a combination of market dynamics, investor behavior, and external factors influencing the cryptocurrency landscape.

Never Miss a Beat in the Crypto World!

Stay ahead with breaking news, expert analysis, and real-time updates on the latest trends in Bitcoin, altcoins, DeFi, NFTs, and more.

FAQs

What is MYX Finance?

MYX Finance is a decentralized futures exchange that allows traders to use up to 50x leverage with zero slippage. Its unique “Chain-Abstracted Wallet” feature simplifies cross-chain trading.

Is MYX a good investment?

MYX has shown explosive growth, but its high volatility and concentrated token distribution suggest potential risks. Investors should consider their risk tolerance and conduct their own research.

What is the MYX Finance price prediction for 2025?

Based on market momentum and increasing adoption, MYX is projected to reach an average price of $15.00 in 2025, with a potential maximum of $26.00.

What is the MYX Finance price prediction for 2030?

MYX Finance is projected to reach a maximum price of $50 by 2030, with an average price of around $38. The long-term forecast depends on sustained growth, broader adoption of decentralized derivatives, and the platform’s ability to remain competitive.

What is the current MYX Finance sentiment?

Current sentiment for MYX Finance is mixed to bearish, following a significant price correction after its parabolic rise. While some technical indicators suggest a neutral or even bullish outlook in the short term, concerns about token unlocks, whale activity, and high volatility contribute to a cautious market sentiment.

Is MYX Finance a good buy in 2025?

Investing in MYX Finance in 2025 is a high-risk, high-reward proposition. While its innovative platform and potential for continued growth are attractive, the token’s recent extreme volatility, risks from large token unlocks, and allegations of market manipulation warrant caution. It’s crucial for potential investors to conduct their own thorough research and consider their risk tolerance.

❌