Reading view

SUI Price on the Edge: Could a 950% Rally Repeat Before 2026?

The year is ending soon, and market watchers are looking for signs of an altcoin rally. Among the most discussed tokens is Sui. The SUI price is now in a critical phase after a strong performance in 2024. 

The token recorded a 950% rise from $0.49 to $5.32 before entering consolidation. The current pattern could determine its next move.

Traders and analysts are paying attention to whether the SUI price will hold its momentum and possibly even hit new highs in 2026. The strength of Sui network as a whole and consistent on-chain development has kept long-term investors interested.

SUI Price Consolidates Ahead of Major Breakout

The SUI price has been trading sideways for several months within the symmetrical triangle pattern. Market participants interpret this as an accumulation phase rather than a downturn. The key support sits at $2, which has so far acted as a strong defensive level for buyers. 

Also Read: ETF Delays Hit Institutional Crypto Demand: Solana, Cardano, and Sui See Pullbacks

If the SUI price remains above this point, bullish sentiment is expected to strengthen. However, a break below could open the door for a decline back to the $0.49 range.

The narrowing of this trading range suggests that pressure is building for a breakout. Historically, when digital assets consolidate in such patterns, a decisive move often follows. 
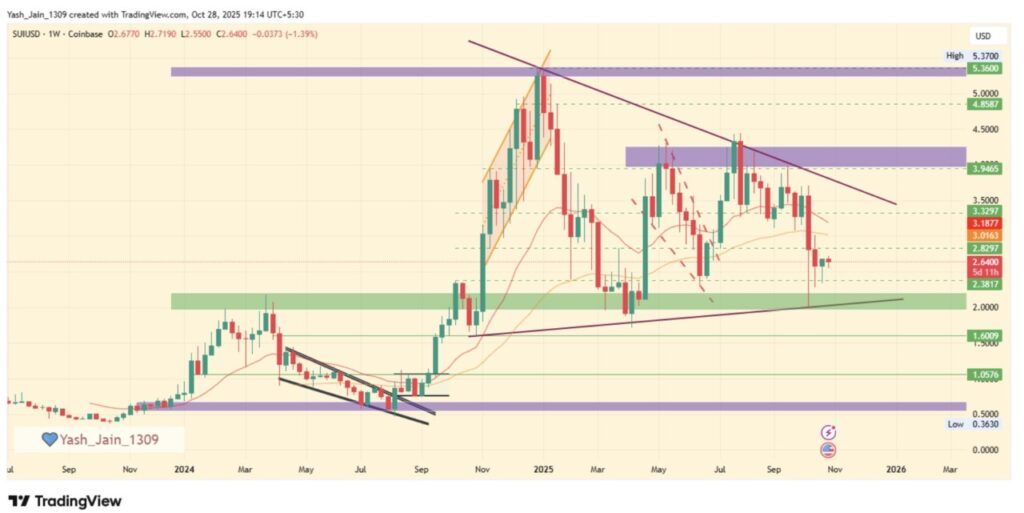
SUI price analysis
Source: TradingView

Network Expansion Strengthens Fundamentals

The expansion of Sui’s network remains one of its greatest strengths. The blockchain has seen an all-time high of 225 million total accounts, reflecting huge growth in the number of users. On October 28, almost 924,000 new accounts were registered.
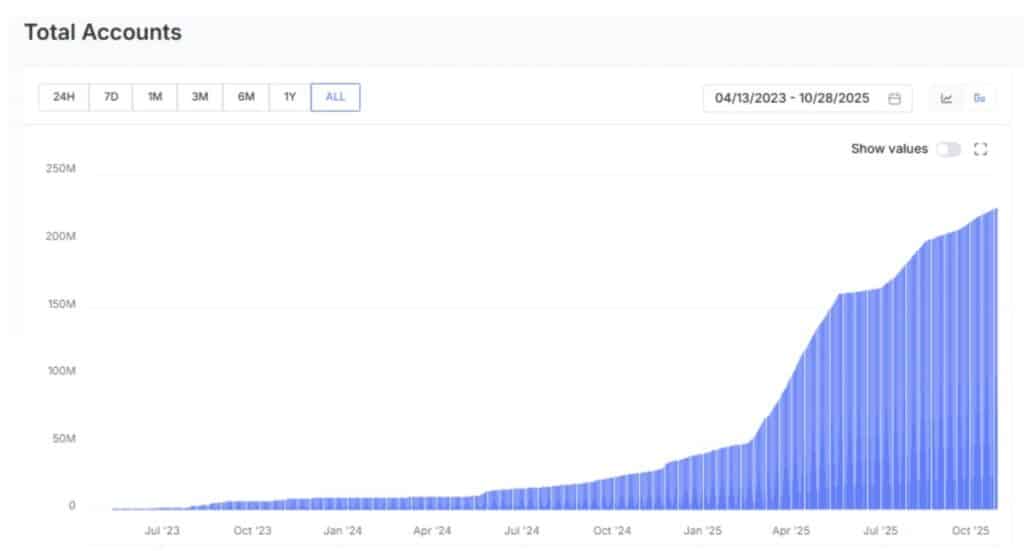
SUI On-chain news
Source: SuiScan

Stablecoin Activity Reflects Growing Liquidity

Stablecoin flow within the Sui ecosystem has surged and liquidity is more sufficient, and user engagement is further improved. Between October stablecoin market cap in the network increased from $560 million to $1.15 billion.

There is typically an association with increased DeFi participation with these types of gains as stablecoins enable trading, lending and yield opportunities. This development is indicative of increased trust in the ecosystem’s financial soundness and long-term viability.

DeFi Strength and Total Value Locked

TVL for Sui is still strong. The TVL has been fluctuating but remains around $1.89 billion, down from $2.62 billion earlier this month.

A high TVL level often represents a capital flowing into the network’s protocols, suggesting that every day people are using Sui’s staking, lending and liquidity programs.This resilience indicates that investors are leaving funds in the ecosystem.
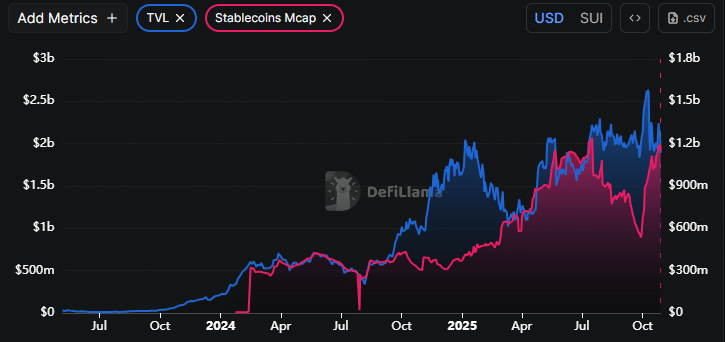
SUI TVL
Source: DeFiLlama

Technical Analysis: Triangle Tightens Toward Breakout

The symmetrical triangle on the SUI price chart is still squeezing and indicating a breakout. Analysts point out that the narrower the range, the greater the chances a breakout will occur.

Month Min. Price Avg. Price Max. Price Change 
Oct 2025 $ 1.75 $ 1.98 $ 2.50
0.54%
Nov 2025 $ 1.90 $ 1.96 $ 2.03
-18.40%
Dec 2025 $ 2.01 $ 2.01 $ 2.01
-19.05%

In case buying pressure increases, the SUI price may rise further and break above this level to the upside; however, investors should expect a retest of $5.32 which is its ATH. An established break above this price point could bring back new investor interest.

Market Sentiment and Analyst Outlook

Analysts are still bullish on Sui in the long run. They highlight on-chain growth, strong liquidity, and increasing developer activity as indicators of continued value.

Despite global market uncertainty, the price of SUI has held its own well, it is one contender that upholds its stability, unlike other weak alts. Institutional interest in blockchain infrastructure is increasing, and Sui’s emphasis on scalability and efficiency fits that trend.

Conclusion

SUI price is at one of its most crucial points days after the record-breaking rally in 2024. After several months of consolidation in a symmetrical triangle, market is getting ready for the next big move.

Network growth, increasing stablecoin liquidity and continued DeFi adoption all suggest underlying strength. If the momentum is sustained, SUI might retest and even exceed its previous $5.32 high before mid-2026.

Also Read: Sui’s DEX Volume Surges to All-Time High: What’s Driving Traders to the Network?

Appendix Glossary of Key terms

SUI – The native cryptocurrency of the Sui blockchain network.

Symmetrical Triangle – A chart pattern signaling potential breakout after price consolidation.

Support Level – A price point where buying pressure prevents further decline.

Breakout – A strong price move beyond established support or resistance.

Total Value Locked (TVL) – The total amount of assets staked or locked in DeFi protocols.

Stablecoin – A cryptocurrency pegged to a stable asset like the U.S. dollar.

DeFi – Decentralized Finance; blockchain-based financial applications without intermediaries.

Frequently Asked Questions SUI Price

1. What is driving the current SUI price trend?

Strong on-chain activity, expanding user adoption, and increasing stablecoin inflows are reinforcing the current SUI price trend.

2. What support levels are crucial for SUI?

The $2 support level remains the key area to monitor for any breakdown or continuation of the bullish structure.

3. Could the SUI price reach a new all-time high soon?

If the asset breaks out from its symmetrical triangle, analysts predict a potential return to the $5.32 mark before the end of 2025.

4. How does network growth impact the SUI price?

More user accounts, higher liquidity, and rising DeFi participation all strengthen the long-term foundation for sustained SUI price growth.

Read More: SUI Price on the Edge: Could a 950% Rally Repeat Before 2026?">SUI Price on the Edge: Could a 950% Rally Repeat Before 2026?

SUI Price on the Edge: Could a 950% Rally Repeat Before 2026?
ETF Delays Hit Institutional Crypto Demand: Solana, Cardano, and Sui See Pullbacks

Institutional crypto demand is losing momentum amid ongoing regulatory uncertainty. Delayed ETF approvals have further slowed capital inflows into non-Bitcoin assets.

Despite overall market resilience, the latest CoinShares report reveals that institutional crypto demand for major altcoins such as Solana, Cardano, and Sui has cooled sharply in recent weeks.

Institutional Crypto Demand for Altcoins Sees Sharp Decline

CoinShares’ weekly data highlights a pronounced drop in institutional crypto demand across several leading altcoins. Solana recorded inflows of $29.4 million, while XRP saw $84.3 million, both far below their October peaks. 

Just weeks ago, Solana saw a record-breaking $706.5 million in inflows that highlighted just how fast institutional sentiment can change. Cardano saw a flip from $3.7 million in inflows to $0.3 million outflows, as Sui slid into redemptions of $8.5 million.

Also Read: Major Win for Metaplanet as It Joins CoinShares Index – What This Means for Investors

Analysts observe that a lot of funds are dialing back on accumulation plans. Until they have a clear picture as to when ETFs will be approved and warn that institutional demand for crypto could continue to tread water in the short term.

Bitcoin Strengthens Amid Uncertainty

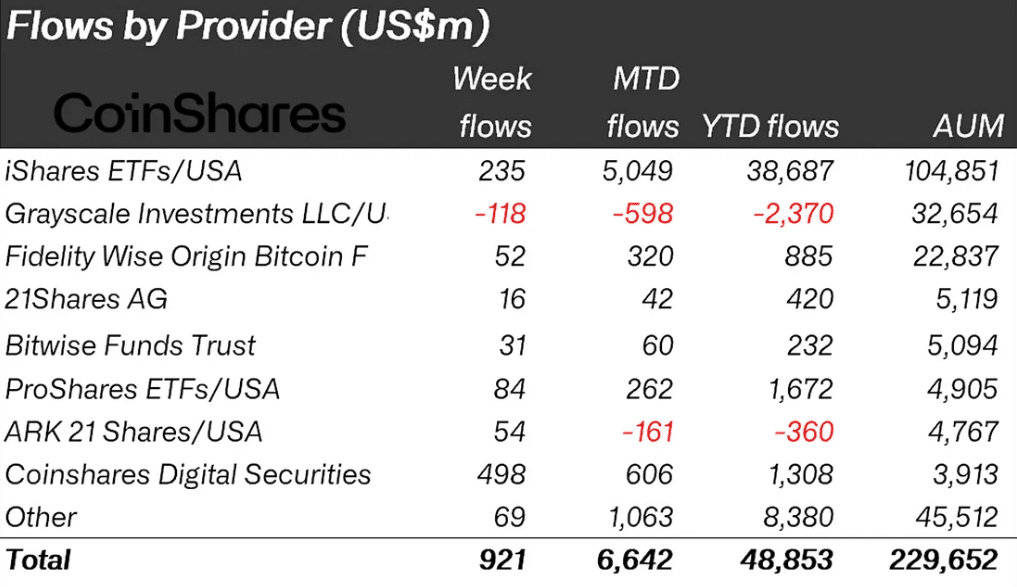
With altcoins in the struggle, Bitcoin maintains its grip on global investment. Institutional crypto demand for Bitcoin soared last week, with inflows totaling $921 million.

Institutional Crypto Demand
Source: CoinShares

Investors appear increasingly confident in Bitcoin’s ability to perform as a macro-hedge as inflation cools and the Federal Reserve prepares for another rate cut.

This renewed confidence has lifted cumulative Bitcoin investments to $9.4 billion since the last rate adjustment, highlighting how institutional crypto demand remains concentrated in the world’s largest digital asset.

Ethereum Faces Temporary Setback

Ethereum’s performance diverged from Bitcoin’s strength. After five consecutive weeks of positive inflows, Ethereum recorded $169 million in outflows, suggesting that institutional crypto demand for the asset is fading. 

U.S. spot Ethereum ETFs also reported three straight days of net outflows, even as ETH briefly rallied above $4,200 before traders locked in profits. Market strategists link Ethereum’s weakness to regulatory uncertainty and profit-taking after its recent rally.

Regional Breakdown

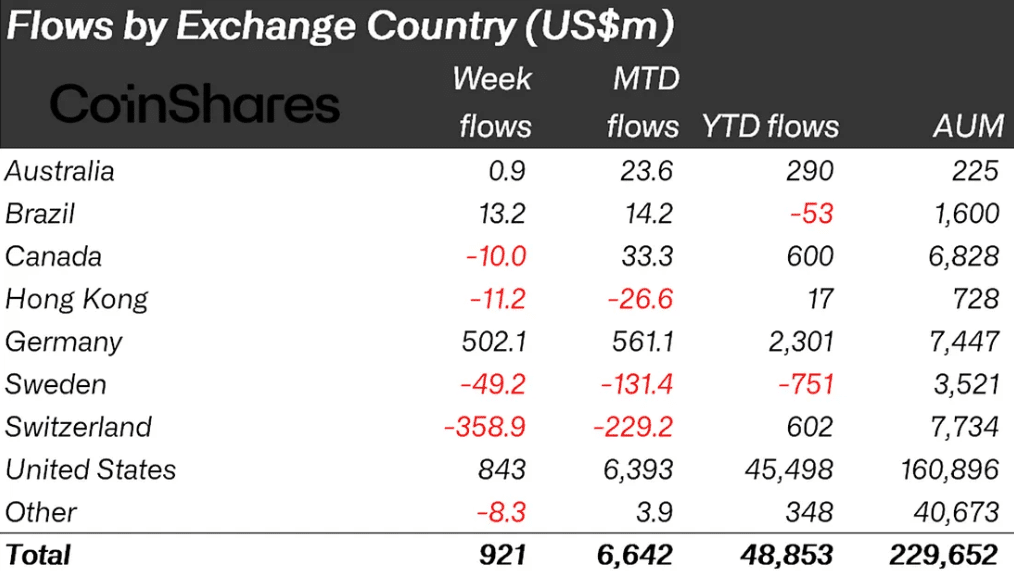
The U.S. remained the leader in institutional crypto demand, recording $843 million in inflows. Germany followed with a record-high $502 million, indicating sustained institutional participation in Europe’s largest economy. 

Switzerland, however, registered $359 million in outflows, a figure analysts say largely reflects internal asset transfers rather than outright selling. These patterns illustrate a split market: strong institutional crypto demand in the U.S. and Germany versus cautious positioning in Switzerland and other European regions.

Global crypto liquidity
Source: CoinShares

Solana Holds Technical Momentum

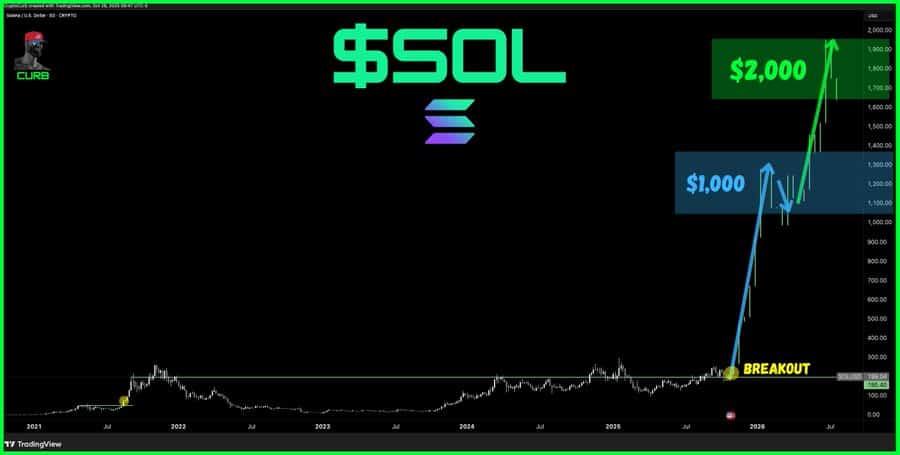
Despite lower institutional inflows, Solana continues to display technical strength. The token trades near $199, up 3.5% for the week. 

Analyst curb.sol noted that Solana’s breakout from the $200 resistance zone signals a potential macro expansion, with long-term price targets near $1,000 and $2,000. If institutional crypto demand improves, Solana could spearhead the next phase of altcoin growth, much like its explosive rally in 2021.

Crypto fund flows
Source: X

Analysts’ Long-Term Outlook

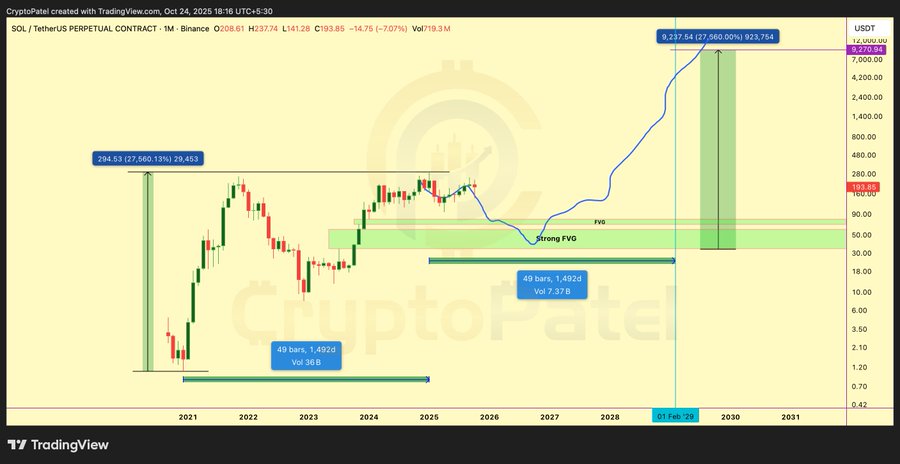
Analyst Crypto Patel maintains a bullish long-term perspective. He projects that Solana could replicate its earlier 27,560% growth cycle, potentially reaching $9,200 by 2029. Patel described the current market as a Wyckoff-style accumulation phase.

He emphasized that a rebound in institutional crypto demand will likely depend on ETF approvals and renewed macroeconomic stability, both of which could trigger a strong capital rotation back into altcoins.

Solana price outlook
Source: X

Crypto Funds Defy Altcoin Slump

Despite weakness in altcoins, global crypto funds saw a combined inflow of $921 million last week. Daily data from Farside showed that Bitcoin exchange-traded products attracted $477 million on October 21 alone. 

Global trading volumes remained high at $39 billion, indicating strong market activity. Liquidity and participation stay healthy even as institutional crypto demand cools temporarily.

Conclusion

The drop in institutional crypto demand also highlights a market that continues to be highly sensitive to U.S. regulatory news. EOS, ADA and Sui lost short-term momentum altcoins like Solana, Cardano andSUI have lost short-term resistance is possible profit taking into Bitcoin.

Analysts expect institutional crypto demand to return as ETF approvals advance. As monetary policy settles, paving the way for a fresh boom in the digital-asset space.

Also Read: $2 Billion Liquidity Incoming for BlackRock’s Bitcoin ETF as UK Traders Pile Into IBIT

Appendix: Glossary of Key Terms

Institutional Crypto Demand – Investment interest and capital inflows from large financial institutions into digital assets.
ETF – A regulated investment vehicle that tracks the price of an asset, such as Bitcoin or Ethereum.
Altcoins – Cryptocurrencies other than Bitcoin, including Solana, Cardano, XRP, and Sui.
Inflows/Outflows – The amount of money entering or exiting crypto investment products over a given period.
Regulatory Uncertainty – Lack of clear government policies affecting crypto investment decisions.
Liquidity – The ease with which assets can be bought or sold without affecting their price.

Frequently Asked Questions About Institutional Crypto Demand

1. What does institutional crypto demand mean?

It refers to investment activity from large financial institutions, including hedge funds, asset managers, and banks, allocating capital to cryptocurrencies.

2. Why is institutional crypto demand slowing?

Delays in ETF approvals and regulatory uncertainty have reduced confidence among major investors, leading to temporary pullbacks in altcoin investments.

3. Which cryptocurrencies are most affected?

Solana, Cardano, Sui, and XRP have seen the largest drops in institutional crypto demand in recent weeks.

4. Is Bitcoin still attracting institutions?

Yes. Institutional crypto demand for Bitcoin remains robust, as it’s viewed as a stable and liquid hedge during market uncertainty.

Read More: ETF Delays Hit Institutional Crypto Demand: Solana, Cardano, and Sui See Pullbacks">ETF Delays Hit Institutional Crypto Demand: Solana, Cardano, and Sui See Pullbacks

ETF Delays Hit Institutional Crypto Demand: Solana, Cardano, and Sui See Pullbacks

Dogecoin Whales Accumulate 15 Million DOGE as Retail Traders Exit the Market

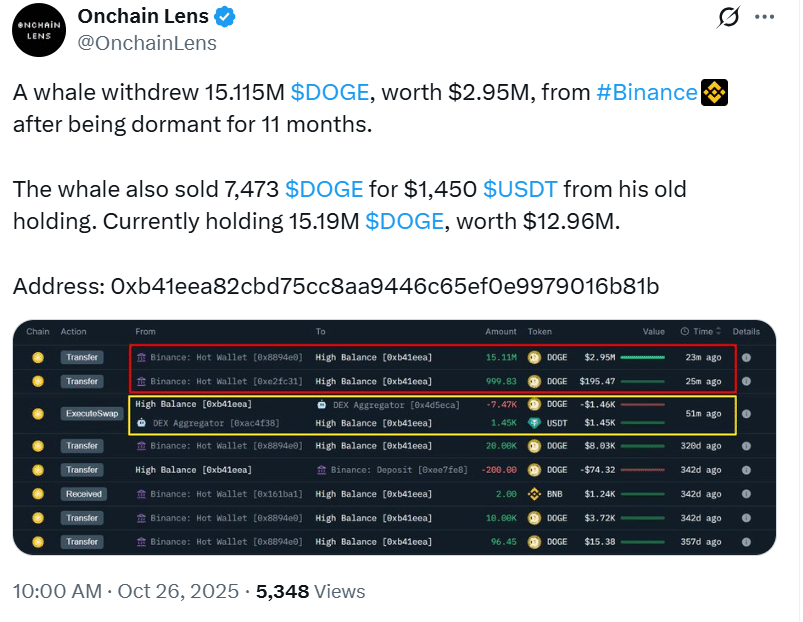
The Dogecoin price shows quiet strength as retail sentiment stays weak. Dormant whales accumulated 15.1 million DOGE, worth about $2.95 million, signaling renewed long-term confidence.

The move contrasts sharply with soft trading activity among small investors. Many retail holders continue to sell into every minor rally, showing limited confidence in short-term gains. The cautious behavior reflects broader market uncertainty and hesitation to buy at current levels.

Whales Reactivate as DOGE Accumulation Rises

On-chain data reveals a steady accumulation of DOGE by high-value wallets. One whale address reactivated after months of dormancy, adding 15.1 million DOGE to its holdings. 

It later sold 7,473 DOGE for about $1,450, leaving 15.19 million DOGE valued near $12.96 million. Analysts view this as a strong signal that institutional or early adopters are positioning ahead of the next market phase.

Dogecoin price
Source: X

While retail traders appear cautious, large wallets are quietly adding exposure. This split in behavior highlights an ongoing tug-of-war between speculative exit and long-term accumulation.

Whale Accumulation Signals Faith

Dormant whale accumulation often precedes renewed confidence among experienced holders. These “smart money” actors typically buy when the Dogecoin price trades near historical support zones. Their activity indicates belief in a medium- to long-term recovery, even when short-term metrics appear bearish.

Also Read: Thumzup Media to Accept Dogecoin Payments for Creators in Major Crypto Integration

Whale wallets moving after long silence also suggest that value recognition is returning to the meme-coin sector. Despite a weak broader market, their actions may mark early groundwork for the next uptrend.

Weak Retail Sentiment Persists

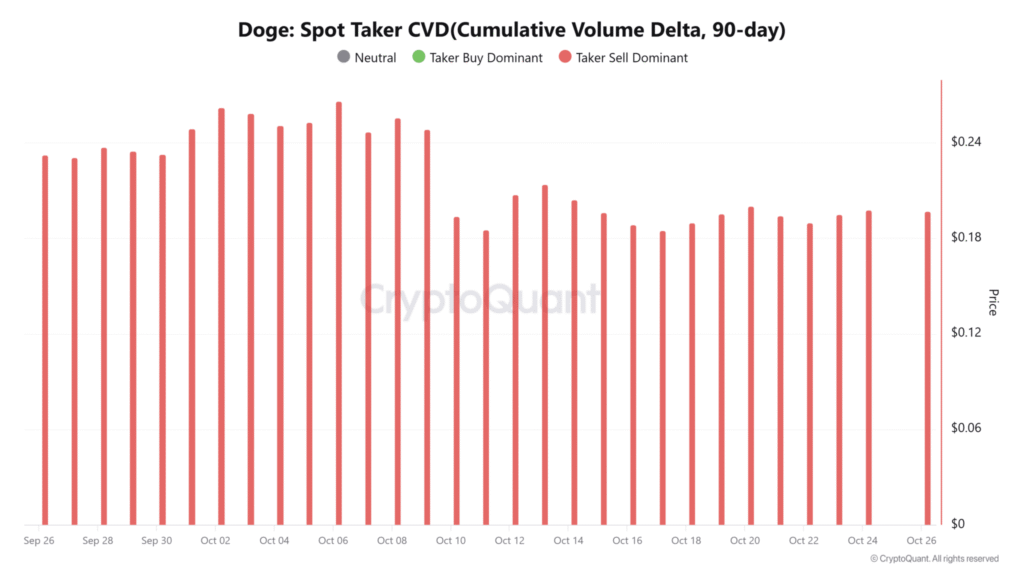
Despite whale optimism, retail traders are doing the opposite. CryptoQuant data shows that the Spot Taker CVD remained negative through October, signaling sustained selling pressure. This metric reveals that most traders continue to execute aggressive sell orders rather than buy into dips.

Dogecoin Whale
SourceL CryptoQuant

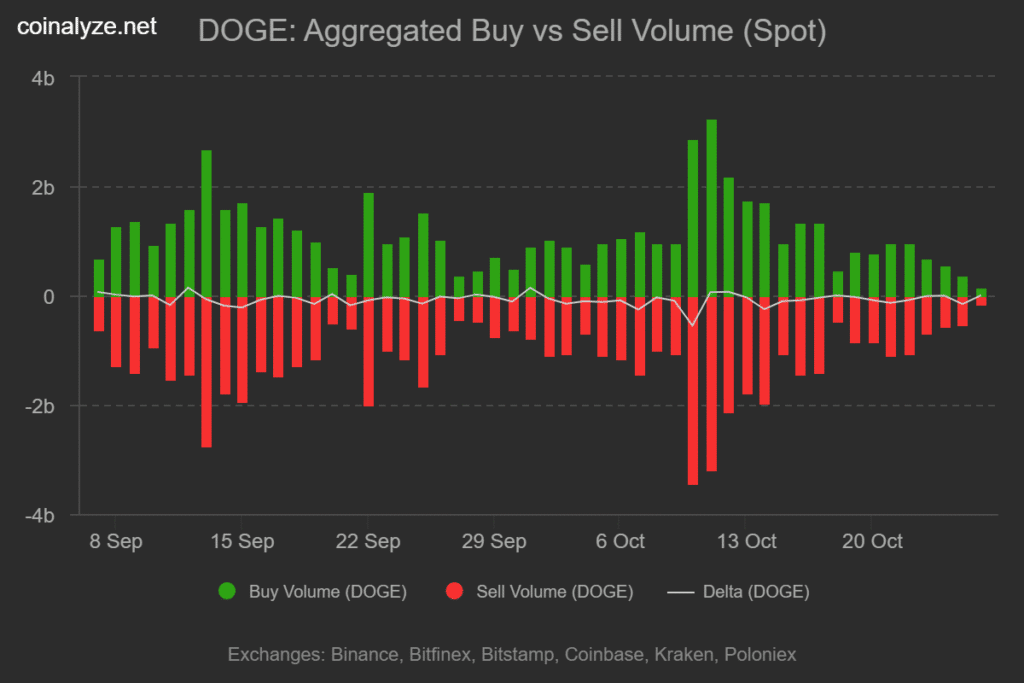
Supporting this, Coinalyze data reports a persistent negative Buy–Sell Delta. Over the past 30 days, Dogecoin recorded 156.67 million in sell volume versus 154.88 million in buy volume — a net negative of 1.79 million DOGE. This imbalance confirms that retail enthusiasm has yet to return.

DOGE News
Source: Coinalyze

Technical Setup Remains Bearish

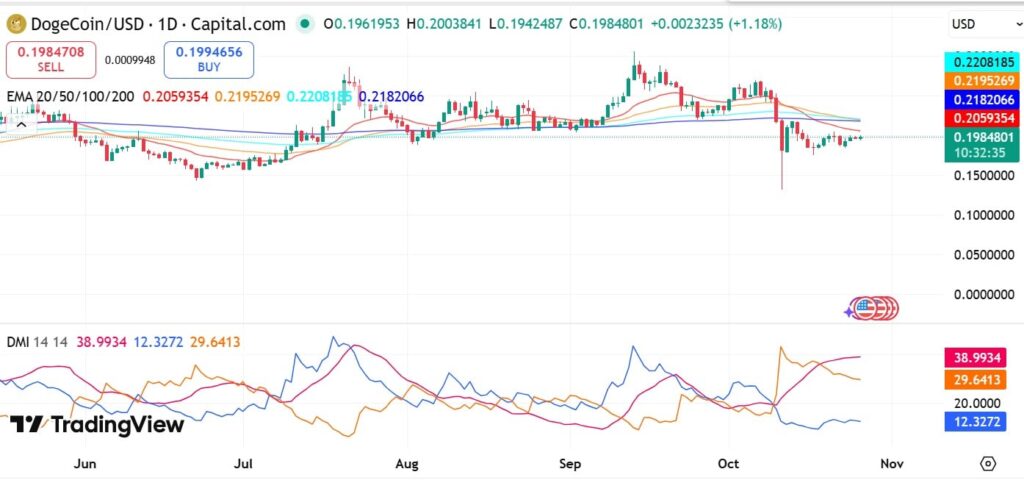
The DOGE USD price is still hovering below the main moving averages. It is bellow the 20,50,100 and 200 EMA lines which are pointing down. The Directional Movement Index supports this view, as the Positive Index is very close to 12 and the Negative was near 39.

Month Minimum Price Average Price Maximum Price Potential ROI
October $0.192 $0.195 $0.198
-2.6%
November $0.224 $0.237 $0.250
23%
December $0.225 $0.232 $0.238
17.1%

Buyers need to break more than $0.20 (20 EMA level) for the Dogecoin price trend to become bullish. A follow-through recovery back above the 50–100 EMA zone. 

DOGE price analysis
Source: TradingView

Around $0.21 is likely to pave the way for an extension of the up-move towards the $0.22 intermediate hurdle in the near-term. If it does not, the price can remain range-bound between $0.17 and $0.20 for an extended period.

Market Momentum Building Slowly

Despite the present soft performance, Dogecoin price exhibits superior resilience when compared to larger altcoins. It was up more than 2% this week compared with the CD5 index. Trading volume was 9.8% above the seven-day average, a sign of institutional participation.

The pattern suggests “early-cycle momentum building,” says market strategist Rishi Patel of Bluepool Digital. “DOGE’s resilience while Bitcoin and Ethereum consolidate suggests rotation flows are returning to higher-beta assets,” Patel said.

Chart Indicators Show Stability

Technical charts indicate that dogecoin is supported by an uptrendline, drawn from $0.1949 low on the hourly chart. Steady re-tests at $0.2060–$0.2070 support indicate buyers remain in the market daily. RSI is sitting at around 58 on the 4-hour — just like you’d expect early in a trend.

The MACD indicator remains in the positive area but starts to narrow, indicating light consolidation following an attempt to break out. This action suggests re-accumulation, not exhaustion, analysts said. The bias remains bullish with sustained closes above $0.2085.

What Lies Ahead for Dogecoin Price

But if buyers take over, Dogecoin price may rise towards $0.22 and then at the end of this week or next, to $0.25 ahead of new conditions next month. But an inability to take out the resistance levels may extend sluggishness. 

Although most long-term holders still talk about DOGE as a speculative — yet resiliently decentralized– digital asset. Its strong community and growing whale interest keeps its story running even in slow markets.

Conclusion

The Dogecoin price narrative today is emblematic of the quiet confidence beneath the surface. Whales that were previously dormant are accruing millions, while retail traders are even hopping out.

Technicals are still cautious, momentum indicates slow-building recovery. If DOGE can break above $0.20 and maintain, that will signify its next leg. For the time being, the whales seemed to be gambling that patience would pay.

Also Read: Dogecoin Price Calm May End Soon as Analysts Eye $0.5 Breakout

Appendix: Glossary of Key Terms

Whale: A name for someone holding a large quantity of cryptocurrency who is able to manipulate the market.

Dormant Wallet: A cryptocurrency or blockchain wallet that has gone dormant, and is either empty or contains an insignificant sum of cryptocurrency.

On-Chain Data: Information written to a blockchain itself, which can be utilized to track wallet movements, transactions and the general health of network.

Retail Traders: Small, individual investors usually trading in small quantities who generally follow the short-term market favourite.

Spot Taker CVD: A measure of trading that compares volumes of buying and selling in the spot market, with negative values indicating pressure to sell.

Frequently Asked Questions About Dogecoin Price

1- Is the Dogecoin price bullish or bearish?

Short-term signals remain bearish, but whale accumulation hints at early bullish positioning.

2- Why are whales buying Dogecoin?

Dormant wallets suggest long-term investors see value at current levels and expect gradual recovery.

3- What price levels should traders watch?

Key resistance sits at $0.20 and $0.21. A breakout above $0.2085 could confirm new upside momentum.

4- Are retail traders supporting the move?

Not yet. Retail sentiment remains weak, with net selling pressure persisting for most of October.

Read More: Dogecoin Whales Accumulate 15 Million DOGE as Retail Traders Exit the Market">Dogecoin Whales Accumulate 15 Million DOGE as Retail Traders Exit the Market

Dogecoin Whales Accumulate 15 Million DOGE as Retail Traders Exit the Market
❌