Reading view

Tron Shows Bullish Divergence As Active Addresses Surge To 6.2M – Network Demand Explodes

Tron (TRX) is consolidating this week as the broader crypto market braces for the upcoming US Federal Reserve decision on interest rates and quantitative tightening (QT). Investors are treading carefully, with uncertainty surrounding whether the Fed will maintain its restrictive stance or pivot toward easing—an outcome that could shift liquidity flows across digital assets. Despite the cautious market mood, on-chain data from CryptoQuant highlights a powerful surge in Tron’s network activity that stands out from the rest of the market.

On October 27, 2025, Tron flagged one of its most significant on-chain events to date. The number of daily active addresses skyrocketed from a steady baseline of roughly 3.5 million to an astonishing 6.23 million, marking the second-highest activity ever recorded in the network’s history. This massive uptick underscores a sharp increase in network demand and utility, suggesting that users are actively engaging with decentralized applications and stablecoin transfers within the Tron ecosystem.

While price action remains in a consolidation phase, this sudden burst in on-chain participation paints a different picture—a growing fundamental strength that could position Tron as one of the few networks expanding its real-world activity amid macroeconomic uncertainty.

Fundamentals Show Strength As Tron Price Corrects

According to a recent CryptoOnchain report published on CryptoQuant, Tron’s latest on-chain surge reveals an intriguing dynamic between network activity and market price. What makes this event particularly compelling is the clear bullish divergence it forms. While Tron’s fundamentals are strengthening, its price has been steadily declining—a pattern that often precedes a reversal.

Tron Active Addresses | Source: CryptoQuant

Specifically, the number of daily active addresses jumped from 3.5 million to 6.23 million on October 27, 2025, marking one of the network’s most active days ever. Meanwhile, TRX has been in a soft downtrend since August, slipping from a high near $0.36 to roughly $0.29. This divergence—rising on-chain engagement amid falling prices—suggests that market participants are underpricing Tron’s growing real-world utility.

Historically, such divergences between on-chain strength and price weakness have often acted as leading indicators for trend shifts. In Tron’s case, the data implies that network demand and user adoption are increasing faster than market sentiment reflects.

Analysts point to several possible catalysts behind this activity, including new decentralized application (dApp) launches, higher stablecoin transaction volumes, and effective user acquisition campaigns across the ecosystem.

The key factor now is sustainability. If this elevated level of activity holds through the coming weeks, it would confirm that Tron’s network growth is structural rather than temporary. Such validation could lay the groundwork for a significant bullish reversal, especially if macro conditions—like the Federal Reserve’s rate and QT decisions—shift toward easing, boosting liquidity across risk assets.

TRX Tests Key Moving Average As Bulls Defend Support

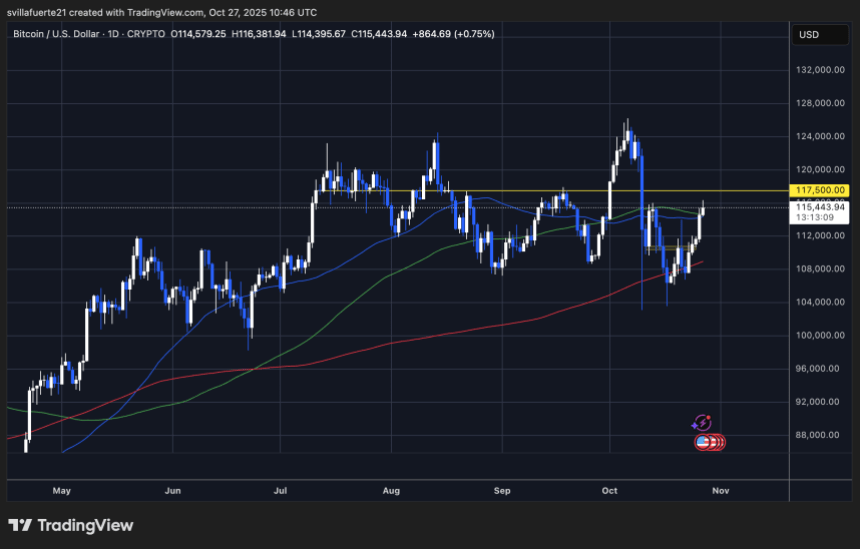
Tron’s (TRX) price is showing signs of consolidation around the $0.29–$0.30 range after an extended pullback from the August high of $0.36. The daily chart reveals that TRX has now reached the 200-day moving average (red line) — a key technical support that has historically served as a major inflection point for trend reversals. The asset briefly dipped below this level earlier in the week but has since recovered slightly, suggesting that buyers are attempting to stabilize momentum.

TRX consolidates below 200-day MA | Source: TRXUSDT chart on TradingView

The 50-day (blue) and 100-day (green) moving averages are trending lower, reflecting short-term weakness after months of bullish structure. However, holding above the 200-day MA could mark the beginning of a base formation before a potential rebound. A confirmed close below this level, by contrast, would open the door for a deeper retracement toward $0.27 or even $0.25, where previous accumulation zones exist.

Trading volume remains moderate, hinting that the market is in a wait-and-see mode ahead of the US Federal Reserve’s interest rate and QT decision. If broader market sentiment turns risk-on and on-chain activity remains elevated, TRX could soon attempt a recovery toward $0.32–$0.33, reclaiming its medium-term trend.

Featured image from ChatGPT, chart from TradingView.com

Bitcoin Breaks Above STH Realized Price For The First Time In Weeks – What’s Next?

Bitcoin is showing early signs of strength as it attempts to reclaim the $115,000 level. After weeks of mixed sentiment and heavy selling pressure, momentum appears to be turning slightly bullish. The recent weekly close above $114,500 has confirmed a reclaim of the Short-Term Holder (STH) Realized Price, a key on-chain threshold currently sitting near $113,000. This metric represents the average cost basis of recent market participants and often serves as a pivotal line separating bullish from bearish sentiment.

Top analyst Darkfost shared that this reclaim is an encouraging signal, reflecting renewed buyer confidence after a volatile October. However, he also cautioned that Bitcoin’s position must still be monitored closely. A rejection at current levels could lead to a renewed correction phase, mirroring the pattern seen in 2024, when BTC faced multiple failed attempts before regaining upward momentum.

For now, the market sits at a delicate crossroads — consolidating below resistance while holding critical on-chain support. If Bitcoin can sustain this structure and push convincingly above $115K, analysts believe it could open the door for a broader bullish continuation and potentially a retest of the $120K region in the weeks ahead.

Bitcoin Holds Above Key On-Chain Level

According to top analyst Darkfost, Bitcoin’s reclaim of the Short-Term Holder (STH) Realized Price around $113,000 could mark a crucial turning point for market structure. He notes that during the 2024 correction, BTC faced four failed attempts to break above this same metric. Each rejection was driven by short-term holders selling at their break-even points — a typical psychological reaction that delays trend reversals. Once Bitcoin finally sustained above the STH Realized Price, however, the market quickly regained momentum and entered a new expansion phase.

Bitcoin Short-Term Holder Realized Price | Source: Darkfost

This time, the dynamic appears similar. If Bitcoin successfully consolidates above this zone, it could pave the way for a strong bullish impulse and potentially a new all-time high (ATH) in the short term. The STH Realized Price acts as a measure of conviction among recent investors; holding above it suggests growing confidence and a shift from capitulation to accumulation.

Darkfost also highlights another critical observation: throughout the current bull cycle, Bitcoin has never fallen below the yearly STH Realized Price. Each time the price neared that level, a rebound followed — reaffirming it as a structural support for the broader trend.

Still, caution remains essential. A breakdown below the $94,000 mark — the current yearly STH Realized Price — would likely signal a deeper market shift. Such a move could mark the transition from a mid-cycle correction into a more prolonged bearish phase.

For now, the data suggests resilience, not weakness. As long as BTC remains above its short-term realized threshold, the broader uptrend remains intact — with potential for the next major rally if buying pressure continues to build above $115K.

BTC Bulls Defend Key Support While Momentum Cools

Bitcoin is currently trading around $114,360, consolidating after a brief rally that tested resistance near $115,800–$117,500. The chart shows that BTC successfully reclaimed the 200-period moving average (red line) on the 4-hour timeframe, a level that had acted as resistance throughout mid-October. This reclaim is an encouraging short-term signal, but momentum appears to be slowing as traders await the next catalyst.

BTC consolidates above key MA | Source: BTCUSDT chart on TradingView

The $113,000–$114,000 range now serves as immediate support — aligning with the Short-Term Holder (STH) Realized Price, a key on-chain level that reflects the cost basis of recent buyers. Holding this zone could allow bulls to consolidate strength before another attempt at breaking above $117,500, the main horizontal resistance that capped previous rallies.

On the downside, failure to maintain above the 200-MA could trigger a retest of $111,000, where the 100-MA (green line) provides secondary support. Trading volume remains subdued, reflecting investor caution ahead of the Federal Reserve’s interest rate decision later this week.

Bitcoin remains in a constructive phase as long as it holds above $113K. Sustained consolidation above this level would reinforce bullish structure — while a decisive break above $117,500 could open the path toward $120,000+ in the short term.

Featured image from ChatGPT, chart from TradingView.com

Binance Whales Turn Active On Uniswap As Outflows Hit Multi-Month Highs – Details

Uniswap (UNI) has been consolidating since the October 10 market crash, with price action stabilizing but volatility still lingering. The decentralized exchange (DEX) token has struggled to regain its previous momentum, reflecting the broader uncertainty across the altcoin market. Analysts remain divided on its short-term outlook — some view Uniswap as a key driver of Ethereum’s DeFi ecosystem and a potential leader in the next recovery phase, while others caution that lingering liquidity stress and waning trader activity could spark more turbulence ahead.

Despite this cautious backdrop, new on-chain data suggests a shift may be underway. According to CryptoQuant insights, Binance whales have become increasingly active on UNI, with large transactions and outflows spiking to multi-month highs. Historically, this type of whale behavior — especially when coupled with heavy exchange outflows — has been associated with accumulation phases and strategic repositioning by major players.

As Uniswap’s fundamentals remain solid, with trading volumes and user engagement steadily recovering, the renewed whale activity could indicate that smart money is quietly preparing for the next market leg. Whether this accumulation marks the early stages of a trend reversal or just a temporary pause before further volatility remains to be seen.

Uniswap Exchange Outflows Hit Multi-Month Highs

In recent days, Uniswap’s native token, UNI, has seen a notable uptick in large-scale activity, signaling renewed interest from major market participants. According to on-chain data from CryptoQuant, whale wallets — typically identified by the top 10 largest transactions — have begun moving significant amounts of UNI out of Binance. These outflows represent transfers from exchange wallets to external addresses, a behavior that often indicates accumulation or long-term repositioning by large holders rather than short-term trading.

UNI top 10 Whale Outflow on Binance | Source: CryptoQuant

The data highlights a daily peak of 17,400 UNI withdrawn from Binance, alongside a monthly peak of 5,250 UNI, marking a three-month high in whale activity. Historically, such outflow spikes tend to occur during accumulation phases, as whales seek to reduce exposure to centralized exchanges and secure tokens for longer-term holding or staking opportunities.

This renewed movement comes at a time when UNI is still digesting the market correction that began in July, with prices stabilizing but failing to regain strong upward momentum. Analysts interpret this surge in whale activity as a potential early indicator of confidence returning to the asset. If sustained, it could mark the beginning of a structural reversal — a shift from post-crash consolidation to the early stages of renewed accumulation and recovery.

UNI Price Analysis: Consolidation Persists as Whales Reenter the Market

Uniswap (UNI) continues to consolidate near the $6.50 level after a sharp correction that began in July 2025. The weekly chart shows a prolonged period of sideways movement following a breakdown from the $12 resistance zone, where bullish momentum previously failed to sustain. Despite multiple attempts to rebound, UNI remains below the 50-week and 200-week moving averages, both of which now act as dynamic resistance levels.

UNI consolidates around key level | Source: UNIUSDT chart on TradingView

The recent price action reflects investor hesitation, with the broader market still digesting the effects of the October 10 crash. However, volume analysis indicates that selling pressure has started to decline, suggesting that sellers may be exhausting and that accumulation could be forming at current levels.

From a technical perspective, the $6.00–$6.20 zone serves as immediate support, while a decisive reclaim above $8.00 would be required to shift market structure toward a potential mid-term recovery. Interestingly, the recent whale accumulation reported by on-chain data aligns with this stabilization phase — a pattern often seen near cyclical bottoms.

If Uniswap maintains support and market sentiment improves, UNI could attempt to retest the $10–$12 zone in the coming months. Conversely, a failure to hold above $6 could open the door for a retest of the 2024 range lows around $4.

Featured image from ChatGPT, chart from TradingView.com

Bitcoin Supply In Profit Rises To 83.6% – Market Momentum Building Again

Bitcoin (BTC) is showing renewed strength, reclaiming the $115,000 level after weeks of volatility and uncertainty. Bulls are attempting to build momentum for a potential impulse move higher, aiming to confirm a sustained bullish structure after the recent consolidation phase.

On-chain data continues to reveal a clear and repeating pattern tied to investor behavior and market cycles. Historically, when the percentage of Bitcoin supply in profit climbs above 95%, the market tends to enter an overheated phase, often leading to sharp corrections. These pullbacks serve as natural cooling periods, resetting sentiment and liquidity before the next major leg up.

Interestingly, each correction cycle has shown consistent bottoming zones around the 75% threshold, where long-term holders reaccumulate and market confidence begins to rebuild. More specifically, data highlights profit supply lows of 73% in September 2024, 76% in April 2024, and a recent rebound from 81%, signaling a potential mid-cycle recovery phase.

Bitcoin Supply in Profit Rises to 83.6% — Momentum Rebuilds Ahead of Key Threshold

According to top analyst Darkfost, the percentage of Bitcoin supply in profit has started to climb again, currently standing at 83.6%. This steady rise indicates that a growing share of Bitcoin holders are once again sitting on unrealized gains — a trend that often reflects improving sentiment and renewed market confidence.

Bitcoin Percent Supply in Profit | Source: CryptoQuant

Darkfost notes that this level can be interpreted as encouraging, suggesting that investors are willing to hold their BTC instead of realizing profits, anticipating further upside in the near term. Historically, such behavior has been characteristic of mid-cycle recovery phases, when fear starts to fade and accumulation resumes across both retail and institutional segments.

This stage of the cycle is considered healthy for rebuilding momentum, as it allows the market to stabilize after large corrections. Holders who previously capitulated often reenter at this stage, while long-term participants strengthen their positions, creating a more resilient market structure.

However, Darkfost cautions that once the supply in profit surpasses 95%, it typically signals overheated market conditions — a point where euphoria tends to replace rational conviction. In such phases, Bitcoin historically faces increased volatility and sharp corrections as overleveraged traders and short-term speculators take profits.

BTC Retests $115K Resistance: Bulls Regain Momentum

Bitcoin (BTC) is showing renewed bullish momentum, trading around $115,443 and successfully reclaiming key short-term support levels after weeks of consolidation. The daily chart highlights a strong recovery structure, with BTC breaking above both the 50-day and 100-day moving averages, signaling a shift in short-term market sentiment.

BTC testing key level | Source: BTCUSDT chart on TradingView

The next critical test lies at $117,500, a historical resistance zone that previously rejected multiple attempts in September and early October. A clear breakout and daily close above this level would likely confirm an impulse continuation toward $120K–$125K, opening the door for a more sustained uptrend.

Momentum indicators suggest strengthening buying pressure, while the recent bounce from the 200-day moving average near $107K underscores the market’s resilience. This level acted as a springboard for the current rally, aligning with the broader pattern of accumulation seen on-chain, where investor profitability is rising steadily.

However, BTC remains within a range-bound structure, and rejection at $117.5K could trigger short-term consolidation back toward $111K–$112K. Overall, Bitcoin’s technical outlook appears constructive — if the bulls can sustain above $115K and confirm strength above $117.5K, the market could transition into a new bullish leg, supported by improving investor sentiment and on-chain health.

Featured image from ChatGPT, chart from TradingView.com

Digital Yen Goes Live: JPYC EX Integrates Traditional Finance With DeFi

Japan has officially stepped into the regulated stablecoin era with the launch of JPYC EX, the country’s first fully licensed digital yen under the revised Payment Services Act. This milestone marks a pivotal moment for Japan’s financial sector, bridging traditional banking infrastructure with the Web3 ecosystem.

Building on earlier versions of JPYC, the new JPYC EX is designed to serve as a compliant, yen-backed stablecoin connecting the nation’s banking system to blockchain-based commerce, DeFi applications, and cross-border payments. With full legal authorization and asset backing, it positions the yen as a future cornerstone in global digital finance.

According to CryptoQuant, the total stablecoin market capitalization has now surpassed $150 billion, forming the backbone of liquidity for crypto markets, DeFi protocols, and global payments. Analysts from Citi and Bloomberg project that this figure could expand to between $1.6 and $4 trillion by 2030. Within that rapid growth, JPYC is forecasted to capture roughly 2% of the market, reaching a valuation of around $70 billion.

Stablecoins vs JPYC (revised projections 2020-2030) | Source: CryptoQuant A Fully Regulated Digital Yen Bridging Japan’s Finance and Web3

What distinguishes JPYC EX from other stablecoins is its combination of regulatory clarity, asset backing, and technical versatility. Domestic bank deposits and Japanese government bonds fully collateralize each token, ensuring complete transparency and stability. This structure makes JPYC EX one of the world’s most legally robust stablecoins. A benchmark for compliance-driven innovation in digital finance.

Built on Ethereum, Polygon, and Avalanche, JPYC EX provides instant yen transfers with near-zero fees. Making it a practical tool for businesses and individuals alike. It supports commerce, payroll, peer-to-peer payments, and DeFi applications, offering the efficiency of blockchain without sacrificing legal or operational safeguards.

JPYC EX also aligns closely with Japan’s digital transformation strategy, which aims to merge traditional finance with emerging Web3 systems. By serving as a settlement layer for e-commerce platforms, NFT marketplaces, and cross-border transactions, the stablecoin enables instant yen transfers across Asia, lowering costs and increasing accessibility for international trade.

Looking ahead, analysts forecast JPYC’s market capitalization could reach $70 billion by 2030. It represents roughly 2% of the global stablecoin market. This growth potential underscores Japan’s ambition to establish the digital yen as a key pillar of the decentralized global economy. With its blend of regulatory trust, technological precision, and global reach, JPYC EX may redefine how national currencies operate in the Web3 era.

Stablecoin Dominance Shows a Cooling Phase After Recent Surge

The chart shows that stablecoin market dominance currently sits around 8.31%, following a sharp rise earlier in October that pushed the ratio above 9%. This level often signals heightened demand for liquidity and safety, as traders move capital into stable assets amid market uncertainty.

Over the past few months, dominance has steadily climbed from the 7.3%–7.5% range, reflecting a cautious sentiment as Bitcoin and major altcoins face selling pressure. However, the recent pullback suggests that some funds are beginning to rotate back into risk assets, a potential early sign of market stabilization.

Crypto Stablecoin Dominance % | Source: STABLE.C.D

Technically, the dominance remains above both the 50-day and 200-day moving averages, indicating a broader uptrend in liquidity positioning. If this level holds, it may serve as a buffer during continued volatility. Conversely, a sustained drop below 8% could signal that traders are redeploying capital into crypto assets, possibly fueling short-term rallies.

Stablecoin dominance remains elevated — a sign that market participants still prefer holding dry powder. Until dominance begins a more decisive decline, this cautious stance will likely persist, underscoring the market’s fragile balance between risk-off sentiment and the readiness for re-entry into volatile assets.

Featured image from ChatGPT, chart from TradingView.com

❌