Reading view

Bitcoin Struggles To Hold Key Support: Could $88,000 Be Next?

Bitcoin has struggled to reclaim the short-term holder Realized Price, a key on-chain level. Here’s where the next major support line lies for the asset.

Bitcoin Has Again Dipped Below STH Realized Price

In its latest weekly report, on-chain analytics firm Glassnode has discussed about some key Realized Price levels for Bitcoin. The “Realized Price” here refers to an indicator that measures the cost basis of the average investor or address on the BTC network.

When the metric is trading above the asset’s price, it means the holders as a whole are sitting on a net unrealized profit. On the other hand, it being below the spot BTC value implies the dominance of loss on the blockchain.

The Realized Price of the entire network is generally not useful, as often, the cryptocurrency’s price trades significantly over it. The reason behind this lies in the fact that a notable part of the asset’s supply has been dormant for years, possessing a cost basis far below today’s price.

In fact, a chunk of this dormant supply will never return to circulation, as the wallets holding such tokens have had their keys become permanently inaccessible. To account for this, Glassnode came up with the “Active Realized Price,” a metric that only tracks the cost basis of the supply that can be considered economically active.

Below is the chart shared by the analytics firm that shows how the Realized Price and Active Realized Price of Bitcoin have changed since the last bull market.

Bitcoin Realized Price

As is visible in the graph, Bitcoin last interacted with the Realized Price in 2023. Since finding a rebound at it back then, the coin has only moved away from the line.

The cryptocurrency has been trading much closer to the Active Realized Price since breaking above it in late 2023, but even in its case, the gap is still notable. A version of the indicator that BTC regularly interacts with, however, is the third type listed on the chart: the short-term holder cost basis.

Short-term holders (STHs) refer to the Bitcoin investors who purchased their coins within the past 155 days. This cohort represents the recent buyers, who can be reactive to changes in the market.

The Realized Price of the group, which is often considered a divider between bullish and bearish trends, is currently located at $113,100. Bitcoin first fell below this mark during its crash earlier in the month, but the recovery surge took it back above the line. Though the latest retracement has once again brought the asset under it.

“Over the past two weeks, Bitcoin has struggled to close a weekly candle above this key level, raising the risk of further weakness ahead,” noted Glassnode. The next on-chain support level is the Active Realized Price, currently valued at $88,000.

It now remains to be seen whether BTC can recover above the STH Realized Price, or if a deeper correction is coming.

BTC Price

Bitcoin has fallen by nearly 3% during the past day, with its price coming down to the $109,900 level.
Bitcoin Price Chart

XRP Indicator That Nailed Recent Reversals Has Flashed Again

A cryptocurrency analyst has explained how the TD Sequential has accurately spotted XRP trend reversals over the last three months, and It has just flashed again.

TD Sequential Has Given Another Signal For XRP

In a new post on X, analyst Ali Martinez has discussed about the Tom Demark (TD) Sequential signal that has just formed for XRP. The TD Sequential is a technical analysis (TA) indicator that’s used for spotting points of trend reversal in a given asset’s price.

The indicator involves two phases. In the first of these, called the setup, it counts up nine candles of the same color on the asset’s chart. Once the nine candles are in, it signals that the price trend has reached a state of exhaustion. In other words, the asset has reached a point of turnaround.

Naturally, this signal is a bullish one if nine red candles led to the setup’s completion. Similarly, the signal is bearish if green candles were involved instead. When the setup is done, the second phase begins. This phase, known as the countdown, works much like the setup, with the only difference being that it lasts for thirteen candles. The countdown’s finish coincides with another top or bottom for the asset.

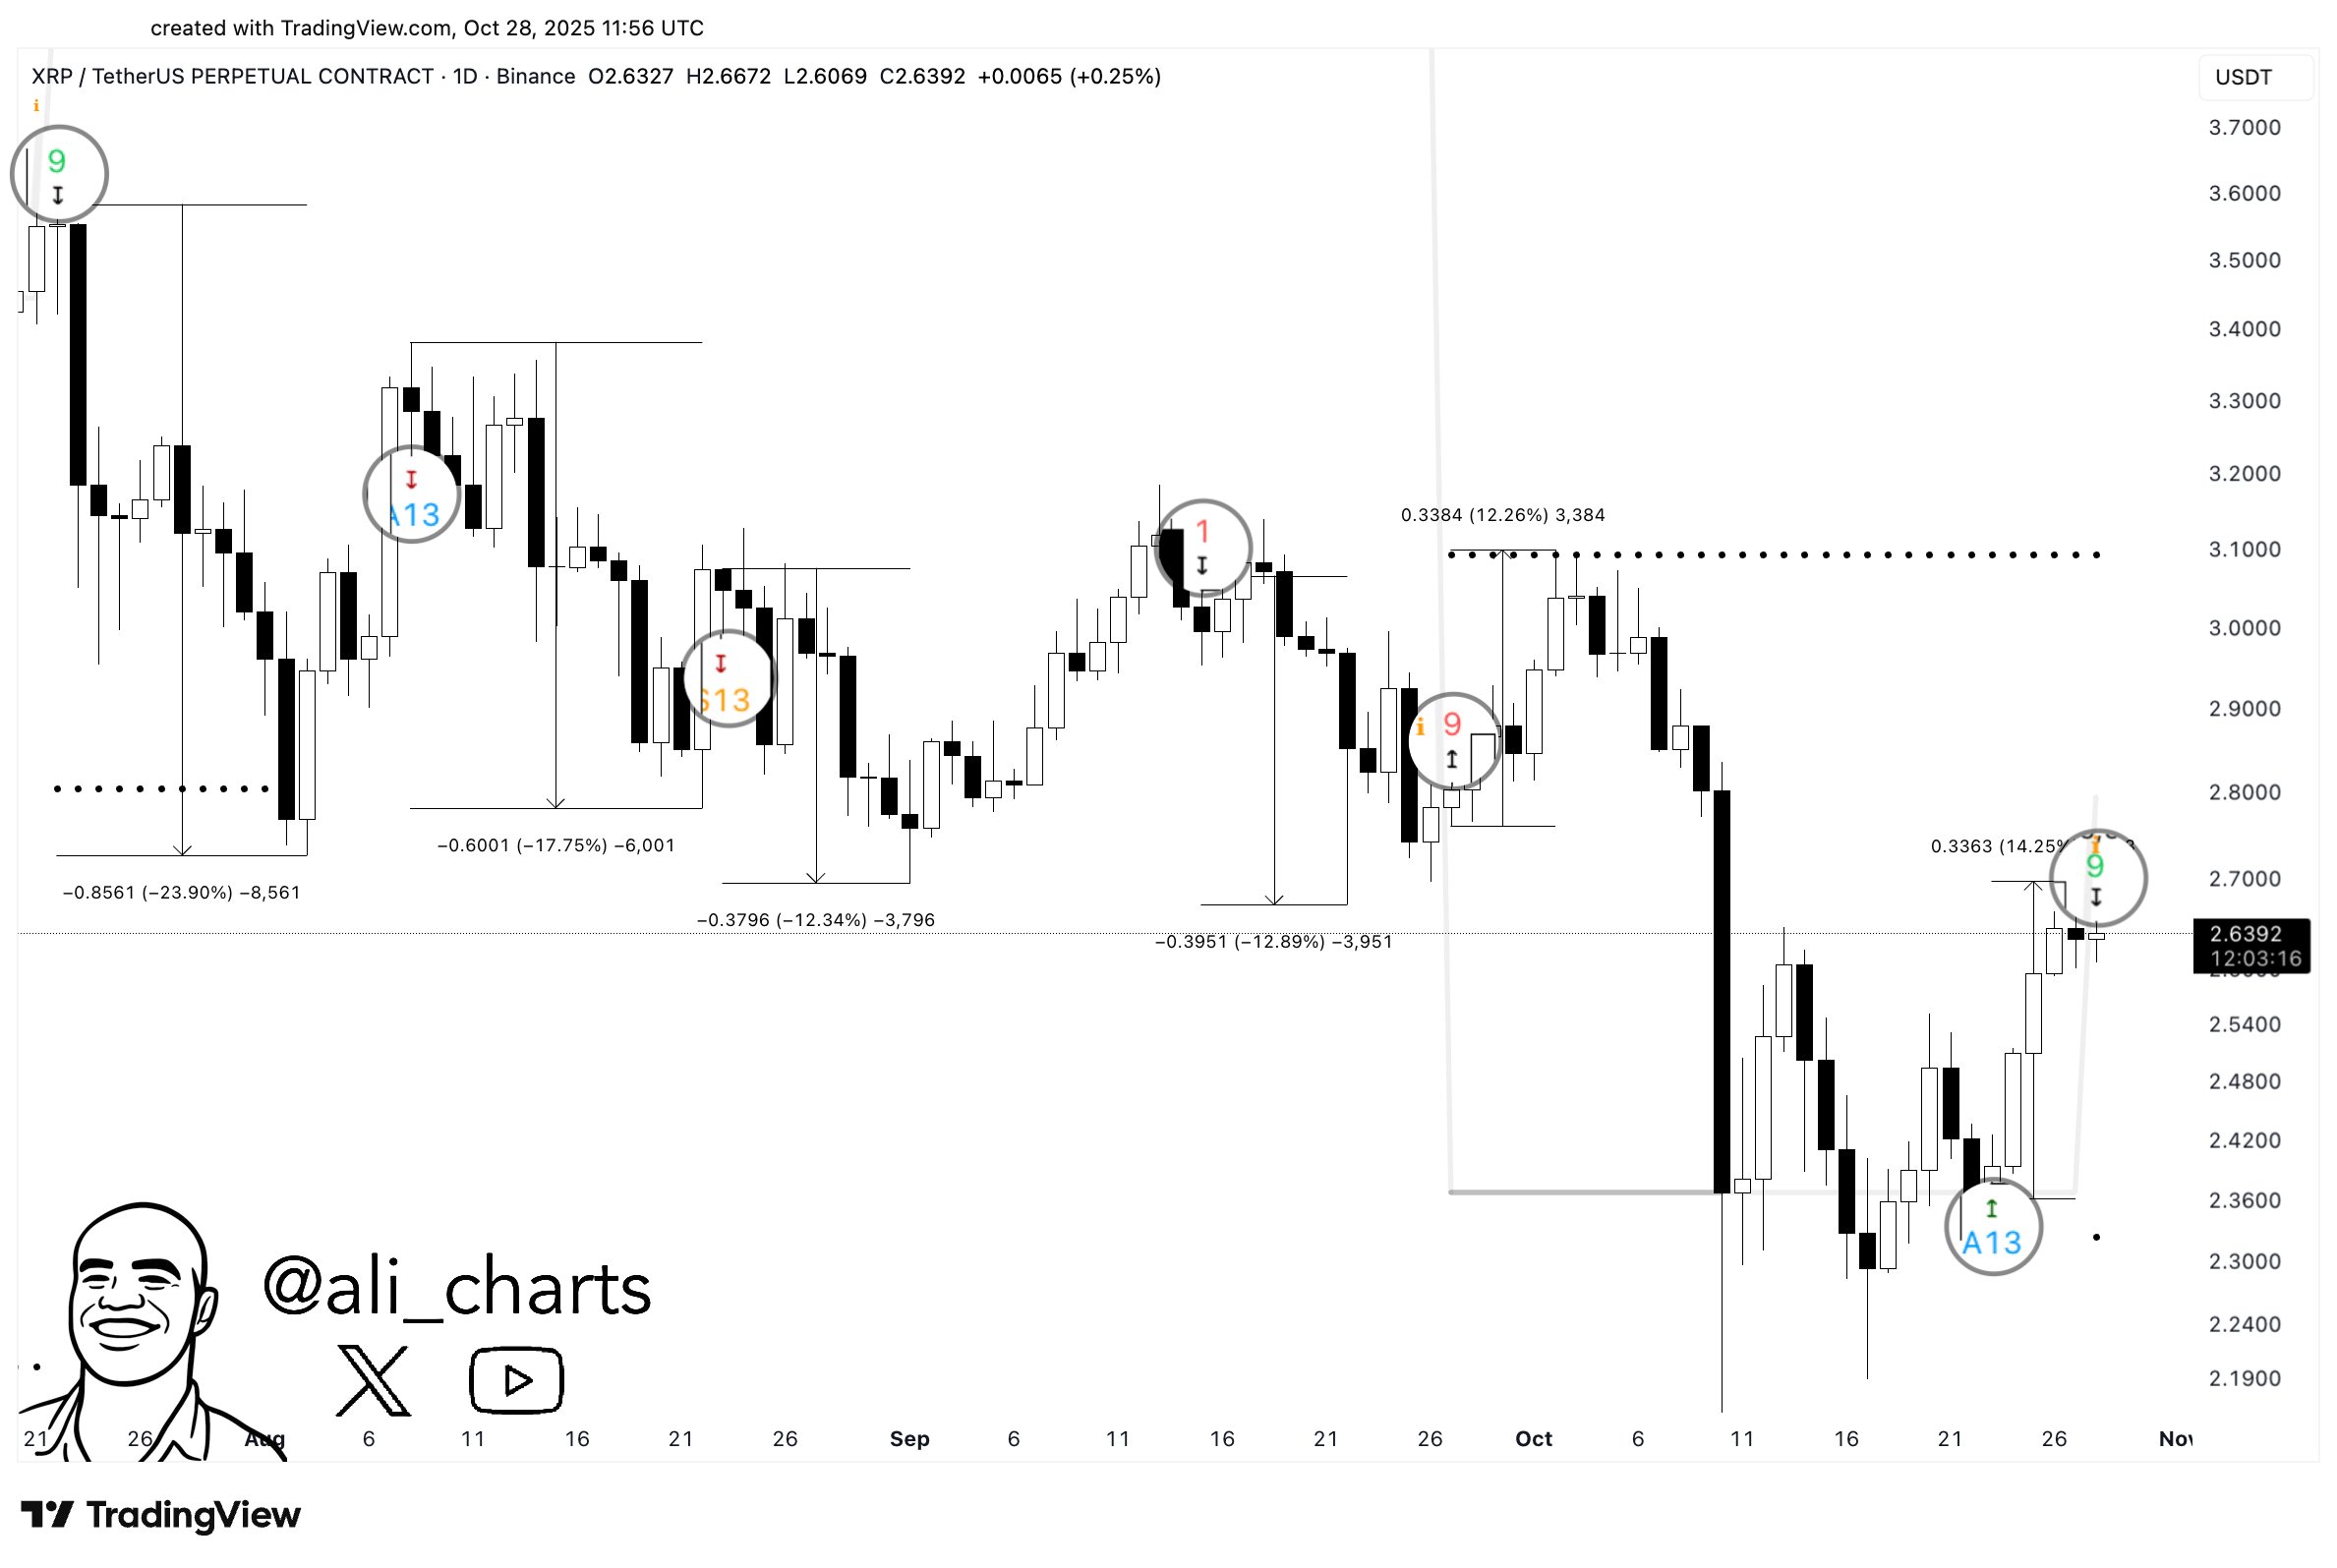
XRP has recently completed the former of the two TD Sequential setups on its daily price. Below is the chart shared by Martinez that shows this signal forming for the cryptocurrency.

XRP TD Sequential

As displayed in the graph, the 1-day price of XRP has formed a TD Sequential setup with nine green candles. This means that the coin could be due a reversal to the downside, at least from the perspective of the indicator.

During the last few months, the TD Sequential has given several signals for the asset, and interestingly, they have coincided quite well with local tops and bottoms. Considering this trend, it’s possible that the latest sell signal may also lead to a drawdown for the coin.

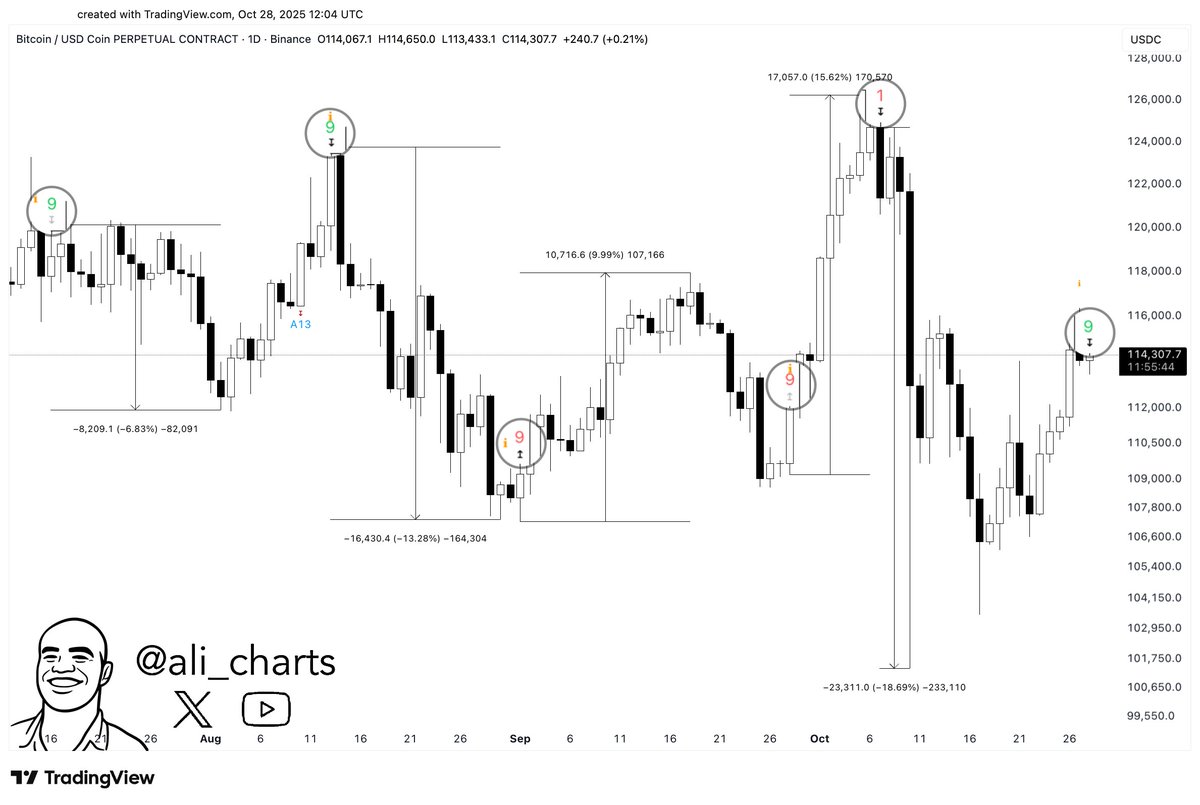
XRP isn’t the only asset that the TD Sequential has lately been reliable for. As the analyst has explained in another X post, the indicator has also called the recent swings in the Bitcoin price.

Bitcoin TD Sequential

From the above chart, it’s apparent that the TD Sequential gave a sell signal for Bitcoin earlier in the day. Since then, the asset has witnessed a retrace, implying that the metric may have once again caught a trend reversal.

XRP Price

XRP has been trading sideways recently as its price is still floating around $2.62.

XRP Price Chart

Bitcoin Cost Basis Map Reveals Key War Zone Between Bulls & Bears

On-chain analytics firm Glassnode has revealed a Bitcoin price range that defines the current battleground between recent buyers and profit-takers.

Bitcoin Cost Basis Distribution Shows Where Resistance & Support Are Strongest

In a new post on X, Glassnode has talked about where support and resistance levels lie for Bitcoin based on the Cost Basis Distribution (CBD). This indicator basically tells us about the total amount of supply that last changed hands at the various price levels that the cryptocurrency has visited in its history.

Below is the chart shared by the analytics firm that shows the trend in this metric over the last few months.

Bitcoin CBD

As is visible in the graph, the CBD highlights two levels for holding a dense amount of the cryptocurrency’s supply (shaded in red). The lower of these levels is situated near $111,000. A large chunk of buying at this mark occurred during the recent bearish phase in the asset.

The other level is located around $117,000, made up of investors who bought during the price rally to the all-time high (ATH). Naturally, these buyers would be underwater right now, while those who purchased at $111,000 would be in profit.

Generally, holders are sensitive to retests of their cost basis and can show some kind of reaction during one. Since these two levels host the cost basis of a significant amount of investors, it’s possible that when BTC will revisit them, some panic selling or buying will crop up.

Which behavior would be dominant usually comes down to the market mood and the direction of the retest. When the retest occurs from above, investors may choose to buy more, believing the same cost basis level would result in profits again in the future. Similarly, holders who were in loss prior to the retest can react by selling, fearing that the asset will drop again in the future.

Considering these effects, the $111,000 may be considered a key support cushion for Bitcoin, while $117,000 a resistance barrier. “This range defines the current battleground between recent buyers and profit-takers,” noted Glassnode.

It now remains to be seen which level BTC will visit next and how its retest will go. “A break in either direction could set the tone for the next major move,” explained the analytics firm.

In some other news, the Stablecoin Supply Ratio (SSR) Oscillator has been sitting at cycle lows recently, as Glassnode has pointed out in another X post. This oscillator is based on the SSR, which compares the Bitcoin circulating supply against the supply of the stablecoins.

Bitcoin SSR

The SSR Oscillator is sitting at a low level at the moment, which indicates that the BTC supply is low compared to stablecoin liquidity. “Historically, such periods precede stronger bid-side support when market confidence returns,” said the analytics firm.

BTC Price

Bitcoin saw a retrace toward $113,500 earlier, but the coin has been quick to bounce back as its price has returned to $115,400.

Bitcoin Price Chart

Solana Eyes $210 Before Its Next Major Move—Uptrend Or Fakeout Ahead?

An analyst has explained how Solana could decide its next big move after rising to $210, the resistance level of a Parallel Channel.

Solana Has Been Trading Inside A Parallel Channel Recently

In a new post on X, analyst Ali Martinez has talked about how the trajectory of Solana is looking from the perspective of a technical analysis (TA) pattern. The pattern in question is a Parallel Channel, which forms whenever an asset’s price trades between two parallel trendlines.

The upper line of the channel is considered a source of resistance, meaning that tops can be probable to appear on retests of it. Similarly, the lower level is assumed to provide support to the price, helping it to arrive at bottoms. A breakout of either of these bounds can signal a continuation of the trend in that direction. That is, a surge above the Parallel Channel can be a bullish signal, while a drop under it may lead to bearish action.

There are a few different types of Parallel Channels, depending on how the channel is oriented with respect to the graph axes. Channels that have a positive slope are known as Ascending Channels, while those that slope downward are called Descending Channels.

In the context of the current topic, the third and simplest type is the one of interest: a Parallel Channel that’s also parallel to the time-axis. This case corresponds to a phase of true sideways consolidation in the asset.

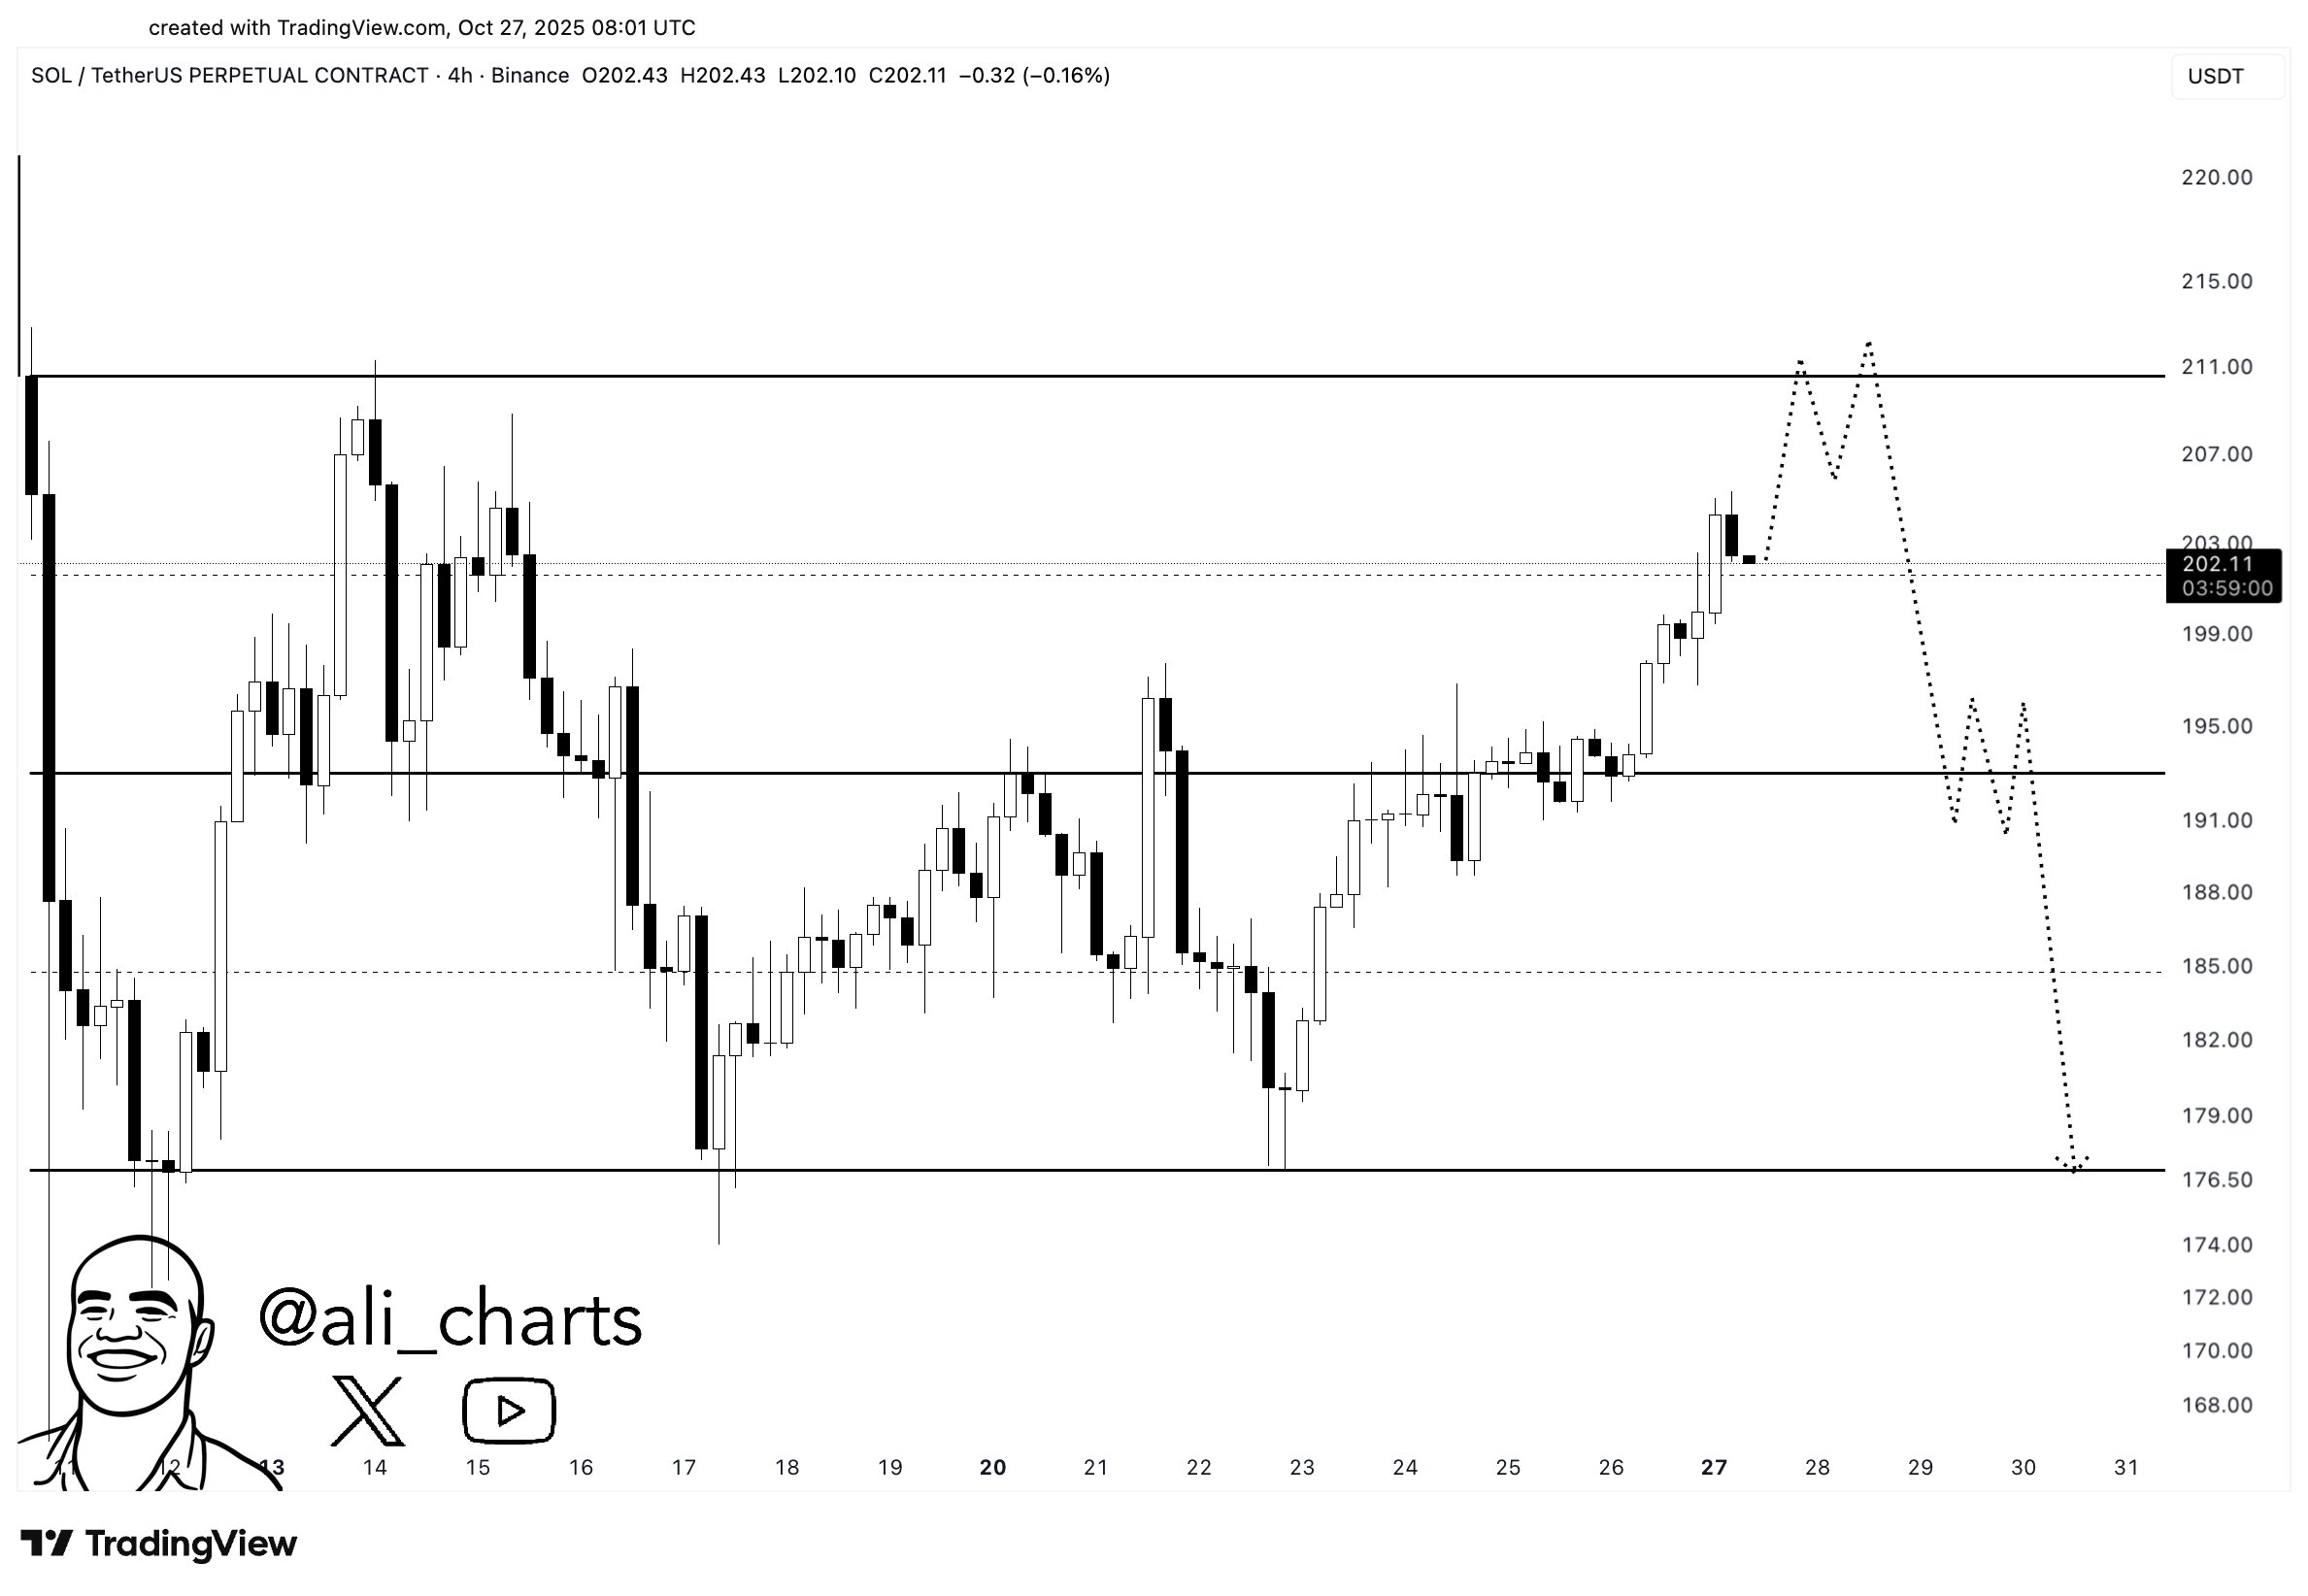
Now, here is the chart shared by Martinez that shows the Parallel Channel that the 4-hour price of Solana has been stuck inside for the last couple of weeks:

Solana Parallel Channel

As displayed in the above graph, Solana retested the lower level of the Parallel Channel last week and successfully found support. The cryptocurrency has since been rising and nearing the resistance level, located at $210. Considering the coin’s current trajectory, the analyst has noted that its price may be heading for a retest at $210 before making its next big move. However, the direction of such a move, if one happens, remains uncertain.

Given that the $210 level corresponds to the resistance line of the Parallel Channel, it’s possible that a retest could reject Solana all the way back down to the support level around $176. It’s also possible, though, that this retest could instead lead to a breakout. In this case, SOL could naturally see a sustained bullish push. It now remains to be seen which of the two scenarios will play out for the asset if the Parallel Channel holds and a retest takes place.

SOL Price

At the time of writing, Solana is floating around $200, up over 7.5% in the last seven days.

Solana Price Chart

❌