The RENDER price prediction 2025 narrative is heating up rapidly as Render Network tests a crucial make-or-break support zone. With the project continuing on Solana after migrating from ETH, its on-chain activity is quite holding up. This month’s market structure shows early signs of a potential breakout that could fuel a major rally into late 2025 and early 2026.
Render’s Solana Expansion Sparks Unusual Transfer Momentum
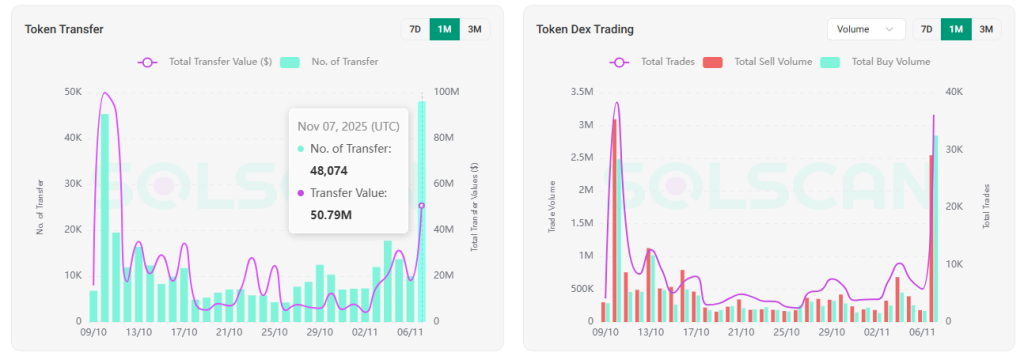
Render Network’s migration to Solana continues to inject strength into RENDER crypto. The shift, designed to benefit from Solana’s speed and low-cost execution, has accelerated network usage meaningfully this month.
According to SOLSCAN, RENDER token transfers jumped from 7,339 on November 2 (worth $4.25M) to an impressive 48,074 transfers worth $50.79M when writing. This surge represents a powerful expansion in network activity and confirms rising engagement with Solana-based RENDER tokens.
Similarly, DEX trading volumes are rising aggressively. Total trades shot up to 36,132 from this week’s low of 3,948, while buy volume has overtaken sell volume. When writing SOLSCAN showed Buy volume at $2.84 million and Sell volume at $2.54 million respectively.
This shift suggests that bears are beginning to lose control and a short squeeze may emerge if buyers dominate the order flow.
Liquidity Clusters Point Toward a Rapid Upside Path
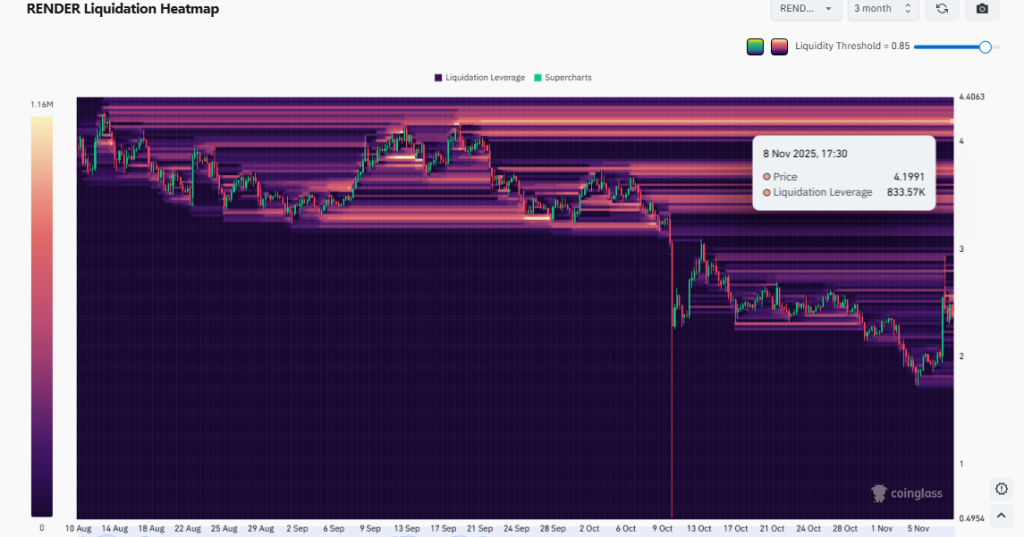
Moreover, the Coinglass liquidity heatmap chart show two key liquidity clusters that could act as magnets ahead for RENDER/USD.
First is $3.75 that has an 680.32k in liquidation leverage the second is at $4.19 that has 833.57k in liquidation leverage.
If bullish demand strengthens, prices often move toward these liquidity pools, accelerating upside movement.
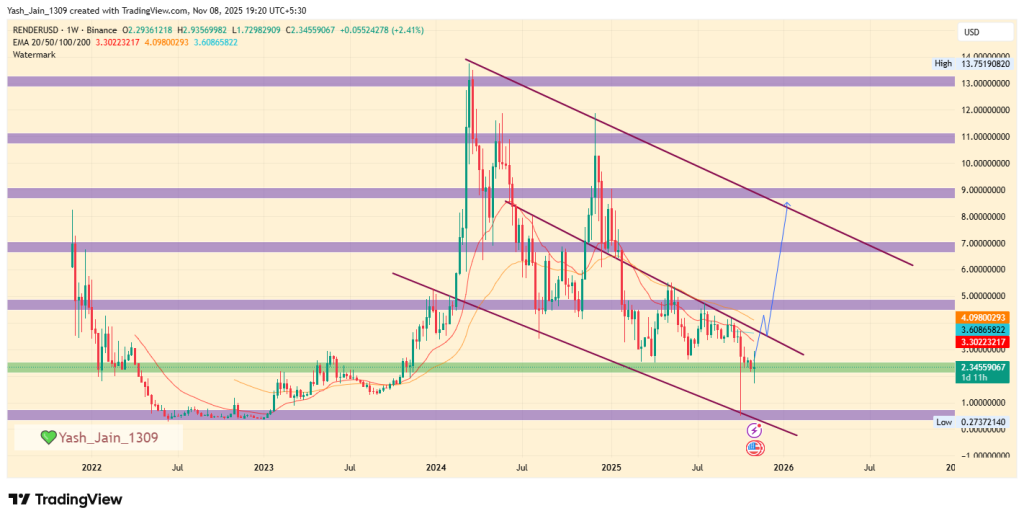
The RENDER price chart aligns with this outlook. The weekly pattern shows a broad downward wedge shaping price action since 2024, with current support holding around $2.00–$2.50, which is deemed as a historically valuable zone.
Should $4.19 flip with momentum, Render could target $9 before year end, with potential to revisit $13.75 in early 2026, reflecting the wedge breakout measured move.
Technical Indicators Show Early Accumulation Despite Mixed Momentum
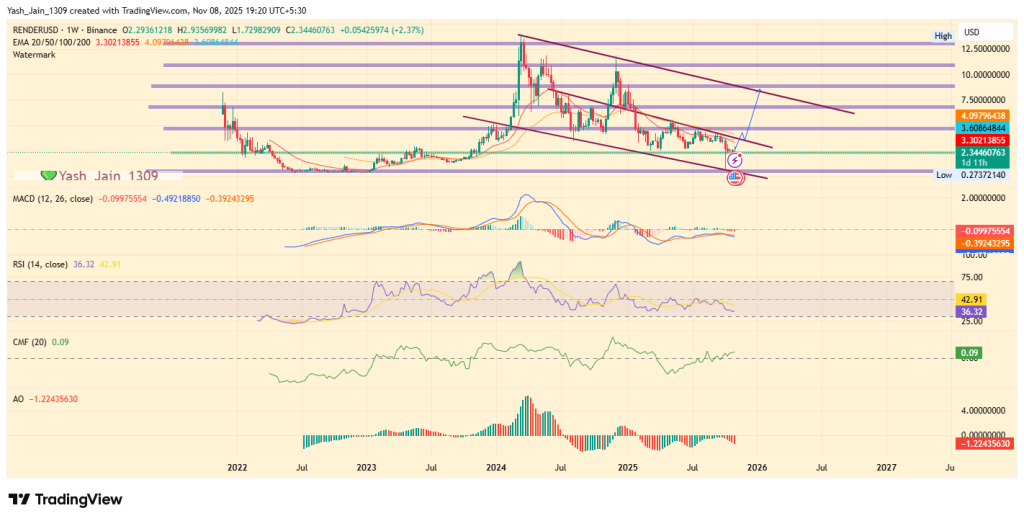
Additionally, its technical indicators still suggest a cooling phase on RENDER price USD, as RSI at 36.63 indicates oversold conditions may deepen toward 30.
MACD and AO remain muted, hinting at ongoing consolidation. However, the Chaikin Money Flow (CMF) at 0.09 shows increasing positive inflows, signaling accumulation beneath the surface.
These conditions often precede sharp rallies once supply thins and demand surges.
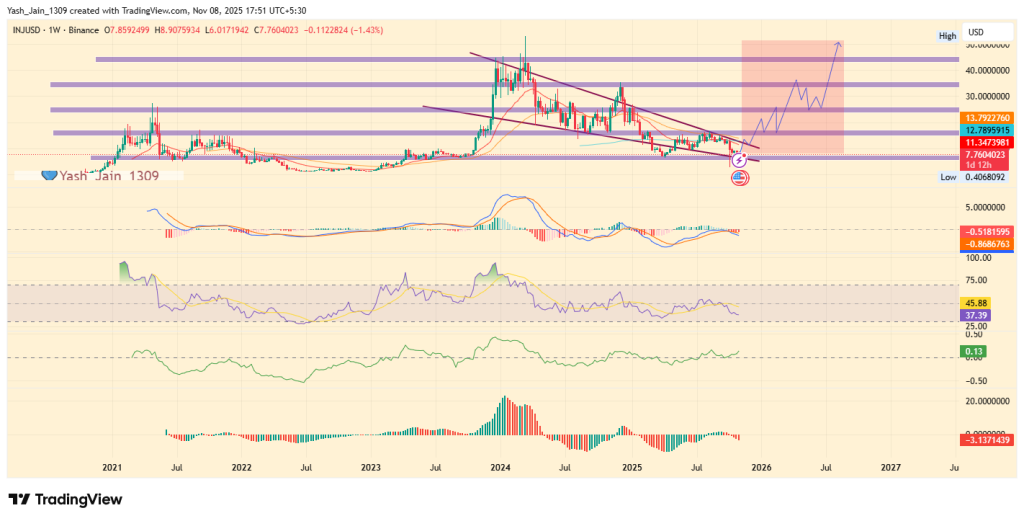
As the INJ price prediction 2025 draws new attention, Injective now trades in the critical $6–$7 multi-year support zone, a region that has repeatedly triggered strong reversals in its history. With bullish fundamentals, ETF anticipation, and a major network upgrade ahead, Injective appears positioned for one of its most important rebounds yet.
INJ at Multi-Year Support: A Historic Launchpad for Big Rallies
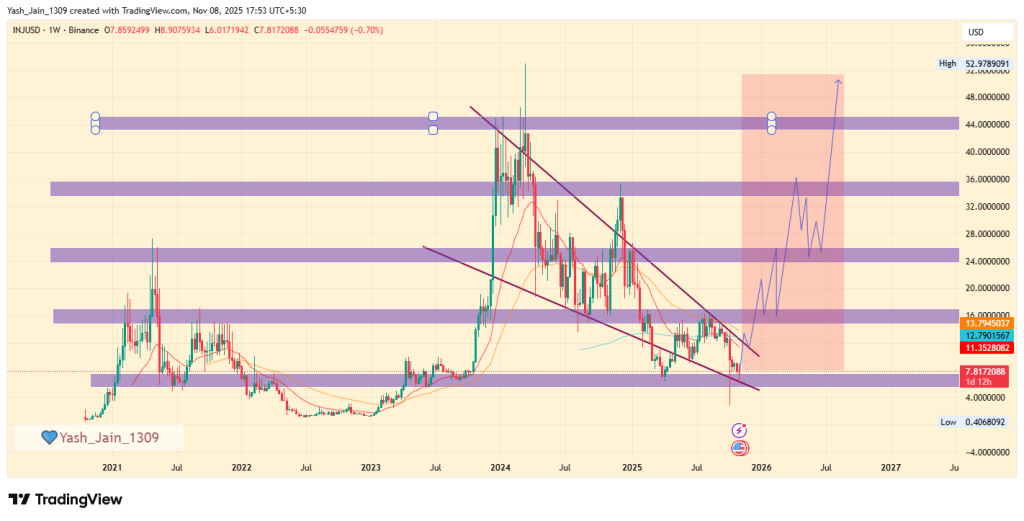
With INJ price today hovering near $7.81, Injective sits on a support range that has consistently acted as a long-term reversal zone. Its previous interactions with the $6–$7 area have produced sharp multi-week rallies, and traders now expect a similar response as the broader market stabilizes.
The technical structure also reinforces this outlook. The INJ price chart shows price compressing at the lower boundary of a long-term range, aligning with an decending wedge which is active since August 2024. While, historically, each touchpoint on this trendline has sparked rallies, creating optimism that a breakout toward $21 before year-end remains achievable.
Fundamental Strength: Injective Leads Development and Network Activity
This level of growth signals expanding network adoption and increasing developer confidence in the ecosystem. Rising activity often precedes aggressive price discovery, reinforcing the positive INJ price forecast 2025 outlook.
ETF Speculation and Mainnet Upgrade Build Bullish Momentum
Institutional interest is emerging strongly as well. In October, 21Shares filed an S-1 application with the SEC to launch the first-ever INJ ETF. Once the U.S. government resumes full regulatory operations, this filing will be reviewed, and the odds of approval appear promising.
ETF approval would unlock new liquidity channels, significantly expanding market access for Injective crypto. This mirrors how ETF inflows boosted Bitcoin and Ethereum earlier this year.
Meanwhile, Injective is preparing to launch its Altria Mainnet Upgrade (IIP 583) within the next five days. This upgrade is viewed as a major step forward and has amplified community expectations that momentum is shifting decisively bullish.
Everything changes forever in 5 days with the launch of the Injective mainnet.
Technical Indicators Point to Accumulation Before Expansion
Although long-term indicators look constructive, some technical tools still show mixed signals. The RSI near 37.50 indicates the market is cooling further, potentially dipping into a deeper undervalued zone near 30. MACD and AO remain subdued, suggesting consolidation is still underway.
However, the Chaikin Money Flow at 0.14 reveals growing positive inflows, hinting that accumulation is already happening beneath the surface. Once momentum flips bullish, INJ price USD has potential to revisit $21, extend toward $44, and possibly retest $52 ATH in 2026.
As these catalysts align, the INJ price prediction 2025 continues to strengthen, making Injective one of the most closely watched recovery plays in the market.
Price predictions suggest ALGO could reach $0.90 by the end of 2025.
Long-term forecasts indicate potential highs of $5.65 by 2030.
Algorand’s strong push for scalability, security, and decentralization is paying off. With the launch of AlgoKit 3.0 in Q1 2025 and growing developer interest, ALGO adoption has improved and is now on the rise. The rising adoption is beneficial for an asset, as it is directly proportional to a token’s price.
But the big question for intrigued market participants still remains: Can ALGO Price hit $1 this cycle? Read our in-depth Algorand Price Prediction 2025 and long-term outlook through 2030 to find out.
As per Coinpedia’s Algorand Price Prediction, the forecast for the Algorand network is optimistic for the coming years. With a potential altcoin market in Q1 2025, the ALGO coin price might skyrocket toward a new high.
If the network maintains the staggering growth, the ALGO coin price may reach $0.89 in 2025. Conversely, if the network fails to expand, then the price can flip into a bearish trap and dip to $0.45.
Year
Potential Low
Potential Average
Potential High
2025
$0.45
$0.67
$0.89
Algorand Price Analysis 2025
In Q4 2024, Algorand (ALGO) experienced a significant drive, reaching a high of $0.613, marking a remarkable 470% gain from the $0.1079 level.
However, the excitement was short-lived as a sell-off intensified in the final month of 2024, extending that into Q1 2025. By the first week of April, ALGO’s price plummeted to a low of $0.1491, which established a strong multi-year support area.
From the second week of April, the price action began to shift, forming a higher-high structure that indicated a recovery from the multi-year support level. By mid-May, Algorand’s price had climbed nearly 70% to $0.24 from the Q2 low of $0.150.
Unfortunately, this upward momentum was halted in mid-May as strong supply levels rejected further advances, pushing the price below the 200-day EMA band.
In the third week of June, ALGO returned to April’s low, finding support at the $0.15 level. At this point, the price was down 71% from Q4 2024’s high and 32% from mid-May’s peak. The risks were high, with indications that any short-term bearish pressure could lead to a drop to the 2024 low of $0.0943, breaching the $0.15 support.
However, everything changed last week in June, which was also the finishing week for H1. The momentum in H2 began with the blast.
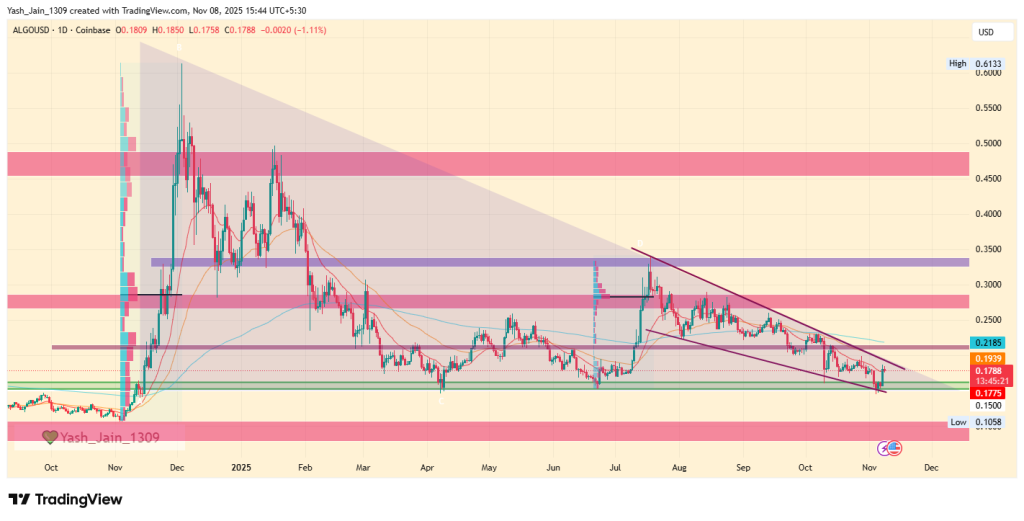
Algo Price Target November 2025
Algorand (ALGO) experienced a powerful surge to $0.34 in July before encountering the upper resistance border of a multi-month descending triangle pattern.
Since then, the price has been closely tracking this long-term pattern’s upper boundary, indicating a significant period of consolidation and ‘bleeding’ action August, September, and October.
The price range has been severely congested, which is a classic technical setup: the longer and more tightly the price recoils within a pattern, the greater the potential for an explosive breakout. This consolidation makes ALGO’s current price action particularly impressive and now in november early it has retested it multi year support that suggests a major move may be imminent, potentially arriving in November. By the end of this year, a significant trajectory could be recorded, similar to the late 2024 rally.
A renewed buying push around the $0.21 level could provide the momentum needed to power ALGO through the key overhead resistance at $0.28.
Also, on successfully holding a position above $0.28 would strongly signal a return and retest of the July high at $0.34. A decisive, sustained breach of the $0.34 resistance level would confirm a full pattern breakout and likely open the path toward the higher, mid-term target of $0.50.
Conversely, if the selling pressure intensifies and the price breaks below the critical support floor of $0.15, the bullish thesis would be invalidated. In this downside scenario, ALGO would likely seek the next major support level, or ‘lower floor,’ at $0.10.
Month
Potential Low ($)
Potential Average ($)
Potential High ($)
Algorand (ALGO) Price Forecast November 2025
0.18
0.30
0.34
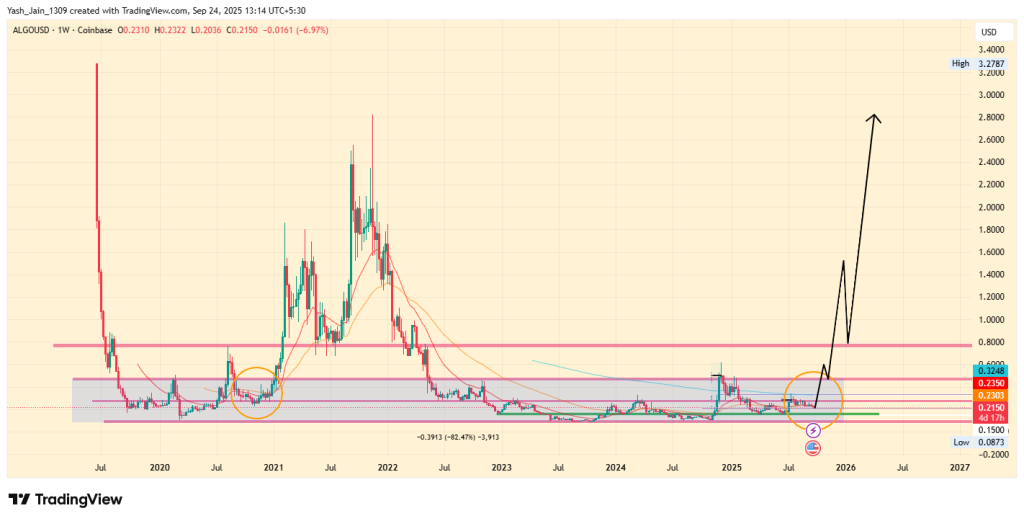
ALGO Price Analysis 2025
Over the last three years, Algorand (ALGO) has been in a sustained sideways trading range, which has slowly built an ascending broadening wedge pattern. This slow price action is in stark contrast to the parabolic growth it experienced in 2021.
This extended period of consolidation is clearly visible on the monthly chart, suggesting that the longer the price coils, the more powerful the eventual breakout could be.
Looking toward the second half of 2025, if demand for ALGO increases in direct proportion to its adoption, it could clear key resistance levels. With a surge in momentum, ALGO could aim for price targets of $0.60, $0.80, and potentially even $0.90 by year-end.
While these targets may appear ambitious given the current price, the macro-level chart analysis indicates that such a move is plausible if strong momentum returns to the market, especially given the increased institutional collaborations and retail adoption.
Year
Potential Low
Potential Average
Potential High
2025
$0.20
$0.50
$0.90
Algorand Price Targets 2026 – 2030
Year
Potential Low ($)
Potential Average ($)
Potential High ($)
2026
0.65
1.0
1.35
2027
0.90
1.50
2.00
2028
1.40
2.10
2.90
2029
1.75
2.95
4.15
2030
2.50
4.05
5.65
Algorand (ALGO) Price Forecast 2026
Moving forward to 2026, the ALGO price may record a maximum price of $1.35. With a potential low of $0.65, the average price could settle at around $1.0.
ALGO Coin Price Projection 2027
Looking ahead to 2027, the Algorand crypto token may range between $0.90 and $2.0. With this, the average trading price could settle at around $1.50 for the year.
Algorand Crypto Price Action 2028
In 2028, the ALGO coin with a potential surge could reach a high of $2.90, a low of $1.40, and an average of $2.10.
ALGO Token Price Analysis 2029
Moving into 2029, the Algorand coin could range between $1.75 and $4.15. Considering the buying and selling pressure, the average price could settle at around $2.95.
ALGO Price Prediction 2030
By 2030, the value of a single Algorand token could reach a high of $5.65, a low of $2.50, and an average of $4.05.
Market Analysis
Firm Name
2025
2026
2030
Currencyanalytics
$0.67
$0.97
$4.06
Priceprediction.net
$0.18
$0.258
$1.10
DigitalCoinPrice
$0.82
$1.28
$2.60
Never Miss a Beat in the Crypto World!
Stay ahead with breaking news, expert analysis, and real-time updates on the latest trends in Bitcoin, altcoins, DeFi, NFTs, and more.
FAQs
Is Algorand a good investment?
Yes, ALGO shows long-term potential with strong fundamentals, low fees, and a focus on scalability.
How high will Algorand price go in 2025?
ALGO is expected to reach up to $0.90 by end of 2025, driven by adoption growth and bullish market sentiment.
Is Algorand Proof-of-Stake (PoS) or Proof-of-Work (PoW)?
Algorand is the first network to bring a complete Proof-of-Stake (PoS) consensus mechanism.
What would be the possible maximum price of ALGO by the end of 2030?
ALGO may reach a high of $5.65 by 2030, supported by network upgrades and increased developer adoption.
How to buy Algorand?
Algorand can be traded on exchanges like Binance, Coinbase Pro, Huobi Global, and OKEx, amongst others.
If I had invested $100 in Algorand (ALGO) in 2020, what would it be worth now?
Considering you invested $100 in 2020 at the average price of $0.427, your investment would have decreased by 2.81% to $98.11.
The live price of the Hyperliquid crypto is $ 41.44934243.
The 2025 HYPE price suggests it could enter the top 10 cryptocurrencies by market cap with continued growth.
Forecasts suggest that HYPE could reach a potential average price by 2030 of around $125, with highs up to $185.
The crypto market is buzzing with excitement over Hyperliquid and its native token, HYPE. As a decentralized, paperless alternative to platforms like Binance and Coinbase, Hyperliquid is quickly gaining traction, prompting investors to look closely at the HYPE price prediction for 2025 and beyond.
With its unique “HyperBFT” consensus mechanism, lightning-fast transactions, and zero KYC hurdles, Hyperliquid is rewriting the rules of perpetual trading. But does its innovative model signal long-term growth for HYPE Token Price?
In this article, we dive deep into market sentiment and Hyperliquid price projections from 2025 to 2030.
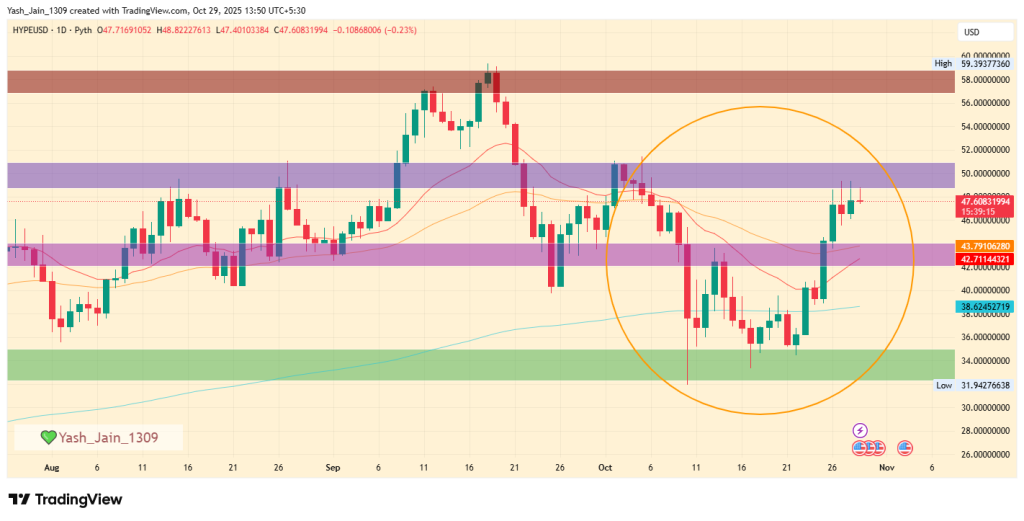
October was full of surprises. First, it crashed in the first half and recovered in the second half of the month, which seems like a strategic move to give institutions an edge over retailers.
As a result, it trades above all key EMA bands and testing the $50 hurdle once it clears the $59 could be revisited in November. However, failure to break past $50 would throw the HYPE price back to the $32 key support.
Month
Potential Low
Potential Average
Potential High
HYPE November 2025
$32
$39
$60+
Hyperliquid Price Analysis
The HYPE price began its journey in 2025 under bearish pressure, falling from $35 to $9.32 by April. Despite this, trading activity on the Hyperliquid platform notably increased, especially in major assets like BTC. This surge in volume helped HYPE reverse course mid-April, triggering a parabolic move.
By mid-June, HYPE reached $45.75, breaking resistance levels seamlessly. However, geopolitical tensions, specifically the U.S. threat to Iran on June 17, led to a broad market pullback. HYPE followed, dipping to $32 by late June.
A quick rebound occurred on June 21 – 22 as BTC dropped to $98K. Traders on Hyperliquid seized the dip, reviving platform volume and driving HYPE higher.
Hyperliquid Price Projection 2025
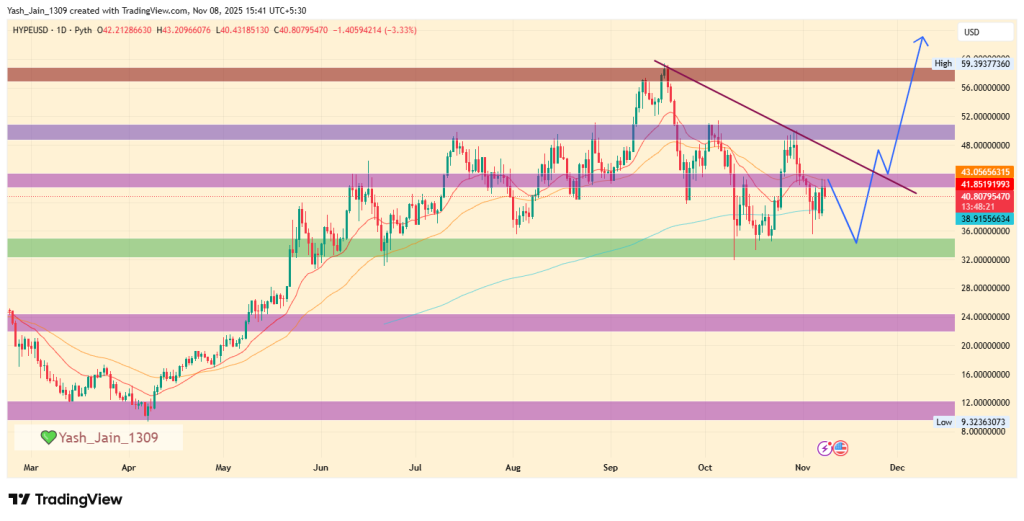
Hyperliquid (HYPE) capped an impressive Q3 2025 by reaching a new all-time high of $59 in September, but aggressive profit-taking quickly drove the price back down to the $32 key support level by early October, following a strong liquidation event on October 10th. After some consolidation, it attempted to rise again in late November but retreated from $49 after investors’ sentiment shifted following the Fed’s 0.25% BPS rate cut announcement.
The news became bearish instead of bullish, especially for the crypto sector, as they commented that the next rate cut in the future is not guaranteed, which immediately gave off risk-off sentiment vibes.
And in early November, the prices of altcoins and blue-chip cryptos took major hits, with HYPE shedding to $35, rejecting a decline from a trendline that aligned perfectly with the series of events that occurred.
The odds based on price action suggest that HYPE/USD seems to correct more and retake support from its strong foundational support of $32-$35 area that proved somewhat durable at times like this, and suggest that if a reversal could come in sessions ahead, then this could be the most ideal spot for it.
This suggests that November could see a short-term decline, but the month could end up green if it breaks out of the declining trend by sustaining above $43 before the month ends.
Meanwhile, the main rally could come in December, targeting $59 and potentially reaching $80.
However, if the $32-$35 key block fails to act as support any longer, then lower supports, such as $24, would become the key support level.
Year
Potential Low
Potential Average
Potential High
2025
$15
$35
$80
HYPE Price Analysis 2025: On-chain outlook
The Dune analytics dashboard provided an quick on-chain overview of the utility metrics of the Hyperliquid token (HYPE), which appears to be improving significantly with each passing month.
HyperEVM total transaction fees have surpassed 150K and are at an ATH, and total trading volume has crossed $3 trillion and is at an ATH. Even its revenue has reached an ATH, crossing $800 million.
All the major metrics suggest that it is experiencing great adoption among peers, and its on-chain metrics are proof of that, suggesting that if the rally occurs, then 2025 might end on very good numbers.
Hyperliquid Coin Price Targets 2026 – 2030
Year
Potential Low ($)
Potential Average ($)
Potential High ($)
2026
25
50
90
2027
40
75
105
2028
55
95
130
2029
85
110
155
2030
105
125
185
HYPE Price Projection 2026
By 2026, the value of a single Hyperliquid token price could reach a maximum value of $90 with a potential low of $25. With this, the average price could land at around the $50 level.
Hyperliquid Coin Price Prediction 2027
During 2027, the HYPE could reach a maximum value of $105 with a potential low of $40. Considering this, the average price of this altcoin could settle at around $75.
HYPE Crypto Price Action 2028
The Hyperliquid price could achieve the $130 milestone by the year 2028. On the flip side, the altcoin could record a low of $55 and an average price of $95.
Hyperliquid Price Analysis 2029
The HYPE crypto prediction for the year 2029 could range between $85 to $155 and the average price could be around $110.
HYPE Price Prediction 2030
Looking forward to 2030, the Hyperliquid Price may range between $105 and $185, and a potential average value of around $125.
Wondering how high could the ARB coin price go this altcoin season? Read CoinPedia’s Arbitrum Price Prediction to uncover the possibilities until 2030!
Market Analysis
Firm Name
2025
2026
2030
Binance
$37
$63
$164
DigitalCoinPrice
$76
$54
$97
*The aforementioned targets are the average targets set by the respective firms.
CoinPedia’s HYPE Price Projection
This Layer-1 project has taken the crypto market by storm within a short time frame. With a market cap of over $7 billion, this altcoin has successfully secured a position in the top 25. Moreover, with the mass adoption, this altcoin could claim a spot in the top 10 during the upcoming bull run.
If the bullish sentiment intensifies, the Hyperliquid price will reach a high of $41.39 this year. On the flip side, if the market experiences unfavorable events, this could result in this altcoin settling at a low of $14.65.
Hedera Price prediction highlights HBAR could reach $0.750 by the end of 2025 if bullish trends continue.
The Long-term forecasts suggest HBAR could hit $2.20 by 2030, indicating stable growth potential.
Hedera has been making waves in the cryptocurrency space, with a fast and secure blockchain that offers a distinct approach to transaction processing compared to Ethereum and other smart contract chains. It’s permission-only, meaning the blockchain is managed by private companies. Limiting what types of decentralised applications are allowed is what makes Hedera stand out from the rest.
Having entered the top 20 digital assets by market cap in 2024, it is now eyeing a potential leap into the top 10 by the end of 2025. Hedera has also recently ramped up its development activities for its ecosystem. Its ecosystem is strengthening, despite its capped price action. With increasing real-world use cases, institutional interest, and strategic partnerships, many are closely tracking HBAR price chart 2025 to gauge how high the token can rise.
With major companies like Google, IBM, and Chainlink Labs backing the project, and discussions about SEC approved HBAR ETF would flood string liquidity. Many are intrigued that: Will the HBAR Price Reach $1? Let’s discuss this in our Hedera price prediction 2025 article.
Hedera Price Analysis 2025: A Look Back at HBAR’s Volatile First Half
Hedera price USD began the year on a high note, peaking at $0.40 in mid-January before a steady decline took it to a low of $0.125 in early April. This downturn was caused by external factors and waning investor interest, reflected in a decrease in the Total Value Locked (TVL).
But this tide turned in the second week of April. As a broader crypto market rally helped HBAR price break free from the wedge, it bounced off a significant support zone that had previously fueled a late 2024 rally. This support, confirmed by the Fixed Range Volume Profile (FRVP) indicator, suggested strong institutional buying interest. The momentum propelled HBAR on a remarkable surge of nearly 80%, from $0.125 to $0.228 by mid-May
Unfortunately, this rebound was cut short by escalating geopolitical tensions, which pushed HBAR back to its April lows by the end of June. During this time, the price formed another parallel declining wedge.
Hedera Price Prediction 2025
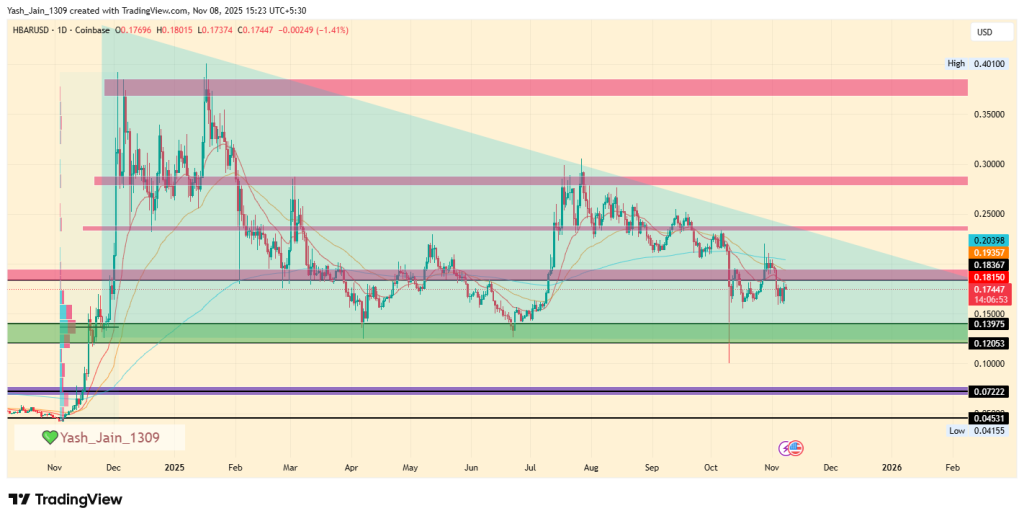
The second half of the year started strong, with HBAR posting a significant rally in July from the $0.12 to $0.14 demand zone up to $0.30.
However, this upward move was firmly rejected at a critical resistance point, which strongly aligned with the upper boundary of a descending triangle established since early 2025.
This rejection fueled a sharp decline throughout August and September, which worsened further with a critical liquidation event on October 10th, momentarily pushing the price below the demand zone to $0.10.
This dip was quickly absorbed by institutional buyers, leading to a recovery attempt that failed to flip $0.20 psychological resistance, but after a decent consolidation below this hurdle buyers accumulated it and on October 28th it saw an near 20% rise that pushed its price to $0.22, this occurred as the much-anticipated launch of the Canary HBAR ETF (HBR) on Nasdaq opened the doors for institutional investors.
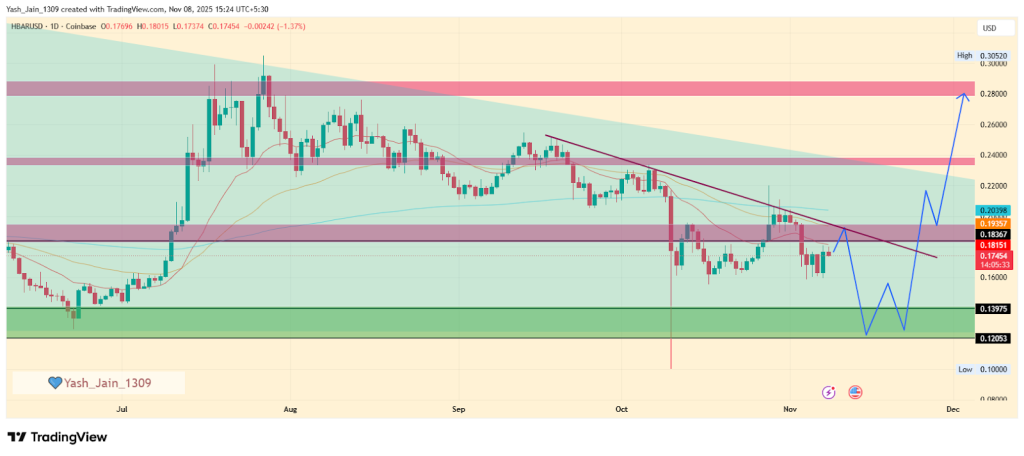
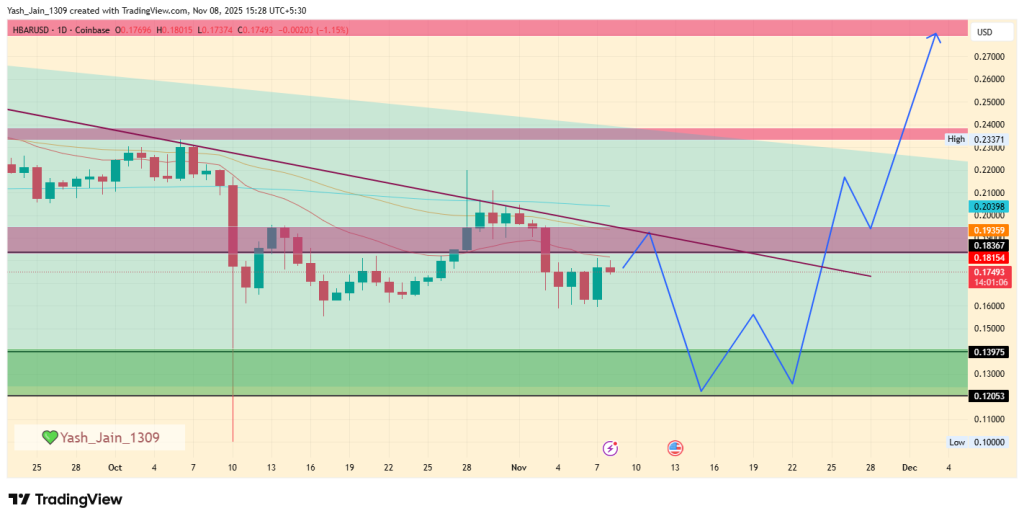
However, the bears capped momentum again due to uncertainty about the Fed’s future rate cut. This pushed HBAR/USD to $0.16 in early November and is now consolidating, waiting for the right moment to regain its position.
However, there is still strong odds that HBAR might retest a focal key support around $0.12-$0.14, as it did in the past to meet demand from bulls. It is evident in November 2024, April 2025, and June 2025. For a strong-based reversal on the north side, HBAR must find its support at this zone again, which could be a possibility for November to see a more short-term decline, but that could shift the bullish outlook more firmly.
Also, for price to rally, HBAR/USD needs to clear the short-term resistance at $0.24 and aim for $0.30. Once it sustains above $0.30 with a daily close, then the year-end target could be near $0.40. This seems to rule out this possibility, as its price action appears to be less strong than it would have been from $0.12-$0.14 range.
HBAR Price Prediction November 2025: What’s Next for Hedera?
The HBAR price in November displayed an unusual start, with bleeding price action caused by risk-off sentiment due to the Fed’s uncertainty regarding upcoming plans for future rate cuts. This created cautious sentiment in the financial sector, and the crypto sector was severely affected, resulting in HBAR suffering despite its strong fundamentals.
The price action appears to be heading down to retest the $0.12-$0.14 key support area, aiming to regain a solid foundation for another rally to begin. It is possible that November could see gains, but more optimism is hinted at for next month.
Month
Potential Low
Potential Average
Potential High
HBAR Price Prediction November 2025
$0.125
$0.27
$0.40
HBAR Price Prediction 2026 – 2030
Year
Potential Low
Potential Average
Potential High
2026
$0.45
$0.80
$1.05
2027
$0.60
$0.95
$1.20
2028
$0.65
$1.10
$1.40
2029
$0.70
$1.35
$1.60
2030
$0.95
$1.70
$2.20
HBAR Price Prediction 2026
Moving forward to 2026, forecast prices and technical analysis project that Hedera’s price is expected to reach a minimum of $0.45. The price could escalate to $1.05 on the higher end, with an average trading price hovering around $0.80.
HBAR Price Forecast 2027
Looking ahead to 2027, the optimism around Hedera will lead to steady growth. Hence, the HBAR price is forecasted to reach a low of $0.60, with a potential high touching $1.20 and an average forecast price of $0.95.
Hedera Price Forecast 2028
As we advance to 2028, with moderate gains, the HBAR predictions indicate that the price of a single HBAR could reach a minimum of $0.65, with the ceiling potentially rising to $1.40. Within the range, the average price will be $1.10.
HBAR Price Target 2029
By the time 2029 rolls around, it’s predicted that Hedera’s price will maintain its upward trajectory, reaching a minimum of $0.70, with the maximum price possibly reaching $1.60 and an average of $1.35, reflecting cautious optimism.
Hedera Price Prediction 2030
By the end of this decade, HBAR is predicted to touch its lowest price at $0.95, aiming for a high of $1.70 and an average price of $2.20. Hence, the prediction suggests stable long-term growth for Hedera’s market value.
Market Analysis
Firm
2025
2026
2030
Changelly
$0.259
$0.370
$1.74
priceprediction.net
$0.27
$0.40
$1.99
DigitalCoinPrice
$0.43
$0.50
$1.07
Coinpedia’s Hedera Price Prediction
By the end of 2025, the recovery run in HBAR prices is expected to continue with a gradual rise in momentum. Hence, by the end of 2025, Coinpedia’s HBAR price forecast expects a potential high of $0.80 with a solid support at $0.40, making an average of $0.60.
Year
Potential Low
Potential Average
Potential High
2025
$0.40
$0.60
$0.80
Never Miss a Beat in the Crypto World!
Stay ahead with breaking news, expert analysis, and real-time updates on the latest trends in Bitcoin, altcoins, DeFi, NFTs, and more.
FAQs
Is HBAR investment a profitable one?
Yes, the stout fundamentals of the network make HBAR a good investment, but for the long term.
What price can HBAR reach by the end of 2025?
Analysts forecast HBAR could peak at $0.75 by the end of 2025, with averages near $0.40 and lows at $0.15.
How many transactions can Hedera process in one second?
The network can process over 10,000 transactions in one second.
How high will the HBAR price climb by the end of 2030?
By 2030, HBAR is forecast to reach highs of $2.20, averaging around $1.70 with lows near $0.95.
Where can I trade HBAR?
HBAR is available for trade across leading cryptocurrency exchange platforms such as Binance, Coinbase, Zebpay, etc…
As the Aptos price prediction 2025 gains momentum, investors are revisiting APT’s long-term value following a period of significant price decline. With Aptos crypto trading above $2.50, alongside strong fundamentals such as rising revenue, good TPS performance, and other positive user metrics, the project appears primed for a significant recovery as fundamentals strengthen across the ecosystem.
APT’s Current Scenario Mirrors ICP’s Recent Breakout
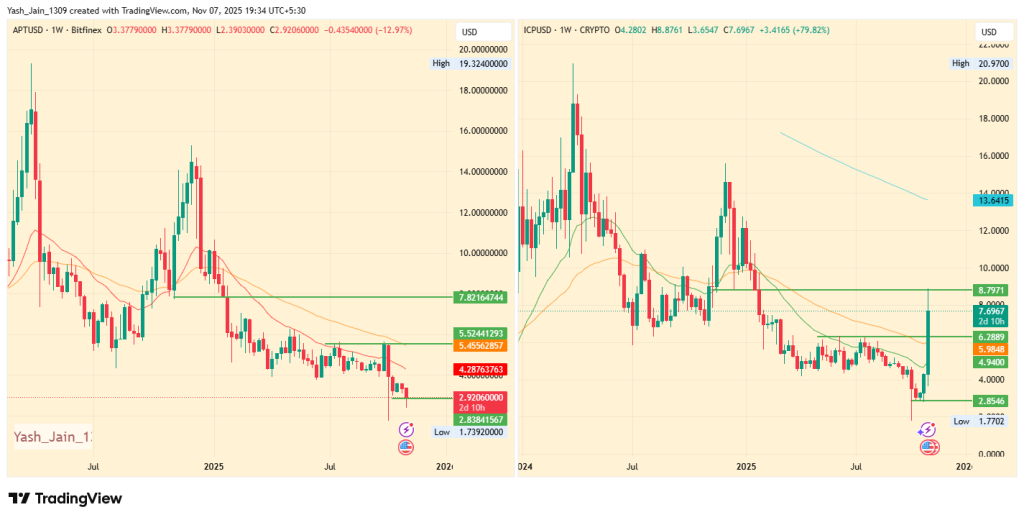
Recent market attention has shifted toward base-layer protocols that operate as foundational infrastructure for decentralized applications. Following ICP’s explosive early-November rally from $2, many now expect Aptos crypto to follow a similar trajectory, given its comparable utility as a high-performance base layer.
Similarly, in another post shared on October 31, sentiment pointed to a clear disconnect between fundamentals and valuation. APT price is currently sitting at its lowest valuation in the past four years, despite continuous ecosystem expansion. The post suggests that sentiment could recover soon.
Based on this, the post stated, a move toward $5–$6 in the coming sessions could be possible if momentum persists. Additionally, a price of $8-$10 is a possibility if a similar price recovery is observed, as ICP has recently demonstrated.
During market corrections, projects are massively mispriced.
It will take some time, but then, they'll come back to their fair value. $APT is one of them.
They are on the lowest valuation in the past four years, however, they keep expanding significantly with their entire… pic.twitter.com/vp1c2YVsTz
Fundamental Growth Signals the Early Phase of a Comeback
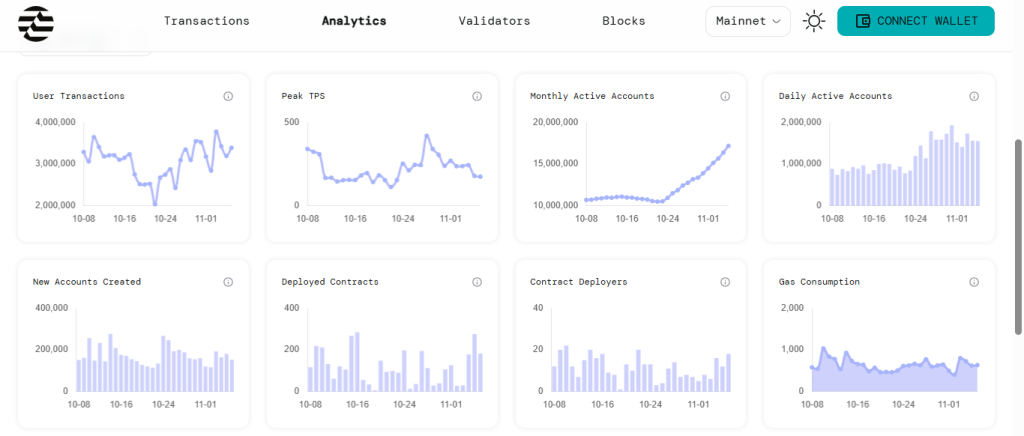
Another post highlights recent data that suggests that APT’s fundamentals are strengthening at an impressive pace. Application revenue has climbed steadily throughout the year, peaking in October, with expectations of hitting a new all-time high by mid-November.
Meanwhile, other on-chain activity continues expanding like user transactions rose from 2 million to 3.3 million over the past 30 days.
Similarly, the Monthly active accounts jumped from 10.5M to 17.17M, demonstrating powerful user growth. Also, daily active accounts remain above 1.5M, reflecting strong network engagement.
This level of user activity is rarely seen in tokens trading in a continuous multi-month downtrend.
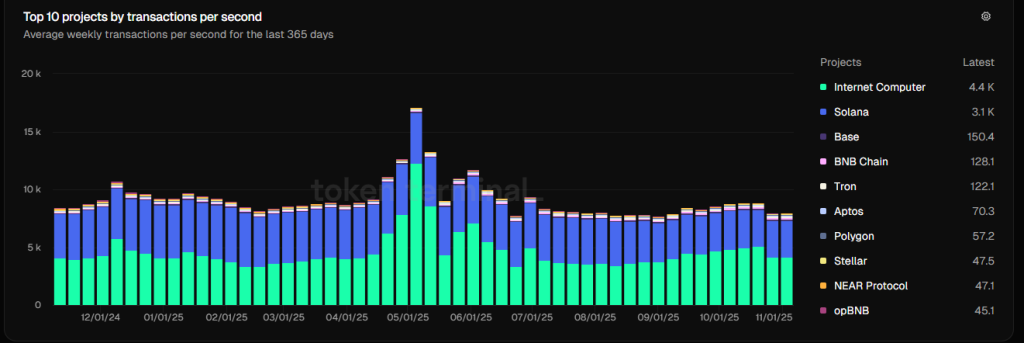
High TPS Ranking Enhances Long-Term Outlook
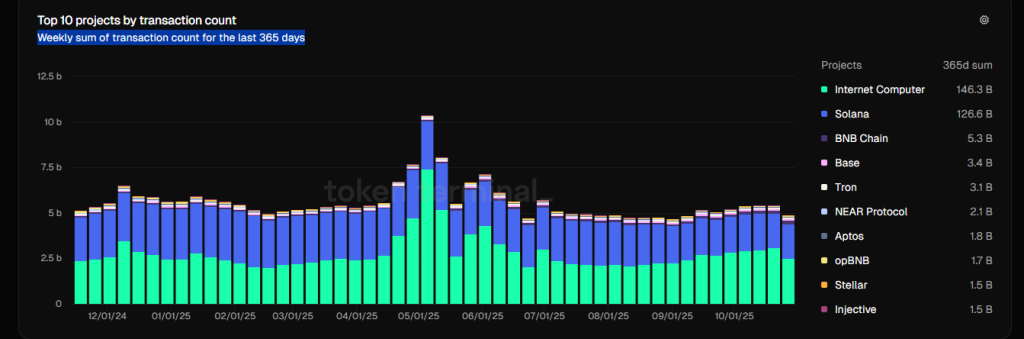
Moreover, the Token Terminal’s data places Aptos among the top 10 blockchains by transactions per second (TPS). Ranked 6th globally at 74.1 TPS, APT crypto stands among the most efficient smart contract platforms based on average weekly throughput over the last year.
This performance underscores why many believe the current Aptos price chart does not reflect the project’s true strength. High TPS, growing adoption, and rising revenue create a compelling backdrop for the Aptos price forecast heading into 2025.
With APT consolidating near $2.50- $3.00, it shows similarities to ICP before its explosive run. According to the Aptos price prediction 2025 outlook, the market may be approaching a turning point where fundamentals are outweighing short-term sentiment.
NEAR protocol that ranks among the Top 10 networks by TPS, yet its token is underperforming. However, it has now reached a critical juncture that could prove to be a decisive make-or-break point. This makes NEAR Protocol Price Prediction 2025 opinions more important at this crucial time for investors and traders alike. As its on-chain activity has drawn renewed attention to the NEAR/USD topic, investors are closely watching the network’s accelerating usage metrics, which continue to rise despite a stagnant market trend.
With trading volume, active users, and fees hitting multi-year highs, NEAR’s foundation appears stronger than ever, suggesting its price may eventually catch up to its underlying growth. This suggests that the NEAR Protocol price may surge significantly this time. Continue reading to know more.
NEAR’s Adoption Surges as Usage Skyrockets Across the Ecosystem
While the NEAR protocol price today may not fully reflect the network’s fundamentals, its adoption metrics highlight a powerful long-term trajectory. Trading volume surged from $24 million in March to $1.7 billion in October, marking a dramatic 7,000% increase that signifies expanding capital flow into NEAR-based applications.
$NEAR trading volume rapid growth lately@NEARProtocol trading volume has grew from $24M in March – $1.7B in October ( 6,983% growth within 8month)
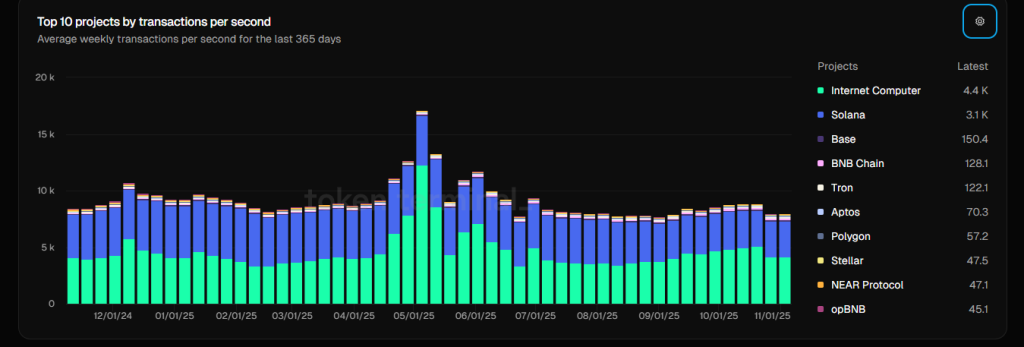
Similarly, Token Terminal ranks NEAR crypto among the top 10 blockchains by transactions per second (TPS), placing it 9th at 47.1 TPS, based on average weekly transactions per second over the last 365 days. This positions the network among the most efficient smart-contract platforms globally.
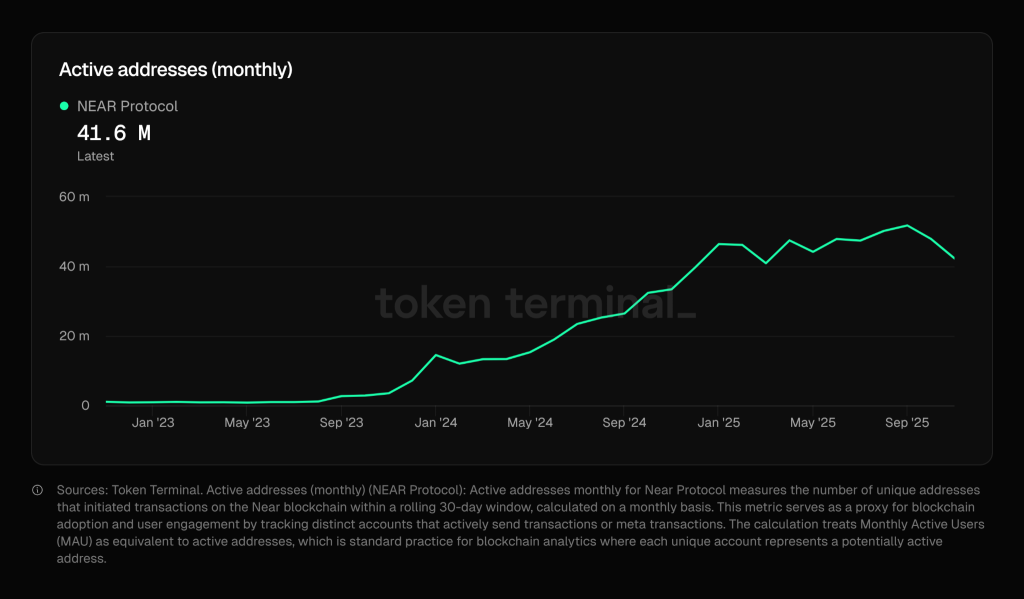
Meanwhile, monthly active addresses have grown from 3.5 million in November 2023 to 42.3 million in November 2025, demonstrating a remarkable rise in user adoption over two years. Even during periods when NEAR protocol price USD underperformed, the network’s ecosystem continued flourishing with consistent user engagement.
Fees, Users, and Network Strength Highlight True Fundamental Growth
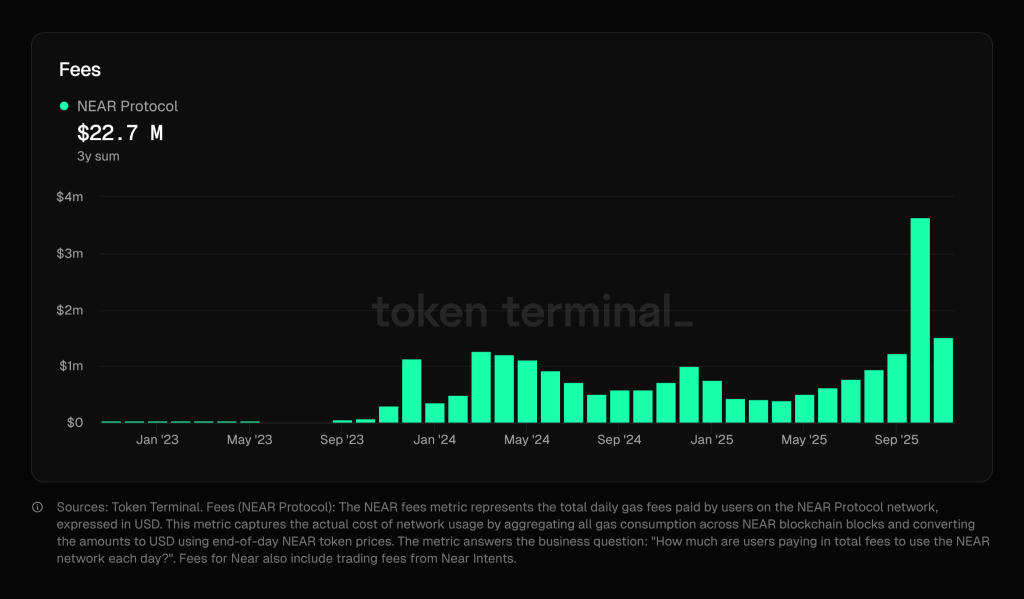
One of the most notable signs of strengthening fundamentals is fee generation. Over the past three years, total accumulated fees have reached $22.7 million, with October 2025 recording a single-month high of $3.641 million. In just the first seven days of November, fees have already reached $1.521 million, indicating persistent and accelerating usage.
These rising fee flows support the broader NEAR protocol price forecast, suggesting that ecosystem demand is not only real but compounding over time. As more users transact, build, and deploy applications on NEAR, the long-term value narrative becomes increasingly compelling.
Technical Structure Points to a Critical Reversal Zone
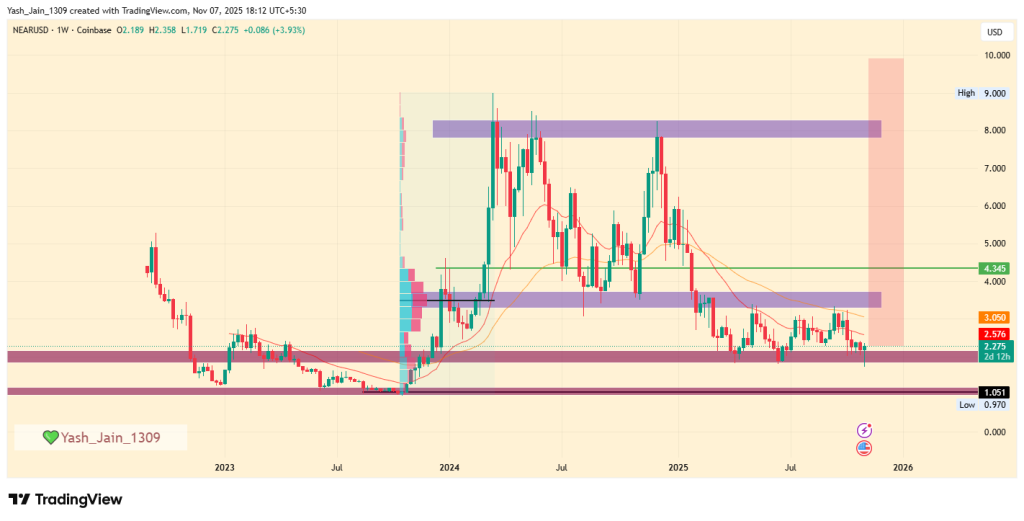
Despite strong fundamentals, the NEAR/USD price has remained under pressure, grinding lower toward the crucial $2 support range. Yet, this level may be forming one of the most important accumulation zones in its recent history.
Investors appear to be strategically accumulating NEAR at current levels, treating this zone as the “final chance before the plane departs.” If NEAR holds at $2 and sentiment strengthens, the NEAR protocol price chart suggests a potential 350% surge toward $10 similar to the explosive momentum seen in early 2024.
However, if consolidation persists and the token briefly slips below $2, the likely outcome is an extended accumulation phase through the end of 2025, shifting any major bullish breakout into early 2026.
As momentum, adoption, and usage continue expanding, the NEAR Protocol Price Prediction 2025 narrative increasingly aligns with long-term growth rather than short-term noise.
FAQs
What is driving NEAR Protocol’s growing adoption in 2025?
NEAR’s adoption is rising due to higher TPS, surging active users, and increasing fees, all showing real ecosystem demand even as the wider market remains flat.
Why is NEAR’s price underperforming despite strong fundamentals?
Price lags usage because market sentiment is weak, but on-chain growth suggests NEAR may be in a long accumulation phase before reflecting its fundamentals.
Can NEAR Protocol reach $10 by 2025?
A move toward $10 is possible if NEAR holds support and momentum returns, though a longer consolidation could delay major upside into 2026.
What indicators suggest NEAR has long-term growth potential?
Rising TPS, record fees, and expanding active users show strong ecosystem health, supporting NEAR’s long-term value outlook beyond short-term price swings.
 (@injective)