Reading view

Monero Price Rebounds at Channel Support: Is XMR Headed Back Toward $500?

Monero Price Prediction January 2026: The Privacy Sector Giant Prepares for a $1,000 Run

The post Monero Price Rebounds at Channel Support: Is XMR Headed Back Toward $500? appeared first on Coinpedia Fintech News

Monero (XMR) is showing early signs of stabilization after a prolonged decline, rising over 3% on the day as price reacts from a technically significant support zone. The bounce comes at a critical moment, with XMR retesting the lower edge of a multi-week rising channel while broader crypto markets remain fragile. This creates a familiar dilemma: Is the move simply a relief bounce inside a weakening trend, or the early phase of a rotation back toward the upper channel near $500?

Monero Price Defends Channel Support: Reversal Imminent?

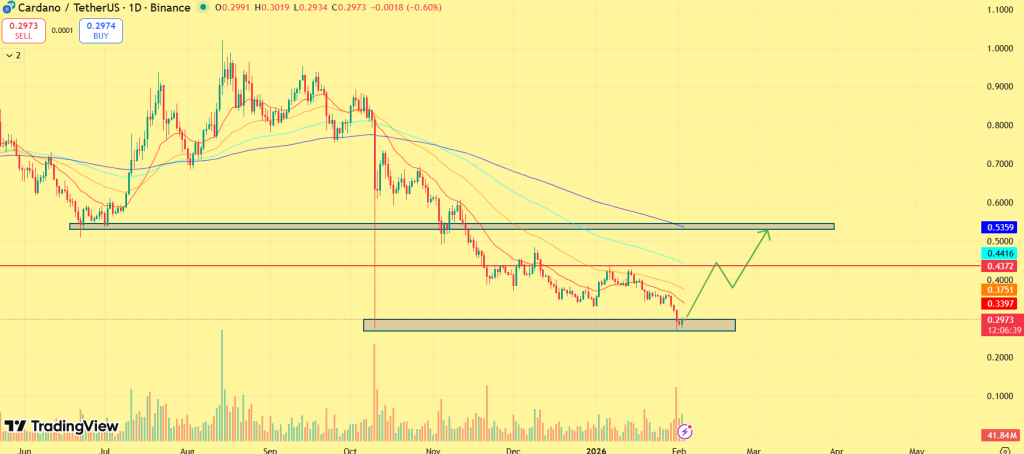
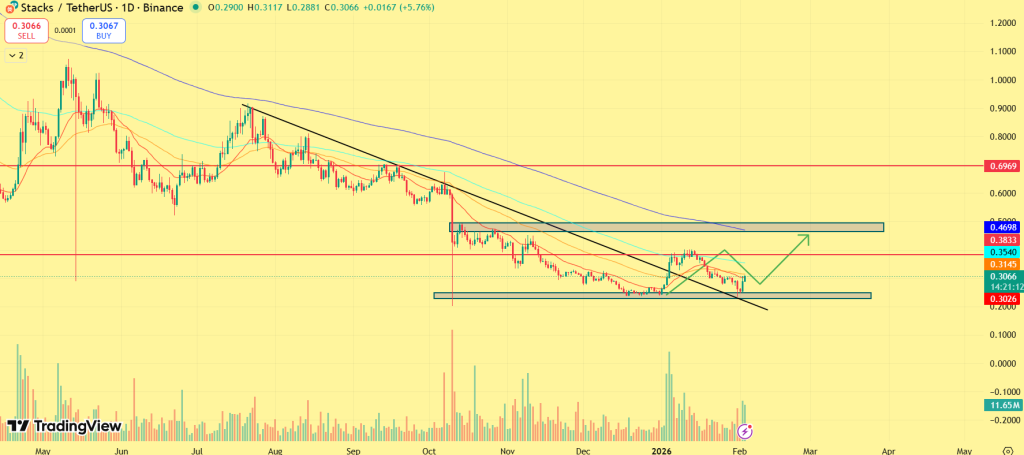
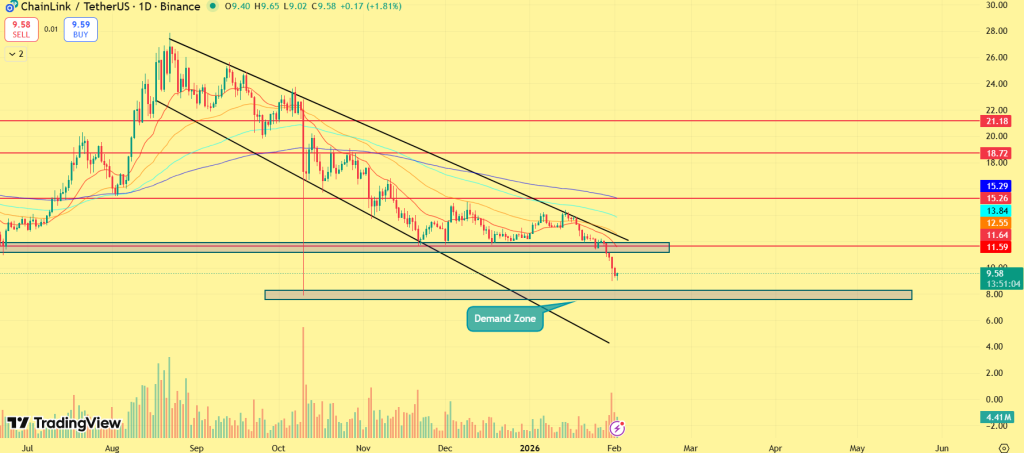
Monero’s price has defended the channel support zone of $380 and showed a pullback during the intraday session. This bounce has remained orderly rather than impulsive. As XMR approached the lower edge of the channel, selling pressure slowed gradually, with downside wicks expanded, suggesting sellers are no longer in control at current levels. Technically, the $360-$380 region has emerged as a demand zone.

Monero price chart

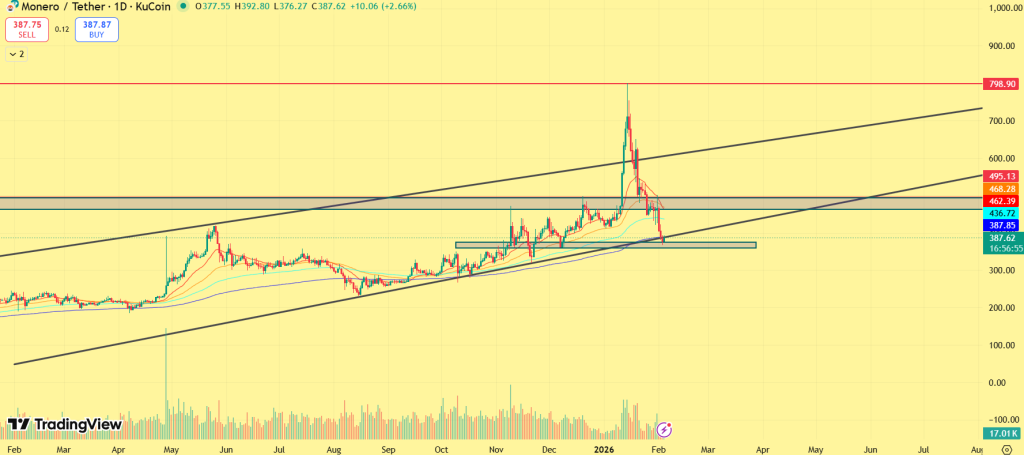
As long as Monero price holds above this zone, the broader channel structure remains intact. The immediate test now lies at $390-$400, where sellers placed their positions. A strong break of this region would shift the corrective structure to neutral-bullish, opening the door toward $420-$450. While further strength above the 50-day EMA mark could extend the recovery toward the $480-$500 zone back into focus as a rotational target rather than a distant hope. On the other side, a break below $360, however, would invalidate the channel and expose deeper downside making the current bounce technically decisive.

Open Interest and Liquidation Map Point to Short-Covering Risk

Derivatives data adds weight to the rebound scenario. Monero’s future open interest has risen above $142 million, up more than 4% even as price stabilizes, a sign that traders are adding exposure, not exiting. This increase in open interest alongside price rise often signals shorts being forced to defend positions, especially when price sits near crucial support. 

XMR Liquidation map

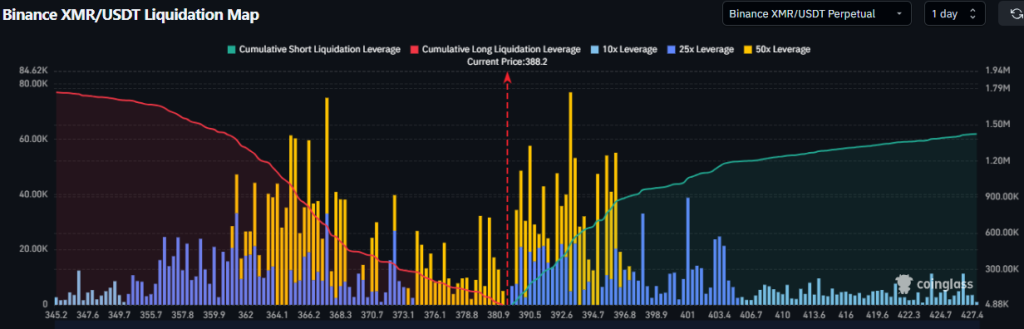
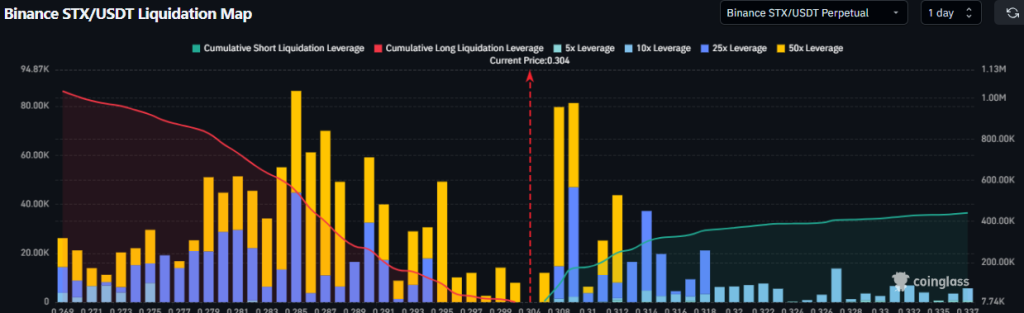
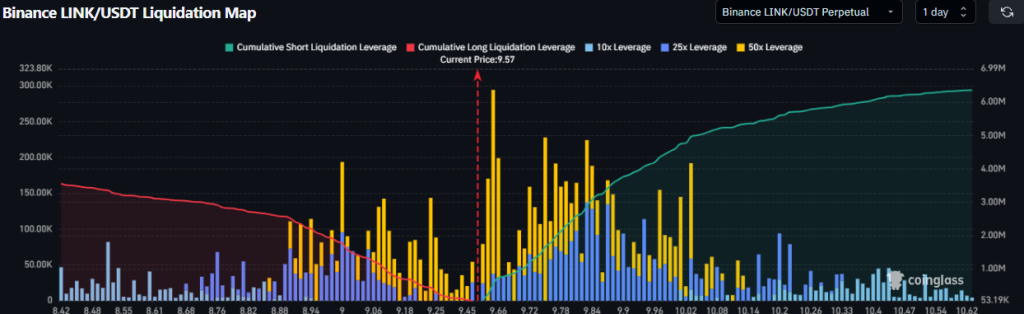
Liquidation heatmap data shows a clean cluster of short liquidation levels stacked above the current range, particularly between $390 and $410. If XMR price pushes into this zone, forced short closures could accelerate upside momentum, turning a slow rebound into a sharp squeeze. At the same time, downside liquidation pressure appears relatively thin below current price levels, reinforcing the idea that sell-side leverage has already been flushed during the prior decline.

Broader Context Keeps Reversal in Check

Despite the improving micro-structure, Monero is still trading within a broader environment of risk aversion, where capital remains selective and volatility elevated. Privacy-focused assets have lagged during recent market weakness, making confirmation, not anticipation. This means the rebound needs a follow-through, not just reaction. Without acceptance above reclaimed resistance, the move risks fading into another lower-high sequence. As XMR price remains at a decision point, holding above the support zone of $360 keeps the path toward $400-$420 viable.

ADA Price Holds Firm After ETF Filing Sparks Institutional Interest: Can Cardano See a Recovery Ahead?

ADA price

The post ADA Price Holds Firm After ETF Filing Sparks Institutional Interest: Can Cardano See a Recovery Ahead? appeared first on Coinpedia Fintech News

Cardano price extended higher in today’s session as traders reacted to a regulatory development that adds a new dimension to ADA’s short-term outlook. After weeks of compression and downside pressure, price action has begun to stabilize as Cardano-linked ETFs surfaced in the U.S. Rather than triggering an impulsive spike, the news coincided with controlled accumulation, hinting that the market may be repositioning rather than chasing. That subtle change sets the stage for a more consequential question: Is ADA transitioning from correction to recovery?

ETF Filing Puts Cardano Back on the Institutional Radar

The catalyst came from a filing submitted by Volatility Shares Trust, which registered Form N-1A amendments covering spot Cardano ETF exposure, alongside 2x and 3x leveraged Cardano ETFs. The products are designed to track ADA’s daily performance and remain subject to regulatory approval, but the structure itself matters. This is not an approval event, yet it signals something important. Issuers typically prepare filings only when they believe market demand and regulatory conditions are worth testing. Including both spot and leveraged variants suggests expectations of sustained liquidity and active trading interest, not just a short-lived narrative.

NEWS: 🇺🇸 Volatility Shares Trust filed N-1A for 3 Cardano $ADA ETFs.

The filing include Cardano ETF, 2x leveraged Cardano ETF and 3x leveraged Cardano ETF.

Now pending regulatory approval. pic.twitter.com/chZY4NdxmN

— Cardanians (CRDN) (@Cardanians_io) February 3, 2026

From a market perspective, such filings tend to work less as instant price triggers and more as sentiment resets. They introduce optionality. Investors begin pricing in the possibility of regulated exposure, which can alter medium-term positioning even before any decision is made. That backdrop helps explain why ADA’s reaction has been controlled rather than euphoric.

ADA Price Tests Key Demand Zone: Reversal Imminent?

Cardano’s price action has entered a critical phase after breaking down from its prior trading range and sliding into a well-defined demand zone. The latest rebound shows a controlled accumulation and the market is reassessing whether ADA can see a recovery in the short-term. As Cardano price reached its make or break zone near $0.300, downside follow-through has weakened, with tighter candles and reduced extension lower. This behaviour typically signals seller exhaustion rather than renewed bearish conviction. 

ADA Price

The structure forming inside the demand zone is notable. Rather than a sharp bounce, ADA appears to be building base, hinting at a potential transition from a trending phase into consolidation. If ADA holds the demand zone, it may rotate toward the 50 day EMA area of $0.4300 followed by 200-day EMA zone of $0.500 in the near term. For now, ADA is at a crucial decision point, either confirming a structural base for a recovery attempt of failing support and extending the broader corrective trend. The next directional move will depend entirely on how price behaves around this demand zone.

FAQs

Why is the Cardano (ADA) price rising today?

ADA is moving higher after ETF filings linked to Cardano surfaced, improving sentiment and encouraging controlled accumulation near key support.

What does the Cardano ETF filing mean for ADA?

The filing signals growing institutional interest. While not approved yet, it increases the chance of regulated exposure and longer-term liquidity.

What are the key resistance levels for ADA next?

If support holds, ADA may target the 50-day EMA near $0.43, followed by the 200-day EMA around $0.50.

Is Cardano shifting from correction to recovery?

It’s possible. A sustained hold above the demand zone would support a recovery, while a breakdown would extend the broader correction.

Stacks (STX) Price Up 20% Today: Is a Trend Reversal Finally Forming?

stacks

The post Stacks (STX) Price Up 20% Today: Is a Trend Reversal Finally Forming? appeared first on Coinpedia Fintech News

STX price staged a sharp intraday recovery, climbing close to 18% after weeks of persistent downside pressure. The rebound unfolded during a session marked by improving risk appetite across select altcoins, but STX stood out as price reacted decisively from a compressed range near recent lows. The move was not gradual, as STX price accelerated higher after absorbing sell orders clustered below the $0.30 region, an area that had repeatedly acted as short-term support. Once that supply was cleared, STX pushed higher in a single directional move, signaling a shift in near-term market control.

The recovery has pulled STX away from its local bottom, placing price back into a technically important zone where prior breakdowns occurred often the first area traders watch to assess whether a bounce has follow-through potential.

STX Price Breakout Retest Keeps Upside Structure Intact

STX price action is now shifting into a post-breakout retest phase, a behaviour typically seen after aggressive trendline breaks. After clearing the descending trendline that capped the token upside for weeks, STX did not extend vertically. Instead, it pulled back in a controlled manner to retest the former resistance as new support, a structurally constructive signal. On the chart, Stacks price is compressing above the reclaimed zone, with higher lows rather than slipping back into the prior range. This suggests sellers are failing to regain control, while buyers are defending the breakout level with reduced volatility.

STX price chart

If STX price continues to hold above this retest area, the structure opens the door for a continuation move toward the $0.45-$0.50 region. A clean push above the local consolidation zone would likely trigger momentum-driven participation, especially given the earlier short-side pressure. Failure of the retest, however, would delay the bullish thesis and push STX back into range-bound behaviour rather than invalidate the broader recovery.

Futures Market Data Outlook

Derivatives positioning played a key role in today’s rally. Liquidation heatmap data shows dense short liquidity stacked between the $0.30 and $0.32 range, levels that were swept as price moved higher. As STX crossed into this zone, forced short exits amplified upside momentum rather than organic spot demand leading the move. 

STX liquidation

Furthermore, the open interest surged alongside price, indicating fresh positions entering the market instead of leverage being flushed out entirely. This matters. Moreover, exchange data further shows short exposure outweighing longs near the lower range, leaving additional downside protection for price as long as STX holds above reclaimed intraday levels.

ZIL Price Explodes Over 70% as Zilliqa’s Network Upgrade Sparks Momentum

CNBC Names XRP the Top Crypto of 2026

The post ZIL Price Explodes Over 70% as Zilliqa’s Network Upgrade Sparks Momentum appeared first on Coinpedia Fintech News

ZIL price surged more than 70% today, marking one of its strongest single-day performances in months. The rally unfolded as traders reacted to confirmation of an upcoming Zilliqa network upgrade, triggering renewed attention toward the protocol at a time when the broader crypto market remains under pressure. While most large-cap and mid-cap tokens struggled for direction, the Zilliqa price attracted concentrated inflows, pushing it decisively out of its recent consolidation range. As volume accelerated and volatility expanded, the focus quickly shifted from whether ZIL could move to how sustainable the move might be.

Zilliqa’s Upgrade Catalyst Drives Spot Demand and Narrative Shift

ZIL price rally followed confirmation of a significant Zilliqa network upgrade, which laid out concrete technical and ecosystem developments rather than vague roadmap promises. The network rolled out node version 0.20.0, aligning Zilliqa with Cancun-era EVM functionality and setting the stage for a hard fork scheduled for February 5, 2026. This upgrade improves smart-contract compatibility, enhances tooling for developers, and lowers friction for applications integrating with Ethereum-based environments. Beyond core infrastructure, the update also introduced a meaningful institutional signal. 

A government-linked trust network from Liechtenstein is set to participate as a validator, strengthening decentralization and validator credibility. Additional improvements included expanded API capacity for enterprise users and resolution of validator stability issues that had previously constrained performance. For markets, this was not abstract development talk, it was actionable progress, and price reacted accordingly.

ZIL Price Shows Massive Breakout: Is $0.0100 Next?

Zilliqa price chart shows a falling wedge pattern breakout with strong surge in volume. With the start of this month, ZIL price rallied more than 90% and skyrocketed above the supply zone of $0.007000. ZIL’s price action indicates a clear shift in trend, with price surpassing the short-term moving averages and is eyeing to smash the 200 day EMA cluster of $0.007800. Once ZIL price strikes above the zone, further rally would take shape which could push Zilliqa price toward $0.01000 in the near term.

ZIL price

On the downside, the former channel resistance now acts as near-term support. A sustained move back below that level would signal loss of momentum and put the breakout at risk. Until then, the chart reflects trend transition rather than exhaustion.

Derivatives Data Showed Forced Repositioning

ZIL’s rally was reinforced by a sharp and measurable shift in derivatives positioning. Total open interest surged to roughly $55.1 million, marking a near 922% jump intraday, a clear signal that fresh leverage entered the market rather than price moving on low participation. At the same time, 24-hour futures volume expanded to approximately $856 million, up more than 4585%, confirming that the breakout attracted broad-based speculative interest across major venues. 

ZIL futures data

Long/short positioning tilted decisively toward the long side, with the aggregate long-short ratio pushing above 1.20, indicating bullish dominance but not yet an overcrowded long trade. Liquidation data further supports this structure: short-side liquidations dominated, while long liquidations remained relatively contained, suggesting bearish exposure was flushed as price accelerated. This combination of rising open interest alongside expanding volume typically reflects new directional conviction, not late-stage short covering alone, which gives a clear bullish outlook.

FAQs

Why Zilliqa (ZIL) price is up today?

ZIL price is up today due to confirmation of a major network upgrade, strong spot buying, and rising derivatives activity signaling renewed bullish interest.

What is the Zilliqa network upgrade and why is it important?

The upgrade improves EVM compatibility, validator stability, and developer tools, making Zilliqa more attractive for apps and institutions.

Is the ZIL rally driven by real demand or speculation?

Rising spot volume, higher open interest, and limited long liquidations point to fresh demand, not just speculative hype.

Jupiter (JUP) Price Prediction 2026, 2027 – 2030: Can JUP Hit $10 by 2030?

Jupiter (JUP) Price Prediction

The post Jupiter (JUP) Price Prediction 2026, 2027 – 2030: Can JUP Hit $10 by 2030? appeared first on Coinpedia Fintech News

Story Highlights

  • The Jupiter price today is  $ 0.19297278.
  • Price predictions for 2026 range from $0.60 to $4.00.
  • JUP could extend toward $10 by 2030, if the recovery structure holds.

Jupiter (JUP), a leading liquidity aggregation protocol within the Solana ecosystem, enters February at a point where fundamentals and technicals are beginning to converge. On the fundamental side, Jupiter continues to remain a core piece of Solana’s on-chain trading infrastructure, maintaining relevance even as broader market participation cooled. On the technical side, JUP’s price action has shifted noticeably over recent months from persistent decline to a more controlled, range-bound phase. 

After an extended post-launch correction, the token is no longer experiencing aggressive sell-offs. Instead, price volatility has compressed, and reactions around key demand zones have become more consistent. This combination often reflects a market transitioning from distribution into accumulation. As February begins, attention is now focused on whether JUP can sustain this stabilization phase and begin laying the groundwork for a longer-term recovery cycle extending into 2026 and beyond.

Jupiter Price Today

Cryptocurrency Jupiter
Token JUP
Price $0.1930 up 5.74%
Market Cap$ 625,982,721.02
24h Volume$ 77,239,078.7892
Circulating Supply3,243,891,294.88
Total Supply6,863,982,813.3681
All-Time High$ 2.0433 on 31 January 2024
All-Time Low$ 0.1300 on 10 October 2025

Jupiter (JUP) Price February 2026 Outlook

February is shaping up to be a confirmation month rather than a breakout month for Jupiter. Current price behavior suggests that the market is prioritizing balance, with buyers and sellers testing levels without committing to large directional bets. If JUP continues to hold above its recent demand zone, February could reinforce the view that downside risk is diminishing. 

Jupiter (JUP) Price February 2026 Outlook

This type of behavior is often seen before broader trend development, even if price remains visually unimpressive in the short term. However, if price loses support decisively during February, it would likely extend the consolidation phase rather than trigger a fresh collapse. At this stage, the technical bias favors range continuation with improving stability, not renewed distribution. By the end of this month, JUP may cross the next hurdle of $0.4000.

Jupiter (JUP) Price Prediction 2026

Looking ahead, 2026 appears to be a structural transition year for Jupiter, rather than a year of immediate price euphoria. The prolonged consolidation seen so far suggests that speculative excess has largely been absorbed, allowing price to begin rebuilding from a more stable foundation.

Jupiter (JUP) Price Prediction 2026

In the first half of 2026, JUP is likely to continue oscillating within a broad range as long-term participants accumulate and short-term traders test resistance levels. This phase is crucial, as it determines whether Jupiter can convert prior resistance into sustainable support. If JUP manages to reclaim higher levels and hold above key breakout zones later in the year, price could begin transitioning into an early expansion phase. This would likely unfold gradually, marked by higher lows and improving trend structure rather than sharp vertical moves. By the end of 2026, Jupiter price may reach a potential high of $4.00.

Jupiter Crypto Price Prediction 2026 – 2030

YearPotential Low ($)Potential Average ($Potential High ($)
20260.601.604.00
20271.703.605.00
20282.504.506.80
20293.506.208.50
20304.007.5010.00

Jupiter Price Prediction 2026

The Jupiter price range in 2026 is expected to be between $0.60 and $4.00.

Jupiter Crypto Forecast 2027

Jupiter (JUP) price range can be between $1.70 to $5.00 during the year 2027. 

Jupiter Token Price Outlook 2028

In 2028, Jupiter price is forecasted to potentially reach a low price of $2.50 and a high price of $6.80.

Jupiter Coin Future Prediction 2029

Thereafter, the Jupiter (JUP) price for the year 2029 could range between $3.50 and $8.50.

Jupiter Price Prediction 2030

Finally, in 2030, the price of Jupiter is predicted to maintain a steady positive. It may trade between $4.00 and $10.00.

Jupiter Price Prediction 2031, 2032, 2033, 2040, 2050

Based on the historic data and trend analysis of the cryptocurrency along with the market sentiments, here are the possible Jupiter  price targets for the longer time frames.

YearPotential Low ($)Potential Average ($)Potential High ($)
20314808.5011.90
20325.6010.0013.80
20336.4011.3015.60
20409.5017.2025.00
205014.0026.0040.00

Jupiter (JUP) Price Prediction: Market Analysis?

Year202620272030
Changelly$2.00$4.30$8.00
CoinCodex$2.80$5.00$8.20
WalletInvestor$4.00$6.00$12

CoinPedia’s Jupiter Price Prediction

Coinpedia’s price prediction indicates that Jupiter is currently transitioning from a prolonged corrective phase into early-stage accumulation. If JUP maintains stability above its demand zones and gradually reclaims resistance levels, we expect the token to trade toward $3+ during 2026, with the potential to reach the $4–$10 range by 2030 under sustained market expansion.

YearPotential Low ($)Potential Average ($)Potential High ($)
20260.601.604.00
Never Miss a Beat in the Crypto World!

Stay ahead with breaking news, expert analysis, and real-time updates on the latest trends in Bitcoin, altcoins, DeFi, NFTs, and more.

FAQs

What is Jupiter (JUP) and why is it important in the Solana ecosystem?

Jupiter is Solana’s leading liquidity aggregator, helping traders get the best swap prices by routing trades across multiple on-chain venues efficiently.

What is the price prediction for Jupiter (JUP) in 2026?

Jupiter’s 2026 price is projected to range between $0.60 and $4.00, depending on market conditions and its ability to hold long-term support.

What is the Jupiter (JUP) price prediction for 2030?

By 2030, Jupiter could trade between $4.00 and $10.00 if Solana adoption grows and JUP maintains its role in on-chain liquidity.

What is the Jupiter (JUP) price prediction for 2040?

Long-term projections suggest Jupiter may reach up to $25 by 2040, assuming sustained ecosystem relevance and broader crypto market expansion.

Is Jupiter (JUP) coin a good investment?

Jupiter can appeal long-term if Solana usage grows and liquidity demand rises, but like all crypto, it carries risk and requires careful research.

XRP Price Holds Support After Selloff as On-Chain Data Shows Reduced Downside Risk

XRP Price

The post XRP Price Holds Support After Selloff as On-Chain Data Shows Reduced Downside Risk appeared first on Coinpedia Fintech News

XRP price started today’s session under heavy pressure, sliding close to 5% lower amid broad crypto market weakness. However, as the day passed, the selling momentum faded, with price beginning to recover steadily, trimming losses to roughly –2% by mid-session. This rebound was not driven by a sudden spike in volume or speculative momentum. Instead, buying interest emerged gradually near lower levels, suggesting measured dip accumulation rather than forced short covering. 

The absence of follow-through selling indicates that downside pressure is being absorbed, even as broader sentiment remains cautious. While XRP has not confirmed a trend reversal, the intraday recovery highlights a shift from aggressive selling to price stabilization, often seen when markets enter a reassessment phase.

On-Chain Metrics Signal a Market in Balance, Not Breakdown

On-chain metrics shows that XRP continues to trade well below its 200-day moving average, with price hovering near the $1.8–$1.9 zone while the 200DMA sits closer to $2.5. This roughly 25% gap confirms that the broader trend has not flipped bullish yet. However, the absence of sharp downside continuation suggests the market is operating in a corrective equilibrium, not a structural collapse. Looking deeper, the 30-day Sharpe Ratio remains close to zero, around 0.03–0.04, indicating that recent returns have barely compensated for risk. Historically, such readings emerge during consolidation phases, when volatility compresses and directional conviction fades.

XRP on-chain

At the same time, the Sharpe Z-Score, near +0.7, shows modest improvement relative to recent history. While still below levels associated with strong trend formation, it signals that downside efficiency has weakened. While short-term momentum metrics echo this view, with the 7-day Sharpe Momentum slightly positive but subdued consistent with early base-building rather than impulsive upside. Together, these indicators suggest XRP is losing bearish momentum, even if it has not yet regained bullish dominance.

Ripple Escrow Activity Draws Attention

Ripple’s escrow mechanism returned to focus after on-chain trackers flagged a series of large XRP unlocks during the session. Data shows that close to 1 billion XRP was unlocked in multiple tranches, including 100 million and 400 million XRP transactions, with individual releases valued between $160 million and $650 million at prevailing prices. 

RIPPLE ESCROW IN MOTION 🚨

1,000,000,000 $XRP unlocked, routine, transparent & scheduled.

This isn’t selling panic… this is liquidity management at scale.

Smart money understands this. 💎🫵🏼 pic.twitter.com/OWc29YAebr

— XRP Update (@XrpUdate) February 1, 2026

Despite the scale, the unlocks followed Ripple’s predefined, transparent escrow schedule, a system that has been in place for years. Importantly, an escrow unlock does not automatically translate into spot market selling. Past cycles show that a significant portion of unlocked XRP is either re-locked into escrow or used for liquidity operations tied to Ripple’s payment infrastructure. The market response this time reinforces that pattern. Spot order books showed no surge in sell-side aggression, and price remained stable following the unlocks. In practical terms, the escrow activity added supply visibility, but failed to trigger distribution behavior, suggesting traders had largely anticipated the event.

XRP Price Rebounds Highlights Buyer Accumulation at Key Levels

XRP’s price action tells a more nuanced story than the headline selloff suggests. The session began with downside continuation, pushing XRP close to –5% intraday and briefly threatening to extend the broader corrective structure that has defined recent weeks. XRP price action trading close to a well-defined demand zone that has capped downside attempts since late January. As price dipped into this region, sell-side momentum visibly weakened, and buying interest emerged almost immediately. This allowed XRP to reclaim lost ground and recover toward –2% on the day, signaling active dip-buying rather than passive consolidation.

XRP Price

Structurally, XRP remains below its longer-term trend markers, meaning the broader bias is still corrective rather than bullish. The chart continues to reflect a descending structure, with lower highs guiding price action since the breakdown. The $1.70–$1.80 region remains the key level to watch. A sustained hold above this zone keeps XRP in a base-building phase, opening the door for a relief bounce toward nearby resistance if broader market conditions cooperate. Conversely, a clean breakdown below the $1.40-$1.60 area would invalidate the intraday recovery and expose XRP to renewed downside pressure.

FAQs

Why is XRP price down today?

XRP is down due to broader crypto market weakness, but losses are easing as buyers step in near key support levels.

Will XRP price recover soon?

XRP may rebound if buyers hold $1.70–$1.80 support, but broader crypto trends will influence recovery speed.

Is XRP likely to enter a bullish trend soon?

XRP is still below its 200-day moving average; sustained gains above $2 may be needed to confirm a bullish trend.

What is XRP price prediction for 2026?

XRP may trend higher if adoption and market sentiment improve, but price depends on crypto trends and regulatory developments.

Chainlink Price Nears a Critical Crossroad as Supply Builds Beneath the Surface

BNB Chain Partners with Chainlink

The post Chainlink Price Nears a Critical Crossroad as Supply Builds Beneath the Surface appeared first on Coinpedia Fintech News

Chainlink price is losing momentum as traders turn more defensive across the altcoin market. After failing to hold above $11, LINK extended its pullback today over 6%, pushing price toward the $9 mark, a zone where buyers are now expected to show intent.

The move lower has unfolded without panic. Instead, it reflects a gradual withdrawal of demand, with rebounds failing to attract sustained follow-through. This kind of price behavior often signals a market that is reassessing value rather than reacting emotionally.

As LINK price approaches key technical territory, on-chain data offers insight into why confidence has thinned.

Spot Market Data Shows Steady Distribution Into Weak Rallies

Spot on-chain metrics point to persistent but controlled selling pressure rather than panic-driven exits. Over the past several sessions, LINK has recorded net exchange inflows averaging 2500,000–4000,000 LINK per day, even as price attempted minor recoveries. These inflows have coincided closely with short-term bounces, indicating that holders are using strength to distribute rather than accumulate. Exchange balances remain elevated relative to early-month levels, while spot volume on green candles has consistently lagged volume on red sessions. 

LINK exchange inflow

This imbalance confirms that sell-side activity is absorbing demand faster than buyers are willing to step in. Crucially, there is no sign of aggressive accumulation clusters forming at current prices. Historically, LINK bottoms have aligned with sharp reductions in exchange inflows.

Leverage Exposure Resets as Risk Appetite Pulls Back

Derivatives data reinforces the idea that LINK’s move lower is driven by positioning reset, not aggressive bearish conviction. Open interest has declined near 2%, dropping from approximately $470 million to near $450 million, signaling that traders are reducing exposure rather than piling into shorts. This contraction reflects long-side unwinding, not fresh downside speculation. 

LINK liquidation map

However, funding rates across major perpetual markets have cooled from mildly positive territory to near neutral, removing a key bullish tailwind that supported LINK earlier in the cycle. The absence of strongly negative funding also suggests shorts are not pressing aggressively. While, liquidation data reveal a notable concentration of long liquidation liquidity between $9.00 and $9.50, with estimated exposure exceeding $60–$80 million. Above current price, short-side liquidity remains relatively thin, reinforcing downside gravity if spot demand fails to stabilize.

Chainlink Price Analysis: Is LINK Set to Retest $8?

Chainlink price has continued to paint the lower highs and lower lows swings, trapped inside a descending channel. Amidst the recovery in early 2026, LINK has failed to crack the $14 hurdle and faced decisive rejection, resulting in drop below the $10 crucial support zone. The $10 level has now flipped into resistance. The current price action suggests that Chainlink price may grab liquidity toward the $8 demand zone in the coming sessions.

LINK price

As long as LINK price trades below the $9 zone, market structure favors continuation pressure toward the $7.50-$8.30 zone, where historical demand and accumulation zone intersect. A decisive defense of $9 could allow LINK to compress and stabilize ahead. However, the current phase is defined by distribution over accumulation and risk reduction over leverage expansion. The market awaits clear evidence of bottoming out and stronger volume response at support. Until then, LINK is not being chased, it is being tested.

FAQs

Why is Chainlink (LINK) price falling today?

LINK is declining due to reduced demand, steady spot selling on small rallies, and traders lowering risk rather than panic selling.

Is Chainlink facing panic selling right now?

No. On-chain data shows controlled distribution and position unwinding, not emotional exits or aggressive bearish pressure.

Could LINK price recover from this pullback?

A recovery is possible if buyers strongly defend $9 with higher volume, signaling accumulation instead of distribution.

Is Ethereum Price Under Distribution Pressure? Exchange Inflows Raises Flags

Ethereum (ETH) Will Soar 11% If This Key Trigger Hits

The post Is Ethereum Price Under Distribution Pressure? Exchange Inflows Raises Flags appeared first on Coinpedia Fintech News

Ethereum (ETH) entered the week under heavy pressure, falling nearly 8% today and slipping decisively below the $2300 level amid a broader crypto market selloff. The move unfolded quickly, with downside momentum accelerating as leveraged long positions were forced out and spot demand failed to stabilize prices. While on-chain behaviour shows capital moving toward exchanges rather than into long-term storage alongside the rising macro uncertainty suggest Ethereum price is facing more than a routine pullback, resembling that ETH may be entering a distribution phase.

On-Chain Flows Signal Elevated Distribution Risk

Ethereum’s downside was preceded by a notable shift in on-chain behavior, particularly among large holders. Exchange inflow data shows a sharp and synchronized increase in ETH deposits, a signal often associated with preparation for selling, hedging, or risk reduction. On February 1, inflows into Binance alone surged to roughly 357,000 ETH, marking the exchange’s highest daily inflow since September. At the same time, total inflows across all major exchanges approached 600,000 ETH, one of the largest coordinated spikes seen in recent months. 

ETH exchange inflows

Such concentrated inflows rarely appear during periods of strong accumulation. Instead, they tend to surface when large holders reposition exposure near key price levels. The timing of this inflow surge just ahead of ETH’s breakdown below $2,300, significantly increased the market’s sensitivity to downside moves. Combined with rising leverage, these inflows reduced the market’s ability to absorb selling pressure, amplifying the liquidation cascade once price began to slide.

Liquidation Pressure Builds as Leverage Unwinds Aggressively

Derivatives data shows Ethereum at the center of the latest liquidation wave. Over the past 24 hours, ETH-related liquidations surged to approximately $280 million, surpassing Bitcoin’s $250 million and reinforcing Ethereum’s role as the primary stress point in the market.

The liquidation heatmap reveals that long positions dominated losses, confirming that bullish leverage had become overcrowded near recent consolidation highs. 

ETH liquidation

Once ETH slipped below short-term support, cascading stop-outs accelerated the move lower, pushing price swiftly through thin liquidity zones. This pattern reflects structural weakness rather than panic selling. When liquidations cluster this tightly, price movements tend to overshoot fair value before stability returns, leaving Ethereum vulnerable to additional volatility in the near term.

Ethereum Price Structure Weakens Below Key Support

Ethereum’s recent breakdown below the support zone of $2500 carries meaningful implications. The loss of the $2300-$2500 support level invalidated the prior consolidation structure and shifted market control firmly toward sellers. Ethereum price is now trading below its short-term moving averages, with momentum indicators pointing lower rather than stabilizing.

ETH price analysis

The absence of strong buying volume on the way down further suggests that demand remains cautious rather than aggressive. The immediate support sits near $2000, which if breaks a major decline toward $1600 could be seen next.

Is the Worst of the ETH Selloff Already Priced In?

Despite the ongoing selloff, Ethereum’s higher-timeframe structure is beginning to hint at a potential inverse head-and-shoulders formation. The structure formed after ETH’s slide toward the $2100-$2500 zone, where selling momentum started to fade and volume failed to expand on fresh lows. Recent price action suggests a right shoulder may be developing, indicating stabilization rather than going lower. 

ETH price analysis

This reversal scenario gains credibility only if ETH price reclaims the $2500 neckline on strong volume. Until then, the pattern remains conditional, with a loss of $2100 invalidating the setup and restoring downside risk. A period of consolidation or a technical relief bounce cannot be ruled out if ETH holds its current demand zone. Until reclaim levels are decisively broken, the broader outlook stays cautious, with volatility likely to remain elevated.

FAQs

Why Ethereum Is Going Down Today?

Ethereum is dropping due to rising exchange inflows, leveraged long liquidations, and weak buying amid broader crypto market pressure.

How much ETH was liquidated recently?

Over $280 million in ETH long positions were liquidated in the last 24 hours, highlighting market stress and weak support.

Could Ethereum stabilize or reverse soon?

A potential inverse head-and-shoulders pattern suggests stabilization, but ETH must reclaim $2500 on strong volume to confirm.

Flare (FLR) Price Prediction 2026, 2027 – 2030: Is FLR Setting the Stage for a Long-Term Breakout?

Flare (FLR) Price Prediction

The post Flare (FLR) Price Prediction 2026, 2027 – 2030: Is FLR Setting the Stage for a Long-Term Breakout? appeared first on Coinpedia Fintech News

Story Highlights

  • The live price of Flare crypto is  $ 0.00980029.
  • Price predictions for 2026 range from $0.008 to $0.014.
  • FLR could extend toward $0.30 by 2030, if recovery structure holds.

Flare (FLR) is a smart contract–enabled blockchain focused on cross-chain data access and interoperability. Since its initial listing phase, the token has spent a significant amount of time repricing, moving from early volatility into a prolonged period of range-bound trading.

Recently, however, the nature of price action has begun to change. Instead of sharp declines, FLR has started forming more stable reactions around established demand zones. Volatility has eased, and price swings have become narrower. From a market structure standpoint, these conditions often appear when an asset is transitioning from distribution into base formation, raising questions about whether FLR could be approaching a turning point as 2026 draws closer.

Flare Price Today

Cryptocurrency Flare
Token FLR
Price $0.0098 down -1.02%
Market Cap$ 828,182,126.48
24h Volume$ 9,256,334.6011
Circulating Supply84,505,908,593.4305
Total Supply104,837,511,377.41
All-Time High$ 0.0797 on 10 January 2023
All-Time Low$ 0.0083 on 19 October 2023

Flare Price Prediction 2026

Looking further ahead, 2026 could prove to be a defining year for FLR if the current base resolves to the upside. Long periods of sideways movement often precede stronger directional moves once key resistance levels are cleared. Should FLR break above the $0.015–$0.018 resistance region and maintain acceptance, price could gradually work its way toward the $0.03–$0.04 zone. This area represents a prior congestion range and would likely attract increased trading activity.

Flare Price Prediction 2026

If momentum remains constructive and broader market conditions cooperate, FLR could extend its advance toward $0.06 before the end of 2026. A cross of this level would mark a clear shift away from consolidation and into trend development. However, a drop below $0.0075 would undermine the recovery structure and delay bullish expectations.

Flare Crypto Price Prediction 2026 – 2030

YearPotential Low ($)Potential Average ($Potential High ($)
20260.0100.0300.060
20270.0250.0600.095
20280.0500.1150.175
20290.0900.1900.245
20300.1500.2400.300

FLR Price Prediction for 2026

The Flare price range in 2026 is expected to be between $0.010 and $0.060.

FLARE Price Forecast for 2027

Flare (FLR) price range can be between $0.025 to $0.095 during the year 2027. 

FLARE Price Outlook for 2028

In 2028, Flare price is forecasted to potentially reach a low price of $0.050 and a high price of $0.175.

FLR Price Forecast for 2029

Thereafter, the Flare (FLR) price for the year 2029 could range between $0.090  and $0.245.

Flare Price Prediction 2030

Finally, in 2030, the price of Flare is predicted to maintain a steady positive. It may trade between $0.150 and $0.300.

Flare Price Prediction 2031, 2032, 2033, 2040, 2050

Based on the historic data and trend analysis of the cryptocurrency along with the market sentiments, here are the possible Flare  price targets for the longer time frames.

YearPotential Low ($)Potential Average ($)Potential High ($)
20310.1800.2900.390
20320.2200.3600.480
20330.2200.4300.560
20400.4500.7201.00
20500.7001.101.50

Flare (FLR) Price Prediction: Market Analysis?

Year202620272030
Changelly$0.054$0.090$0.250
CoinCodex$0.060$0.108$0.270
WalletInvestor$0.037$0.080$0.280

CoinPedia’s Flare Price Prediction

Based on current technical structure and observed market behavior, Coinpedia’s price outlook implies that Flare (FLR) price is expected to trade between $0.010 and $0.060 in 2026, assuming support levels remain intact. Over the longer horizon, continued recovery could allow FLR to move toward the $0.20-$0.30 range by 2030, subject to overall market conditions.

YearPotential Low ($)Potential Average ($)Potential High ($)
20260.0100.0300.060
Never Miss a Beat in the Crypto World!

Stay ahead with breaking news, expert analysis, and real-time updates on the latest trends in Bitcoin, altcoins, DeFi, NFTs, and more.

FAQs

Is Flare (FLR) a good investment for 2026?

FLR could be promising if it breaks key resistance and holds support. Its long consolidation suggests base formation, but outcomes depend on market conditions.

What price can Flare (FLR) reach in 2026?

In 2026, Flare is projected to trade between $0.010 and $0.060, with upside potential if it clears the $0.015–$0.018 resistance zone.

What is the long-term outlook for Flare (FLR)?

Long term, Flare shows potential for gradual growth, with forecasts suggesting higher highs through 2030 and beyond if development and usage expand.

How much will the Flare coin be worth in 2030?

By 2030, Flare could trade between $0.15 and $0.30 if network adoption grows and broader crypto markets remain supportive.

What is the Flare crypto price prediction for 2040?

Long-term projections suggest FLR may range from $0.45 to $1.00 by 2040, assuming sustained ecosystem growth and real-world utility.

❌