Reading view

Chainlink Price Prediction 2026, 2027 – 2030: Will LINK Price Reach $100?

Chainlink Price Prediction

The post Chainlink Price Prediction 2026, 2027 – 2030: Will LINK Price Reach $100? appeared first on Coinpedia Fintech News

Story Highlights

  • The live price of the LINK token is  $ 9.05357905.
  • Price prediction for 2026 suggests a potential high of $55.
  • Long-term forecasts indicate LINK could reach $195 by 2030.

Chainlink has emerged as a game-changing decentralized oracle network, enabling smart contracts to connect seamlessly with real-world data, APIs, and traditional financial systems. As the crypto market evolves, Chainlink’s role continues to expand, especially with its Cross-Chain Interoperability Protocol (CCIP) gaining traction. Its native token, LINK, not only powers the ecosystem but has also caught the attention of investors and analysts. As a result, institutional interest surged, leading to the launch of the LINK ETF by Grayscale in early December 2025

With LINK price showing signs of a potential breakout and strong on-chain fundamentals backing its rise, the big question remains: Can LINK coin price hit $50 in December 2025? Let’s dive into this detailed Chainlink price prediction 2026–2030 to find out.

Chainlink Price Today

Cryptocurrency Chainlink
Token LINK
Price $9.0536 down -6.51%
Market Cap$ 6,410,839,057.59
24h Volume$ 1,162,383,509.9678
Circulating Supply708,099,970.4526
Total Supply1,000,000,000.00
All-Time High$ 52.8761 on 10 May 2021
All-Time Low$ 0.1263 on 23 September 2017

Coinpedia’s Chainlink Price Prediction 2026

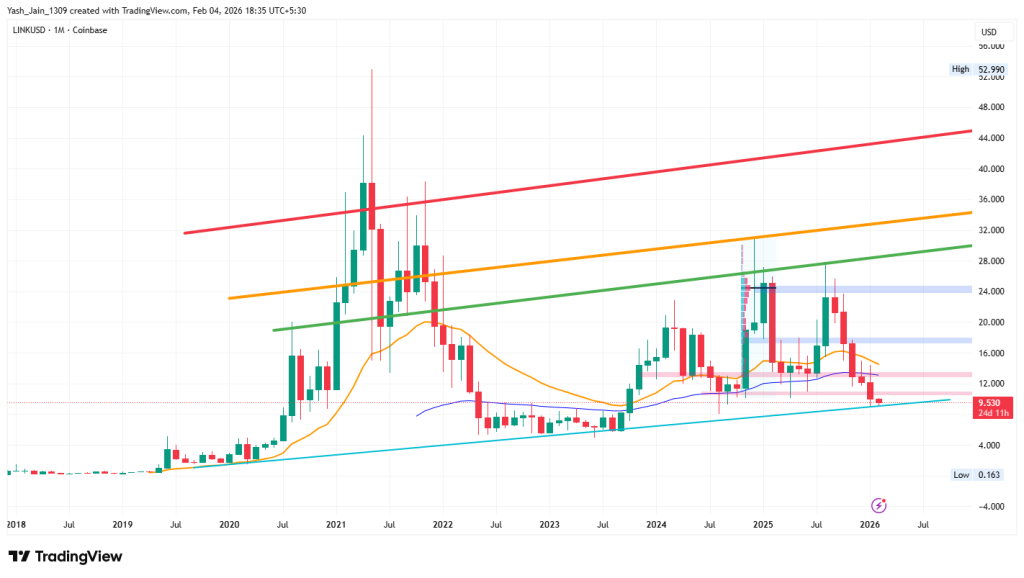
A long-term ascending trendline on LINK/USD’s weekly timeframe chart is observed, which has been reliable over the years, often leading to upward price movements. The Chainlink price prediction for 2026 indicates a strong potential for a significant price surge, reminiscent of the 2020 rally, possibly reaching $48 to $55 due to positive market momentum. For a more conservative outlook, predictions suggest a lower range of $32 to $36 by 2026, offering a favorable risk-reward scenario for investors.

Chainlink Price Targets February 2026

In January, the LINK price firmly continued its downtrend, reaching a significant long-term ascending trendline support above $9.0 on the daily chart in early February. This pivotal moment suggests LINK/USD is poised for a reversal this month, with a strong likelihood of recovering to $15. However, if it fails to hold above $9, the bullish outlook will be negated, leading LINK to new lows. Should the $9 support level be surpassed, we could see the price target for February soar to $18.

Chainlink Price Prediction 2026

Chainlink Price Prediction 2026

On the weekly chart, a long-term ascending trendline has been consistently in effect over multiple years. This trendline has proven its reliability by producing upward price movements on numerous occasions, reinforcing its credibility as a key technical indicator. 

Looking ahead, the Chainlink price prediction 2026 suggests that the potential for a significant price surge reminiscent of the explosive rally observed in 2020, remains high. Analysts suggest that such a rally could see prices target the range of $48 to $55, driven by strong market momentum and bullish sentiment.

For those taking a more conservative outlook, even the lower end of the targets suggests a promising rally, with predictions pinpointing a price range of approximately $32 to $36 by 2026. This presents a favorable risk-reward scenario for investors monitoring this trendline and assessing their market strategies.

Chainlink Price Prediction 2026
YearPotential Low ($)Potential Average ($)Potential High ($)
2026355055

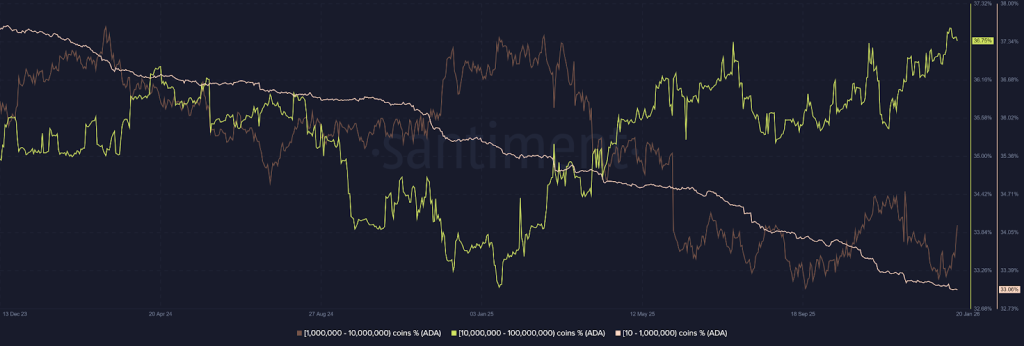
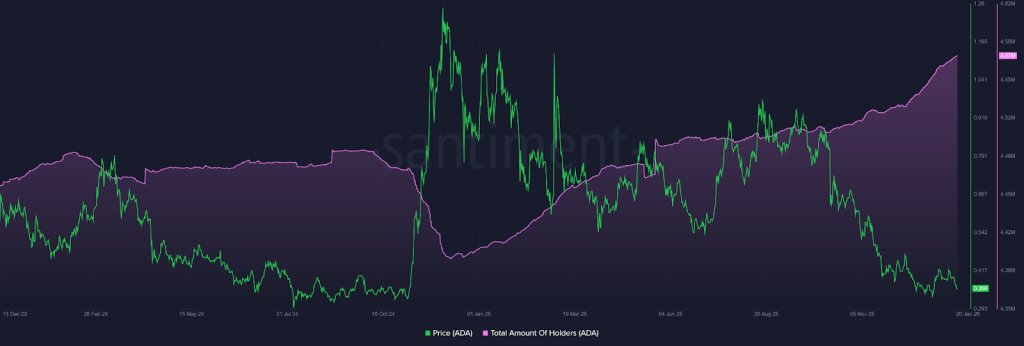
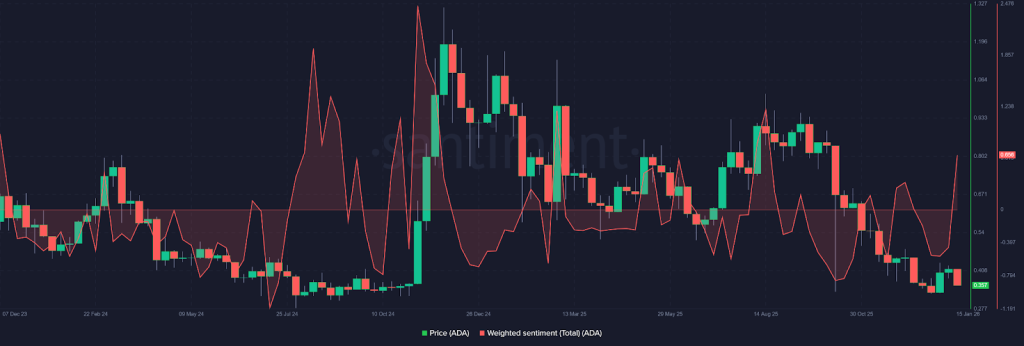
Chainlink On-Chain Analysis

In the LINK on-chain metrics, both spot and futures markets are clearly exhibiting a Taker Buy-Dominant phase. It shows that buyers are actively executing at market prices without waiting for pullback opportunities. This is simply a strong sense of conviction rather than speculative strategies.

Chainlink Spot Avg Order Size

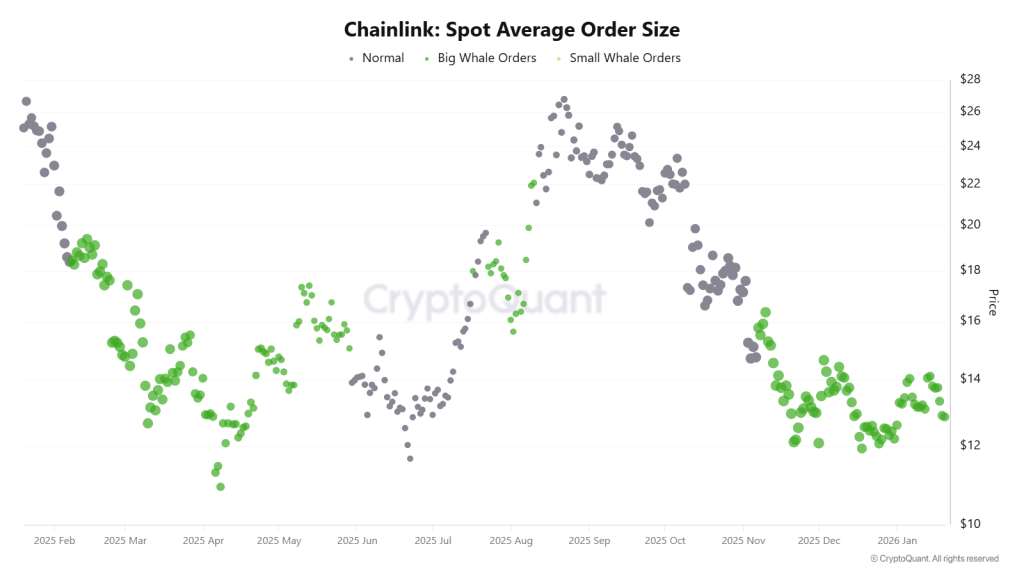
Additionally, the Average Order Size in both the spot and futures markets has escalated into the “Big Whale” category. This shift signals the involvement of institutional participants, who significantly influence LINK’s market structure, rather than retail trading flows.

Chainlink Price Targets 2026 – 2030

YearPotential Low ($)Potential Average ($)Potential High ($)
2026355055
2027486480
20285885104
202970108141
203085147195

This table, based on historical movements, shows Chainlink price to reach $195 by 2030 based on compounding market cap each year. This table provides a framework for understanding the potential LINK price movements. Yet, the actual price will depend on a combination of market dynamics, investor behavior, and external factors influencing the cryptocurrency landscape.

LINK Crypto Price Forecast 2026

As per Chainlink’s Price forecast for 2026, the high price could be $55, the low may reach $35. This makes the average around $50.

LINK Price Prediction 2027

Moving to 2027, the LINK Price projects that it might hit a high price of $80 potentially. With a $48 low and an average of $64.

Chainlink Price Analysis 2028

Moving to 2028, the Chainlink Price Forecast predicts a high price of $104. On the flip side, the low may fall to $58, and the average is projected to be around $85.

LINK Coin Price Prediction 2029

As per Chainlink Price Forecast 2029, LINK’s high price is predicted to be $141, with a low of $70 and an average of $108.

Chainlink Price Prediction 2030

Finally, as per the Chainlink Price Forecast 2030, LINK’s price can reach a high price of $195. With a low of $85 and an average of $147.

Market Analysis

Firm Name20262030
Changelly$25.83$140.70
coincodex$6.44$14.79
Binance$18.43$22.40
Mitrade$32.22$139.2
Investing Haven$54.10$80
Flitpay$62.6$110

*The aforementioned targets are the average targets set by the respective firms.

Never Miss a Beat in the Crypto World!

Stay ahead with breaking news, expert analysis, and real-time updates on the latest trends in Bitcoin, altcoins, DeFi, NFTs, and more.

FAQs

How much is Chainlink worth?

At the time of writing, the value of one LINK crypto token was  $ 9.05357905.

What is the price prediction for Chainlink in 2026?

Chainlink price prediction for 2026 suggests LINK could trade between $35 and $55, with an average price near $50 under bullish conditions.

How much will 1 Chainlink be worth in 2030?

By 2030, 1 Chainlink could be worth between $85 and $195, depending on adoption, market cycles, and long-term crypto growth.

Where will Chainlink be in 5 years?

In five years, Chainlink is expected to be a core Web3 infrastructure, with broader adoption and a potential price range of $80–$140.

Is Chainlink a good long-term investment?

Chainlink is considered strong long term due to its real-world utility, oracle dominance, institutional adoption, and expanding cross-chain ecosystem.

What factors influence Chainlink price predictions?

LINK price is driven by oracle demand, CCIP adoption, staking growth, institutional interest, crypto market cycles, and global liquidity trends.

Dogecoin Price Prediction 2026, 2027 – 2030: Will DOGE Reach 1 Dollar?

price prediction Dogecoin

The post Dogecoin Price Prediction 2026, 2027 – 2030: Will DOGE Reach 1 Dollar? appeared first on Coinpedia Fintech News

Story Highlights

  • The live price of the Dogecoin is  $ 0.10189972.
  • Analysts project Dogecoin could reach $0.75 to $1.25 by the end of 2026.
  • Long term projection highlights that by 2030 it could even reach the $3 mark.

Dogecoin, the original meme coin, has cemented its status as a crypto legend. Known for its viral appeal and a fiercely loyal community, it continues to capture headlines and investor interest. Following Donald Trump’s election win, speculation around a potential Dogecoin ETF fueled a surge in optimism.

Now, that speculation has become a reality. With the September 18 launch of the REX-Osprey DOGE ETF, trading under the ticker DOJE and carrying a 1.5% fee, the path has been cleared for institutional access. This groundbreaking debut makes it the first U.S.-listed spot ETF for Dogecoin and significantly raises the odds for similar approvals from major players like Bitwise and Grayscale before year-ends.As growing optimism and increasing adoption reshape the market, traders are asking: “Will Dogecoin go back up?” and “Can DOGE hit $1?” In this article, we dive into a detailed technical analysis and a long-term Dogecoin price prediction 2025 to 2030.

Keep reading to find out!

Dogecoin Price Today

Cryptocurrency Dogecoin
Token DOGE
Price $0.1019 down -6.11%
Market Cap$ 17,181,431,468.62
24h Volume$ 1,944,276,696.2934
Circulating Supply168,611,173,126.58
Total Supply168,611,173,126.58
All-Time High$ 0.7376 on 08 May 2021
All-Time Low$ 0.0001 on 07 May 2015

Coinpedia’s Dogecoin Price Prediction 2026 

DOGE retested the $0.10 support level in February following January’s decline. Positive inflows into the Doge ETF fuel optimism for demand could push a reversal. A breakthrough past $0.39 could target $0.484 and possibly $1.00, but failure at $0.39 may lead to a retracement back.

Dogecoin Price Prediction 2026

January kept declining on the weekly chart despite an early January surge to $0.15. Now, in early February, it has retested the $0.10 support area, which aligns with a descending trendline.

Also, the US Doge ETF is seeing positive inflows in February, fueling further optimism that demand will surge in the months ahead.

Also, if this institutional demand propels DOGE, it might aim to move past the $0.39 resistance in Q1. It could even target its previous high of $0.484. A sustained rally beyond this point makes a move to the iconic $1.00 mark a real possibility.

However, if the price is rejected at the $0.39 resistance level by the Q1 of 2026, it may retrace back to the lower demand zone. The trajectory is heavily dependent on further institutional interest. For all this momentum to materialize in the future, it needs to build a strong base consolidating at $0.10.

Dogecoin Price Prediction 2026
YearPotential Low ($)Potential Average ($)Potential High ($)
2026 (conservative)0.130.391.00

DOGE On-Chain Outlook

Despite the price facing challenges after peaking at $0.46 in late 2024 and then falling, 2025 is a very tough year for its investors. But the total number of holders has surged to an impressive 8.17 million, indicating strong investor accumulation. 

DOGE onchain

Similarly, large holders are showing strategic accumulation patterns that suggest bullish sentiment. While the number of retail holders holding between 10 and 10,000 coins has been declining, those holding between 100 million and 1 billion coins continue to increase, reinforcing a positive outlook for the asset.

Dogecoin Santiment Data

Dogecoin Price Prediction 2026 – 2030

YearPotential Low ($)Potential Average ($)Potential High ($)
20260.751.001.25
20271.151.351.50
20281.251.752.00
20291.502.152.65
20302.502.753.00

This table, based on historical movements, shows DOGE price to reach $3 by 2030 based on compounding market cap each year. This table provides a framework for understanding the potential DOGE price movements. Yet, the actual price will depend on a combination of market dynamics, investor behavior, and external factors influencing the cryptocurrency landscape.

Dogecoin Price Prediction 2031, 2032, 2033, 2040, 2050

Based on the historic market sentiments and trend analysis of the altcoin, here are the possible Dogecoin price targets for the longer time frames.

YearPotential Low ($)Potential Average ($)Potential High ($)
20313.013.494.00
20323.794.475.25
20334.965.756.75
204014.2219.5025.00
205054.99105.00155.00

Market Analysis

Firm Name20262030
Changelly$0.233$1.07
Coincodex$0.115$0.259
Binance$0.235$0.285
Never Miss a Beat in the Crypto World!

Stay ahead with breaking news, expert analysis, and real-time updates on the latest trends in Bitcoin, altcoins, DeFi, NFTs, and more.

FAQs

What is Dogecoin’s price prediction for 2026?

Analysts project Dogecoin could range between $0.39 and $1 in 2026, depending on institutional demand and market momentum.

Can Dogecoin reach $1 in 2026?

Yes, if DOGE surpasses key resistance levels and gains institutional support, it could potentially hit $1 during 2026.

How high could Dogecoin go by 2030?

Long-term projections suggest Dogecoin may reach $3 by 2030, assuming steady adoption and growing market confidence.

Is Dogecoin a good long-term investment?

Dogecoin’s strong community, mainstream adoption potential, and evolving use cases make it a viable long-term digital asset.

SOL Price Shows Early Stabilization Signs as Technical Exhaustion Signals Emerge

SOL Price Enters A Key Demand Zone—Can Solana Rebound On Strong On-Chain Fundamentals?

The post SOL Price Shows Early Stabilization Signs as Technical Exhaustion Signals Emerge appeared first on Coinpedia Fintech News

SOL price is attempting to stabilize after a prolonged selloff, trading at $94.16 when writing, as short-term technical indicators begin to suggest seller exhaustion. A TD Sequential “9” buy signal on the 4-hour chart, combined with a bullish RSI divergence, has shifted focus toward whether current support can hold.

TD Sequential Buy Signal Flags Potential Selling Exhaustion

From a technical perspective, the Solana price chart has printed a TD Sequential “9” buy signal on the 4-hour timeframe. This is signaling that downside momentum may be stretched. While it does not guarantee a reversal, historically it often precedes short-term stabilization phases.

The TD Sequential flashes a buy signal on Solana $SOL, while a bullish RSI divergence forms.

Holding $95 keeps a move toward the monthly open at $105 in play. pic.twitter.com/KMg2X7uqxK

— Ali Charts (@alicharts) February 4, 2026

Meanwhile, price action has respected the $93–$94 zone during recent sessions, suggesting that sellers may be losing control. Still, confirmation requires sustained holding above this area rather than a brief reaction.

Bullish RSI Divergence Reinforces Short-Term Support

At the same time, momentum indicators are beginning to diverge from price. While SOL price briefly dipped to $93, the Relative Strength Index formed a higher low. This bullish RSI divergence implies weakening downside pressure even as price printed a marginally lower low.

Such divergences often emerge near inflection points, particularly after extended declines. That said, they tend to work best when paired with structural support levels, which currently places added significance on the $94 region for SOL price today.

Key Levels Define Near-Term Risk and Reward

From a structural standpoint, $94.16 now acts as a critical support reference. If this level continues to hold on closing bases, attention shifts toward the monthly open near $105, which represents a potential recovery target of roughly 9.4% based on recent Solana price chart behavior.

Still, the path higher is unlikely to be linear. Any failure to defend current levels would delay this scenario and reintroduce lower liquidity zones. For now, the chart suggests that the immediate risk-reward profile has become more balanced than earlier in the decline.

On-Chain Activity Signals Underlying Network Strength

Beyond price, Solana crypto fundamentals present a more constructive backdrop. Development activity has been trending higher, while daily active addresses continue to rise, too. This combination suggests that network usage is expanding even as market sentiment remains cautious.

SOL Price Shows Early Stabilization Signs as Technical Exhaustion Signals Emerge

Historically, divergences between improving on-chain engagement and soft price action often precede trend transitions, although timing remains uncertain. Still, it reduces the likelihood of purely speculative price behavior dominating short-term moves.

Volume Cooling Adds Context to Momentum Shift

Additionally, CryptoQuant data shows a noticeable cooling in trading volume. Rather than indicating disinterest, declining volume during downtrends often reflects the exhaustion of aggressive sellers. In prior cycles, similar volume compression has aligned with base-building phases.

SOL Price Shows Early Stabilization Signs as Technical Exhaustion Signals Emerge

As a result, SOL price is now balancing between technical exhaustion signals and broader market restraint. Whether this develops into a sustained recovery or extended consolidation will depend on how price reacts around current support over coming sessions.

Ethereum Price Faces Historical Stress Test as Transfer Counts Spike

Ethereum Fees Drop to 2017 Lows

The post Ethereum Price Faces Historical Stress Test as Transfer Counts Spike appeared first on Coinpedia Fintech News

Ethereum price is trading under pressure as on-chain data flashes a historically sensitive signal. In late january, Ethereum crypto’s total transfer count, smoothed by a 14-day SMA, surged to 1.17 million, a level previously associated with major market turning points. This sudden spike raises fresh questions about near-term risk.

Ethereum Network Activity Reaches a Critical Threshold

The latest Ethereum price chart is unfolding amid sharply rising network activity. According to on-chain data, the transfer count has accelerated sharply, reaching levels rarely sustained in past market cycles. While increasing activity can indicate adoption, the speed and magnitude of this move place it in a more cautionary category.

Ethereum Price Faces Historical Stress Test as Transfer Counts Spike

Historically, such abrupt spikes tend to appear near periods of elevated stress. Meanwhile, price action on higher timeframes has already softened, suggesting that activity may not be driven purely by organic growth. Instead, it may reflect increased repositioning as market participants adjust exposure.

Historical Parallels Resurface From 2018 and 2021

A closer look at Ethereum crypto’s historical data reinforces the concern. In January 2018, transfer counts surged in a similar fashion just days before Ethereum marked its cycle peak. At the same time, price momentum stalled and gave way to an extended bear market.

A comparable pattern emerged on May 19, 2021. Transfer activity spiked sharply as price volatility intensified, coinciding with a broad market crash. In both cases, elevated network usage reflected distribution and forced flows rather than healthy accumulation. While history does not repeat exactly, the structural similarity keeps risk elevated.

On-Chain Signals Point to Distribution and Volatility

From an analytical standpoint, parabolic increases in transfer counts often align with moments of emotional extremes. That said, these phases typically involve heavy asset movement between wallets and exchanges. This behavior suggests profit realization, collateral rebalancing, or liquidation-driven transfers.

At the same time, volatility tends to climax near these events. The Ethereum crypto ecosystem has historically seen spikes in transaction volume when conviction weakens on one side of the market. As a result, heightened activity alone does not confirm direction but signals instability.

MVRV Bands Highlight a Lower Valuation Zone

Adding to the cautionary tone, Ethereum crypto’s MVRV pricing bands are drifting toward historically significant territory. The Ethereum price USD has often formed durable bottoms only after dipping below the 0.80 MVRV band, a level that currently maps to just under $2,000.

Ethereum Price Faces Historical Stress Test as Transfer Counts Spike

In previous cycles, price spent prolonged periods consolidating near this lower valuation envelope before recovery phases began. From a structural perspective, the Ethereum price prediction remains sensitive to whether this zone is tested or defended. Meanwhile, cost-basis dynamics continue to rise slowly, lifting the long-term floor but not eliminating downside risk.

Ethereum Price Balances Between Risk and Repricing

Still, markets rarely move in straight lines. While current signals suggest elevated risk, they also reflect a market in transition. As speculative excess is absorbed, the Ethereum price may continue searching for equilibrium within historically relevant valuation ranges. Whether activity stabilizes or accelerates further will remain central to near-term direction.

Moscow Exchange Adds Solana, XRP, and TRX Futures in Major Institutional Crypto Move

SPK

The post Moscow Exchange Adds Solana, XRP, and TRX Futures in Major Institutional Crypto Move appeared first on Coinpedia Fintech News

Recently the prices across the altcoin market remain under pressure. Yet a major institutional catalyst has emerged for the top blue chips of the industry. Moscow Exchange’s plans to launch cash-settled futures for Solana, XRP, and TRX adds regulated exposure at a time of heightened volatility, reshaping how these assets are viewed within long-term market frameworks.

MOEX Expands Crypto Derivatives Beyond Bitcoin and Ethereum

Moscow Exchange (MOEX) is preparing to broaden its regulated crypto derivatives lineup by introducing cash-settled futures linked to Solana, XRP, and TRX. The move extends the exchange’s existing Bitcoin and Ethereum offerings and aligns with its strategy to deepen institutional access to digital asset exposure in Russia.

📰 Russia's Moscow Exchange announces plans to launch cryptocurrency indices for Solana, Ripple, $XRP and Tron by the end of 2026, signaling further crypto market integration in the country. pic.twitter.com/afvbVYhSjv

— Xaif Crypto🇮🇳|🇺🇸 (@Xaif_Crypto) February 3, 2026

Initially, MOEX plans to launch indices tracking these altcoins, which will then serve as the underlying benchmarks for futures contracts. At the same time, settlement will be conducted entirely in Russian rubles, removing any need for physical cryptocurrency delivery and simplifying compliance requirements.

Regulatory Guardrails Shape Market Structure

Access to the new futures contracts will be restricted to qualified investors under Russian law. Meanwhile, contract specifications are expected to mirror MOEX’s existing crypto products, with monthly expiries and standardized risk controls.

JUST IN: 🇷🇺 Russia to roll out crypto regulatory framework this July, allowing retail participation. pic.twitter.com/rSGoesFBzK

— Bitcoin Magazine (@BitcoinMagazine) January 29, 2026

This structure reflects a broader regulatory direction. The Russian government is working toward a comprehensive digital asset framework expected by July 1, 2026, positioning regulated derivatives as a controlled gateway for institutional participation rather than direct spot market exposure.

Institutional Credibility Versus Short-Term Market Stress

From a market context perspective, the announcement arrives during a sharp correction across the altcoin sector. While, prices for Solana, XRP, and TRX have all been influenced by broader risk-off sentiment rather than asset-specific fundamentals.

Why Is Moscow Exchange to Launch Solana, XRP, and TRX Futures Now?

Still, promises for derivatives listings on national exchanges is a longterm. This broadly signal a shift in how assets are classified. Rather than speculative instruments, they begin to function as monitored financial products within formal trading ecosystems. That said, futures markets also introduce leverage and hedging dynamics, which can amplify volatility in the short term.

Sentiment Reset and Long-Horizon Positioning

At the same time, the current drawdown appears more consistent with a cooling phase than a structural breakdown. Market participation has thinned, forced liquidations have slowed after the event, and volatility is gradually normalizing.

Breaking developments such as MOEX’s futures expansion may not immediately reverse price trends. However, they do open the possibility of renewed interest once bearish pressure fades, particularly among long-term investors assessing regulated exposure and liquidity pathways rather than short-term price action.

How Futures Listings Could Influence Market Behavior

From an analytical perspective, regulated futures introduce price discovery mechanisms that operate independently of spot markets. For Solana, XRP, and TRX, this may gradually influence how capital flows react during future market cycles.

While price recovery is never guaranteed, the introduction of these contracts places the trio within a more formal derivatives framework. The presence of MOEX futures suggests that Solana, XRP, and TRX are increasingly treated as enduring components of the crypto market rather than transient narratives, reinforcing their standing within long-term structural discussions.

Cardano Price Prediction 2026, 2027 – 2030: Will ADA Price Hit $2?

Cardano Price Prediction

The post Cardano Price Prediction 2026, 2027 – 2030: Will ADA Price Hit $2? appeared first on Coinpedia Fintech News

Story Highlights

  • The live price of the Cardano token is  $ 0.28352647.
  • Price prediction suggests potential to reach $2.75 to $3.25 by year-end 2026.
  • Long-term forecasts indicate ADA could hit $10.25 by 2030.

The Cardano price prediction 2026 is generating significant buzz in the crypto market, as the last quarter is soon to close in few days, boosting interest for the next altcoin. The 2025 for ADA/USD began with numerous fundamental updates strengthening its future, including the transformative Plomin Hard Fork, but 2026 seems even more constructive. 

Now, Questions abound: “Will Cardano spearhead the altcoin movement?” and “What heights can ADA reach by 2050?” Explore this Cardano price prediction 2026 and beyond, filled with expert insights and ambitious forecasts.

Coinpedia’s Cardano Price Prediction

The Cardano price outlook for 2026 is promising, driven by its extraordinary 4,000% surge in 2020 and currently holding strong at a significant support level. With a positive shift in market sentiment, even a moderate increase could lead to a remarkable 1,000% rise, positioning Cardano around $4.50.

A more conservative target of $1.40 indicates a solid 300% gain based on existing trends. Analysts are broadly optimistic that upcoming ETF approvals will boost institutional adoption and market stability, with price projections ranging from $2.05 to $2.80.

Cardano Price Today

Cryptocurrency Cardano
Token ADA
Price $0.2835 down -4.49%
Market Cap$ 10,223,212,523.72
24h Volume$ 845,083,946.3139
Circulating Supply36,057,347,728.0513
Total Supply44,994,622,371.2576
All-Time High$ 3.0992 on 02 September 2021
All-Time Low$ 0.0174 on 01 October 2017

ADA Price February Outlook

ADA price February outlook

The ADA price action is experiencing a significant sell-off, but early February has revealed a crucial demand area where new buying momentum is likely to emerge, paving the way for a bullish rally. Additionally, the lower boundary of the falling wedge is providing solid support, indicating that a price spike is imminent. I predict that ADA could very well reach $0.60 this month.

Cardano AI Price Prediction For February 2026

SourceLow PriceAverage PriceHigh Price
Gemini$0.85 – $0.95$1.00 – $1.20$1.30 – $1.50+
BlackBox$0.65$1.00$1.50
ChatGPT$0.75$0.95$1.25

ADA Price Prediction 2026

The Cardano price forecast for 2026 points to an important support level on its weekly chart, a range that has consistently acted as a strong pivot point for price trends, and is currently giving off signals of another potential rally. This support level is known for displaying remarkable resilience over time, suggesting that if Cardano price USD can maintain its position above this threshold once again, it could pave the way for significant price movements in 2026.

Looking back at Cardano’s historical performance on the weekly chart, it shows an extraordinary rally in 2020, when the asset posted staggering gains of nearly 4,000%. During that bullish phase, the Cardano price USD spent an extended period consolidating around the dynamic support trendline, which appears to be a strategic accumulation at discounts from smart money, contributing significantly to its eventual surge. 

If the current market sentiment shifts positively, a resurgence in investor confidence could lead to a recovery. Not ambitiously, even modestly, past performance could give a tremendous surge. Last year’s performance was 4000%. If we assume 1/4 of that momentum, it would result in an increase of approximately 1000%, potentially elevating Cardano’s price to $4.50 by 2026.

ADA Price Prediction 2026

Conversely, a more conservative approach suggests a realistic price target of around $1.40, indicating a potential increase of about 300%. This estimate remains feasible, especially since it is based on fundamental analyses and market trends that are not reliant on speculative triggers, such as the possible approval of exchange-traded funds (ETFs). 

Additionally, many experts propose that these ETFs could significantly impact the market by boosting institutional investment and improving market stability. In a situation where ETF approvals occur and retail investor excitement rises, Cardano’s price could realistically range from $2.05 to $2.80.

ADA Price Prediction 2026
ScenarioPotential LowAverage PricePotential High 
Without ETF Approval$0.85$1.10$1.25
With ETF Approval + Retail Surge$1.20$1.65$2.05
Bullish Breakout (with ETF & macro support)$1.50$2.05$2.80

Cardano On-chain Analysis

As per Cardano’s on-chain metrics, “Smart Money” accumulation phase is the best observation right now, because the divergence between retail and institutional holders is more vivid than ever.

As the number of addresses holding between 10 and 1 million ADA is declining, and the consistent surge in the 10 million to 100 million coin bracket confirms this, this represents a major supply consolidation. The observation shows that these mega-whales are strategically absorbing the “weak hands” during price dips, effectively building a rock-solid fundamental floor for the asset. Also, the fact that the 1M to 10M coin bracket is also growing confirms that professional high-net-worth investors seem to be positioning for a recovery, too.

Cardano onchain

Similarly, the surge to 4.57 million total holders despite a grueling 2025 proves that Cardano’s ecosystem is expanding its reach even in a “stress test” environment. This growth in the holder base suggests that the asset is not being abandoned; rather, it is being redistributed into a more stable, long-term foundation. When a holder count rises as prices fall, it signals that the market views current levels as a deep-value opportunity rather than a reason to exit.

ADA Santimnet Data

Additionally, the Weighted Sentiment flipping the 0 line to 0.656 is a crucial momentum trigger. Professionally, this “0-line flip” indicates that the aggregate social and market bias has shifted from fear to optimism. 

ADA Weighted Sentiment

Combined with the strategic whale accumulation, this sentiment pivot suggests that the “disbelief” phase is ending and that a bullish rally is likely once the remaining retail sell pressure is fully absorbed by the growing whale cohorts.

Cardano (ADA) Price Prediction 2026 – 2030

Price PredictionPotential Low ($)Average Price ($)Potential High ($)
20262.753.003.25
20274.504.755.00
20285.255.505.75
20296.757.257.75
20309.009.7510.25

This table, based on historical movements, shows ADA prices to reach $10.25 by 2030 based on compounding market cap each year. This table provides a framework for understanding the potential Cardano price movements. Yet, the actual price will depend on a combination of market dynamics, investor behavior, and external factors influencing the cryptocurrency landscape.

Cardano Price Prediction 2031, 2032, 2033, 2040, 2050

YearPotential Low ($)Potential Average ($)Potential High ($)
203110.5011.0011.25
203213.7514.2514.75
203317.5018.5019.75
204034.2551.7569.25
2050128.25228.75329.50

Based on the historic market sentiments and trend analysis of the altcoin, here are the possible Cardano price targets for the longer time frames.

Never Miss a Beat in the Crypto World!

Stay ahead with breaking news, expert analysis, and real-time updates on the latest trends in Bitcoin, altcoins, DeFi, NFTs, and more.

FAQs

What is Cardano’s (ADA) price prediction for 2026?

Cardano could trade between $2.75 and $3.25 in 2026 if market sentiment improves, adoption grows, and key support levels hold.

Is Cardano a good long-term investment?

Cardano is considered a long-term project due to its research-driven development, scalability upgrades, and focus on decentralization.

What factors could drive ADA’s price higher in the future?

ETF approval, institutional adoption, network upgrades, and improved macro conditions could all positively impact ADA’s price.

Where will ADA be in 5 years?

In five years, ADA could trade between $7 and $10 if Cardano adoption grows, scalability improves, and the crypto market enters a strong cycle.

What will Cardano be worth in 2030?

By 2030, Cardano could be valued around $9 to $10 based on long-term growth, network usage, and sustained investor confidence.

❌