Reading view

Ethereum Price Slides as Binance Reserves Fall: Why Isn’t Supply Shock Working?

Is Ethereum Price Under Distribution Pressure Exchange Inflows Raises Flags

The post Ethereum Price Slides as Binance Reserves Fall: Why Isn’t Supply Shock Working? appeared first on Coinpedia Fintech News

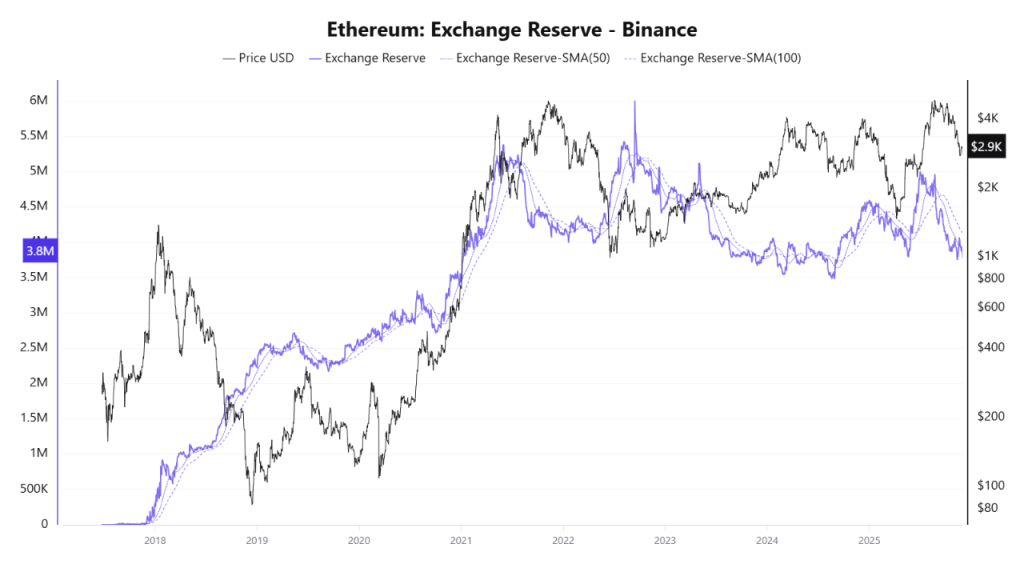
The Ethereum price keeps falling, despite supply on Binance keeps shrinking. Normally, declining exchange reserves are bullish and many immediately speculate for a rally. Coins leave exchanges, sell pressure drops, price rises. That’s the textbook theory.

But markets don’t care about textbooks, it works in a more twisted way and ordinary textbook theories don’t always work and ETH not going up is clear evidence of this.

Right now, the Ethereum price sits near $1908 with fading momentum, moving averages weakening after a bearish crossover on both long-term and shortterm spans, and downside pressure refusing to let up. So what’s overpowering the shrinking exchange supply narrative?

Shrinking Binance Reserves Explained

Binance’s ETH exchange reserve is trending downward again. That means ETH is being withdrawn. Under normal spot-driven conditions, that’s constructive theoretically.

As, less ETH on exchange typically means fewer coins readily available for sale.

Ethereum Price Slides as Binance Reserves Fall: Why Isn’t Supply Shock Working?

Well, here’s the catch: spot dynamics don’t dominate short-term price action anymore. Infact, Derivatives do as they have strong leverage support from exchanges that covers up spot activity in short term.

And that is what changes everything. Since, exchange reserve data reflects spot supply. But the Ethereum price chart is currently reacting more to futures positioning than to on-chain withdrawals.

Ethereum Price Slides as Binance Reserves Fall: Why Isn’t Supply Shock Working?

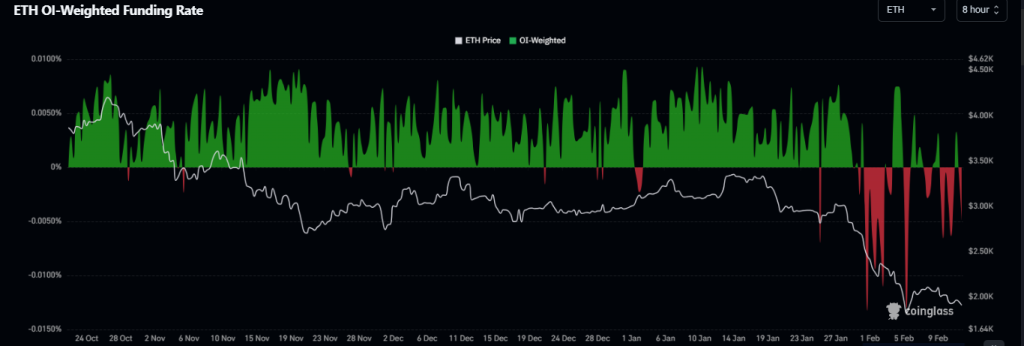
If open interest is elevated, funding rates has turned negative, and traders are leaning heavily short, aggressive derivatives selling can drag Ethereum/USD lower. That’s why even if spot supply is shrinking. In that scenario, futures pressure simply overwhelms spot optimism. And that appears to be what’s happening.

Withdrawals Don’t Always Mean Holding

But, still knowing what futures activities are capable of, then let’s be real. This clearly implies that withdrawals aren’t automatically bullish accumulation anymore and theories like these are not certain indicators anymore.

Also, withdrawals also implies that ETH can leave Binance for DeFi collateral use, staking, Layer-2 activity, OTC transactions, or even transfers to other exchanges. A decline in Binance reserves doesn’t guarantee coins are locked away long term. That’s a very practical and logical thing to assume at this point about exchange reserve metrics. As Global sell pressure can still persist elsewhere.

So, shrinking supply on one exchange doesn’t necessarily mean shrinking supply everywhere.

Weak Demand and Macro Drag

Here’s another inconvenient truth, as a reduced exchange supply isn’t enough without demand presence.

In the crypto sector this demand comes from stablecoins inflows. If these are weak, then risk appetite is low, or broader market sentiment is negative, as a result ETH price won’t respond positively. In this mix, if we add macro correlation into the mix then it complicates the outlook even more bleak.

Like, if broader crypto is soft or risk markets are under pressure, then reserve signals can be completely overridden.

There’s also the possibility that large players are playing both sides: withdrawing spot ETH while opening short positions in derivatives. Strategic hedging Or positioning for lower levels.

So What’s Next For Ethereum price?

If derivatives pressure continues and liquidity gets cleared to the downside, Ethereum price prediction models increasingly point toward a deeper support retest, potentially in the $1,700 region. That doesn’t invalidate long-term structure but it does suggest pain could come first.

For now, the Ethereum price remains under pressure despite falling Binance reserves, proving once again that in this market, supply signals alone don’t move charts but positioning does.

Does MVRV Z-Score Reset Hints Stability for MYX Price or Drop Toward $1 Next?

MYX Finance Price Prediction

The post Does MVRV Z-Score Reset Hints Stability for MYX Price or Drop Toward $1 Next? appeared first on Coinpedia Fintech News

Today, the MYX price didn’t just dip; it showed a brutal long squeeze that triggered around 50% collapse, wiping out overheated positioning in a short amount of time and sending liquidation data flashing red across derivatives dashboards.

According to Coinglass, total liquidations rekt over the past 24 hours reached $615.96K. Longs took the real hit $527.13K flushed, while shorts accounted for just $88.83K. That imbalance tells a clear story of a token dump. This wasn’t a balanced deleveraging; it seemed like a strategic one-sided unwind to extract most of the profits.

Liquidations Tell the Story in MYX Price

Does MVRV Z-Score Reset Hints Stability for MYX Price or Drop Toward $1 Next?

When long liquidations outweigh shorts nearly five to one, it usually means traders were leaning too hard in one direction. 

The onchain data confirms that they truly were leaning too much on the bullish side. Per Santiment’s data, the MYX price had previously pushed the MVRV Z-Score to 4.731, which seemed to be in a danger zone, as this metric had been rising and hadn’t risen much beyond 4.731 which showed that was the limit of previous bullish rise. 

That reading suggests market value had detached sharply from holders’ cost basis. In simpler terms, there were too many paper profits and markets covered that gap by this dump. As there was too much heat.

Does MVRV Z-Score Reset Hints Stability for MYX Price or Drop Toward $1 Next?

As a reason, the Z-score collapsed to 2.309 alongside a 50% price drawdown and surging volume. That’s not random volatility, in fact, the data points out that’s a violent shift from speculative euphoria to something closer to fair value. Massive unrealized gains got flushed out. Weak hands exited under pressure. Supply changed hands.

Well, here’s the kicker: that kind of washout can either mark the end for crypto or the reset before a base forms. Based on what the MYX price chart displays, it seems it is more interested in developing a base around $2.50-$3.00, aligning with an ascending trendline that’s been present for months.

MVRV Reset in Motion

A drop from 4.731 to 2.309 doesn’t scream bullish continuation, but it doesn’t scream structural death either. Historically, extreme Z-scores leave little room for sustainability. Pullbacks are common.

Now the market sits in a more neutral-bullish range, at least statistically speaking.

And that spike in volume during the drawdown? Classic capitulation behavior. It often accompanies panic-driven exits. But let’s be real, it also signals the market has aggressively repriced risk.

$3 Support Under Pressure

Technically, the MYX price chart shows the collapse reaching an ascending trendline support near $2.50-$3.0. That level matters. So far, it’s holding at CMP at $2.65, when writing.

Does MVRV Z-Score Reset Hints Stability for MYX Price or Drop Toward $1 Next?

But, If $3.0 breaks decisively, downside toward $1.0 becomes a realistic extension of the bearish outlook. No sugarcoating that. However, if consolidation builds around current levels and demand gradually returns, the foundation for recovery could form.

The MYX price prediction now hinges on whether this support becomes accumulation or surrender.

Utility Concerns Emerge

And then there’s the uncomfortable detail. Lower daily exchange activity appears to have played a role too in a recent dump. Because, MYX’s utility is driven by trading activity on its platform. Recent dashboard data shows declining open interest across key pairs like BTC/USDT and ETH/USDT.

Does MVRV Z-Score Reset Hints Stability for MYX Price or Drop Toward $1 Next?

Less activity. Less utility demand. Investors noticed and they basically dumped.

So while the long squeeze triggered the collapse, slowing exchange momentum may have lit the fuse. Whether that trend stabilizes could determine what happens next for MYX price.

Worldcoin Price Prediction 2026, 2027 – 2030: Will WLD Price Reach $10?

price prediction Worldcoin

The post Worldcoin Price Prediction 2026, 2027 – 2030: Will WLD Price Reach $10? appeared first on Coinpedia Fintech News

Story Highlights

  • The live price of the WLD token is  $ 0.39199640
  • Price predictions for 2026 range from up to $4.18.
  • Long-term forecasts suggest potential highs of $35.60 by 2030.

WLD price was almost $12 ATH but went crashing to $0.50 in the last remaining days of 2025. This has raised concerns among investors and traders about WLD’s future, and as a result, the Worldcoin price prediction 2026 has become a topic of significant discussion, with many being intrigued about its prospects in the coming year.

Its prolonged period of downtrend has left many wondering if the project’s initial buzz was fading. But, behind the scenes, Worldcoin is still quietly building its platform. Now, experts view Q1 2026 as a potential turning point where renewed momentum could be observed.

So many are now asking a crucial question: is this the start of a new chapter for Worldcoin? Will the project’s focus on decentralized identity and its connection to the AI sector be enough to fuel a powerful comeback and reclaim its spot in the market spotlight?

Let’s delve into the anticipated Worldcoin price predictions 2026 to 2030 and the years to come.

Worldcoin Price Today

Cryptocurrency Worldcoin
Token WLD
Price $0.3920 up 7.74%
Market Cap$ 1,108,032,235.03
24h Volume$ 91,399,250.8310
Circulating Supply2,826,638,833.6567
Total Supply10,000,000,000.00
All-Time High$ 11.8171 on 10 March 2024
All-Time Low$ 0.3140 on 06 February 2026

CoinPedia’s WLD Price Prediction 2026

Entering 2026, in a bleeding state, wasn’t so sympathetic, as investors didn’t buy back at discounts; as a result, January and even February fell, slipping to $0.27 in February.

However, if the critical support at $0.31 fails to hold, the price may undergo further sideways stagnation or a retest of its floor near $0.24.

Worldcoin Price Prediction 2026

As 2026 dawned, the market found itself in a precarious position, struggling to regain its footing. Investor sentiment remained lackluster, with many refraining from seizing opportunities even as prices dipped to massive discounts. Consequently, the downward trend persisted into January and even February, with the price plummeting to a low of $0.27 by mid-February.

The situation remains precarious; should the crucial support level at $0.31 fail to withstand selling pressure, the price may not only linger in a phase of stagnation but could also reattempt a dip towards its critical floor around $0.24.

Worldcoin Price Prediction 2026

WLD On-Chain Analysis

The WLD Spot Average Order Size chart reveals persistent green clusters into January 2026, indicating sustained “Big Whale” participation. This heavy institutional accumulation suggests that smart money is aggressively building positions, viewing the current price range as a high-conviction entry point.

Worldcoin Spot Avg Order Size

Similarly, development activity on Worldcoin is surging to new local highs in January 2026, showcasing intense builder commitment. This spike in innovation, combined with whale interest, creates a powerful fundamental divergence that historically precedes a massive price reversal.

Worldcoin On Chain Activity

WLD Price Forecast 2026 – 2030

YearPotential Low ($)Average Price ($)Potential High ($)
20262.506.009.50
20277.0011.2515.70
202810.7515.9521.15
202915.6521.6027.50
203019.7527.7535.60

This table, based on historical movements, shows Worldcoin price to reach $35.60 by 2030 based on compounding market cap each year. This table provides a framework for understanding the potential Worldcoin price movements. Yet, the actual price will depend on a combination of market dynamics, investor behavior, and external factors influencing the cryptocurrency landscape.

Worldcoin Price Forecast 2026

Worldcoin’s price for 2026 is projected to range between $2.50 and $9.50, with an average price of approximately $6.00.

WLD Price Prediction 2027

Worldcoin’s price for 2027 is expected to fluctuate between $7.00 and $15.70, with an average price of around $11.25.

Worldcoin Price Forecast 2028

Worldcoin’s price for 2028 is anticipated to be between $10.75 and $21.15, with an average price of about $15.95.

WLD Token Ai Price Forecast 2029

Worldcoin’s price for 2029 is projected to vary from $15.60 to $27.50, with an average price of roughly $21.60.

Worldcoin AI Token Price Prediction 2030

Worldcoin’s price for 2030 is expected to fluctuate between $19.75 to $35.60, with an average price of approximately $27.75.

Market Analysis

Firm Name20262030
Swapspace$1.30$2.07
coincodex$2.40$4.30
DigitalCoinPrice$3.02$4.06

*The targets mentioned above are the average targets set by the respective firms.

Never Miss a Beat in the Crypto World!

Stay ahead with breaking news, expert analysis, and real-time updates on the latest trends in Bitcoin, altcoins, DeFi, NFTs, and more.

FAQs

What is Worldcoin?

Worldcoin is a cryptocurrency project aiming to distribute digital assets to a global audience through a unique identity-verification system.

What is the current price of 1 Worldcoin?

At the time of writing, the price of one WLD token was  $ 0.00349731.

What is the Worldcoin price prediction for 2026?

WLD price forecasts for 2026 suggest a potential range between $2.50 and $9.50, depending on market recovery and technical breakouts.

What is the Worldcoin price prediction for 2030?

Long-term models suggest WLD could trade from about $19.75 to $35.60 by 2030 under bullish conditions.

What is the Worldcoin price prediction for 2040?

While speculative, extended growth forecasts envision potential for WLD beyond 2040 based on adoption and tech use cases.

Is Worldcoin a good long-term investment?

Worldcoin offers long-term potential due to its focus on decentralized identity and AI, but it remains volatile and requires risk awareness.

What factors influence WLD price the most?

WLD price is driven by AI narrative strength, user adoption, token supply dynamics, market sentiment, and overall crypto market trends.

Decentraland Price Prediction 2026, 2027 – 2030: Will MANA Price Hit $1?

Decentraland Price Prediction

The post Decentraland Price Prediction 2026, 2027 – 2030: Will MANA Price Hit $1? appeared first on Coinpedia Fintech News

Story Highlights

  • The live price of the MANA crypto token is  $ 0.10038550.
  • Price predictions for 2026 range from $0.247 – $0.40.
  • By 2030, the MANA price could surge toward $4.90 due to growing trader activity.

Decentraland (MANA) is one of the earliest and most recognizable names in the metaverse sector. Built on Ethereum, Decentraland allows users to own virtual land, create experiences, and participate in a digital space using its native token, MANA.

While the overall metaverse narrative has cooled since its 2021 peak, Decentraland continues to maintain an active ecosystem focused on virtual events, social experiences, and creator-led development.

If you’re curious about Decentraland’s future and wondering whether MANA is a good investment, this MANA price prediction 2026–2030 will walk you through its potential growth and long-term outlook.

Decentraland Price Today

Cryptocurrency Decentraland
Token MANA
Price $0.1004 up 5.52%
Market Cap$ 197,732,230.31
24h Volume$ 16,836,647.9331
Circulating Supply1,969,729,010.3688
Total Supply2,193,179,327.3202
All-Time High$ 5.9023 on 25 November 2021
All-Time Low$ 0.0079 on 13 October 2017

Coinpedia’s MANA Price Prediction 2026

MANA cryptocurrency has experienced a 98% decline since the FTX crash in 2021. However, it is showing remarkable resilience. The critical support level established in early 2021 is essential. If MANA can rise and close above $0.35 in the first quarter of 2026, it could set the stage for an impressive 1,000% increase, making a $1.00 target price for the year not just possible, but highly attainable.

Coinpedia’s MANA Price Prediction 2026

Decentraland (MANA) Price Prediction 2026

MANA crypto’s multi-year performance chart reflects a dramatic 98% decline since the FTX crash in 2021, leading many enthusiasts and investors to speculate about the project’s potential end. 

This sharp price depreciation has instilled fear among investors, who have witnessed continuous negative price action for years. However, it is essential to consider the historical support level that has been in place since early 2021, which warrants attention despite the recent stagnation in price movement.

Although the project has experienced considerable setbacks over the past half-decade, there still remain arguments for a potential revival. The primary argument is the avoidance of delisting from several exchanges, indicating that MANA/USD continues to pursue efforts aimed at market recovery and still retains decent liquidity in a project with an over $250 million market cap.

MANA Price Forecast 2026

Thus, the current retest of this support level is particularly noteworthy. A reversal at this juncture could result in substantial upward momentum. Conversely, if this support range is breached, it would likely reinforce perceptions of MANA crypto as a failing venture.

That said, it is crucial to closely monitor the $0.35 level. Should MANA successfully breach this level and maintain above it with a weekly close, this would signify a significant “Change of Character” for the price dynamic. Under such circumstances, a conservative target of $1.00 for the year may be warranted.

Price PredictionPotential Low ($)Average Price ($)Potential High ($)
20260.951.451.95

MANA On-chain Analysis

MANA’s exchange reserves have plummeted from 606M to 312M tokens, a massive 48% supply drain signaling aggressive accumulation. This consistent liquidity exit creates a powerful supply-crunch, drastically reducing sell-side pressure and preparing the asset for a significant parabolic breakout as market demand grows.

Mana On Chain

Furthermore, a bullish transfer of wealth is underway. While retail holders dump their positions, institutional whales holding 10M–1B tokens are absorbing the supply. This shift from weak to strong hands confirms deep conviction among major players, providing a solid floor for MANA’s future growth.

MANA On Chain Network Actvity

Decentraland MANA Price Prediction 2026 – 2030

Price Prediction YearsPotential Low ($)Average Price ($)Potential High ($)
Decentraland (MANA) Price Forecast 20260.951.451.95
MANA Token Price Forecast 20271.552.152.85
Decentraland Price Analysis 20282.453.053.65
Decentraland Price Prediction 20293.553.954.35
MANA Price Prediction 20304.154.655.15

Decentraland (MANA) Price Forecast 2026

According to forecast prices and technical analysis, Decentraland’s price is projected to reach a minimum of $0.95 in 2026. The maximum price could hit $1.95, with an average trading price of around $1.45.

MANA Token Price Forecast 2027

Looking forward to 2027, MANA’s price is expected to reach a low of $1.55, with a high of $2.85 and an average forecast price of $2.15.

Decentraland Price Analysis 2028

In 2028, the price of a single Decentraland is anticipated to reach a minimum of $2.45, with a maximum of $3.65 and an average price of $3.05.

Decentraland Price Prediction 2029

By 2029, Decentraland’s price is predicted to reach a minimum of $3.55, with the potential to hit a maximum of $4.35 and an average of $3.95.

Decentraland (MANA) Price Prediction 2029

In 2030, the MANA coin price is predicted to touch its lowest price at $4.15, hitting a high of $5.15 and an average price of $4.65.

What Does The Market Say?

Year202620272030
CoinCodex$0.26$0.39$0.67
Tokenmetrics$0.78$1.41$2.11
DigitalCoinPrice$0.33$0.61$3.32
Never Miss a Beat in the Crypto World!

Stay ahead with breaking news, expert analysis, and real-time updates on the latest trends in Bitcoin, altcoins, DeFi, NFTs, and more.

FAQs

What is Decentraland (MANA) and how does it work?

Decentraland is a virtual world on Ethereum where users buy land, create experiences, and trade using the MANA token.

What is the predicted price of MANA in 2026?

MANA could trade between $0.247 and $0.40 in 2026, with potential upside if it maintains key support and adoption grows.

What is Decentraland’s price prediction for 2030?

By 2030, MANA could reach a high of $4.92, a low of $4.15, and an average price of $4.65, reflecting adoption and growing metaverse use.

How high could MANA price go in 2040?

Over the long term, MANA may see substantial growth if adoption and virtual land demand expand, potentially reaching a high of $12–$15 by 2040.

What drives the price of MANA?

MANA’s price is influenced by virtual land demand, user growth, creator tools, and on-chain activity in Decentraland.

Can Decentraland compete with other metaverse projects?

Yes, if Decentraland expands events, gaming, and creator tools, it could attract more users and remain a top metaverse platform.

Algorand Price Prediction 2026, 2027 – 2030: Will ALGO Price Hit $1?

Algorand Price Prediction

The post Algorand Price Prediction 2026, 2027 – 2030: Will ALGO Price Hit $1? appeared first on Coinpedia Fintech News

Story Highlights

  • The live price of the Algorand is  $ 0.09120747
  • Price predictions suggest that ALGO has the potential to hit $0.65 to $1.35 by the end of 2026.
  • Long-term forecasts indicate potential highs of $5.65 by 2030.

Algorand’s strong push for scalability, security, and decentralization is paying off. With the launch of AlgoKit 3.0 in Q1 2025 and growing developer interest, ALGO adoption has improved and is now on the rise. The rising adoption is beneficial for an asset, as it is directly proportional to a token’s price.

But the big question for intrigued market participants still remains: Can ALGO Price hit $1 this cycle? Read our in-depth Algorand Price Prediction 2025 and long-term outlook through 2030 to find out.

Algorand Price Today

Cryptocurrency Algorand
Token ALGO
Price $0.0912 up 1.98%
Market Cap$ 809,101,086.36
24h Volume$ 38,559,616.7402
Circulating Supply8,870,995,609.4442
Total Supply10,000,000,000.00
All-Time High$ 3.2802 on 21 June 2019
All-Time Low$ 0.0822 on 06 February 2026

Coinpedia’s ALGO Price Prediction 2026

Algorand (ALGO) has been trading sideways since 2022, a stark contrast to its 2021 growth. If demand increases, it could target $0.60 or $0.80 by mid-2026. But, a weekly close at $0.80 may lead to further gains, potentially reaching $2.0 or even $3.0, yielding over 2200% returns.

Algorand February Price Prediction 2026

In January, it lost the $0.1125 support level and fell to $0.0806 by February. Despite a multi-year demand area, the impact has been muted, and February appears likely to trade within this range for an extended period. Based on its price action, if $0.1050 is breached, it could aim for $0.1300 by the end of February. However, if the decline continues, it might slide back to $0.0806 or even lower.

ALGO February Outlook 2026

ALGO Price Analysis 2026

Looking ahead through 2026, the secondary indicator chart suggests a cautious recovery rather than an immediate vertical moonshot. Technical indicators like the RSI are hovering in neutral territory (35−45), indicating that while the “extreme fear” has subsided, the momentum is not yet in a full-blown bull regime. 

Most analyst models and indicator trends project ALGO to fluctuate between $0.12 and $0.19 for the first half of the year as it tests overhead resistance. If the network’s push into real-world asset tokenization gains traction, a successful breakout above the 200-day SMA could open the door for a year-end target near $0.25 – $0.30. 

ALGO Price Prediction 2026

However, failure to hold the $0.10 support would likely result in further consolidation near the $0.08 all-time low.

AVAX Onchain Outlook

The on-chain outlook for Algorand (ALGO) is flashing bullish signals that suggest a transition from retail-led speculation to institutional-grade accumulation. A notable increase in average order sizes indicates that “whale” investors are actively participating, effectively absorbing supply during consolidation phases to reduce downside risk. 

AVAX Onchain Outlook

Simultaneously, the 90-day Cumulative Volume Delta (CVD) has entered a “Taker Buy Dominant” phase, which historically correlates with upward price movement as aggressive buyers consistently outpace sellers in the open market. These metrics, paired with a “cooling” spot and futures volume bubble map, suggest the market is moving through a healthy period of stabilization and building the necessary liquidity for a potential breakout.

Algo CVD Data

Algorand Price Targets 2026 – 2030

YearPotential Low ($)Potential Average ($)Potential High ($)
20260.651.01.35
20270.901.502.00
20281.402.102.90
20291.752.954.15
20302.504.055.65

Algorand (ALGO) Price Forecast 2026

Moving forward to 2026, the ALGO price may record a maximum price of $1.35. With a potential low of $0.65, the average price could settle at around $1.0.

ALGO Coin Price Projection 2027

Looking ahead to 2027, the Algorand crypto token may range between $0.90 and $2.0. With this, the average trading price could settle at around $1.50 for the year.

Algorand Crypto Price Action 2028

In 2028, the ALGO coin with a potential surge could reach a high of $2.90, a low of $1.40, and an average of $2.10.

ALGO Token Price Analysis 2029

Moving into 2029, the  Algorand coin could range between $1.75 and $4.15. Considering the buying and selling pressure, the average price could settle at around $2.95.

ALGO Price Prediction 2030

By 2030, the value of a single Algorand token could reach a high of $5.65, a low of $2.50, and an average of $4.05.

Market Analysis

Firm Name202520262030
Currencyanalytics$0.67$0.97$4.06
Priceprediction.net$0.18$0.258$1.10
DigitalCoinPrice$0.82$1.28$2.60
Never Miss a Beat in the Crypto World!

Stay ahead with breaking news, expert analysis, and real-time updates on the latest trends in Bitcoin, altcoins, DeFi, NFTs, and more.

FAQs

What is the Algorand price prediction for 2026?

Algorand’s price in 2026 is forecasted between about $0.65 and $1.35, with an average near $1 if momentum and adoption improve.

What is the ALGO price prediction for 2027?

In 2027, ALGO may range from $0.90 to $2.00, with an average price around $1.50, depending on market demand and adoption.

How much will Algorand (ALGO) be worth in 2030?

By 2030, ALGO could reach a high of $5.65, a low of $2.50, and an average price of $4.05, reflecting growing adoption.

How much will Algorand be worth in 10 years?

Over the next 10 years, ALGO could reach $5.65 at its peak, driven by network growth, adoption, and real-world asset tokenization.

What factors influence Algorand’s price growth?

Network adoption, scalability, institutional participation, and real-world asset tokenization are key factors driving ALGO’s price potential.

ALGO
BINANCE

Polygon (MATIC) Price Prediction 2026, 2027 – 2030: Will MATIC Price Surge to $1?

Polygon (MATIC) Price Prediction 2026, 2027 - 2030

The post Polygon (MATIC) Price Prediction 2026, 2027 – 2030: Will MATIC Price Surge to $1? appeared first on Coinpedia Fintech News

Story Highlights

  • The live price of the Polygon coin is  $ 0.21819891.
  • POL price predictions for 2026 suggest potential highs of $0.7548.
  • Long-term forecasts indicate POL could reach $4.94 by 2030.

Polygon (POL) has a mind-blowing Layer-2 scaling solution project for Ethereum, which is primarily designed to address slow speeds and the network’s high transaction fees. 

As a result, Polygon is seen as a revolutionary framework for developers and users, as it attracts by offering a more efficient Ethereum experience, which is the reason contributing to POL’s price value, too.

Through, POL, which is its native token (formerly MATIC), is utilized for transaction fees and network governance, in the framework of interconnected Ethereum-compatible blockchain networks. 

Its use case makes it an attractive altcoin, and even its token POL price is attracting attention. The coin is expected to show a surge in the coming sessions, but it would require a technical eye to understand. 

Therefore, if you are curious about whether the POL price can rebound to $1. Will Polygon go up? And is Polygon a good investment? We bring our Polygon Price Prediction for 2025 – 2030 to explore the POL price prediction.

Polygon Price Today

Cryptocurrency Polygon
Token MATIC
Price $0.2182 up 2.88%
Market Cap$ 402,374,198.74
24h Volume$ 1,217,344.7306
Circulating Supply0.00
Total Supply10,000,000,000.00
All-Time High$ 2.92 on 27 December 2021
All-Time Low$ 0.0030 on 10 May 2019

Coinpedia’s Polygon Price Prediction 2026

In 2025 and 2026, prices fell, reaching $0.0850 within a narrowing wedge. A breakout above this level could lead to $0.19, $0.30, and $0.42. Without improving sentiment, declines in the POL price may continue.

Polygon Price Prediction 2026

In 2025, we saw notably pessimistic price action, a trend that continued into 2026, with prices following the same downward trajectory. 

The price has been moving within a narrowing falling wedge, and by February, it reached $0.0850, which coincides with the lower edge of the channel. This level is crucial for the POL/USD pair because if demand returns, the narrowing range could be broken, potentially allowing a retest of $0.19. A decisive breach above this level would signal a breakout from the falling wedge pattern, opening the way for higher price levels, such as $0.30 and $0.42.

However, if sentiment does not improve as expected, the falling wedge may continue to narrow until it encounters demand. Given the current market drawdown, the likelihood of the POL price continuing to decline remains high.

POL Price Prediction 2026
YearPotential Low ($)Potential Average ($)Potential High ($)
Polygon Price Action 2026 (conservative)$0.10$0.26$0.53

POL On-Chain Analysis

The on-chain landscape for POL is flashing a major recovery signal as the 30-day moving average of Daily Active Addresses (DAA) shows a clear and sustained upward trend in early 2026.

This metric serves as the vital heartbeat of the ecosystem, indicating that organic utility and user engagement are returning to the network at a steady, reliable pace. Unlike temporary spikes that often signal speculative noise, a rising 30-day average suggests a strengthening network effect and a growing demand for blockspace. 

For investors, this return of on-chain activity is a fundamental precursor to price appreciation, as it confirms that the ecosystem is not only retaining its base but actively expanding its reach.

POL Onchain analysis

Complementing this surge in network activity is a powerful development in supply distribution, specifically within the “whale” and institutional cohorts. Addresses holding between 100,000 and 10 million POL have seen significant growth, signaling a phase of high-conviction accumulation by “smart money.”

This specific bracket often represents mid-to-large-scale investors who lead market cycles by absorbing supply during consolidation phases. This strategic positioning by larger entities reduces sell-side pressure and creates a robust fundamental floor for the asset. 

POL Network Activity

When rising active addresses align with such aggressive whale accumulation, it speaks a definitively bullish language for the POL trajectory, suggesting that the most influential market participants are preparing for a major expansion in value.

Polygon Price Prediction 2026 – 2030

YearPotential Low ($)Potential Average ($)Potential High ($)
Polygon Price Action 2026$0.18870$0.47179$0.75488
POL Price Prediction 2027$0.30194$0.75488$1.20782
Polygon Crypto Price Forecast 2028$0.48311$1.20782$1.93252
POL Coin Price Projection 2029$0.77297$1.93252$3.09205
Polygon Price Prediction 2030$1.23676$3.09205$4.94729

This table, based on historical movements, shows POL price to reach $4.94 by 2030 based on compounding market cap each year. This table provides a framework for understanding the potential POL price movements. Yet, the actual price will depend on a combination of market dynamics, investor behavior, and external factors influencing the cryptocurrency landscape.

Polygon Price Action 2026

Anticipating further expansion, MATIC’s potential high for 2026 is projected to be $0.75488, while the potential low is estimated at $0.18870, resulting in an average price of $0.47179.

POL Price Prediction 2027

MATIC crypto can make a potential high of $1.20782 in 2027, with a potential low of $0.30194, leading to an average price of $0.75488.

Polygon Crypto Price Forecast 2028

As the POL price progresses, the potential high price for 2028 is projected to be $1.93252, with a potential low of $0.48311, resulting in an average price of $1.20782.

MATIC Coin Price Projection 2029

Polygon coin price potential high for 2029 could be $3.09205, while a potential low of $0.77297, with an average price of $1.93252.

Polygon Price Prediction 2030

With an established position in the market, POL’s potential high for 2030 is projected to be $4.94729. On the flip side, a potential low of $1.23676 will result in an average price of $3.09205.

Market Analysis

Firm Name202520262030
CoinCodex$ 0.71$ 0.50$ 0.90
Binance$0.24$0.26$0.31
Flitpay$6.25$4$10.4
Never Miss a Beat in the Crypto World!

Stay ahead with breaking news, expert analysis, and real-time updates on the latest trends in Bitcoin, altcoins, DeFi, NFTs, and more.

FAQs

Is Polygon (POL) a good long-term investment?

Polygon is considered a strong long-term project due to its Ethereum scaling role, active development, and growing ecosystem, but it still carries market risk.

What is the Polygon price prediction for 2026?

For 2026, POL price forecasts suggest a potential range between $0.10 and $0.75, depending on market recovery and technical breakout patterns.

Can Polygon reach $5 by 2030?

Some long-term projections indicate POL could approach $4–$5 by 2030 if adoption accelerates and the crypto market enters a sustained growth cycle.

What factors affect Polygon (POL) price the most?

POL price is influenced by Ethereum demand, network usage, market liquidity, macroeconomic trends, and overall investor sentiment in crypto markets.

MATIC
BINANCE

The Graph Price Prediction 2026, 2027 – 2030: Will GRT Price Go Up?

The Graph (GRT) Price Prediction

The post The Graph Price Prediction 2026, 2027 – 2030: Will GRT Price Go Up? appeared first on Coinpedia Fintech News

Story Highlights

  • The live price of The Graph crypto is  $ 0.02696719.
  • Price predictions for 2026 range from $0.05 to $1.75.
  • In 2030, GRT may hit a high of $3.55, reflecting long-term growth.

AI may be taking center stage in today’s tech revolution, but behind every smart application lies the challenge of accessing and organizing reliable data. That’s where The Graph (GRT) steps in—an innovative indexing protocol transforming how blockchain data is queried. 

As interest in The Graph surges, especially after its major 2025 upgrades and the launch of substreams-powered subgraphs, the question on everyone’s mind is: Can GRT price reach $1? In this article, we break down its technical potential, rising developer adoption, and market sentiment in our detailed The Graph Price Prediction 2026–2030.

The Graph Price Today

Cryptocurrency The Graph
Token GRT
Price $0.0270 up 5.28%
Market Cap$ 288,766,548.89
24h Volume$ 15,272,459.8447
Circulating Supply10,708,068,422.3893
Total Supply11,470,160,089.0557
All-Time High$ 2.8751 on 12 February 2021
All-Time Low$ 0.0231 on 06 February 2026

Coinpedia’s GRT Price Prediction 2026

In 2026, it fell below historical lows, reaching a new all-time low (ATL) of $0.0228, shaking investor confidence. It now has the potential to drop further, possibly forming a new ATL of $0.0100. However, if demand increases, $0.0400 could be revisited.

Why On-Chain Hints Flourishing Network and Ecosystem Growth In “The Graph”?

The Graph Network, has recently improved its fundamental growth, yet this strength is sharply diverging from its prolonged bearish GRT price action. 

The network, is majorly used by developers and data consumers who pay to query data, is flourishing, per onchain. yet, the GRT remains significantly suppressed, presenting a notable contrast that is at the heart of its current analysis.

As per the data onchain, the performance of The Graph Network can be directly assessed by the growing “volume of queries” and the “accrual of query fees”. 

In this context, the data reveals that over the last six months, its query volume has impressively reached 11.6 billion, which displays a clear sign of robust developer adoption that has been particularly fast since the network’s migration to Arbitrum.

Similarly, the query fees generated by data consumers on Arbitrum have also reached an all-time high of $8.11 million in August. 

This success is supported by a large community of over 167,000 delegators and 7,204 active curators, all contributing to the network’s health. 

In addition, the growing ecosystem is also in the spotlight by recent integrations with major brands like Tron, pointing to a strengthening on a fundamental level.

GRT Price Prediction 2026

For 2026, breaking below its historical lows was not what many investors were expecting, as assets, in particular, tend to show bullish momentum at historical lows based on a horizontal level.

But by February, it’s already breached this zone and marked a new STL of $0.0228, which has shaken investors’ trust massively. As this crypto shows no signs of improvement in its price action, in the worst-case scenario, it could even fall beneath the current ATL and mark a new one around $0.0100.

GRT Price Prediction 2026

GRT On-Chain Analysis

Since the catastrophic decline from $2.15 in 2021, the total number of holders has continued to increase despite the significant price drop. This indicates that, over time, while the price has faced substantial setbacks, the community of believers in the project has been steadily growing.

GRT on-chain analysis

Analyzing the supply on exchanges provides insight into the 2021 downturn, which can be attributed to the FTX crash and a remarkable influx of assets onto exchanges. In late 2020, exchange supply was below 250 million; however, by May 2023, it surged to 1.36 billion. This influx of supply exerted downward pressure on GRT’s price.

In contrast, the latter half of 2023 onwards has seen a consistent decline in exchange supply. By January 2026, this figure had fallen to 757.21 million almost half of the peak supply recorded on exchanges. This trend aligns with the sustained growth in total holders of GRT, clearly indicating accumulation. 

GRT On Chain Network Acitvity

GRT Coin Price Prediction 2026-2030

YearPotential Low ($)Potential Average ($)Potential High ($)
20261.051.201.75
20271.551.702.15
20282.152.202.65
20292.252.703.25
20303.153.203.55

The Graph Price Targets 2026

By 2026, with continued adoption and network improvements, GRT could trade between $1.05 and $1.75, with an average price of approximately $1.20.

GRT Coin Price Prediction 2027

In 2027, GRT might range between $1.55 and $2.15, averaging around $1.70 as the network potentially sees increased usage and partnerships.

The Graph Token Price Prediction 2028

For 2028, GRT could trade between $2.15 and $2.65, with an average price of approximately $2.20, assuming continued growth in the blockchain indexing sector.

GRT Crypto Price Projection 2029

By 2029, GRT might range between $2.25 and $3.25, with an average trading price of $2.70, as the project matures and potentially captures a larger market share.

The Graph Price Prediction 2030

By 2030, GRT could potentially reach a high of $3.55, with a low of $3.15 and an average price of approximately $3.20, reflecting a decade of development and adoption.

What Does The Market Say?

Firm Name20262030
Changelly$0.320$1.89
priceprediction.net$0.493$2.26
DigitalCoinPrice$0.27$0.58
Never Miss a Beat in the Crypto World!

Stay ahead with breaking news, expert analysis, and real-time updates on the latest trends in Bitcoin, altcoins, DeFi, NFTs, and more.

FAQs

What is the price of 1 GRT Token?

At the time of writing, the price of 1 The Graph Token was  $ 0.02696719

What is the price prediction for GRT in 2026?

GRT price in 2026 may range from $0.05 in weak demand to $1.75 in strong demand, with an average target near $1.20.

What could The Graph (GRT) be worth in 2030?

By 2030, GRT could trade between $3.15 and $3.55 if adoption continues and the protocol becomes a core data layer for Web3.

Is The Graph (GRT) a good long-term investment?

GRT has strong fundamentals, growing developer adoption, and real utility, making it a promising long-term project, though price volatility remains high.

Can GRT reach $1?

Yes, based on network growth and adoption, some projections suggest GRT could reach between $1.05 and $1.75 by 2026, though market conditions will ultimately determine its price path.

GRT
BINANCE

BlackRock Enters the UNI Ecosystem: Are Whales Betting on a Major Uniswap Price Reversal?

Uniswap Whale Activity Hits 4-Year High as Retail FOMO Builds, UNI Price Jumps 70%

The post BlackRock Enters the UNI Ecosystem: Are Whales Betting on a Major Uniswap Price Reversal? appeared first on Coinpedia Fintech News

The Uniswap price chart just printed a sharp 15% intraday rise, and this time it’s not just retail noise. Infact, Whale transaction counts have spiked aggressively and the timing is hard to ignore. UNI recently tapped $2.35, a level closely aligned with late-2020 support zones. Now, heavy capital is stepping in post BlackRock news.

Is the rise from UNI’s lowest point in years a Coincidence? Maybe or Maybe not. let’s look closer for a much clearer perspective.

Why Whales Are Moving & Buying in Sync in Uniswap crypto

Over the past 24 hours, based on Santiment onchain data, 10 addresses have executed transactions exceeding $1 million. At the same time, more than 175 addresses moved over $100K each, both are classified as whale transactions. That’s not random liquidity shuffling, infact that’s concentrated involvement.

BlackRock Enters the UNI Ecosystem: Are Whales Betting on a Major Uniswap Price Reversal?

Meanwhile, whale cohorts holding between 1,000 and 1 million UNI have increased their balances. In plain terms, larger players aren’t just trading the bounce they’re mass accumulating.

BlackRock Enters the UNI Ecosystem: Are Whales Betting on a Major Uniswap Price Reversal?

On the Uniswap price chart, this activity coincides with price stabilizing near long-term structural support. And while broader market sentiment remains fragile, this sort of synchronized whale behavior tends to precede volatility one way or another.

Network Activity Rebound Supports Bullish View For Uniswap price

Now here’s where it gets interesting. Daily active addresses jumped to 1,853 from around 1,150 in prior days. That’s a material uptick in on-chain participation. Interest in Uniswap crypto isn’t just speculative but real users are interacting again and that’s the most positive thing happened.

BlackRock Enters the UNI Ecosystem: Are Whales Betting on a Major Uniswap Price Reversal?

At the same time, the 30-day MVRV ratio has improved. That metric essentially tracks whether recent buyers are underwater. With it recovering, traders from the past month are beginning to regain position strength. If momentum continues, short-term recovery pressure could build.

BlackRock Enters the UNI Ecosystem: Are Whales Betting on a Major Uniswap Price Reversal?

Still, let’s be real. A bounce doesn’t automatically mean a trend shift.

BlackRock Catalyst

So why the sudden spark in what was otherwise a bearish atmosphere?

Uniswap Labs and Securitize announced a partnership with BlackRock to enhance DeFi liquidity for institutional investors via the USD Institutional Digital Liquidity Fund (BUIDL). The collaboration enables on-chain trading of BUIDL shares through UniswapX, an auction-driven protocol.

That headline alone was enough to jolt the UNI/USD pair higher.

Institutional bridges tend to shift perception fast. And perception, especially in crypto, often drives short-term price action harder than fundamentals.

UNI/USD Key Deciding Resistance Looms

Now comes the harder part, as the intraday spike loved by all and bullish speculation already jumped. But, the worries has not over yet, as immediate resistance range sits between $5.50 and $7.00. 

Clearing that band would suggest the Uniswap price is re-entering a broader bullish range. Failure to build above current momentum, however, could send UNUSD back into consolidation most likely under $4.00 again, until macro sentiment improves.

BlackRock Enters the UNI Ecosystem: Are Whales Betting on a Major Uniswap Price Reversal?

So, what’s next? For now, the Uniswap price analysis suggests that it is responding to whale accumulation, improving on-chain metrics, and an institutional headline. Whether this develops into a sustained move depends less on today’s spike and more on whether the broader market narrative decides to cooperate.

LayerZero Price (ZRO) Skyrockets 75%: Why Investors Should Watch for a Cool-Off

LayerZero Zero Layer 1 blockchain

The post LayerZero Price (ZRO) Skyrockets 75%: Why Investors Should Watch for a Cool-Off appeared first on Coinpedia Fintech News

The LayerZero price doesn’t usually move quietly. This time, it detonated. A 38% intraday spike and over 75% in seven days. And suddenly, ZRO is the token everyone’s pretending they were watching all along.

What lit the match? Institutional gravity. An announcement confirming a Ark Invest CEO Cathie Wood’s advisory board addition hit the tape, reinforcing a clear narrative: finance is shifting on-chain, and LayerZero intends to be part of that infrastructure layer. Add to that a strategic investment from Tether tied to interoperability tech used by USDt0, and the story writes itself, as this shows credibility, capital, and long-term positioning.

But let’s be real. The market doesn’t move on vision alone. It moves on positioning.

LayerZero Price Surged WIth Institutional Boost

The news cycle delivered exactly what speculative markets crave for. Institutional attention, Reduced perceived project risk, Signals of long-term relevance and most importantly the fresh capital that’s looking for exposure.

That cocktail pushed the LayerZero price sharply higher and flipped sentiment fast. On the LayerZero price chart, the vertical structure is hard to ignore. ZRO/USD didn’t grind up. It sprinted.

And whenever a chart starts sprinting, traders start sweating.

Big Resistance Lies Ahead In ZRO/USD

Here’s the technical friction point. On the daily timeframe, ZRO/USD is facing resistance in the $2.45–$2.50 range. That’s the immediate ceiling. Price pushing beyond it won’t be easy, and the current hesitation suggests the rally may be running hot.

Now, the nearest round number support sits near $2.00, where possibly other major players are having eye at. If momentum cools and since overheated metrics suggest it might then that’s the level traders are quietly circling.

LayerZero Price (ZRO) Skyrockets 75%: Why Investors Should Watch for a Cool-Off

The broader LayerZero price prediction now hinges on one simple condition: a sustained daily close above $2.45–$2.50. Without that confirmation, upside targets near $2.90 and even $3.30 remain conditional, not promised.

Why A Dip is Likely, Because of Overheating OnChain Signals

And here’s the uncomfortable part. CryptoQuant metrics flag the asset as overheated. Futures retail activity over the past 24 hours has surged, suggesting too many late entrants are piling in at once. Historically, when retail crowds futures positioning, larger players tend to reassess risk.

Volume bubble maps across both futures and spot markets echo that heating pattern. Translation? The move may be extended in the short term.

LayerZero Price (ZRO) Skyrockets 75%: Why Investors Should Watch for a Cool-Off

Now, could the LayerZero crypto rally ignore these warning signs and continue higher? Absolutely. Markets love squeezing doubters. But confirmation matters.

So what’s next in LayerZero price?

If buyers defend $2.00 and build structure, the narrative holds. If price reclaims and closes firmly above the resistance band, momentum traders will chase toward higher targets.

Until then, the LayerZero price sits at a crossroads charged with institutional narrative fuel, but flashing technical exhaustion lights at the same time.

❌