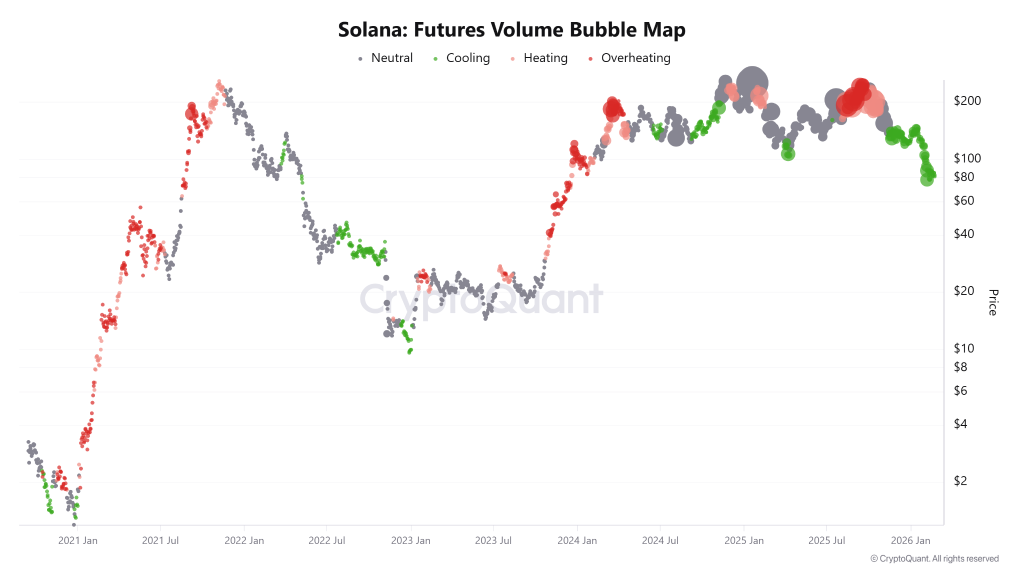
The Solana price isn’t exactly screaming strength right now. Volume bubble maps across both spot and futures markets show a clear cooling trend after what can only be described as overheating phases. And right now? Sell pressure is dominating.
If you zoom out on the Solana price chart, the pattern since 2021 is pretty consistent. After every volume exhaustion phase, there’s a neutral reset. Accumulation begins quietly, marked by mild “heating” traces, before eventually sliding into another overheating cycle. That’s the rhythm.
At the moment, we’re stuck in the green zone meaning bears haven’t stepped aside. The market still looks vulnerable, and price action suggests a potential solid demand area sitting around $48 to $50.
Solana Price Faces Volume Reset
Here’s the uncomfortable truth: stable footing won’t come until volume across both spot and futures resets to neutral. Historically, that neutral zone is where real accumulation builds.
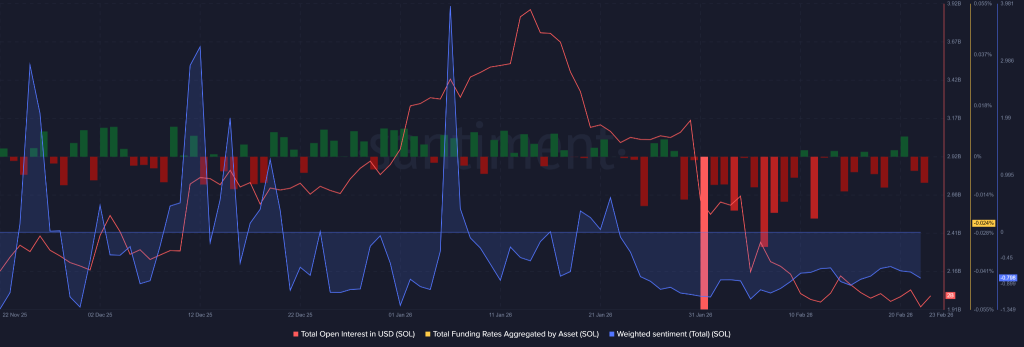
Right now, though, open interest has dropped sharply from $3.88 billion down to $2 billion. That’s not subtle. Leverage has been wiped out. Yet funding rates are recovering from the red zone toward the 0% line.
Translation? Some futures traders are quietly reopening leveraged long positions even while the broader downtrend remains intact.
The SOL/USD structure still leans weak, but derivatives positioning hints that at least a segment of the market believes the worst might be priced in.
Whales Bet Against the Trend
Now here’s where it gets interesting. Despite the bearish tape and heavily negative weighted sentiment at 0.798, certain large players are going the other way. One whale deposited $2 million in USDC and opened a 20× leveraged long position on Solana. That’s not defensive behavior but that seem’s like his conviction for a relief rally.
Whale "0x4A2" deposited $2M $USDC into #HyperLiquid and increased its $SOL (20x) long position and still has an open order to further increase the position.
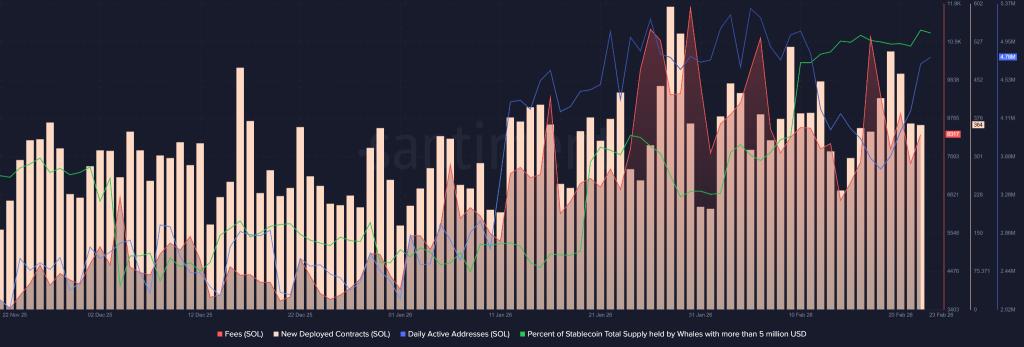
There’s more. The percentage of stablecoin supply held by wallets above $5 million on the Solana network is rising. That suggests whales are accumulating dry powder within the ecosystem rather than exiting it. In on-chain terms, it’s often viewed as a positioning phase ahead of tactical deployments.
Relief Rally Before Deeper Drop?
Long-term sentiment still tilts bearish. A move toward the $48–$50 region carries higher probability than a straight-line recovery. And yet, short-term signals also hint at a mood shift.
Daily active addresses are rising. New contracts are being deployed. Network fees are climbing. Utilization is up. Markets don’t usually fall in straight lines, and if accumulation is quietly forming, a relief rally isn’t off the table.
A bounce from the $75–$80 support area could ignite a move toward $160 before heavier sell pressure returns. That’s not a trend reversal but that could be a potential tactical rally within a broader downtrend.
So what does this mean for Solana price prediction narrative?
Simple. Structurally weak. Tactically interesting. Until volume resets and accumulation confirms on the Solana price chart, the Solana price remains caught between exhaustion and opportunistic whale positioning.
XRP price currently stands at $2.99, with a market capitalization of $179.79 billion. Analysts and AI forecasts alike suggest that XRP could reach $5.05 by the end of 2025. Long-term XRP price predictions also place it as high as $26.50 by 2030, with an ultra-bullish target of $526 by 2050.
Ripple (XRP) remains one of the top five crypto assets in the world, gaining traction as institutional adoption ramps up and its prolonged legal battle approaches resolution. Since President Trump’s return to office, XRP has seen a resurgence in on-chain activity, investor sentiment, and even XRP ETF approved turned it into a bluechip asset.
Now, making this the most ideal time for XRP price prediction 2026-2030 to be in more focus. Read this to know in depth what’s coming next in XRP.
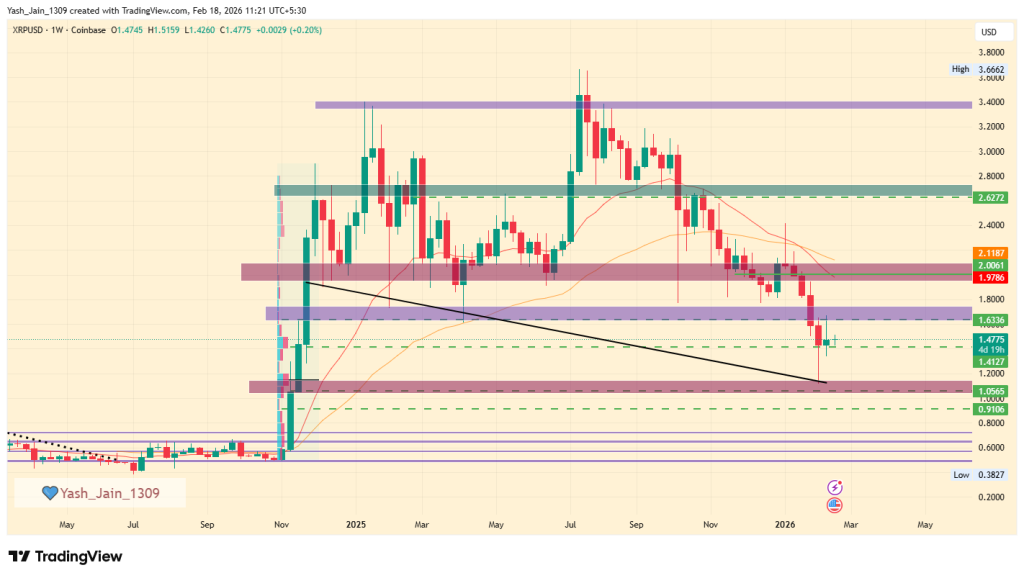
The XRP price has jumped from a recent low of $1.15, which is near a demand zone from late Q4 2024. After testing this demand area, A brief rise past $1.63 was caught. But, not a weekly close $1.63 has happened yet, but if it happens, it could lead to targets of $2.00 or $2.62 by Q1 2026. If it fails to break $1.63, a drop to $1.00 may occur.
XRP Price Prediction For February 2026
In February, the price of XRP experienced a notable increase after bouncing back from a low of $1.15, indicating that more people are getting interested in buying it again.
But, how the price behaves for the few remaining days of February will depend on whether it can rise above $1.51. If it does, we might see it move up to around $1.63. However, if it drops below $1.35, it could fall further to the $1.10 to $1.00 range.
On the positive side, if XRP price did manages to get past $1.63 and continues to gain strength, the next important levels to look for would be $1.75 and $2.00 by March 2026. Conversely, if the price falls below $1.00, that could slow down its upward trend, and March might bring more uncertain price movements.
XRP Price Prediction 2026
The weekly chart for XRP price indicates notable weakness, with the price declining to $1.15, thereby retesting the demand zone established in late Q4 2024. However, in February, there was a rapid rebound from this short-term demand level, which momentarily elevated the price to $1.65 before it subsequently fell back below $1.65 and above the $1.41 region.
Should the price continue its recovery and successfully surpass the $1.63 threshold with a weekly close, the uptrend may persist, potentially reaching targets of $2.00 or even $2.62 by Q1 2026. Conversely, if $1.63 serves as a resistance level and the price experiences a reversal, one can anticipate a decline to $1.00, with Q1 potentially characterized by consolidation around the $1.00 level.
Year
Potential Low
Potential Average
Potential High
2026
$1.75
$3.45
$5.05
XRP Onchain Outlook
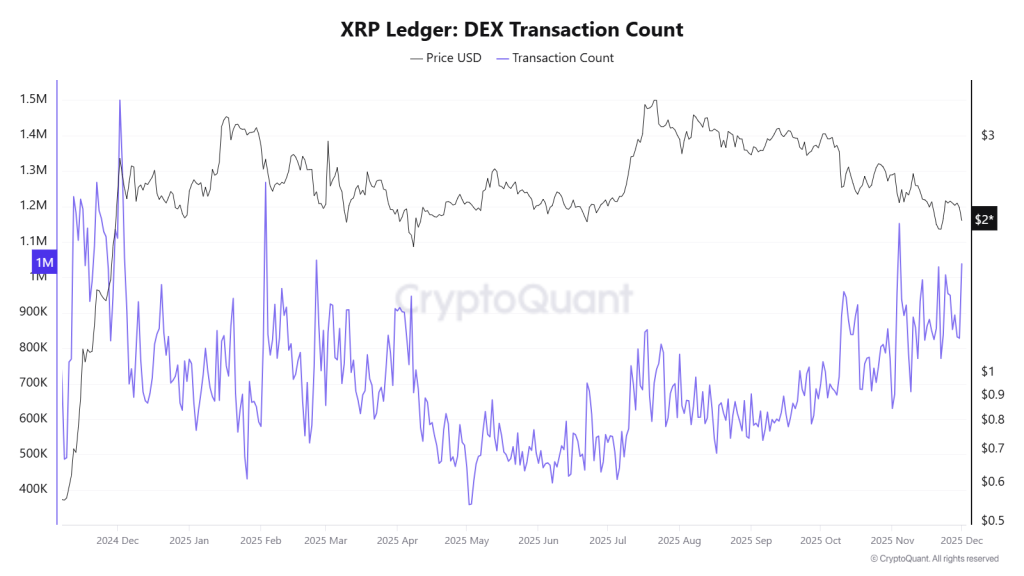
The XRP Ledger: DEX Transaction Count chart indicates a significant bullish divergence starting from May 2025. While the price is consolidating, the activity in decentralised exchanges (DEX) is increasing sharply.
The high transaction volume, which includes both orders placed and cancelled, shows that experienced traders are actively positioning themselves and adding liquidity in anticipation of a future price movement.
As a result, this on-chain metric suggests that the market is preparing for a powerful and sustainable rally in the XRP price ahead.
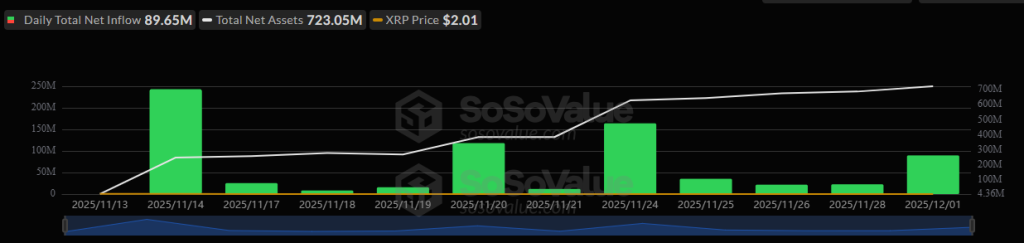
Also, the biggest fact right now in December is that altcoin liquidity is drying up. Projects securing new liquidity channels like ETFs have a better chance of long-term survival, and since November 14th, the XRP ETF has been seeing positive inflows consistently, despite what price action is, and so far, Cumulative Total Net Inflow has crossed $756 million, while total net assets are worth $723.05 million, by December 1st.
Ripple XRP Price Prediction 2026 – 2030
Year
Potential Low ($)
Potential Average ($)
Potential High ($)
XRP Price Prediction 2026
5.50
6.25
8.50
Ripple Price Prediction 2027
7.00
9.0
13.25
XRP Price Prediction 2028
11.25
13.75
16.00
XRP Price Prediction 2029
14.25
16.50
21.50
XRP Price Prediction 2030
17.00
19.75
26.50
This table, based on historical movements, shows XRP price prediction 2030 to reach $26.50 based on compounding market cap each year. This table provides a framework for understanding the potential XRP price movements. Yet, the actual price will depend on a combination of market dynamics, investor behavior, and external factors influencing the cryptocurrency landscape.
Based on historic price sentiments and XRP’s rising popularity, here are the XRP future price projections beyond 2030, where Ripple price forecasts suggest that it has become more speculative. Therefore, assuming continued adoption and dominance, XRP may see aggressive valuations in the decades ahead.
Year
Potential Low ($)
Potential Average ($)
Potential High ($)
2031
25.00
29.50
35.25
2032
31.50
36.75
41.25
2033
35.75
42.25
47.75
2040
97.50
135.50
179.00
2050
219.25
331.50
526.00
A look at this table, highlights the XRP price prediction 2040 and XRP price prediction 2050 potential high ambitious targets but this reflect a transformative vision for XRP as a dominant global payment player.
Market Analysis
Firm Name
2025
2026
2030
Changelly
$2.05
$3.49
$17.76
Coincodex
$2.38
$1.83
$1.66
Binance
$2.16
$2.27
$2.76
Never Miss a Beat in the Crypto World!
Stay ahead with breaking news, expert analysis, and real-time updates on the latest trends in Bitcoin, altcoins, DeFi, NFTs, and more.
FAQs
What is the XRP price prediction for 2026?
Analysts estimate XRP could trade between $1.75 and $5.05 in 2026, depending on ETF inflows, adoption growth, and overall crypto market momentum.
What is the XRP price prediction for 2030?
XRP price predictions for 2030 range from $17 to $26.50 if adoption, ETF growth, and crypto market expansion continue steadily.
How much will 1 XRP be worth in 2040?
By 2040, forecasts suggest XRP could trade between $97 and $179 if global payment adoption and institutional demand expand significantly.
Is XRP a good long-term investment?
XRP may suit long-term investors who believe in cross-border payment adoption and regulatory clarity, but price volatility remains a key risk.
What factors could drive XRP price higher?
ETF inflows, Ripple network expansion, legal clarity, and rising on-chain activity are major factors that could support higher XRP prices.
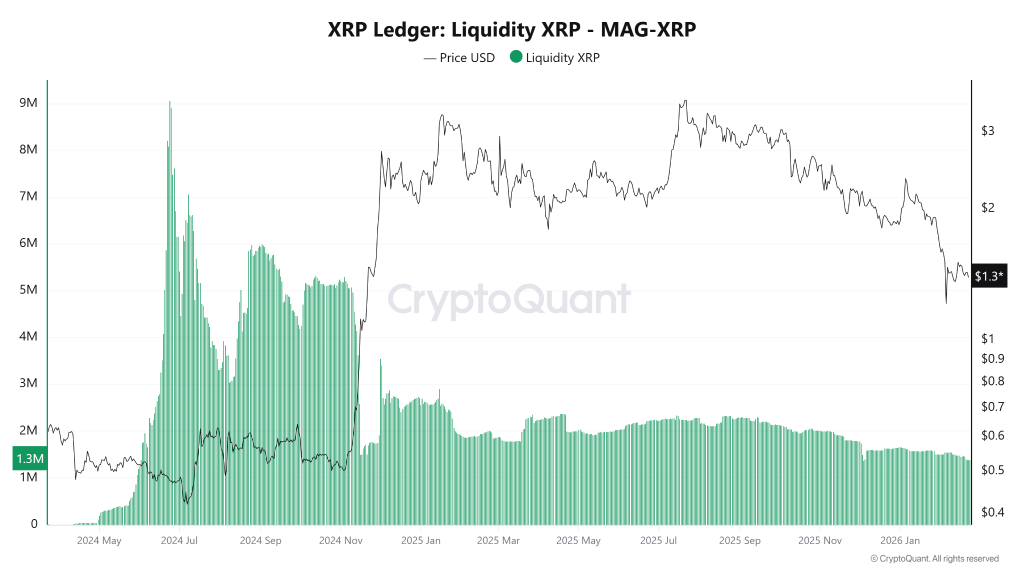
The XRP price had momentum. Liquidity expanded during the rally phase, USD depth grew, and the market had enough capital cushion to sustain upward moves. But now? That cushion is thinning.
Because, USD liquidity the capital depth supporting XRP markets has been declining. During the expansion phase, deeper liquidity allowed price to move higher without dramatic instability. Recently, though, that depth has faded. Thinner markets mean higher sensitivity. Volatility doesn’t need much fuel when the order books aren’t as thick as they used to be.
And that’s just one side of the equation.
Liquidity Compression Returns for XRP Price
On the token side, XRP liquidity had compressed noticeably before the previous breakout. Reduced active supply often precedes strong directional moves and that’s exactly what happened.
Now XRP liquidity is trending lower again, resembling those earlier pre-expansion conditions.
So why isn’t the XRP price ripping higher again?
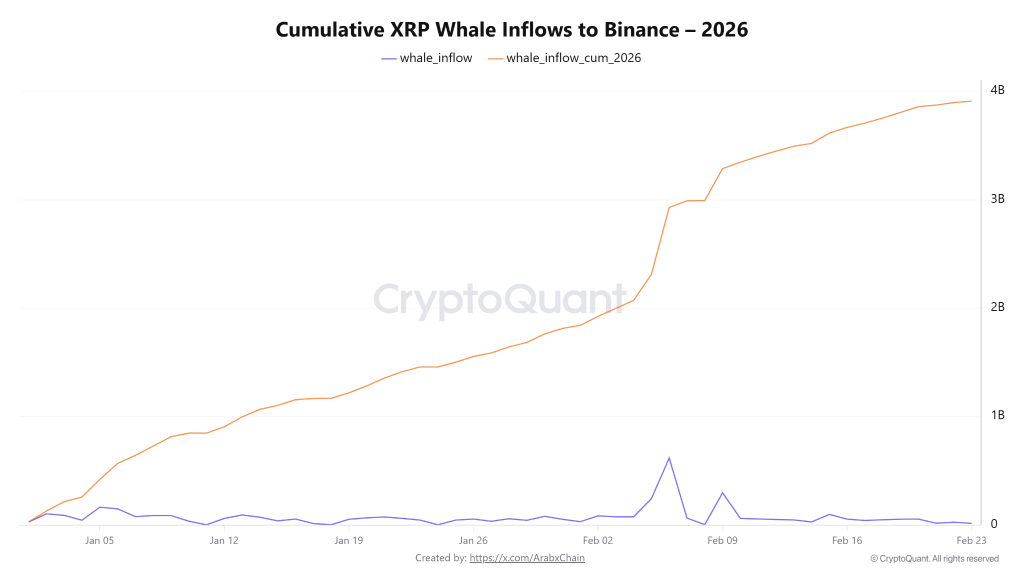
Well, here’s the detail: since, whales are dumping but it appears to be preparing another exit door.
Data from CryptoQuant highlights a steady and systematic rise in cumulative whale inflows into Binance throughout 2026. Since January, the curve hasn’t spiked randomly, it’s climbed consistently. That’s why XRP price has been so sticky around $2 in 2025 and dipped to $1.40 presently.
Binance Whale Inflows Accelerate Fast
The acceleration became clearer in early February, per the latest query run on CryptoQuant’s Arab Chain dashboard. The pace of cumulative whale deposits increased compared to January, suggesting larger players are transferring balances to exchanges more aggressively.
Historically, increased whale flows to exchanges often coincide with short-term corrections or heightened volatility. With cumulative exchange flows rising, the theoretical liquidity available for sale is now higher than before.
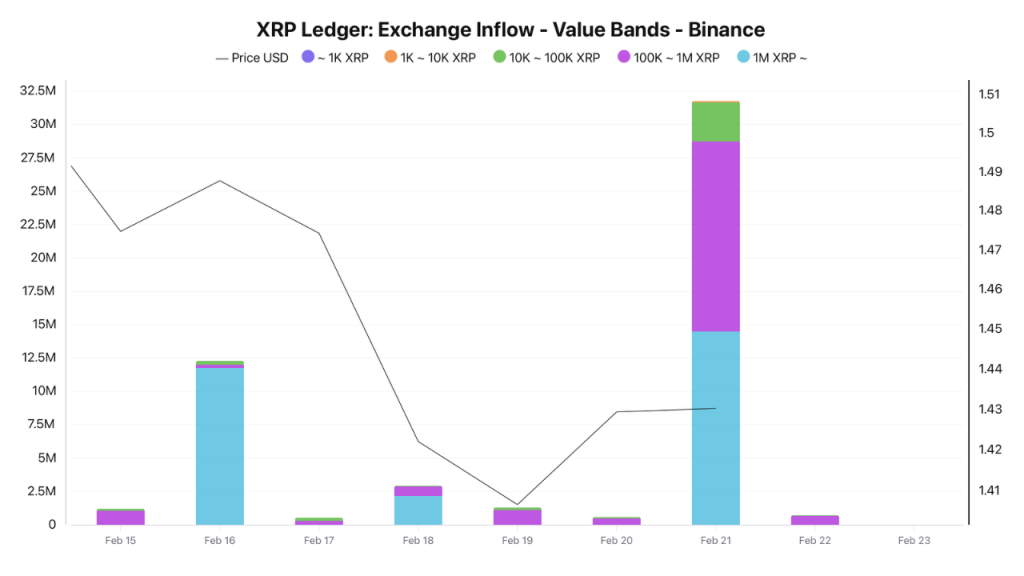
This week alone saw more than 31 million XRP transferred to Binance in a single day.
Altogether, that’s nearly $45 million in potential sell-side pressure. Not catastrophic, but definitely worth watching on any XRP price chart.
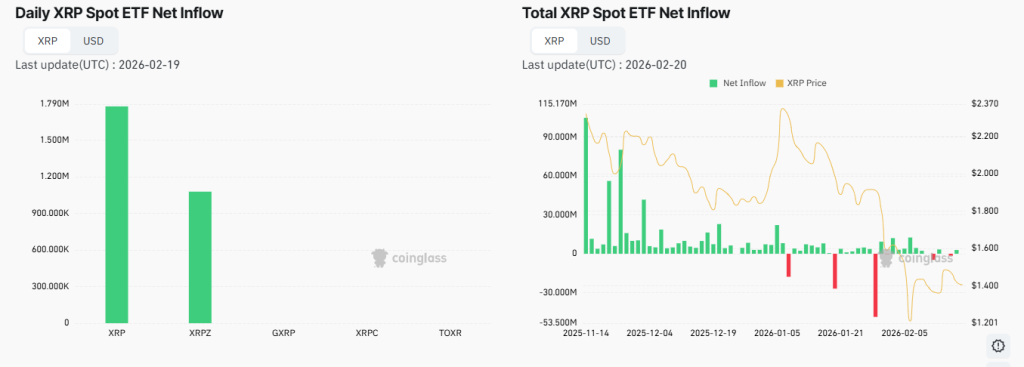
XRP ETF Interest Fades
Meanwhile, inflows and outflows for the XRP ETF have slowed significantly. Reduced net activity signals fading momentum since launch. In plain terms, buyers aren’t stepping in aggressively and sellers aren’t rushing either.
Add in broader market indecision, with bitcoin ranging and offering little directional clarity, and altcoins like XRP are left without a strong macro tailwind.
So, If liquidity keeps thinning and whale deposits persist, recovery could remain capped in the near term. The XRP/USD pair doesn’t just need compressed supply, it needs demand to absorb it. Until that balance shifts, the XRP price analysis suggests it may struggle to regain sustained upward momentum.
Price predictions for 2026 range from $680 to $1160.
By 2030, BCH could reach highs of $3410, driven by increased adoption and transaction activity.
With Bitcoin smashing through the $100K barrier, all eyes are now on Bitcoin Cash (BCH) as traders wonder—will BCH price follow with a banana move of its own? Beyond hype, Bitcoin Cash is proving its value in the real world. Ranked 4th on Crypwerk’s global adoption list, BCH is gaining traction for its speed, low fees, and merchant-friendly design.
If you’re searching for answers to “Will Bitcoin Cash go up further?” — you’re not alone. In this Bitcoin Cash price prediction 2026–2030, we dive into the technicals and adoption trends shaping the next big BCH Price Prediction.
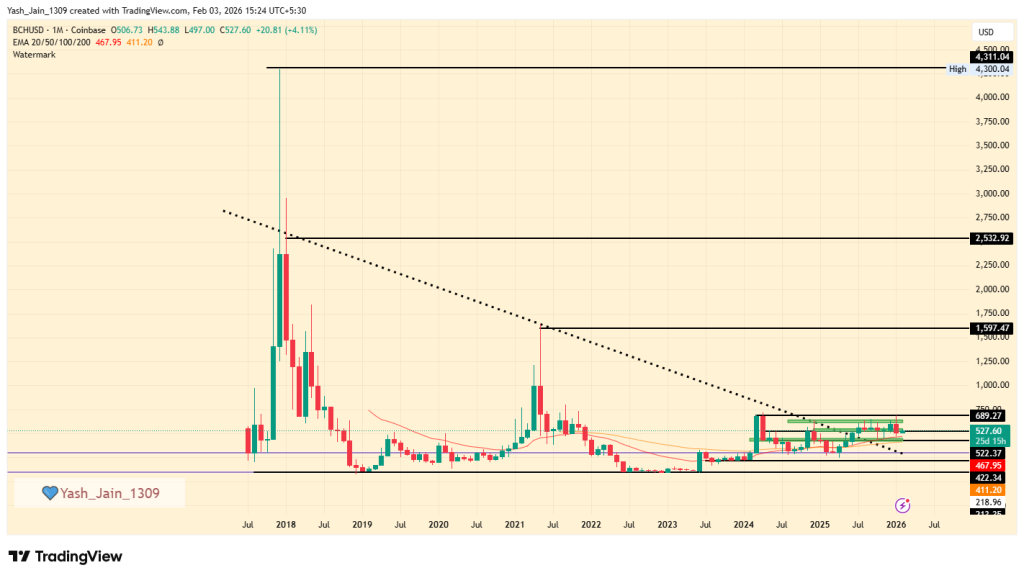
Q1 2026 could initiate a rally based on the success of the multi-year descending triangle pattern. On a 1-M timeframe, BCH/USD is in a consolidation between $425 and $689. But, sustaining above $689 would signal a trend shift. However, dropping below $450 risks a quick decline, with $300 as a critical support level.
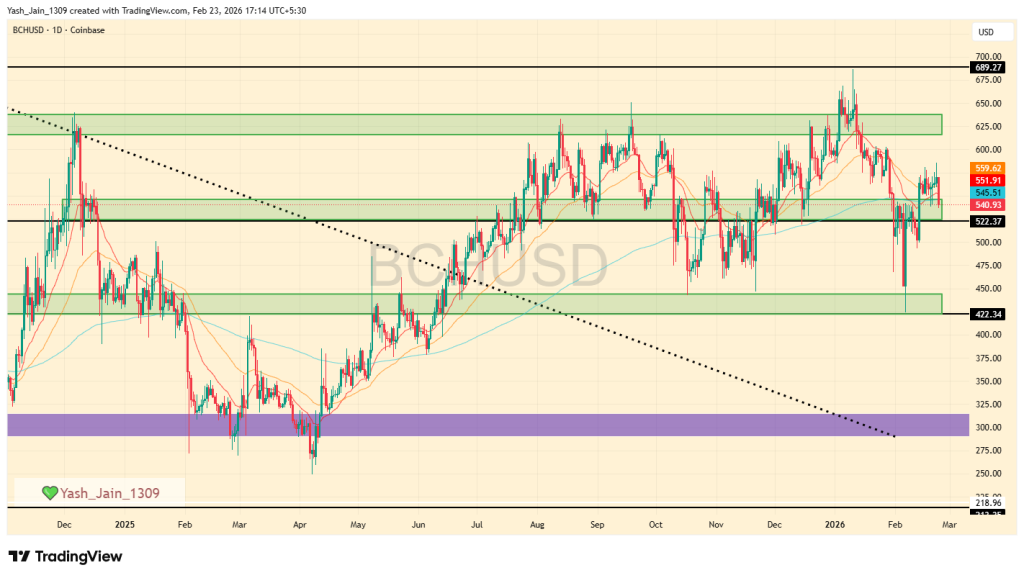
BCH Price Prediction February 2026
In January, the price of Bitcoin Cash (BCH) briefly peaked at $689 before dropping back down. This decline led to a test of a support level around $422 in February.
By the end of February, the price showed some signs of recovery, reaching about $550. This indicates that buyers are attempting to push the price up, but sellers are still quite strong.
As February comes to a close soon, BCH is trading above a critical support level at $522. The price could either rise towards $625 or drop below $522 again. If it falls below $522, it might continue to decline towards $422 in March. Therefore, staying above $522 is important during February, as it will help determine the overall trend for the first quarter of 2026.
BCH Price Prediction 2026 (Q1)
Q1 2026 is set to be the most attractive period for the rally to truly kick off, because H2 2025 onwards it has broken out of a multi-year descending triangle pattern on the monthly chart, and ever since then it has mostly consolidated in a range of $425-$689. The range is quite big on a shorter timeframe, but on a longer timeframe, like monthly, it’s an ordinary consolidation whose movements are not as big as they sound compared to its historical price action.
In Q1 2026, it continues to consolidate in its range and has hit $689 once. And now, if it sustains above it in the coming months, that will signify a “Change of Character (ChoCh)” on the monthly chart, marking a significant long-term trend shift and unlocking potential for higher targets ahead.
Also, under the worst-case scenario, if the BCH price drops below critical support at $450, we could see a swift decline. The $300 level is expected to serve as a strong line of defense against further declines; however, breaking this level would completely delay the current long-term bullish sentiment
Year
Potential Low
Potential Average
Potential High
2026 (conservative)
$300
$605
$1200
Bitcoin Cash Price Targets 2026 – 2030
Year
Potential Low ($)
Potential Average ($)
Potential High ($)
2026
300
689
1,160
2027
680
925
1,160
2028
795
1,135
1,475
2029
1,025
1,480
1,955
2030
1,350
2,010
2,675
This table, based on historical movements, shows BCH price to reach $2675 by 2030 based on compounding market cap each year. This table provides a framework for understanding the potential BCH price movements. Yet, the actual price will depend on a combination of market dynamics, investor behavior, and external factors influencing the cryptocurrency landscape.
BCH Price Prediction 2026
In 2026, Bitcoin Cash price could project a low price of $300, an average price of $689, and a high of $1,160.
Bitcoin Cash Price Prediction 2027
As per the Bitcoin Cash Price Prediction 2027, BCH may see a potential low price of $795. Meanwhile, the average price is predicted to be around $1,135. The potential high for BCH price in 2027 is estimated to reach $1,475.
BCH Price Analysis 2028
Looking ahead to the Bitcoin Cash Price Prediction 2028, BCH is expected to have a low price of $1,025. With an average price of $1,480, the BCH price could make a high of $1,955.
Bitcoin Cash Price Prediction 2029
Finally, by 2029, Bitcoin Cash Price Prediction anticipates a low price of $1,350, an average price of $2,010, and a high of $2,675.
Bitcoin Cash Price Forecast 2030
For the year 2030, Bitcoin Cash Price Prediction forecasts a low price of $1809, an average price of $2705, and a high of $3410.
Never Miss a Beat in the Crypto World!
Stay ahead with breaking news, expert analysis, and real-time updates on the latest trends in Bitcoin, altcoins, DeFi, NFTs, and more.
FAQs
What is BCH price prediction for 2026?
BCH price prediction for 2026 ranges from $680 to $1,160, depending on whether it confirms a long-term bullish trend shift.
How much will Bitcoin Cash be worth in 2030?
Bitcoin Cash could trade between $1,350 and $2,675 by 2030 if adoption rises and market conditions remain favorable.
What is Bitcoin Cash price prediction for 2040?
By 2040, Bitcoin Cash could see significantly higher valuations if global payments adoption expands, though forecasts remain speculative.
Can Bitcoin Cash grow beyond its current use case?
Yes, BCH could grow through wider merchant adoption, faster payments, and improved on-chain utility in real-world transactions.
Is Bitcoin Cash a good long-term investment?
BCH has long-term potential due to low fees, fast transactions, and growing merchant adoption, but price depends on broader crypto market trends.
Can Bitcoin Cash reach its all-time high again?
Revisiting previous highs is possible if BCH sees sustained adoption and a confirmed long-term trend reversal, though it’s not guaranteed.
The Injective price isn’t moving quietly anymore. It just ripped 20% intraday, and no, this isn’t one of those random pumps out of nowhere. There’s capital behind it. Real capital.
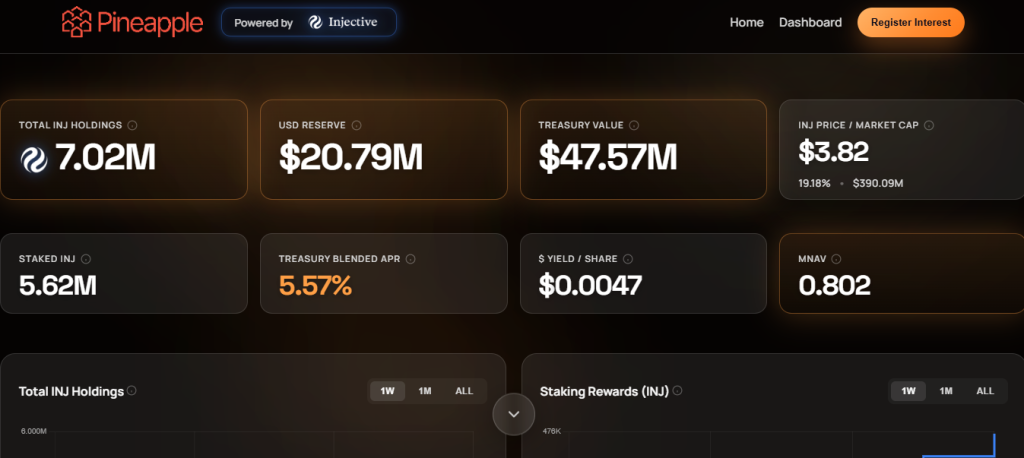
Pineapple Financial (NYSE: PAPL) has accelerated its INJ buying spree, announcing another $2 million acquisition on February 19, 2026, under its ongoing market cash purchase program. That pushes its treasury play deeper into the Injective ecosystem and signals this isn’t a one-off headline grab.
The firm now holds 7.02 million INJ tokens, according to its DAT dashboard. Conviction? They say it hasn’t changed.
Let’s not sugarcoat it but public equity treasury strategies buying crypto isn’t exactly new. But Pineapple positioning itself around Injective specifically? That’s deliberate.
This isn’t just passive exposure. It’s active open-market buying. The company is building around INJ crypto as a strategic asset, and its reserves suggest it’s not done yet.
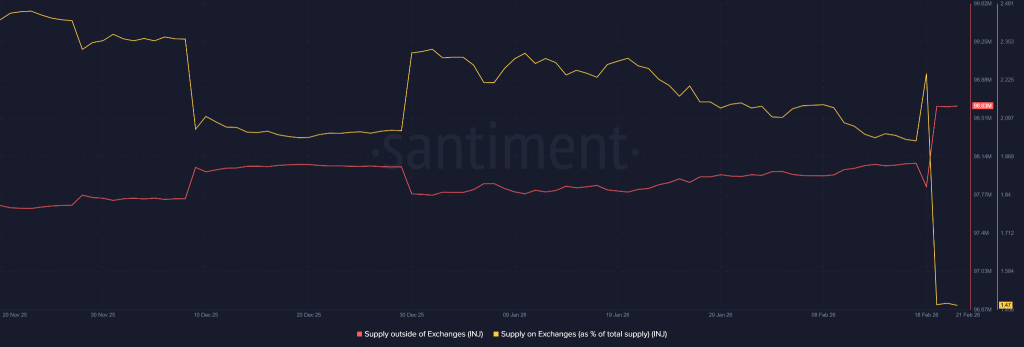
Meanwhile, supply dynamics are tightening. Onchain data highlights that the exchange balances have dropped. Supply outside exchanges climbed to 98.63 million INJ from this week’s low of 97.90 million. That’s accumulation behavior. Whether you’re watching the Injective price chart or on-chain dashboards, the direction is clear: coins are leaving exchanges.
Injective Price Reacts to Buybacks and Burn
Now here’s the main delight. This week saw INJ community BuyBack that completely, burning approximately 54,999 INJ permanently. Deflationary mechanics plus treasury accumulation? That’s not a bad combination if you’re building a bullish narrative.
Adding to that a newly approved proposal, IIP-620, introducing a technical blockchain upgrade. Dynamic gas fees will now be capped within a logically aligned range relative to minimum gas price,which in simple terms, fewer wild fee spikes during congestion.
A new proposal with a technical blockchain upgrade has just been approved in the Injective ecosystem. Now the dynamic gas fee will not be able to increase beyond a logically allowed level aligned with the minimum gas price.
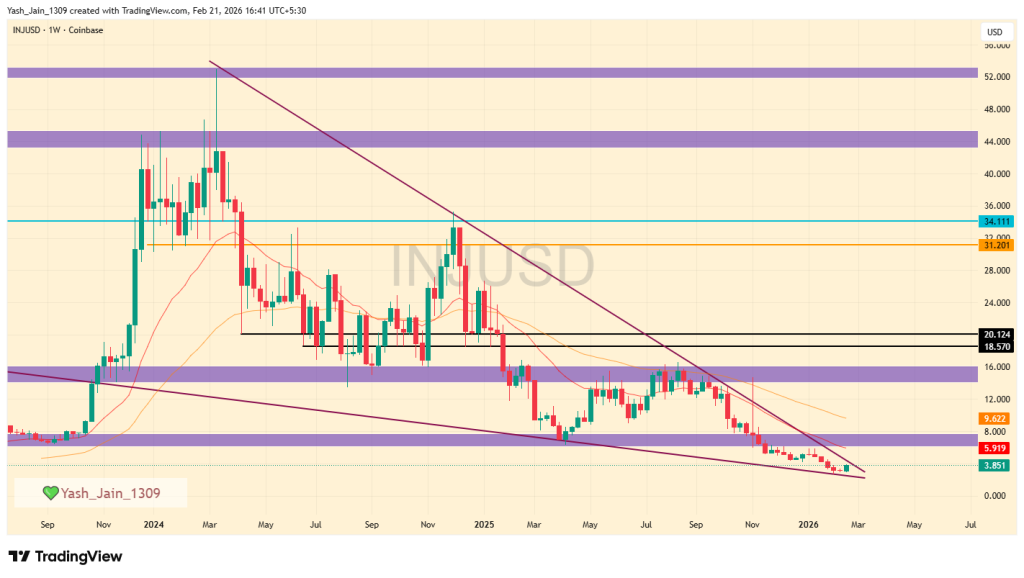
More predictability. Less chaos. Markets noticed. When writing, the INJ/USD pair is currently trading at $3.86, giving the network a $386 million market cap. And yes, that 20% intraday surge followed weeks of steady bullish developments.
Falling Wedge Signals Injective Price Breakout?
Technically speaking, there’s a 24-month compressed falling wedge pattern reacting bullishly this week. If the upper boundary breaks, short-term targets point toward $8.00. That’s the immediate level being watched for Q1 2026.
Stretch that scenario further and some are eyeing $20 longer term, though let’s be real, that won’t happen overnight.
On-chain metrics? Mixed, but improving.
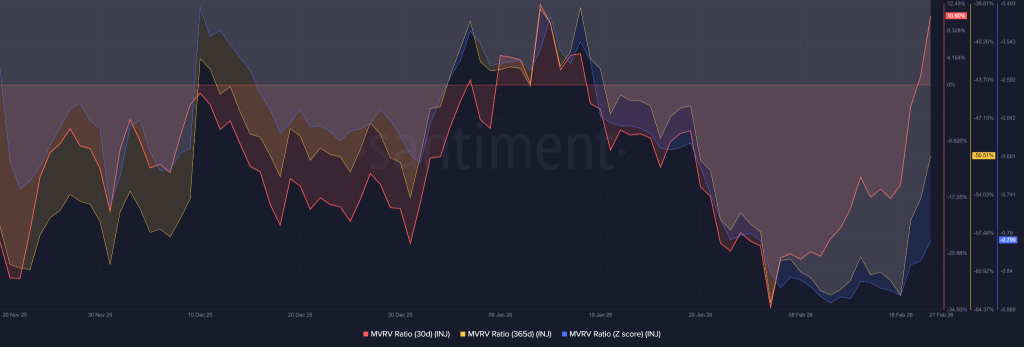
30-day traders are back in profit based on MVRV 30-D. Longer-term 365-day holders are still underwater. The MVRV Z-score sits negative at 0.799, but it’s curving upward. Recovery mode, not euphoria.
Somewhere between disciplined accumulation and a potential technical breakout. If the wedge gives way and treasury buying continues, the $8 test could come sooner than skeptics expect. For now, the Injective price is doing what bulls have been waiting months to see, it’s finally reacting and follow through depends on further accumulation demand.
The live price of the Cardano token is $ 0.27267855.
Price prediction suggests potential to reach $2.75 to $3.25 by year-end 2026.
Long-term forecasts indicate ADA could hit $10.25 by 2030.
The Cardano price prediction 2026 is generating significant buzz in the crypto market, as the last quarter is soon to close in few days, boosting interest for the next altcoin. The 2025 for ADA/USD began with numerous fundamental updates strengthening its future, including the transformative Plomin Hard Fork, but 2026 seems even more constructive.
Now, Questions abound: “Will Cardano spearhead the altcoin movement?” and “What heights can ADA reach by 2050?” Explore this Cardano price prediction 2026 and beyond, filled with expert insights and ambitious forecasts.
Coinpedia’s Cardano Price Prediction
The Cardano price outlook for 2026 is promising, driven by its extraordinary 4,000% surge in 2020 and currently holding strong at a significant support level. With a positive shift in market sentiment, even a moderate increase could lead to a remarkable 1,000% rise, positioning Cardano around $4.50.
A more conservative target of $1.40 indicates a solid 300% gain based on existing trends. Analysts are broadly optimistic that upcoming ETF approvals will boost institutional adoption and market stability, with price projections ranging from $2.05 to $2.80.
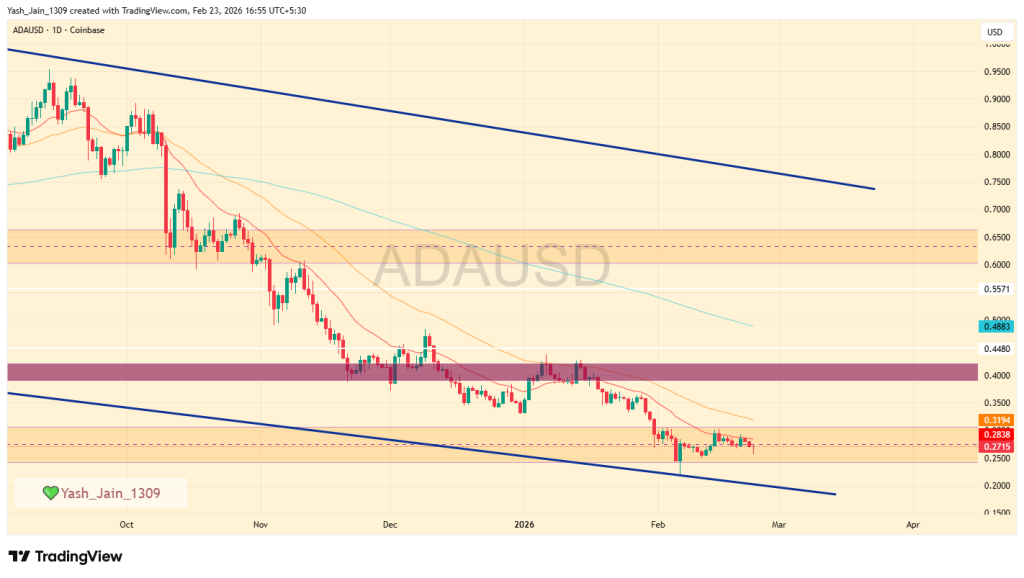
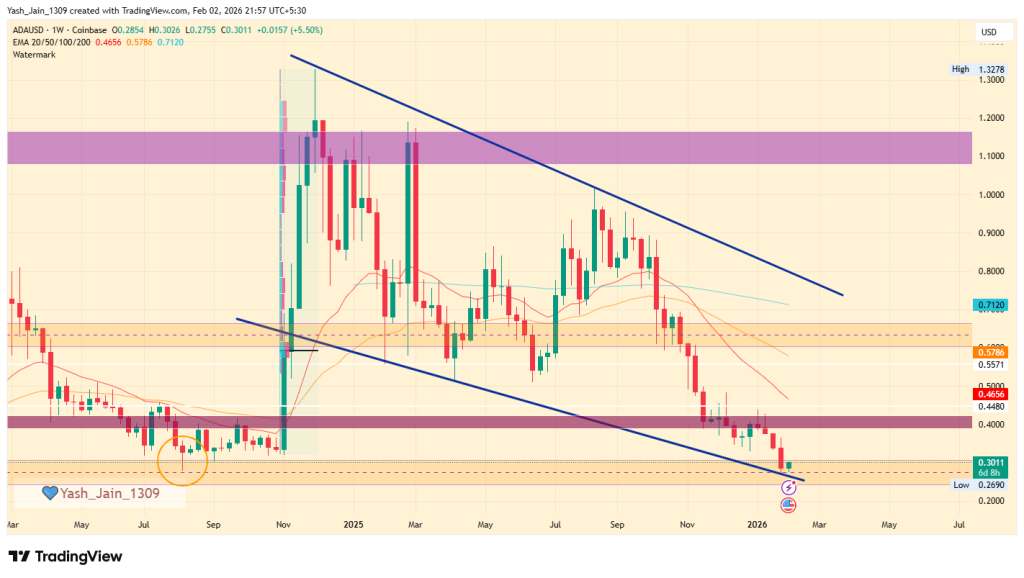
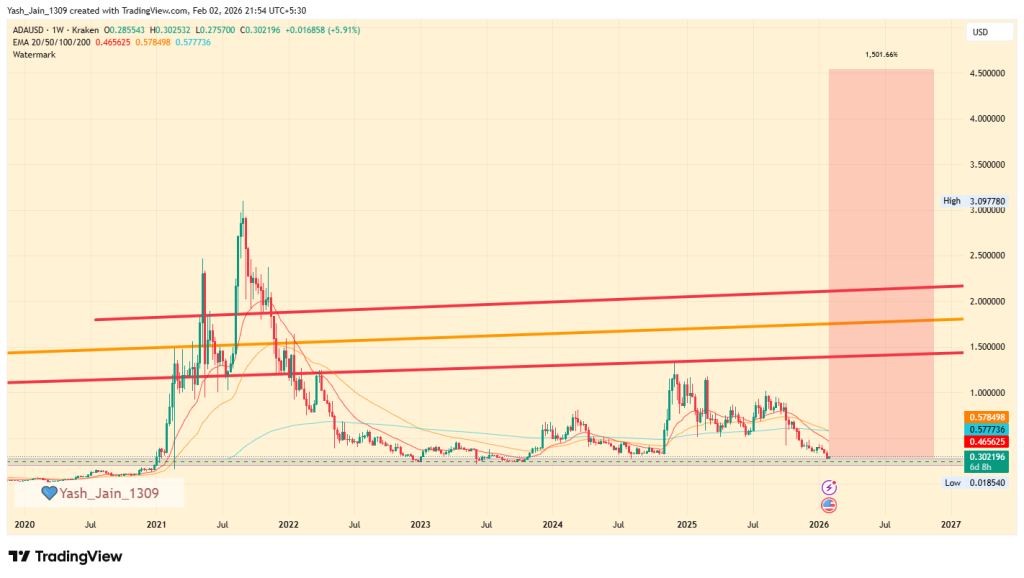
At present, the price of ADA is navigating a notable sell-off. But, early February has revealed a promising demand zone, indicating a resurgence of buying interest in the short term. Should the broader market improve, we may witness an increase in demand, setting the stage for a potential bullish rally.
Additionally, the lower boundary of the falling wedge is providing strong support, suggesting that a price surge could happen at any time, but short-term support at $0.2510 holds strong value.
Accordingly, if demand increases then we anticipate that ADA might reach an impressive value of $0.40 within this month. Conversely, if the overall market experiences a downturn again, including even declines in major assets like BTC again, then this could negatively affect ADA/USD, possibly driving it down to $0.20 or lower.
ADA Price Prediction 2026
The Cardano price forecast for 2026 points to an important support level on its weekly chart, a range that has consistently acted as a strong pivot point for price trends, and is currently giving off signals of another potential rally. This support level is known for displaying remarkable resilience over time, suggesting that if Cardano price USD can maintain its position above this threshold once again, it could pave the way for significant price movements in 2026.
Looking back at Cardano’s historical performance on the weekly chart, it shows an extraordinary rally in 2020, when the asset posted staggering gains of nearly 4,000%. During that bullish phase, the Cardano price USD spent an extended period consolidating around the dynamic support trendline, which appears to be a strategic accumulation at discounts from smart money, contributing significantly to its eventual surge.
If the current market sentiment shifts positively, a resurgence in investor confidence could lead to a recovery. Not ambitiously, even modestly, past performance could give a tremendous surge. Last year’s performance was 4000%. If we assume 1/4 of that momentum, it would result in an increase of approximately 1000%, potentially elevating Cardano’s price to $4.50 by 2026.
Conversely, a more conservative approach suggests a realistic price target of around $1.40, indicating a potential increase of about 300%. This estimate remains feasible, especially since it is based on fundamental analyses and market trends that are not reliant on speculative triggers, such as the possible approval of exchange-traded funds (ETFs).
Additionally, many experts propose that these ETFs could significantly impact the market by boosting institutional investment and improving market stability. In a situation where ETF approvals occur and retail investor excitement rises, Cardano’s price could realistically range from $2.05 to $2.80.
Scenario
Potential Low
Average Price
Potential High
Without ETF Approval
$0.85
$1.10
$1.25
With ETF Approval + Retail Surge
$1.20
$1.65
$2.05
Bullish Breakout (with ETF & macro support)
$1.50
$2.05
$2.80
Cardano On-chain Analysis
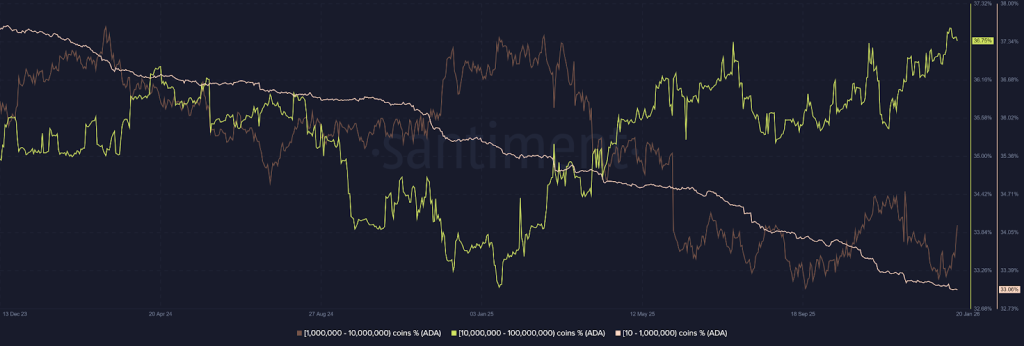
As per Cardano’s on-chain metrics, “Smart Money” accumulation phase is the best observation right now, because the divergence between retail and institutional holders is more vivid than ever.
As the number of addresses holding between 10 and 1 million ADA is declining, and the consistent surge in the 10 million to 100 million coin bracket confirms this, this represents a major supply consolidation. The observation shows that these mega-whales are strategically absorbing the “weak hands” during price dips, effectively building a rock-solid fundamental floor for the asset. Also, the fact that the 1M to 10M coin bracket is also growing confirms that professional high-net-worth investors seem to be positioning for a recovery, too.
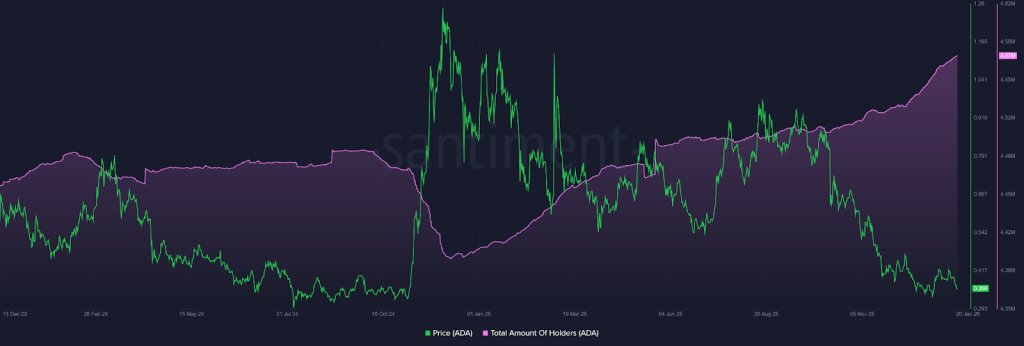
Similarly, the surge to 4.57 million total holders despite a grueling 2025 proves that Cardano’s ecosystem is expanding its reach even in a “stress test” environment. This growth in the holder base suggests that the asset is not being abandoned; rather, it is being redistributed into a more stable, long-term foundation. When a holder count rises as prices fall, it signals that the market views current levels as a deep-value opportunity rather than a reason to exit.
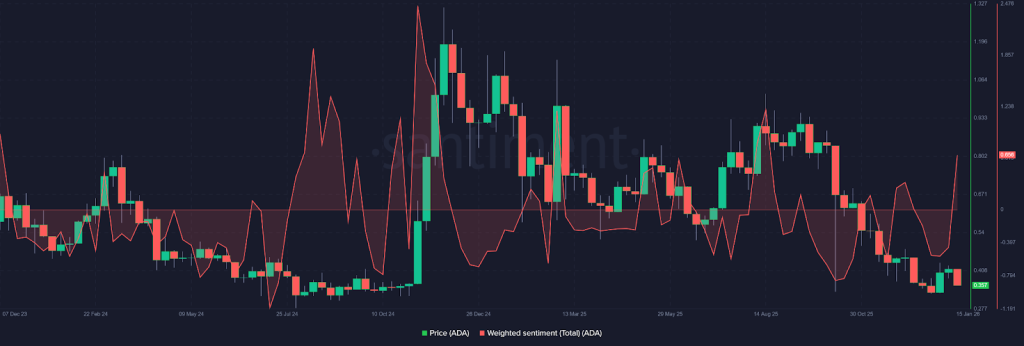
Additionally, the Weighted Sentiment flipping the 0 line to 0.656 is a crucial momentum trigger. Professionally, this “0-line flip” indicates that the aggregate social and market bias has shifted from fear to optimism.
Combined with the strategic whale accumulation, this sentiment pivot suggests that the “disbelief” phase is ending and that a bullish rally is likely once the remaining retail sell pressure is fully absorbed by the growing whale cohorts.
Cardano (ADA) Price Prediction 2026 – 2030
Price Prediction
Potential Low ($)
Average Price ($)
Potential High ($)
2026
2.75
3.00
3.25
2027
4.50
4.75
5.00
2028
5.25
5.50
5.75
2029
6.75
7.25
7.75
2030
9.00
9.75
10.25
This table, based on historical movements, shows ADA prices to reach $10.25 by 2030 based on compounding market cap each year. This table provides a framework for understanding the potential Cardano price movements. Yet, the actual price will depend on a combination of market dynamics, investor behavior, and external factors influencing the cryptocurrency landscape.