Reading view

Decred Price Analysis: Rising Channel Structure Signals Potential 60% Rally Ahead 

Decred Price Analysis Rising Channel Structure Signals Potential 60% Rally Ahead

The post Decred Price Analysis: Rising Channel Structure Signals Potential 60% Rally Ahead  appeared first on Coinpedia Fintech News

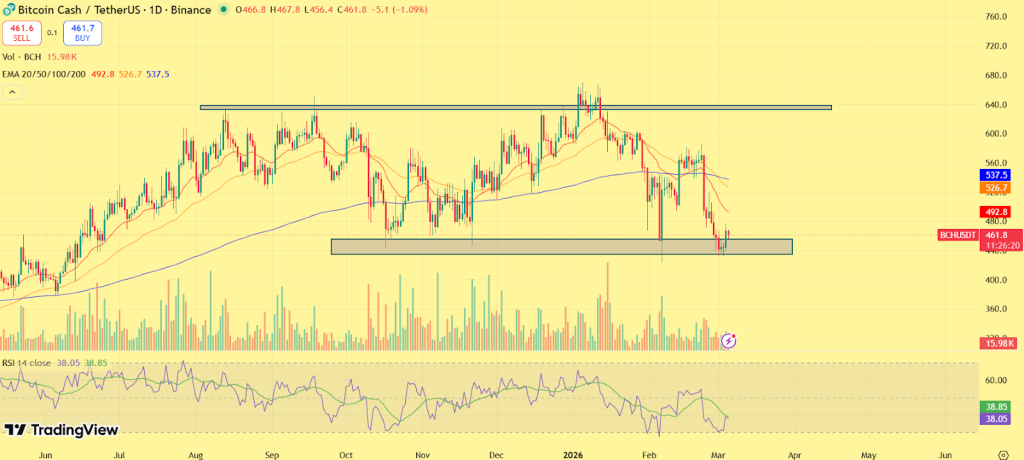
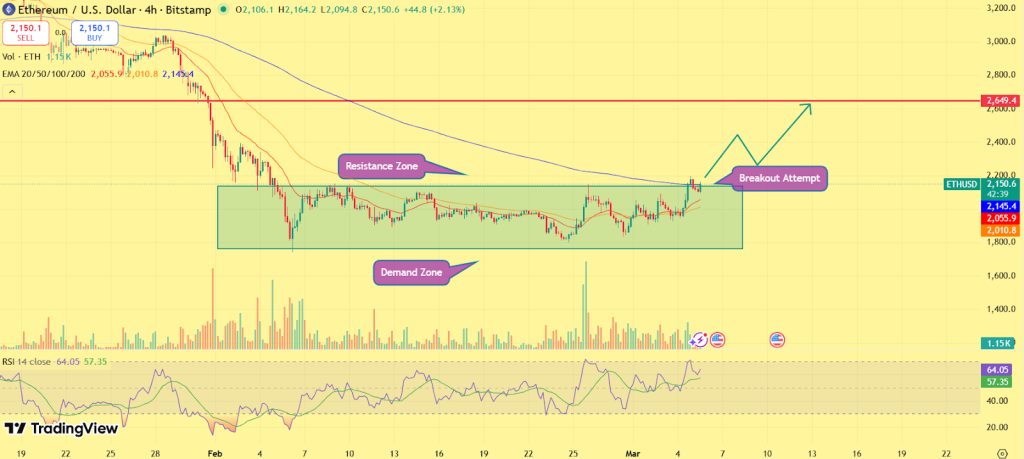
As the broader crypto market navigates another phase of volatility, several altcoins are beginning to display early signs of structural shifts on their charts. While major assets like Bitcoin and Ethereum continue consolidating, Decred price has quietly started attracting attention among technical traders. Recent price movements suggest that something more significant may be developing beneath the surface. After spending weeks in a compressed range, the token has begun to test key breakout levels, hinting that market sentiment around the token may be gradually changing. 

This subtle shift in structure is now raising an important question for traders watching the chart closely: Could Decred price be preparing for a much larger move ahead? To understand where the token might be heading next, the Decred price analysis offers some important clues.

Breakout Above Consolidation Signals Structural Shift

Decred token price recently managed to break above a critical horizontal resistance level near $25, which had capped the price during the previous consolidation period. This breakout marked an important turning point in the chart structure. Before this move, the token spent an extended period trading inside a compressed range where buying and selling pressure remained balanced. However, once the price pushed above this resistance zone, the structure began to shift toward a more constructive bullish formation.

Decred price analysis

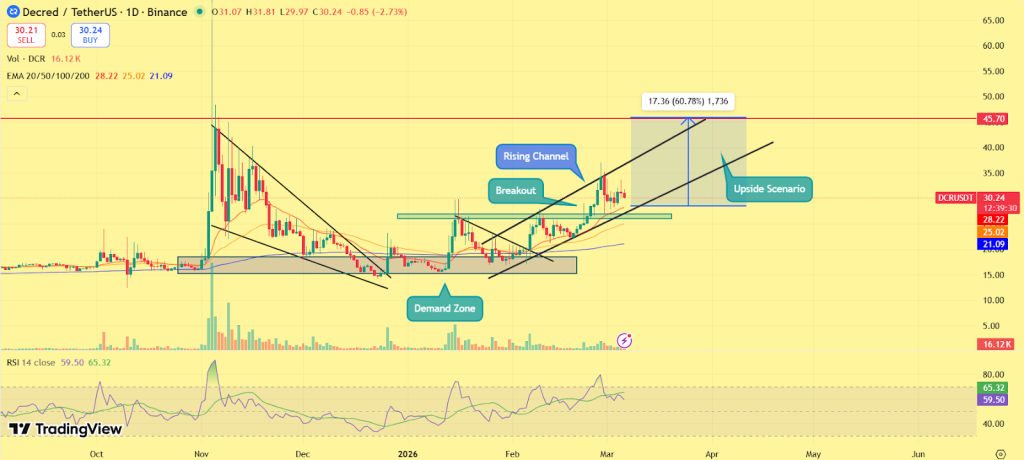
Following the breakout, Decred price has started forming a clear rising channel pattern, a structure that typically reflects steady bullish momentum.

Within this formation, the price moves gradually higher while respecting two upward-sloping boundaries. The lower boundary acts as dynamic support, where buyers step in during pullbacks, while the upper boundary serves as the next resistance zone. 

So far, Decred has continued to respect the lower trendline of the channel, suggesting that buyers are defending dips and maintaining control of the trend. This behavior indicates that the market is building a stable upward trajectory rather than experiencing a sharp speculative spike. As long as the price continues trading within this channel structure, the overall outlook remains bullish.

Decred Price Analysis: Can Bulls Push Toward $45?

Based on the current chart setup, Decred appears to have room for further upside if the rising channel structure continues to hold. The next major resistance sits near the $45 region, which aligns with the upper boundary of the broader price projection. Reaching this level would represent roughly a 60% upside from current levels, making it a key target for bullish traders.

However, the token will likely experience short-term pullbacks along the way, which are common within ascending channel formations. These retracements often help sustain momentum by allowing the market to build new support levels. If Decred continues respecting the breakout zone and maintains the rising channel structure, the broader technical outlook suggests that DCR token could gradually move toward higher resistance zones in the coming weeks.

Final Outlook

Decred’s recent breakout from consolidation and the formation of a rising channel indicate that the asset may be entering a new bullish phase. While the move remains in its early stages, the current price structure suggests that buyers are beginning to regain control. If the key support zones hold and momentum continues building, Decred price could be positioning itself for a potential move toward the $45 resistance region.

FAQs

Why is Decred price gaining attention among crypto traders?

Decred recently broke above the $25 resistance level and formed a rising channel, signaling a potential bullish trend and renewed buying interest.

Can Decred price reach $45 in the near future?

If the bullish channel holds and buying momentum continues, the next major resistance target for Decred could be around $45.

Is Decred entering a new bullish phase?

The breakout from consolidation and sustained higher lows suggest growing bullish momentum, though short-term pullbacks may occur during the trend.

Why is OKB Price Rising Today? $25B ICE Investment in OKX Sparks Massive Rally

OKB Price Prediction: Why the Exchange Token is Rallying to New Highs

The post Why is OKB Price Rising Today? $25B ICE Investment in OKX Sparks Massive Rally appeared first on Coinpedia Fintech News

OKB price has suddenly come to the spotlight after staging one of the strongest rallies in the crypto market this week. The token surged nearly 30% in a single day, pushing toward the $100 mark as traders rushed to price in a major institutional development surrounding the OKX ecosystem.

The rally follows reports that Intercontinental Exchange (ICE), the parent company of the New York Stock Exchange (NYSE), has invested in OKX at a valuation of roughly $25 billion. The news immediately sparked bullish sentiment, with market participants viewing the move as a significant step toward deeper institutional integration between traditional finance and crypto exchanges. While the broader crypto market has been relatively mixed, OKB’s sharp move suggests that investors are reacting strongly to the potential long-term implications of the deal.

Institutional Interest Returns to the OKX Ecosystem

The reported investment from ICE is being interpreted as a major confidence signal for the exchange. ICE is one of the most influential financial infrastructure companies globally and operates several major financial markets, including the New York Stock Exchange. Its involvement with OKX is therefore seen by analysts as a strategic move that could help expand institutional participation within the platform.

Market discussions suggest the collaboration could eventually lead to expanded institutional trading services and potential integration of tokenized financial assets, including equities and derivatives linked to traditional markets.

🚨 JUST IN: NYSE parent ICE invests in crypto exchange OKX at a $25B valuation to explore tokenized stock trading. pic.twitter.com/IqYrEhRHZq

— Xmarket | Prediction Markets (@Xmarketapp) March 6, 2026

If such initiatives materialize, OKX could position itself more firmly as a bridge between traditional finance (TradFi) and the crypto industry, a narrative that has been gaining momentum across the sector. For traders, however, the bigger question is whether the institutional news will translate into a sustained trend reversal for OKB price.

OKB Price Analysis: Breakout Momentum Builds Near Major Hurdle

OKB token price appears to be attempting a structural breakout after several months of downward pressure and consolidation. The daily chart shows that the token spent a prolonged period moving within a descending structure after peaking in late 2025. During this period, sellers repeatedly defended a major supply zone between $120 and $130, preventing any meaningful recovery.

OKB price

However, the recent surge has dramatically shifted the market structure. After forming a base around the $70–$80 demand zone, OKB began to stabilize and gradually build momentum. The latest rally pushed the token above the $95–$100 level, effectively breaking out of its recent consolidation range and signaling renewed bullish strength. This breakout now places the token directly beneath the major supply zone near $120–$130, which represents the next critical technical barrier.

If bulls manage to push the price decisively above this resistance area, the chart structure suggests that the next upside target could emerge around the $140 region, where the next historical resistance level sits. If OKB fails to clear the $120–$130 supply zone, the token could enter a short-term consolidation phase, with $95–$100 likely acting as the first support region where buyers may attempt to defend the breakout.

Pi Network Price Rallies After Major Upgrade Update: Can PI Coin Reclaim $0.35?

Pi Network Update for 2026

The post Pi Network Price Rallies After Major Upgrade Update: Can PI Coin Reclaim $0.35? appeared first on Coinpedia Fintech News

Pi Network price is showing fresh signs of strength after weeks of consolidation, rising more than 10% in the past 24 hours and reclaiming the $0.19–$0.20 zone. The rebound comes as the broader crypto market attempts to stabilize, but a key catalyst appears to be emerging from within the Pi ecosystem itself. Recent updates from the development team confirm progress on network migration and upcoming protocol upgrades, which has reignited bullish sentiment around the project.

With momentum building and development activity accelerating, traders are now asking an important question: Can Pi Network price sustain its recovery and reclaim the $0.35 level next?

Pi Network Price Analysis: Is a Major Rally Next?

Pi Network price appears to be entering an important transition phase after spending several months under sustained bearish pressure. The daily chart shows that PI coin recently broke out of a descending trendline structure that had been guiding the market lower since late 2025. This breakout is often considered an early signal that selling momentum is fading and that buyers are gradually reclaiming control of the trend.

Following this move, the token rebounded toward the $0.19–$0.20 region, confirming that demand has begun to return after the extended downtrend. However, the market is now approaching a critical resistance band between $0.25 and $0.27, a zone that previously acted as a strong supply area where sellers repeatedly stepped in. This resistance region will likely determine the next directional move for Pi Network price.

PI network price

If bulls manage to push the asset decisively above the $0.27 level, it would mark a significant structural shift on the chart. Such a breakout would invalidate the previous lower-high pattern and could open the door for a broader recovery rally toward the $0.35 level, where a major supply zone is visible on higher timeframes.The Relative Strength Index (RSI) has moved higher from oversold territory, suggesting that buying pressure is steadily building as traders position for a potential breakout.

If Pi Network price fails to break through the resistance band, the coin could enter another consolidation phase, with the $0.17–$0.18 demand zone likely acting as the primary support area.

Network Upgrade Adds Tailwind

Alongside the improving chart structure, recent updates from the Pi Network ecosystem may also be supporting sentiment. 

💥BREAKING:

Pi Network officially announced that the v20.2 protocol version is being upgraded, with a deadline of March 12th at the latest. It also stated that all Pi mainnet nodes must complete the steps within this timeframe to connect to the network. pic.twitter.com/ZVpFXBZ4Xx

— Pi News (@PiNewsMedia) March 5, 2026

The project recently confirmed progress on its v19.9 migration milestone, while the next protocol upgrade v20.2 is expected in the coming days according to development updates. Although the rally appears primarily technical in nature, continued ecosystem development may be helping maintain positive market sentiment around the asset.

Can PI Price Rally Toward $0.35?

Pi Network price is now approaching a make-or-break technical level. If bulls manage to push the token above the $0.27 resistance band, the breakout could trigger a broader recovery move toward $0.35 in the near term.

However, failure to clear this zone could lead to another period of consolidation, with traders watching the $0.17 support area as the key downside level. For now, the combination of improving technical momentum and growing market attention suggests that Pi Network price could be preparing for its next major move.

FAQs

Why is Pi Network price rising now?

PI is rebounding due to fading bearish pressure, a trendline breakout, and Pi’s v19.9 migration progress boosting buyer momentum.

What is the next resistance for Pi price?

The $0.25–$0.27 band is critical; breaking it above $0.27 signals a bullish shift, while failure eyes consolidation near $0.17 support.

Is Pi Network a good buy right now?

PI shows strength with improving charts and ecosystem tailwinds, but watch $0.27 for breakout confirmation before entering—support at $0.17.

Bitcoin Cash Price Prediction 2026, 2027 – 2030: Will BCH Hit $1000?

Bitcoin Cash Price Prediction

The post Bitcoin Cash Price Prediction 2026, 2027 – 2030: Will BCH Hit $1000? appeared first on Coinpedia Fintech News

Story Highlights

  • The live price of Bitcoin Cash is  $ 458.92294048
  • Bitcoin Cash price trades near $466, holding a critical demand zone around $440-$470.
  • If the market regains strength, BCH could expand toward the $1200 region by the end of 2026.
  • In a stronger long-term cycle, Bitcoin Cash may price closer to $3,000 by 2030.

Bitcoin Cash is currently trading around $466, positioning itself near an important support area that has held multiple times during the past year.

After experiencing a period of volatility, BCH has entered a broad consolidation phase, where buyers continue defending the $440–$470 demand zone. Each time BCH price approaches this range, selling pressure slows and market activity increases, suggesting that traders view this region as a fair value area.

From a broader perspective, Bitcoin Cash remains one of the most recognized Bitcoin forks. The network was originally designed to improve transaction speed and reduce fees, positioning itself as a practical alternative for everyday payments. While market attention often shifts toward newer blockchain projects, BCH continues to maintain relevance within the cryptocurrency ecosystem.

For investors and traders, the current phase appears to be less about survival and more about whether this consolidation can lead to the next expansion cycle.

Bitcoin Cash Price Today

Cryptocurrency Bitcoin Cash
Token BCH
Price $458.9229 down 0.00%
Market Cap$ 9,180,033,489.02
24h Volume$ 313,808,933.6508
Circulating Supply20,003,431.25
Total Supply20,003,431.25
All-Time High$ 4,355.6201 on 20 December 2017
All-Time Low$ 75.0753 on 15 December 2018

Coinpedia’s BCH Price Prediction 2026

Coinpedia’s price prediction highlights that Bitcoin Cash price is currently consolidating near a strong support region, which could serve as a foundation for future growth. If BCH successfully breaks above the $650–$700 resistance zone, the market could gradually move toward $1,200 by 2026.

Looking further ahead, sustained cryptocurrency adoption and renewed market momentum could support a long-term move toward $3,000 by 2030.

YearPotential Low ($)Potential Average ($)Potential High ($)
2026600.00850.001200.00

Bitcoin Cash (BCH) Price March 2026 Outlook

With March already underway, Bitcoin Cash continues to trade inside its established range. The $440–$470 region remains the most important level to watch in the short term. As long as BCH holds above this zone, the market structure remains stable.

However, buyers must eventually reclaim higher levels to confirm a stronger recovery. The first signal of momentum would be a move above $520, followed by a break toward the $650–$680 resistance band. If BCH gradually pushes through these barriers, the market could begin positioning for a broader recovery later in the year. For now, the focus remains on whether the asset can continue defending its current support while testing overhead resistance.

Bitcoin Cash (BCH) Price Prediction 2026

The Bitcoin Cash price prediction for 2026 depends largely on how the broader cryptocurrency market evolves during the next expansion phase. Historically, BCH has performed well when capital begins rotating from major assets into alternative networks with established infrastructure.

Bitcoin Cash (BCH) Price Prediction 2026

From a technical standpoint, the next structural shift would occur if BCH reclaims the $700 level. Clearing this barrier would break the long consolidation pattern that has defined the asset’s recent price movement.

If that happens, the market could quickly test $900 and $1,000, where previous liquidity zones exist. Under favorable market conditions, Bitcoin Cash could approach the $1,200 level by the end of 2026. Such a move would represent a strong recovery from current levels while still remaining within a realistic market expansion scenario.

Bitcoin Cash Price Targets 2026 – 2030

YearPotential Low ($)Potential Average ($Potential High ($)
2026600.00850.001200.00
2027820.001200.001600.00
20281100.001800.002100.00
20291500.002200.002500.00
20302000.002500.003000.00

BCH Price Prediction 2026

In 2026, Bitcoin Cash price could project a low price of $600.00, an average price of $850.00, and a high of $1200.00.

Bitcoin Cash Price Prediction 2027

As per the Bitcoin Cash price Prediction 2027, Bitcoin Cash  may see a potential low price of $820.00, The potential high for Bitcoin Cash price in 2027 is estimated to reach $1600.00

BCH Price Analysis 2028

In 2028, Bitcoin Cash price is forecasted to potentially reach a low price of $1100.00, and a high price of $2100.00

Bitcoin Cash Price Prediction 2029

Thereafter, the Bitcoin Cash (BCH) price for the year 2029 could range between $1500.00, and $2500.00

Bitcoin Cash Price Forecast 2030

Finally, in 2030, the price of Bitcoin Cash is predicted to maintain a steady and positive. It may trade between $2000.00 and $3000.00

Bitcoin Cash Price Prediction 2031, 2032, 2033, 2040, 2050

The long-term projection assumes Bitcoin Cash (BCH) sustains relevance in overall cryptocurrency adoption and the continued development of blockchain payment solutions, with growth moderating over time as the asset matures.

YearPotential Low ($)Potential Average ($)Potential High ($)
20312300.002900.003600.00
20322700.003500.004200.00
20333200.004200.005000.00
20408200.0010200.0012000.00
205018000.0024000.0028000.00

Bitcoin Cash (BCH) Price Forecast: Market Outlook?

Year202620272030
Changelly$800.00$1200.00$2000.00
CoinCodex$980.00$1320.00$2500.00
WalletInvestor$1100.00$1500.00$2400.00
Never Miss a Beat in the Crypto World!

Stay ahead with breaking news, expert analysis, and real-time updates on the latest trends in Bitcoin, altcoins, DeFi, NFTs, and more.

FAQs

What is the prediction for Bitcoin Cash in 2026?

Bitcoin Cash could trade between $600 and $1,200 in 2026, with an average around $850 if the market regains momentum and BCH breaks the key $650–$700 resistance zone.

How much will Bitcoin Cash be worth in 2030?

Bitcoin Cash could trade between $2,000 and $3,000 by 2030, depending on global crypto adoption, market cycles, and BCH’s role in digital payments.

What is the Bitcoin Cash price prediction for 2040?

Long-term projections suggest BCH could reach $8,200 to $12,000 by 2040 if blockchain payments grow and the network maintains strong adoption and relevance.

Can Bitcoin Cash grow beyond its current use case?

Yes, BCH could grow through wider merchant adoption, faster payments, and improved on-chain utility in real-world transactions.

Is Bitcoin Cash a good long-term investment?

BCH has long-term potential due to low fees, fast transactions, and growing merchant adoption, but price depends on broader crypto market trends.

Can Bitcoin Cash reach its all-time high again?

Revisiting previous highs is possible if BCH sees sustained adoption and a confirmed long-term trend reversal, though it’s not guaranteed.

BCH
BINANCE

Ethereum Price Analysis: Institutional Buying Returns as Whales Accumulate – Rally Coming?

Ethereum Price Shows Early Strength—Why a Break Above $3,200 Matters for ETH’s Next Move

The post Ethereum Price Analysis: Institutional Buying Returns as Whales Accumulate – Rally Coming? appeared first on Coinpedia Fintech News

Ethereum price is beginning to show early signs of recovery after weeks of downside pressure. The second-largest cryptocurrency has gained roughly 4% this week, pushing back above the $2,150 level, suggesting that bearish momentum may be starting to weaken. The rebound comes as the broader crypto market attempts to stabilize, but what is happening beneath the surface is drawing even more attention. On-chain data now reveals large Ethereum whales quietly accumulating massive amounts of ETH, while institutional demand indicators are turning positive again.

At the same time, valuation metrics suggest Ethereum could be approaching levels that historically coincide with cycle bottoms and early accumulation phases. With these signals starting to align, market participants are now asking an important question: Is Ethereum price preparing for a rally toward $2,600 next?

Whale Accumulation Accelerates as $250M+ ETH Leaves Exchanges

One of the strongest bullish signals currently emerging for Ethereum comes from large-scale whale withdrawals from centralized exchanges.

🚨 🚨 🚨 🚨 🚨 🚨 🚨 77,000 #ETH (152,621,215 USD) transferred from #Binance to unknown wallethttps://t.co/y9zaa16Blf

— Whale Alert (@whale_alert) March 4, 2026

Whale data highlighted that an unknown Ethereum whale withdrew approximately 77,000 ETH, worth over $150 million, from Binance. Large withdrawals of this size are often interpreted as accumulation signals because they typically indicate investors are moving assets into cold storage rather than leaving them on exchanges for potential selling.

In a separate development, wallets associated with institutional trading firm Cumberland reportedly withdrew around 46,620 ETH, valued at nearly $98 million, from exchanges including Binance, Coinbase, and Copper within a short period.

Institutions may be buying $ETH!

In the past 16 hours, 2 wallets linked to #Cumberland withdrew 46,620 $ETH($98.8M) from Binance, Coinbase, and Copper.https://t.co/fqx0FAPCaPhttps://t.co/2CNtRUpICk pic.twitter.com/5MOjBPSLEn

— Lookonchain (@lookonchain) March 5, 2026

When combined, these transactions represent more than 120,000 ETH, or roughly $250 million leaving exchange liquidity pools. Historically, sustained exchange outflows have often preceded major crypto rallies, as reduced exchange balances tighten the available supply for sellers.

Coinbase Premium Turns Positive, Signaling Institutional Demand

Another signal strengthening Ethereum’s outlook comes from the Coinbase Premium Index, a metric used to gauge institutional demand. The indicator tracks the price difference between ETH on Coinbase and global exchanges like Binance. When the premium turns positive, it typically reflects strong buying activity from U.S.-based investors, who predominantly trade through Coinbase.

ETH coinbase premium

Recent data shows the premium has shifted back into positive territory, suggesting that institutional buyers may be returning to the market after weeks of reduced activity. Historically, sustained periods of positive Coinbase Premium have often coincided with major Ethereum rallies, as institutional capital plays a significant role in driving large price movements.

MVRV Bands Suggest Ethereum May Be Near a Market Bottom

On-chain valuation indicators are also beginning to support the possibility of a recovery. Ethereum’s MVRV (Market Value to Realized Value) pricing bands currently place the asset within a zone that has historically aligned with market bottoms.

MVRV Pricing Bands show Ethereum $ETH at a level that has historically aligned with market bottoms. pic.twitter.com/4LEbiSll2X

— Ali Charts (@alicharts) March 5, 2026

The MVRV ratio compares Ethereum’s market value to the average cost basis of all coins in circulation. When ETH trades near the lower MVRV bands, it typically suggests the asset is undervalued relative to historical market cycles. Previous cycles have shown that Ethereum often begins strong upward trends after entering these valuation zones, as long-term investors start accumulating at discounted prices.

Ethereum Price Analysis: $2,600 Breakout Level in Focus

Ethereum price is now testing the upper boundary of a key consolidation range after weeks of sideways movement. The chart structure shows ETH attempting to break above a resistance zone that has capped price action during the recent correction phase. If buyers manage to sustain momentum above this level, the next major resistance appears near $2,600, which aligns with a higher timeframe supply zone.

Ethereum price

Momentum indicators are also beginning to support this outlook. The Relative Strength Index (RSI) has started trending upward, indicating strengthening bullish momentum after the recent bounce. However, if Ethereum fails to maintain its breakout attempt, price could revisit the lower demand zone below $2,050, where buyers previously stepped in to defend the market.

Final Words

Ethereum price is beginning to stabilize as whale accumulation strengthens and institutional demand signals improve. With ETH reclaiming the $2,150 region, market structure suggests early recovery momentum may be building. If buyers maintain control above key support levels, Ethereum price could attempt a move toward the $2,400–$2,600 resistance zone. However, failure to hold above $2,100 may reopen downside risk in the near term.

FAQs

Why is Ethereum price up today?

Ethereum is up after rebounding above $2,150, supported by whale accumulation, institutional demand, and early signs of weakening bearish momentum.

How are Ethereum whales influencing the market?

Whales withdrew over 120,000 ETH from exchanges, signaling accumulation and reducing supply, which historically precedes major price rallies.

Can Ethereum reach $2,600 soon?

If buyers sustain momentum above $2,150–$2,200, Ethereum could test resistance near $2,400–$2,600, with breakout success depending on market strength.

PancakeSwap (CAKE) Price Prediction 2026, 2027-2030: Long-Term Forecast and Market Analysis

PancakeSwap (CAKE) Price Prediction

The post PancakeSwap (CAKE) Price Prediction 2026, 2027-2030: Long-Term Forecast and Market Analysis appeared first on Coinpedia Fintech News

Story Highlights

  • The live price of CAKE token is  $ 1.40936208.
  • Price predictions for 2026 range from $1.00 to $15.00.
  • PancakeSwap (CAKE) could extend toward $80.00 by 2030, if bullish structure is maintained.

PancakeSwap is entering March 2026 in a much calmer state than it was a year ago. At $1.33, CAKE is no longer under heavy selling pressure, but it hasn’t started a clear recovery either. It is exhibiting stabilization now. The earlier correction pushed valuations lower across DeFi tokens, and PancakeSwap was no exception. However, the pace of decline has slowed, and price is now holding within a defined range rather than drifting lower each week.

Fundamentally, PancakeSwap remains one of the largest decentralized exchanges on the BNB Chain. Trading volumes may not be at peak levels, but the platform continues to operate with active liquidity and user participation. For 2026, the focus shifts from survival to rebuilding.

PancakeSwap Price Today

Cryptocurrency PancakeSwap
Token CAKE
Price $1.4094 up 1.13%
Market Cap$ 465,616,553.40
24h Volume$ 41,913,171.0015
Circulating Supply330,373,975.9409
Total Supply343,669,228.4723
All-Time High$ 44.1823 on 30 April 2021
All-Time Low$ 0.0002 on 29 September 2020

CoinPedia’s PancakeSwap  Price Prediction

Coinpedia’s price prediction highlights that PancakeSwap appears to be stabilizing after a prolonged correction. If CAKE continues to hold support and the DeFi sector regains momentum, a gradual move toward $18 by 2026 is possible. Looking further ahead, sustained growth in decentralized trading could support a long-term expansion toward $85 by 2030, provided market conditions remain favorable.

YearPotential Low ($)Potential Average ($)Potential High ($)
20264.0012.0018.00

PancakeSwap (CAKE) Price March 2026 Outlook

With March already underway, CAKE is trading between $1.20 and $1.40, a range that has acted as a short-term floor. The $1.20 level is particularly important. As long as price holds above it, the broader structure remains steady. A sustained move below that level would weaken confidence and likely extend consolidation.

On the upside, the first meaningful resistance stands near $2.00. A clean break and hold above that level would signal improving momentum. Beyond it, the next key zone sits around $3.00–$3.50, where previous rebounds faced pressure. March may not deliver dramatic upside, but it can  confirm whether CAKE is building strength or simply pausing.

PancakeSwap (CAKE) Price Prediction 2026

The full-year outlook for 2026 depends largely on the broader DeFi environment. If decentralized trading volumes increase and liquidity returns to on-chain platforms, PancakeSwap could gradually benefit. Established protocols often move when sector-wide confidence improves. From a technical perspective, reclaiming $5.00 would represent a meaningful shift in long-term structure. That level marks the midpoint of the previous breakdown cycle. A sustained move above it would suggest that buyers are regaining control.

PancakeSwap (CAKE) Price Prediction 2026

Under constructive market conditions, CAKE could work its way into the $8–$12 range during the year. In a stronger expansion phase, a move toward $18 by late 2026 becomes achievable. Such a move would likely unfold over months rather than weeks.

PancakeSwap Crypto Price Prediction 2026 – 2030

YearPotential Low ($)Potential Average ($Potential High ($)
20264.0012.0018.00
202711.0020.0030.00
202822.0038.0052.00
202945.0065.0075.00
203058.0070.0085.00

PancakeSwap (CAKE) Price Prediction 2026

In 2026, PancakeSwap price could project a low price of $4.00, an average price of $12.00, and a high of $18.00

PancakeSwap Price Prediction 2027

As per the PancakeSwap price Prediction 2027, PancakeSwap  may see a potential low price of $11.00, The potential high for PancakeSwap  price in 2027 is estimated to reach $30.00

CAKE Price Prediction 2028

In 2028, PancakeSwap price is forecasted to potentially reach a low price of $22.00 and a high price of $52.00

PancakeSwap (CAKE) Price Forecast 2026

Thereafter, the PancakeSwap (CAKE) price for the year 2029 could range between $45.00, and $75.00

PancakeSwap (CAKE) Price Prediction 2030

Finally, in 2030, the price of PancakeSwap is predicted to maintain a steady positive. It may trade between $58.00 and $85.00

PancakeSwap Price Prediction 2031, 2032, 2033, 2040, 2050

The long-term projection assumes PancakeSwap sustains relevance in enterprise blockchain use cases, with growth moderating over time as the asset matures.

YearPotential Low ($)Potential Average ($)Potential High ($)
203170.0095.00120.00
203292.00130.00180.00
2033130.00180.00240.00
2040520.00650.00880.00
2050800.001500.002800.00

PancakeSwap (CAKE) Price Prediction: Market Analysis?

Year202620272030
Changelly$15.00$22.00$48.00
CoinCodex$18.00$28.00$45.00
WalletInvestor$11.00$30.00$55.00
Never Miss a Beat in the Crypto World!

Stay ahead with breaking news, expert analysis, and real-time updates on the latest trends in Bitcoin, altcoins, DeFi, NFTs, and more.

FAQs

What is PancakeSwap (CAKE) price prediction for 2026?

CAKE could trade between $4 and $18 in 2026 if DeFi activity strengthens and PancakeSwap continues attracting liquidity and trading volume.

What is PancakeSwap price prediction 2030?

A move toward $85 by 2030 is possible if decentralized trading grows, DeFi adoption expands, and PancakeSwap maintains its role in the BNB Chain ecosystem.

How high can PancakeSwap price go by 2040?

Long-term projections suggest CAKE could potentially reach around $650 on average and up to $880 by 2040 if DeFi adoption expands and market conditions remain favorable.

Is PancakeSwap (CAKE) a good long-term investment?

CAKE shows structural rebuilding and active usage, making it a viable long-term DeFi play if support levels hold and adoption grows.

How does DeFi growth affect CAKE price?

Rising DeFi adoption increases CAKE usage, liquidity, and fees, potentially driving higher prices over time.

Should investors buy PancakeSwap (CAKE) now?

CAKE shows structural recovery and multi-chain usage, making it a potential long-term investment if key supports hold.

MANTRA Price Soars 68% After Token Migration and Binance Listing: Is $0.032 the Next Target?

OM Rebrands to MANTRA Following v7 Upgrade

The post MANTRA Price Soars 68% After Token Migration and Binance Listing: Is $0.032 the Next Target? appeared first on Coinpedia Fintech News

MANTRA price has emerged as one of the strongest-performing tokens in the market this week. The token jumped nearly 68% to around $0.2354, attracting strong trading interest following a series of key developments tied to the project’s ecosystem transition. While the broader crypto market recorded only modest gains, MANTRA’s rally appears to be driven by major structural changes, including token migration and new exchange trading support.

With multiple catalysts unfolding within a short period, traders are now watching whether this surge represents a short-term reaction to the transition or the beginning of a broader momentum shift for MANTRA price.

Binance Listing Sparks Fresh Momentum

One of the most immediate catalysts behind the rally came on March 4, when Binance opened spot trading for the newly migrated MANTRA token.

The exchange introduced new trading pairs including MANTRA/USDT, MANTRA/USDC, and MANTRA/TRY, allowing global traders to access the upgraded token after the migration process was finalized.

Major exchange listings often act as strong liquidity drivers in crypto markets. The availability of new trading pairs significantly increased visibility and accessibility for the asset, helping push MANTRA price sharply higher as trading activity accelerated across exchanges. Alongside the listing, Binance also confirmed the completion of the token swap and reopened deposit and withdrawal services for the new MANTRA token, further improving liquidity conditions.

OM Token Migration and Rebranding Completed

Another key milestone occurred this week, when the project officially completed the migration from OM to MANTRA, marking a significant structural change for the ecosystem. The migration included the completion of the token swap and the official ticker change, transitioning the asset into its new ecosystem identity. Prior to the migration, exchanges temporarily halted deposits and withdrawals to ensure a smooth transition process.

Thank you @MEXC_Official for completing the $OM to $MANTRA redenomination.

MANTRA trading goes live on MEXC on 5th March.

Details: https://t.co/HgSJlxZSyc pic.twitter.com/jhXoHDs5ld

— MANTRA | The EVM L1 for RWAs (@MANTRA_Chain) March 4, 2026

Token migrations often attract strong market attention because they typically coincide with network upgrades, ecosystem restructuring, or broader strategic repositioning. In MANTRA’s case, the completion of the migration appears to have reignited investor interest, driving renewed speculative momentum around the token.

MANTRA Price Analysis: Bullish Flag Pattern Signals Potential Breakout

MANTRA price is currently forming a bullish flag pattern on the lower timeframes, suggesting that the recent rally may not be over yet. The pattern developed after MANTRA’s sharp upward move earlier this week, followed by a period of consolidation as price moved within a tightening range. This type of structure is commonly interpreted as a continuation pattern, where the market pauses before attempting another upward leg.

MANTRA price

According to the current chart setup, $0.02700 now acts as the key breakout resistance level. A decisive move above this level could confirm the bullish flag breakout and potentially trigger another wave of buying momentum. If buyers successfully push MANTRA price above this resistance zone, the next upside target could emerge near the $0.03200 level, which represents the next major supply area on the chart.

However, if the breakout fails, the $0.02300–$0.02070 zone may act as an important support region, where buyers previously stepped in during the rally. At the same time, traders will be watching whether the strong momentum generated by the Binance listing and token migration can sustain buying pressure in the coming sessions.

For now, the combination of exchange listing momentum, ecosystem transformation, and a bullish technical structure has positioned MANTRA among the top-performing tokens of the week.

Dogecoin Price Jumps as Altcoin Sentiment Flips: Is a DOGE Price Breakout Coming?

Is Dogecoin (DOGE) About to Repeat History Third Base Structure Nears Completion

The post Dogecoin Price Jumps as Altcoin Sentiment Flips: Is a DOGE Price Breakout Coming? appeared first on Coinpedia Fintech News

Dogecoin price is once again drawing attention across the crypto market. The meme coin climbed sharply over the past 24 hours, pushing toward the $0.095–$0.10 range as trading activity across major exchanges increased rapidly. The move comes at a time when broader altcoin sentiment has turned deeply pessimistic.

Interestingly, historical data suggests these moments of extreme bearishness often appear right before strong rebounds. So the key question now is: Is the Dogecoin price breakout coming?

Altcoin Sentiment Hits Extreme Lows: A Classic Contrarian Signal

Santiment data highlighted an unusual shift in market sentiment just before Dogecoin’s latest move. According to the data, discussions around altcoins and altseason dropped to extremely low levels across social platforms, indicating that retail traders had largely turned bearish. Such sentiment extremes historically signal that market participants have already priced in negative expectations.

Altcoin sentiment DOGE

Data also points that Dogecoin price rallied roughly 15% shortly after these bearish sentiment levels appeared, reinforcing the idea that the move could be a contrarian reaction. Markets often behave this way. When sentiment reaches peak pessimism, selling pressure begins to fade and early buyers start positioning for potential reversals. If sentiment begins improving alongside price momentum, Dogecoin could attract renewed speculative interest, something meme coins historically depend on for explosive rallies.

Altseason Social Activity Hits Multi-Month Lows

Another important signal comes from social volume tracking across the crypto market. Data shows that weekly discussions around altcoin rallies have fallen to historically low levels, suggesting that traders have largely abandoned expectations of an altcoin surge.

DOGE altseason

Ironically, these quiet phases have often marked the starting point of major altcoin recoveries in past market cycles. When retail interest disappears, selling pressure tends to dry up. This creates an environment where larger traders or early investors can accumulate positions before momentum returns. Dogecoin’s sudden price move may be reflecting the early stages of such accumulation behavior. 

Dogecoin Price Approaches Major Trendline Breakout

On the daily charts, Dogecoin price is approaching a critical resistance zone formed by a long-term descending trendline. This trendline has capped DOGE’s upside attempts for several months, keeping the meme coin locked inside a broader consolidation structure. Now, price is once again testing this resistance.

Dogecoin price

If buyers manage to push Dogecoin price above the descending trendline hurdle of $0.1060, it could trigger a technical breakout phase, potentially opening the door for a stronger recovery rally. Historically, Dogecoin has shown a tendency to move aggressively once key resistance levels break, as momentum traders quickly enter the market.

DOGE’s Mini Cycles Hint at a New Accumulation Phase

Dogecoin’s historical price cycles have also pointed to an interesting pattern. Previous mini cycles show that DOGE often spends extended periods consolidating before entering powerful upward moves. In earlier cycles, similar consolidation structures eventually resulted in gains of 190% to over 480% once bullish momentum returned.

DOGE Price breakout

Current price action appears to be forming a comparable accumulation structure. While this does not guarantee a repeat rally, it does suggest that the market may be entering the early phase of a potential recovery cycle.

Key Levels to Watch for Dogecoin (DOGE)

At the time of writing, Dogecoin price is trading around $0.095 after its recent rebound.

Resistance levels

  • $0.1040 – key psychological barrier
  • $0.1050 – $0.1080 – breakout zone above descending trendline

Support levels

  • $0.092 – short-term support
  • $0.088 – major demand zone

If Dogecoin price breaks and holds above $0.10, bullish momentum could push the meme coin toward $0.12–$0.14 in the short term. However, failure to hold above current levels could keep DOGE inside its consolidation range for longer.

❌