Reading view

DEXE Price Gains Momentum as DAO Governance Tokens Spark Crypto Market Recovery

Bull Run

The post DEXE Price Gains Momentum as DAO Governance Tokens Spark Crypto Market Recovery appeared first on Coinpedia Fintech News

DEXE price is gaining traction as investors rotate into DAO governance tokens during the latest crypto market rally. The token powering the DeXe Protocol has surged after breaking out of a prolonged consolidation phase, drawing attention from traders looking for momentum opportunities in smaller-cap altcoins.

While major cryptocurrencies remain in consolidation mode, niche sectors such as DAO governance tokens and DeFi infrastructure assets have started showing early signs of strength. Market analysts say this type of sector rotation often happens when traders search for high-beta assets capable of outperforming the broader market. As buying momentum builds, DEXE price has formed a bullish technical structure that could support additional gains if the breakout continues to hold.

What’s Driving the DEXE Price Surge: Key Catalysts Behind the Rally

Several factors appear to be contributing to the recent DEXE price momentum, combining both sector narratives and technical triggers.

1. Capital Rotation Into DAO Governance Tokens

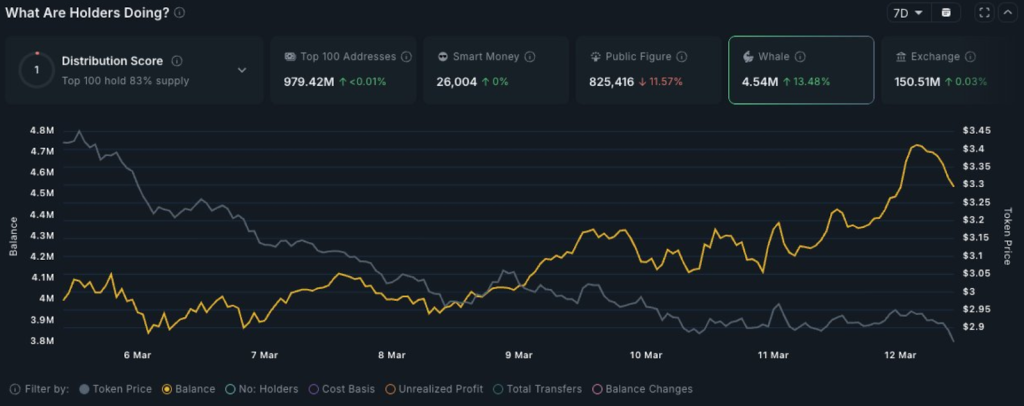
Traders often rotate funds into niche sectors when larger cryptocurrencies enter consolidation phases. Recently, DAO governance tokens have started gaining traction, benefiting from renewed interest in decentralized infrastructure and community-driven protocols.

As the governance token behind the DeXe ecosystem, DEXE is positioned within this narrative, helping attract speculative inflows.

2. Limited Tradable Supply

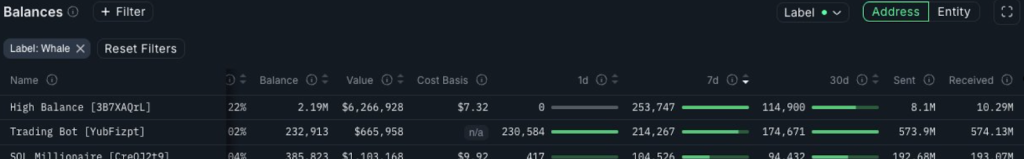
DEXE also has a relatively tight circulating supply structure, with a large portion of tokens locked within ecosystem allocations, protocol reserves, and treasury wallets. When the freely tradable supply is smaller, even moderate buying pressure can cause strong price expansions, amplifying volatility during rallies.

3. Pre-Existing Momentum

The recent rally also appears to be an acceleration of an existing trend rather than a sudden move. The token had already been recovering gradually over recent weeks before the breakout attracted broader market attention.

DEXE Price Chart Analysis: Key Levels to Watch Next

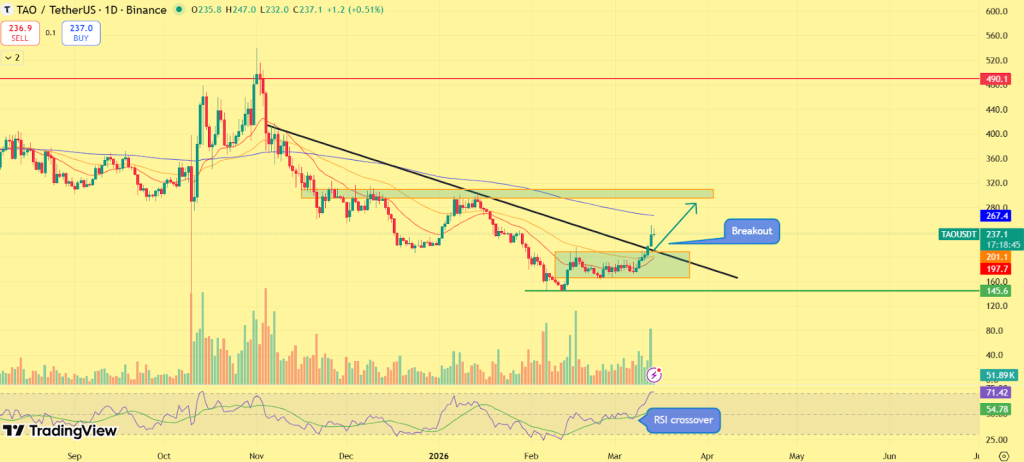
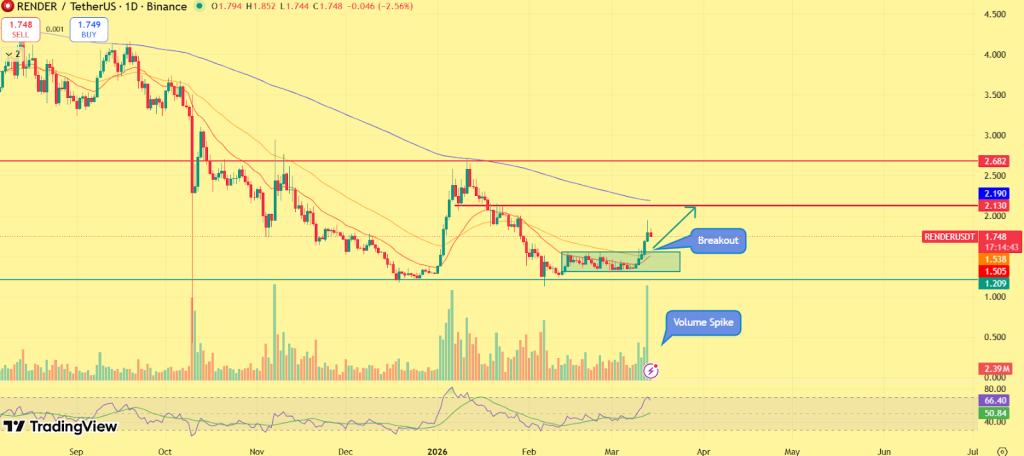
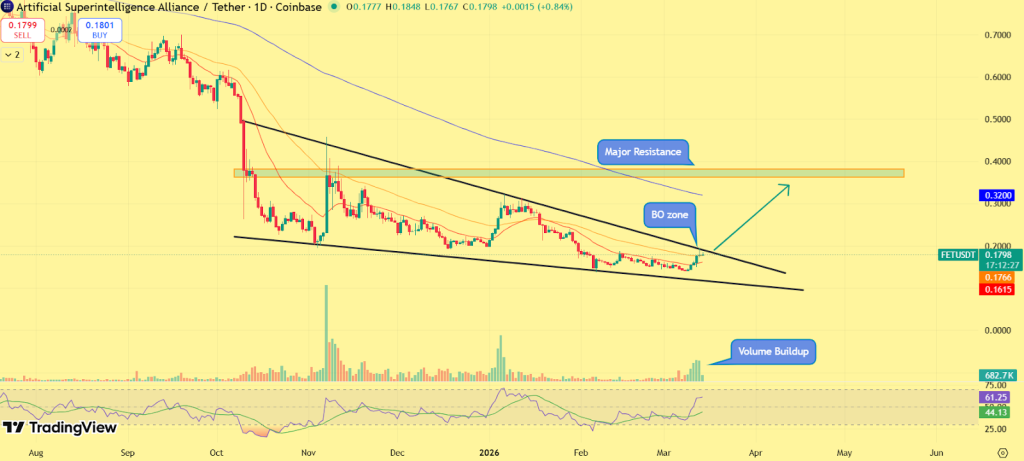
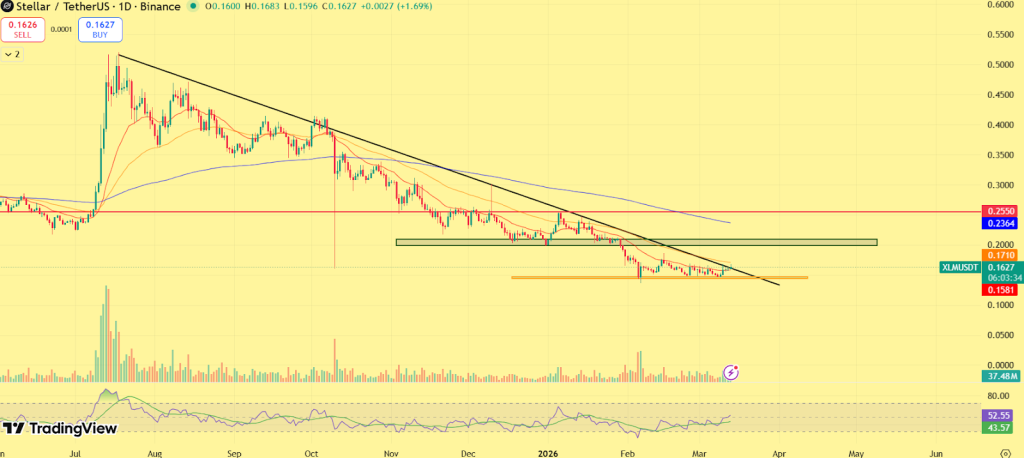
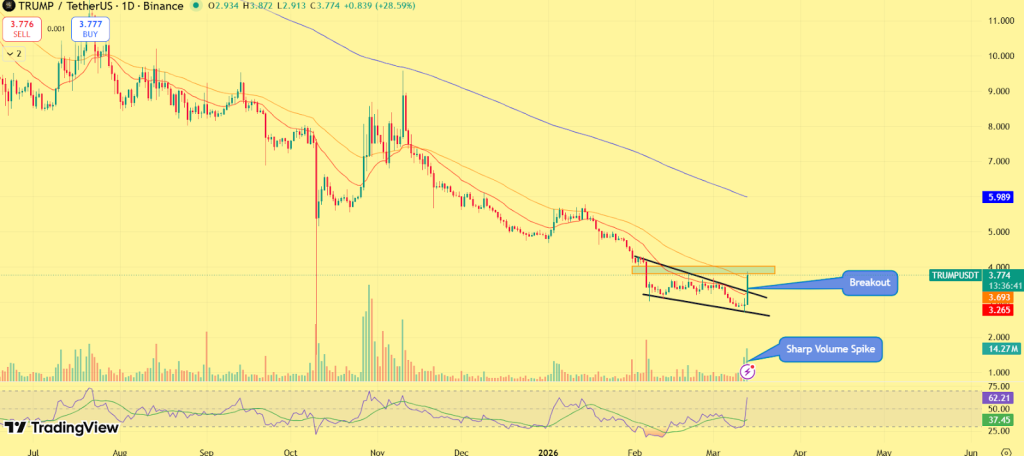
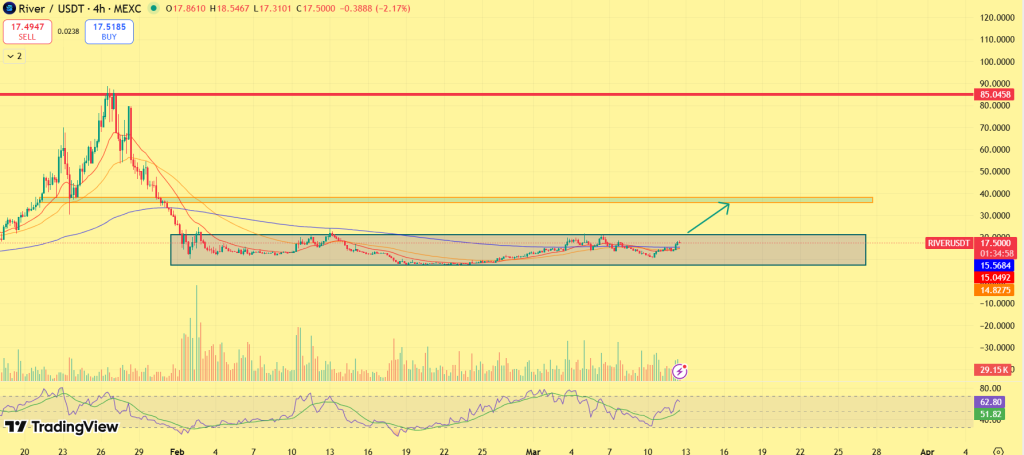
DEXE price has confirmed a breakout from a descending wedge pattern that had been forming for several months. The chart shows that DEXE spent a prolonged period trending downward while gradually building a rounded accumulation base. This type of structure often signals that selling pressure is weakening while buyers begin accumulating the asset at lower levels.

DEXE Price

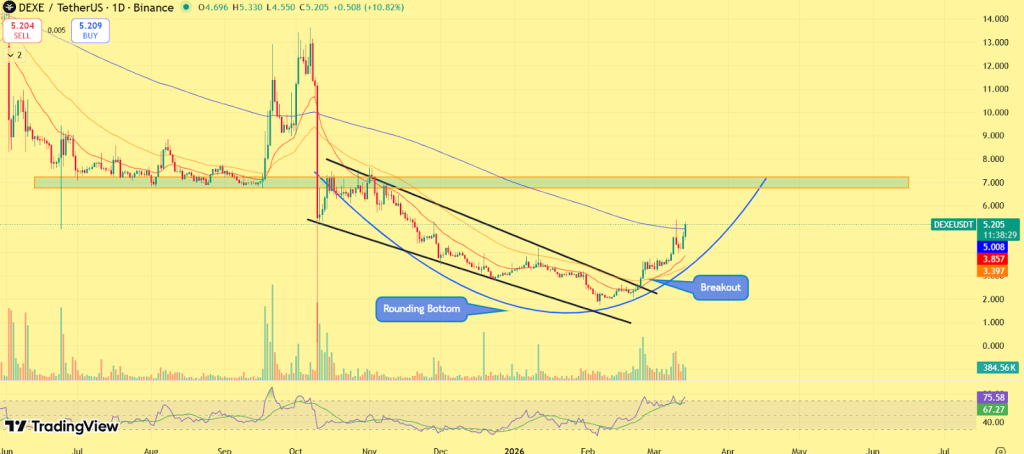
Once the token broke above the descending trendline resistance, momentum accelerated and trading volume increased. The Relative Strength Index (RSI) has moved into higher territory, indicating strengthening momentum as buyers regain control of the market.

If the breakout structure holds, the next major resistance level for DEXE price sits near the $7–$8 zone, which previously acted as a key supply area during earlier market cycles. A sustained move above this level could potentially open the door for a broader recovery phase.

DEXE Price Outlook: Can the Rally Continue?

Looking ahead, DEXE price appears to be entering a critical phase where momentum and sector narratives are aligning. The combination of DAO governance token momentum, limited tradable supply, and a confirmed technical breakout creates conditions that could support continued volatility and potential upside.

However, traders will be watching closely to see whether the token can maintain support above the breakout level. Successfully holding this zone would strengthen the case for a sustained rally. If the broader crypto market rally continues and investor interest in governance tokens grows, DEXE price could remain one of the altcoins benefiting from the sector’s renewed momentum.

Cardano Price Stabilizes as ADA Flashes Bullish Signal Amid Crypto Market Rally 

Cardano Price Prediction: Will ADA Reclaim $0.50 and Open the Path Toward $1?

The post Cardano Price Stabilizes as ADA Flashes Bullish Signal Amid Crypto Market Rally  appeared first on Coinpedia Fintech News

Cardano price is approaching a potentially critical moment as the broader crypto market rally begins to build momentum. Despite trading below the $0.30 level, analysts believe the current structure could signal early accumulation before the next major move in ADA.

While several altcoins continue to struggle amid market volatility, Cardano (ADA) has managed to hold key support levels, suggesting that buyers may gradually be stepping in during the consolidation phase. The divergence between steady network activity and relatively subdued price action has caught the attention of market analysts, who argue that ADA could be building a foundation for a potential recovery as sentiment across the crypto market improves.

With the crypto market rally gaining traction, traders are now watching closely to see whether Cardano price can reclaim higher resistance levels and confirm a broader trend reversal.

Analyst Points to Historical Bullish Signal for Cardano Price

Crypto analyst Ali Martinez recently highlighted an important technical signal forming on Cardano’s higher-timeframe chart. According to the analysis, the TD Sequential indicator has flashed a buy signal, a pattern that historically appears near major market bottoms.

Cardano buy signal

The previous time this signal appeared on Cardano’s price chart, ADA surged more than 307%, making the latest development particularly noteworthy for traders monitoring long-term trend reversals. While technical indicators alone cannot guarantee a rally, such signals often suggest that selling pressure may be fading while early accumulation begins to emerge.

With Cardano price currently trading near long-term support levels, the latest signal has strengthened the argument that ADA may be approaching a potential turning point.

Whale Activity Signals Market Redistribution

On-chain data also reveals notable shifts among large Cardano holders, commonly referred to as whales. Recent analytics indicate that approximately 130 million ADA tokens have been redistributed or sold by whales over the past week.

ADA whales data

Large-scale whale movements can sometimes create short-term volatility. However, analysts often interpret such activity as liquidity redistribution within the market rather than outright bearish positioning. In many cases, these redistribution phases occur during late-stage corrections or early accumulation periods, when tokens gradually move from larger holders to new participants entering the market.

At the same time, rising on-chain engagement across the Cardano network suggests that fundamental ecosystem activity remains resilient despite recent price consolidation.

Cardano Price Approaches Breakout Zone: What’s Next?

Cardano price is currently compressing within a tightening structure, a pattern that often precedes volatility expansion. The Cardano price chart shows ADA consolidating along a descending resistance trendline while holding above a support zone near $0.25–$0.26. This type of price compression typically signals that a larger directional move may be approaching as buying and selling pressure converge.

Cardano (ADA) price chart

If buyers manage to push Cardano price above the descending resistance trendline, ADA could quickly move toward the $0.33–$0.34 resistance zone, which previously acted as a supply region. A confirmed breakout above that level could open the door for a broader move toward the $0.45 region, where a major higher-timeframe resistance sits. However, if support fails to hold, Cardano price may continue consolidating before attempting another breakout.

Outlook for Cardano Price

Although Cardano price remains within a broader corrective structure, several signals suggest the asset may be approaching an important inflection point. Rising network activity, historical technical indicators, and tightening price action indicate that ADA could be preparing for increased volatility as the crypto market rally develops.

If buyers regain control and push price above the current resistance structure, Cardano price could begin building momentum toward higher resistance levels in the coming weeks. For now, traders are closely watching whether ADA can maintain its support base while gathering enough strength to break above the descending trendline, which could mark the beginning of a broader recovery phase.

AI Tokens Surge as TAO, RENDER and FET Lead Crypto Market Rally: Is AI Narrative Back?

AI Coins

The post AI Tokens Surge as TAO, RENDER and FET Lead Crypto Market Rally: Is AI Narrative Back? appeared first on Coinpedia Fintech News

AI tokens are once again emerging as one of the strongest sectors in the crypto market, with TAO, RENDER and FET posting major gains as investor interest in decentralized AI infrastructure grows. The renewed momentum comes as the broader crypto market stabilizes and traders rotate capital toward blockchain networks powering AI compute, decentralized machine learning, and autonomous AI agents.

Leading the rally are Bittensor (TAO), Render (RENDER), and Artificial Superintelligence Alliance (FET), three of the most prominent AI-focused crypto projects. Over the past week alone, TAO has surged nearly 35%, while RENDER and FET has gained nearly 25%-32%.

As the AI narrative strengthens, AI tokens are once again drawing capital across crypto markets, with traders closely watching whether the sector could lead the next altcoin rally.

Bittensor (TAO) Leads AI Tokens Momentum With Breakout Confirmation

Among the sector leaders, Bittensor (TAO) has shown the strongest momentum as the market turns its attention toward decentralized AI training networks. Bittensor operates as a blockchain-based machine learning marketplace where developers can train and exchange AI models while earning rewards in TAO tokens.

TAO price rally

Bittensor price has recently broken above a consolidation structure after forming a strong base near the $200 region. The breakout has pushed price toward the $240 level, suggesting buyers are gradually regaining control after a prolonged correction phase. Momentum indicators are also turning bullish, with RSI climbing into stronger territory while trading volume expands. If the ongoing bullish momentum continues, TAO could soon strike the $300–$320 resistance zone, which previously acted as a major supply region during earlier rallies.

RENDER Price Chart Shows Signs of Trend Reversal

RENDER token is another standout performer in the AI tokens sector, gaining roughly 32% this week as buyers return to the decentralized GPU infrastructure narrative. Render powers a distributed computing network that allows developers and creators to access GPU resources for AI training, rendering, and high-performance computing workloads.

RENDER price

After months of downward pressure, the token now appears to be attempting a broader trend reversal. The chart shows RENDER price forming a strong support base near $1.20, before pushing above short-term resistance levels with increasing trading volume. The latest surge has shifted the token price above key short-term moving averages with a sharp volume spike. If momentum continues, RENDER could soon test the $2.10–$2.20 resistance area, which aligns with a major technical barrier on higher timeframes.

FET Builds Breakout Setup After Long Consolidation

Meanwhile, Artificial Superintelligence Alliance (FET) has climbed nearly 24% this week, reflecting renewed interest in decentralized AI platforms building autonomous agent networks. FET represents a merger of several AI-focused blockchain initiatives and is widely seen as one of the leading protocols developing AI-driven decentralized services and intelligent agent systems.

FET price rally

FET appears to be forming a breakout setup after months of consolidation within a descending channel. FET price recently rebounded from a major support zone near $0.14, and is now approaching a key resistance area around $0.20. If buyers successfully break above the descending structure, the next upside target could emerge near the $0.40 level, where a strong supply zone sits.

Why AI Tokens Are Rallying

Several factors are driving renewed momentum across AI tokens.

First, the rapid rise of agentic AI systems, autonomous software capable of performing tasks without human input, is drawing significant attention across the technology sector.

At the same time, demand for AI compute infrastructure continues to grow. Networks like Render and Bittensor aim to provide decentralized GPU power and machine-learning resources, positioning them at the center of the AI infrastructure narrative. As artificial intelligence becomes one of the dominant themes in global technology markets, AI tokens are increasingly attracting capital from traders looking to position early in the next crypto narrative.

Outlook for AI Tokens

With artificial intelligence rapidly expanding across the technology industry, many analysts believe AI tokens could remain one of the strongest narratives in crypto markets this cycle. If the broader market continues stabilizing, projects like TAO, RENDER and FET may remain key leaders as traders rotate capital into AI-focused blockchain infrastructure. For now, the sector’s strong weekly gains suggest AI tokens are once again entering the spotlight of the crypto market.

Stellar (XLM) Price Prediction for 2026, 2030: Is a Structural Breakout Ahead?

Stellar Price Prediction

The post Stellar (XLM) Price Prediction for 2026, 2030: Is a Structural Breakout Ahead? appeared first on Coinpedia Fintech News

Story Highlights

  • The live price of the Stellar crypto is  $ 0.16343747
  • XLM is holding its $0.13–$0.16 demand zone, with a breakout above $0.30 and $0.50 needed to confirm a structural trend reversal toward 2026 targets.
  • If payment adoption and tokenization expand, Stellar could trend toward $2.50 by 2026 and potentially $5–$7 by 2030 in a strong cycle.

Stellar (XLM) is trading near $0.1633 after an extended corrective phase that saw price compress beneath a descending trendline structure. While broader crypto liquidity has rotated unevenly across sectors, XLM has quietly defended its macro demand zone between $0.13 and $0.16, a region that historically precedes accumulation cycles.

Unlike speculative Layer-1 competitors, Stellar’s positioning remains rooted in cross-border payments, asset tokenization, and institutional settlement rails. As global payment infrastructure evolves and stablecoin usage expands, networks like Stellar regain structural relevance rather than narrative hype.The question for 2026 is no longer survival; it is a structural breakout.

Stellar Price Today

Cryptocurrency Stellar
Token XLM
Price $0.1634 down -0.35%
Market Cap$ 5,396,204,928.68
24h Volume$ 127,681,445.1524
Circulating Supply33,016,939,478.5815
Total Supply50,001,786,883.6590
All-Time High$ 0.9381 on 04 January 2018
All-Time Low$ 0.0012 on 18 November 2014

CoinPedia’s Stellar Price Prediction

Coinpedia’s price prediction for Stellar (XLM) depends on macro support and long-term payment adoption potential, Stellar price could trend toward $2.50 by 2026 if resistance above $0.50 and $1.00 is reclaimed. Looking ahead to 2030, sustained ecosystem growth and institutional settlement integration may support expansion toward the $7 region under favorable market conditions.

YearPotential Low ($)Potential Average ($)Potential High ($)
20261.201.802.50

Stellar (XLM) Price March 2026 Outlook

Stellar (XLM) is currently trading around $0.1633, showing renewed short-term strength after gaining around 3% today and nearly 8% over the past week. The recent bounce suggests buyers are gradually stepping back into the market as the token stabilizes after its earlier correction phase.

Following the move above $0.16, XLM is now attempting to build momentum toward the $0.18 resistance zone, which remains the next important barrier for the rest of March. A sustained push above this level could allow the token to test $0.20–$0.21, where stronger selling pressure previously appeared. On the downside, the $0.155–$0.158 range now acts as a short-term support area. As long as Stellar holds above this zone, the current recovery structure could remain intact. However, losing this support could push the price back toward the $0.145 demand level before another rebound attempt.

Overall, for the rest of this month, Stellar price may continue trading in a gradually rising consolidation range, with traders watching closely for a breakout above the $0.18 resistance to confirm further upside momentum.

Stellar (XLM) Price Prediction 2026

Looking ahead to 2026, the thesis for XLM revolves around adoption velocity. Stellar’s long-term value proposition lies in enabling low-cost global payments and asset issuance. If stablecoin transaction volume continues expanding and tokenized real-world assets gain traction, Stellar could benefit from increased network utility. Technically, reclaiming $0.30 would mark the first structural reversal signal. A sustained breakout above $0.50 would invalidate the broader downtrend and open upside toward $0.80–$1.00. Beyond $1, historical resistance thins considerably until the $2.00–$2.50 macro supply band.

Stellar (XLM) Price Prediction 2026

Under a mature liquidity cycle and institutional participation in payment-focused blockchains, XLM approaching $2.50 by late 2026 becomes structurally feasible rather than speculative. A moderate scenario may place Stellar between $1.20 and $1.80 before attempting higher expansion.

Stellar Crypto Price Prediction 2026 – 2030

YearPotential Low ($)Potential Average ($Potential High ($)
20261.201.802.50
20271.802.403.20
20282.803.804.80
20294.205.306.20
20305.506.207.00

Stellar (XLM) Price Forecast 2026

In 2026, Stellar price could project a low price of $1.20, an average price of $1.80, and a high of $2.50.

Stellar Price Prediction 2027

As per the Stellar Price Prediction 2027, Stellar may see a potential low price of $1.80 The potential high for the Stellar price in 2027 is estimated to reach $3.20.

XLM Price Prediction 2028

In 2028, the Stellar  price is forecasted to potentially reach a low price of $2.80, and a high price of $4.80

Stellar Price Targets 2029

Thereafter, the Stellar price for the year 2029 could range between $4.20 and $6.20.

Stellar (XLM) Price Prediction 2030

Finally, in 2030, the price of Stellar is predicted to remain steady and positive. It may trade between $5.50 and $7.00.

Stellar Price Prediction 2031, 2032, 2033, 2040, 2050

The long-term projection assumes Stellar sustains relevance in enterprise blockchain use cases, with growth moderating over time as the asset matures.

YearPotential Low ($)Potential Average ($)Potential High ($)
20316.207.509.00
20328.0010.0012.00
20339.1013.0016.00
204025.0050.0080.00
2050100.00140.00200.00

Stellar (XLM) Price Prediction: Market Analysis?

Year202620272030
Changelly$1.90$2.50$3.40
CoinCodex$1.40$2.70$4.00
WalletInvestor$2.00$3.40$4.40
Never Miss a Beat in the Crypto World!

Stay ahead with breaking news, expert analysis, and real-time updates on the latest trends in Bitcoin, altcoins, DeFi, NFTs, and more.

FAQs

What is Stellar (XLM) price prediction for 2026?

Stellar could trade between $1.20 and $2.50 in 2026 if it reclaims key resistance and adoption in payments and tokenization accelerates.

What is XLM price prediction for 2027?

XLM could trade between $1.80 and $3.20 in 2027 if adoption expands and broader crypto liquidity supports payment-focused blockchains.

How high will XLM go in 2030?

Under strong market conditions, XLM may reach $5.50 to $7.00 by 2030, driven by enterprise settlement growth and stablecoin usage.

How much will XLM be worth in 10 years?

Long-term projections suggest XLM could exceed $10 if institutional adoption scales, though outcomes depend on regulation and market cycles.

What is the XLM price prediction for the next bull run?

In the next crypto bull run, XLM could target the $0.80–$1.50 range initially. A sustained breakout above $1.00 may open upside toward $2.00+, depending on market liquidity and adoption momentum.

TRON (TRX) Price Prediction 2026, 2027 – 2030: How High Can TRX Go?

Tron Price Prediction 2026, 2027 - 2030

The post TRON (TRX) Price Prediction 2026, 2027 – 2030: How High Can TRX Go? appeared first on Coinpedia Fintech News

Story Highlights

  • The live price of the Tron coin is  $ 0.29401612
  • Tron’s price 2026 target is $1.20, if breakout structure confirms above $0.50.
  • TRX’s 2030 projection toward $4 is possible, under a strong ecosystem and stablecoin growth.

TRON (TRX) is trading near $0.2905 at a time when infrastructure-focused assets are quietly regaining strategic importance within the crypto ecosystem. While high-volatility tokens rotate aggressively with short-term narratives, TRX’s valuation continues to be anchored to measurable network throughput.

TRON remains one of the leading settlement layers for stablecoin transfers, particularly USDT. That consistent on-chain activity provides structural backing that speculative assets often lack. As global digital payment flows expand and stablecoin adoption deepens, TRON’s infrastructure role becomes increasingly relevant.

Looking toward 2026, the combination of sustained utility and technical compression creates a credible pathway toward higher valuation zones, provided resistance levels are reclaimed.

TRON Price Today

Cryptocurrency TRON
Token TRX
Price $0.2940 up 1.61%
Market Cap$ 27,857,477,631.43
24h Volume$ 518,422,719.1966
Circulating Supply94,748,130,984.83
Total Supply94,748,124,812.8494
All-Time High$ 0.4407 on 03 December 2024
All-Time Low$ 0.0011 on 15 September 2017

Coinpedia’s TRX Price Prediction 2026

Coinpedia’s price prediction for Tron (TRX) depends on current structural compression and sustained network throughput. TRX price could approach $1.20 by 2026 if resistance above $0.50 converts into long-term support. Looking toward 2030, continued stablecoin settlement dominance and broader crypto market expansion could position TRON near $4 under favorable conditions.

Tron (TRX) Price March 2026 Outlook

TRON (TRX) is currently trading near $0.2906, showing modest strength with gains of around 1.3% today and roughly the same over the past week. The steady movement suggests the market is holding its recent support while gradually attempting to push higher. The $0.28–$0.285 zone now acts as the immediate support level where buyers have recently stepped in to stabilize the price. As long as TRX holds above this range, the token could continue its gradual climb toward the $0.31–$0.32 resistance area, which represents the next liquidity zone visible on the chart.

If bullish momentum strengthens and TRX manages to break above $0.32, the price could extend toward $0.34–$0.35, where stronger selling pressure may appear.

On the downside, if broader market sentiment weakens and TRX falls below the $0.28 support, the price could revisit the $0.26–$0.27 demand zone before another recovery attempt develops. Overall, the second half of March may remain a steady upward consolidation phase for TRON, with traders watching whether the token can reclaim the $0.31 resistance level to confirm further upside momentum.

TRX Price Prediction 2026

The path toward $1.20 by 2026 is rooted in three pillars:

  1. Stablecoin expansion: TRON processes billions in stablecoin volume daily. If digital payment adoption continues expanding globally, TRX benefits indirectly through increased network demand.
  2. Liquidity cycle dynamics: Historically, infrastructure tokens experience delayed but powerful repricing during mature bull phases.
  3. Technical breakout alignment: Once TRX reclaims $0.50 and establishes it as support, historical resistance weakens significantly between $0.80 and $1.20.
Tron (TRX) Price Prediction 2026

Under a healthy 2026 crypto cycle, a move toward $1.20 represents a measured expansion rather than an extreme projection. That would imply roughly a 4x appreciation from current levels, consistent with mid-cycle growth for established infrastructure assets

TRX Long-Term Price Prediction 2026-2030

YearPotential Low ($)Potential Average ($Potential High ($)
20260.801.001.20
20271.101.501.90
20281.802.302.80
20292.503.203.70
20303.203.604.00

TRX Price Prediction 2026

In 2026, the Tron price could project a low price of $0.80, an average price of $1.00, and a high of $1.20.

TRON Coin Price Projection 2027

As per the Tron Price Prediction 2027, Tron may see a potential low price of $1.10. The potential high for Tron price in 2027 is estimated to reach $1.90.

TRON Crypto Price Forecast 2028

In 2028, the Tron  price is forecasted to potentially reach a low price of $1.80 and a high price of $2.80

TRON Token Price Action 2029

Thereafter, the Tron  (Tron) price for the year 2029 could range between $2.50 and $3.70.

TRON (TRX) Price Prediction 2030

Finally, in 2030, the price of Tron is predicted to maintain a steady positive. It may trade between $3.20 and $4.00.

Tron Price Prediction 2031, 2032, 2033, 2040, 2050

The long-term projection assumes Tron sustains relevance in enterprise blockchain use cases, with growth moderating over time as the asset matures.

YearPotential Low ($)Potential Average ($)Potential High ($)
20313.504.305.20
20324.506.007.00
20339.0011.0015.00
204020.0028.0038.00
205080.00110.00150.00

Tron (TRX) Price Prediction: Market Analysis?

Year202620272030
Changelly$0.95$1.50$2.20
CoinCodex$1.00$1.80$3.00
WalletInvestor$1.50$2.00$3.50
Never Miss a Beat in the Crypto World!

Stay ahead with breaking news, expert analysis, and real-time updates on the latest trends in Bitcoin, altcoins, DeFi, NFTs, and more.

FAQs

What is the TRX price prediction for 2026?

TRX could trade between $0.80 and $1.20 in 2026 if it breaks above $0.50 and maintains strong stablecoin settlement growth.

What is the TRX Coin price prediction for 2027?

In 2027, TRX could trade between $1.10 and $1.90 if network growth continues and broader crypto market conditions remain favorable.

What is the TRX price prediction for 2028?

TRX may reach $0.94–$2.07 in 2028, with an average price of $1.50, driven by growing network usage and stablecoin dominance.

How high can TRX price go by 2030?

TRX may reach up to $4.00 by 2030 under strong ecosystem expansion, stablecoin dominance, and sustained crypto market growth.

What is the TRX price prediction for 2040?

By 2040, TRX could trade between $20 and $38 if global blockchain adoption expands and TRON remains a major settlement network.

What is the Tron price prediction for 2050?

In a strong long-term adoption scenario, Tron may range between $80 and $150 by 2050, assuming sustained utility and ecosystem growth.

Is TRX a good investment for the future?

TRX shows strong long-term potential, with projected growth through 2030, backed by real-world use in payments, stablecoins, and global adoption.

Can TRON (TRX) reach $1 in the next bull cycle?

Yes, TRX reaching $1 is possible if resistance flips to support and network activity, especially USDT transfers, keeps expanding.

XRP Price Edges Higher as Analyst Signals Massive Breakout Setup: Rally Next?

XRP Spot ETFs See $6.15M Outflows as Demand Slows

The post XRP Price Edges Higher as Analyst Signals Massive Breakout Setup: Rally Next? appeared first on Coinpedia Fintech News

XRP price edged higher today, gaining around 2%,as analyst points to a massive breakout structure forming on the monthly chart. After weeks of downward pressure, the modest rebound has caught traders’ attention as new derivatives data suggests demand may slowly be returning to the XRP market. 

At press time, XRP price was trading near $1.42, holding above an important support zone that has recently prevented further downside. While the broader crypto market remains cautious, analysts believe the current structure could represent an early accumulation phase before the next major move.

Analyst Highlights Major XRP Price Breakout Structure

Adding to the bullish narrative, crypto analyst Ali Martinez recently pointed to a multi-year symmetrical triangle pattern forming on XRP’s monthly chart. According to the price analysis, XRP has spent several years consolidating within this large structure, with price repeatedly compressing between rising support and descending resistance lines. Such formations often precede large breakout moves once resistance is cleared, particularly when they occur over multi-year timeframes.

XRP breakout

The analyst suggests that if XRP eventually breaks above this long-term structure during the next major market cycle, it could open the door to significantly higher price levels during the next bull run. While long-term projections remain speculative, the setup highlights how XRP’s current consolidation phase could be building momentum for a larger market expansion.

Futures Market Data Shows Buyers Slowly Returning

Recent derivatives data also supports the possibility that market sentiment toward XRP may be improving. According to Binance futures data, the 90-day Futures Taker Cumulative Volume Delta (CVD) has climbed to its highest level since November 2024, suggesting that buying activity is beginning to strengthen again. Recent trading activity shows:

  • Buy orders totaling roughly 516.4 million XRP
  • Sell orders near 513.1 million XRP
XRP on chain

This resulted in a positive taker delta of approximately 3.36 million XRP, meaning aggressive buyers slightly outpaced sellers in the latest session.

Although cumulative CVD over the past three months remains negative, the recent improvement suggests selling pressure that dominated the market earlier may be gradually fading. Market analysts often view such shifts in derivatives positioning as early signs of accumulation, particularly when they occur near major technical support zones.

XRP Price Chart Shows Breakout Setup Forming

On the daily charts, XRP price remains inside a descending channel, a structure that has defined its price action since late 2025. However, the recent bounce near the $1.35–$1.40 support zone suggests that buyers are defending this level aggressively. Holding this area could allow XRP to begin testing the upper boundary of the channel, where a potential breakout attempt may occur.

XRP price chart

A decisive move above the channel resistance would break the pattern of lower highs that has dominated recent months, potentially opening the door for a broader recovery rally. Momentum indicators are also beginning to stabilize, reinforcing the idea that downside pressure may be weakening.

Key XRP Price Levels to Watch

Support

$1.36 — Immediate support

$1.25 — Major demand zone

Resistance

$1.75 — First breakout level

$2.20 — Major resistance

$2.80 — Strong supply zone

If XRP successfully pushes above $1.75, it could confirm a short-term breakout and potentially trigger stronger upside momentum and if buyers continue defending the current support zone and the price manages to break above key resistance levels, XRP could soon transition from consolidation into a stronger recovery phase in the weeks ahead.

Whales Are Accumulating TRUMP as Price Soars 30%: Here’s What Data Shows

Trump Coin Price Charts New Highs, Where will the Breakout End

The post Whales Are Accumulating TRUMP as Price Soars 30%: Here’s What Data Shows appeared first on Coinpedia Fintech News

Trump price surged more than 30% in the latest trading session as whale accumulation intensified across major wallets, signaling renewed interest in the politically themed memecoin. The sudden rally comes after several weeks of steady decline, suggesting that large investors may have been quietly buying the dip before the breakout move.

On-chain data indicates whale holdings increased significantly even while the token was trading lower earlier this week. This type of accumulation pattern is often seen during early recovery phases when experienced investors begin positioning ahead of potential upside momentum. With trading volume rising and the token now breaking out of its short-term downtrend structure, traders are closely watching whether the Trump price rally could extend further.

Whale Accumulation Signals Growing Confidence

On-chain data suggests that large investors steadily accumulated OFFICIAL TRUMP (TRUMP) tokens over the past week, even as the price dropped from around $3.45 to $2.90. Data shows that whale supply increased from approximately 3.9 million tokens to around 4.54 million tokens, representing a rise of more than 13% in large-holder balances. Several notable wallets were involved in the accumulation:

TRUMP on-chain data
  • A major holder controlling over 2.19 million tokens reportedly added roughly 253,000 tokens this week, despite being significantly underwater on average entry price.
  • Another large wallet linked to the Solana ecosystem added more than 100,000 tokens, further reinforcing the accumulation narrative.

Such movements typically indicate long-term positioning rather than short-term speculation, particularly when whales accumulate during periods of price weakness.

On-Chain Capital Flows Turn Positive

Beyond whale buying, several other on-chain indicators suggest renewed activity around the token. Recent data shows:

TRUMP price data
  • Whale inflows: approximately $786K
  • Exchange outflows: about $5.2 million, indicating tokens moving to private wallets
  • New wallet inflows: roughly $1.8 million, suggesting fresh market participants.

When tokens leave exchanges in large quantities, it often indicates investors are preparing to hold rather than sell, which can reduce immediate selling pressure in the market. Interestingly, while some public figures reportedly trimmed exposure by around 11.5%, “smart money” wallets largely maintained or increased their holdings.

TRUMP Price Breakout Signals Shift in Market Structure

The latest OFFICIAL TRUMP (TRUMP) price rally appears to reflect more than just a short-term memecoin spike. The token has broken above a descending channel that had capped price movement for weeks, signaling a possible shift in short-term market structure. During the recent correction, Trump price consistently printed lower highs and lower lows, reflecting sustained selling pressure. However, the latest move has pushed the token above the channel’s upper boundary.

TRUMP price chart

The breakout was accompanied by rising trading volume, indicating that the move is supported by genuine market participation rather than thin liquidity. The Relative Strength Index (RSI) has moved into bullish territory, suggesting strengthening buying pressure. If this structure holds, Trump price could begin forming a higher-low pattern, a key technical sign that a broader recovery trend may be developing.

Key Trump Price Levels to Watch

Support Levels

$3.05 – Immediate support

$2.80 – Strong demand zone

Resistance Levels

$4.00 – Major resistance zone

$4.50 – Next bullish target

$5.20 – Extended breakout level

For now, traders will likely focus on whether the Trump token price can hold above the $3.20–$3.40 range, which could allow the market to challenge the $4 resistance level in the near term.

Ethereum and TAO Price Rally Gains Strengthens as Market Sentiment Improves

Ethereum Real-World Assets Surpass $15 Billion

The post Ethereum and TAO Price Rally Gains Strengthens as Market Sentiment Improves appeared first on Coinpedia Fintech News

Ethereum and TAO price rally is drawing fresh attention across the crypto market as both assets post strong gains in the latest trading session. Ethereum is gradually pushing higher toward a key resistance zone near $2300 and Bittensor’s TAO token has already confirmed a breakout, surging more than 14% and outperforming most major altcoins.

The move comes as the broader crypto market stabilizes after recent volatility, with traders rotating capital into high-momentum altcoins and AI-related tokens. With Ethereum attempting to break out of a prolonged consolidation range and TAO already leading the move, market participants are watching closely to see whether this momentum could trigger a wider altcoin rally.

Ethereum Price Climbs 4% as Breakout Setup Forms

Ethereum price has climbed around 4% in the latest session, signaling improving momentum after several weeks of consolidation. For weeks, ETH has been trading within a descending resistance structure, forming lower highs while maintaining strong support near the $2,050–$2,100 demand zone. The recent price recovery suggests buyers are attempting to regain control as ETH approaches the upper boundary of this range.

ETH price structure resembles a compression phase, where price gradually tightens between support and resistance. Such patterns often precede strong directional moves once the resistance level is cleared.

Ethereum Price chart

Key Ethereum Levels to Watch

Support

$2,030 – Immediate support

$1,980 – Major demand zone

Resistance

$2,350 – Near-term breakout level

$2,550 – Major resistance

$3,000 – Potential bullish target

If Ethereum manages to break above the $2,350 resistance zone, analysts believe it could trigger a stronger rally toward the $2,800–$3,000 region, confirming a broader trend reversal.

TAO Price Surges 14% Following Range Breakout 

While Ethereum is still approaching its breakout level, TAO price has already confirmed a bullish breakout, surging nearly 14% in the latest session.

Bittensor’s TAO token has been gaining strong attention due to its connection with the AI-driven decentralized network ecosystem, which has become one of the most talked-about narratives in crypto this year. The recent rally began after TAO successfully reclaimed a key support zone around $210–$220, where buyers stepped in aggressively. Since then, the token has broken above its descending trendline resistance, confirming a bullish breakout pattern. Momentum indicators are also strengthening, with rising volume supporting the move, suggesting traders are actively accumulating the asset during the breakout.

TAO price chart

TAO Price Key Levels to Watch

Support

$220 – Immediate support

$200 – Major demand zone

Resistance

$257 – Near-term resistance

$280 – Next breakout target

$390 – Major long-term resistance

If the bullish momentum continues, analysts believe TAO could attempt a move toward $300–$320 in the coming sessions.

Altcoin Momentum Building Across the Market

The simultaneous Ethereum and TAO price rally is also highlighting a potential shift in market dynamics. Historically, strong moves in Ethereum often act as a catalyst for broader altcoin momentum. At the same time, TAO’s surge reflects the growing interest in AI-related crypto projects, which have become one of the most dominant narratives in the digital asset space.

With Ethereum approaching a technical breakout and TAO already leading gains, traders are beginning to speculate that the market could be entering an early phase of an altcoin momentum cycle.

Market Outlook

If Ethereum manages to break above its key resistance zone while TAO maintains its bullish structure, the current Ethereum and TAO price rally could extend further and potentially trigger broader gains across the altcoin market. At the time of writing, Ethereum price was trading near $2,150 while TAO price hovered around $260, reflecting growing investor interest as momentum returns to select altcoins. For now, traders are closely watching whether Ethereum can clear the $2,650 resistance level, while TAO attempts to sustain its breakout and push toward higher price targets.

Near Protocol (NEAR) Price Prediction 2026, 2027 – 2030: NEAR Price To Record 2X Surge?

Near Protocol Price Prediction

The post Near Protocol (NEAR) Price Prediction 2026, 2027 – 2030: NEAR Price To Record 2X Surge? appeared first on Coinpedia Fintech News

Story Highlights

  • The live price of the Near Protocol token is  $ 1.36273406.
  • Price predictions for 2026 range from $3.70 to $11.80.
  • NEAR price may reach a high of $71.78 by 2030.

As altcoin momentum intensifies, Near Protocol (NEAR) is rapidly emerging as a standout contender in the crypto space. Fueled by strong fundamentals and recent bullish market trends, NEAR’s rise has caught the attention of both retail and institutional investors.

 With NEAR now bridging to Solana and TON via Chain Signatures, the future looks promising. Wondering where it’s headed next? Dive into our in-depth NEAR Price Prediction 2026 – 2030 to uncover the possibilities.

Overview

NEAR Protocol Price Today

Cryptocurrency NEAR Protocol
Token NEAR
Price $1.3627 up 4.82%
Market Cap$ 1,758,003,279.33
24h Volume$ 328,805,470.6540
Circulating Supply1,290,056,023.00
Total Supply1,290,056,023.00
All-Time High$ 20.4183 on 16 January 2022
All-Time Low$ 0.5260 on 04 November 2020

Coinpedia’s NEAR Price Prediction 2026

In early 2026, NEAR price briefly dropped below $1.0 to $0.844 but rebounded. This raises the possibility of a rally from the $1.00 level, similar to the 900% increase in Q4 2023. A crucial factor will be reclaiming the $2.0 resistance; if successful, a target of $4.34 could be in sight. However, falling below $1.0 may delay this bullish outlook, but renewed demand at this level could present a strategic entry point for investors.

NEAR Price Prediction For March 2026

NEAR Protocol price is currently trading around $1.32, continuing to move within a consolidation phase after the recent correction seen across major Layer-1 tokens. The $1.20–$1.25 region has now emerged as the most important short-term support area, where buyers have recently stepped in to stabilize the price. As long as NEAR holds above this support zone, the token could attempt a recovery toward the $1.55–$1.70 resistance range, which previously acted as a supply area during recent rallies. A breakout above this region could gradually push the price toward $2.00, where stronger liquidity clusters remain.

However, if the broader market weakens and NEAR fails to defend the $1.20 support, the price could temporarily drop toward the $1.00 demand zone before another recovery attempt develops. Overall, March may remain a range-building phase for NEAR, with traders closely watching whether the token can maintain support while gradually testing higher resistance levels as market sentiment improves.

NEAR Price Prediction 2026

In early 2026, the NEAR protocol experienced a brief decline, dropping below the $1.0 mark to a low of $0.844, though it later rebounded to the $1.0 level. This raises an important question about whether NEAR might initiate a rally from the $1.00 demand area, similar to the one observed in Q4 2023.

NEAR Price Prediction 2026

Notably, the rally in Q4 2023 led to an impressive 900% increase, reaching a peak of $9. However, since that peak, the price has retraced, negating those prior gains. Currently, NEAR price is at a level where it started, and a resurgence in demand could spark another rally. A significant confirmation of this potential flip in bullish trend will arise if the price can reclaim the $2.0 area, which is considered a critical resistance point. Should NEAR succeed in overcoming this hurdle, only then it may pave the way for a minimum increase to $4.34, provided it can maintain a weekly close above the $2.0 threshold.

Conversely, if NEAR were to drop below the $1.0 mark, this could undermine the bullish outlook or at least delay it. Nonetheless, given the current market conditions, there is both caution and opportunity present. Since the price has previously not dipped below $1.0, if demand emerges from this level, it could represent a well-defined strategic entry point for smart investors.

NEAR On-Chain Analysis

NEAR has officially entered a high-conviction Taker Buy Dominant Phase as of January 2026. The 90-day Spot Taker CVD flipping from neutral to green confirms that aggressive market buyers are now absorbing liquidity faster than sellers, signaling a major return of organic demand.

NEAR Protocol On Chian Data

This bullish on-chain shift, bolstered by Grayscale’s recent spot ETF filing and a supply-tightening inflation cut, highlights growing institutional confidence. NEAR is currently building the structural momentum necessary to challenge key recovery targets near $2.00-$2.10.

Near Protocol Price Prediction 2026 – 2030

YearPotential Low ($)Potential Average ($)Potential High ($)
20263.707.7511.80
20275.3211.8018.28
20287.9118.2828.65
202912.0628.6545.24
203018.7045.2471.78

NEAR Crypto Price Prediction 2026

According to our analysts, Near Protocol’s price projection, the price could range between $3.70 and $11.80, with an average trading price of around $7.75.

Near Protocol (NEAR) Price Prediction 2027

Looking forward to 2027, NEAR’s price could range between $5.32 and $18.28, and an average forecast price of $11.80.

Near Protocol Crypto Price Prediction 2028

In 2028, the price of a single Near Protocol token could range between $7.91 and $28.65, with an average price of $18.28.

NEAR Price Prediction 2029

By the end of 2029, NEAR’s price could range between $12.06 as its low and $45.24 as its high, with an average trading price of $28.65.

Near Protocol Price Prediction 2030

In 2030, Near Protocol price may touch its lowest price at $18.70, hitting a high of $71.78 and an average price of $45.24.

What Does The Market Say?

Firm Name202520262030
Wallet Investor$3.19$4.40$22.30
priceprediction.net$3.98$5.92$28.62
DigitalCoinPrice$5.95$6.93$14.80

*The targets mentioned above are the average targets set by the respective firms.

Never Miss a Beat in the Crypto World!

Stay ahead with breaking news, expert analysis, and real-time updates on the latest trends in Bitcoin, altcoins, DeFi, NFTs, and more.

FAQs

What Is Near Protocol?

The protocol promotes the network of computers running a platform for developers to create and launch dApps.

How much is 1 Near Protocol Coin worth?

At the time of writing, the price of 1 NEAR was  $ 1.36297744.

What is the NEAR price prediction for 2026?

NEAR price forecasts for 2026 suggest a range between $3.70 and $11.80, depending on adoption growth and market momentum.

What is the NEAR Protocol price prediction for 2030?

NEAR Protocol price prediction for 2030 points to a potential high near $71.78 if long-term adoption and ecosystem growth continue.

Is NEAR Protocol a good long-term investment?

NEAR offers long-term potential due to its scalable design, developer adoption, and cross-chain expansion, but price volatility remains.

What factors influence NEAR price the most?

NEAR price is driven by ecosystem growth, network activity, market liquidity, investor sentiment, and overall crypto market trends.

Cardano (ADA) Price Prediction 2026, 2027 – 2030: Will ADA Price Hit $2?

Cardano Price Prediction

The post Cardano (ADA) Price Prediction 2026, 2027 – 2030: Will ADA Price Hit $2? appeared first on Coinpedia Fintech News

Story Highlights

  • The live price of the Cardano token is  $ 0.27204352.
  • Cardano price prediction suggests ADA could reach $2.75–$3.25 in 2026, with strong support levels and improving market sentiment potentially driving a major recovery.
  • On-chain data shows whales accumulating ADA while retail holdings decline, signaling smart money positioning and building a stronger long-term supply base.
  • Long-term forecasts indicate ADA could climb toward $10.25 by 2030 if ecosystem growth, investor demand, and broader altcoin market momentum continue.

The Cardano price prediction 2026 is generating significant buzz in the crypto market, as the last quarter is soon to close in few days, boosting interest for the next altcoin. The 2025 for ADA/USD began with numerous fundamental updates strengthening its future, including the transformative Plomin Hard Fork, but 2026 seems even more constructive. 

Now, Questions abound: “Will Cardano spearhead the altcoin movement?” and “What heights can ADA reach by 2050?” Explore this Cardano price prediction 2026 and beyond, filled with expert insights and ambitious forecasts.

Coinpedia’s Cardano Price Prediction

The Cardano price outlook for 2026 is promising, driven by its extraordinary 4,000% surge in 2020 and currently holding strong at a significant support level. With a positive shift in market sentiment, even a moderate increase could lead to a remarkable 1,000% rise, positioning Cardano around $4.50.

Cardano Price Today

Cryptocurrency Cardano
Token ADA
Price $0.2720 up 4.90%
Market Cap$ 9,817,369,571.46
24h Volume$ 520,923,546.6498
Circulating Supply36,087,496,074.6372
Total Supply44,994,543,382.7932
All-Time High$ 3.0992 on 02 September 2021
All-Time Low$ 0.0174 on 01 October 2017

Cardano March Price Prediction 2026

Cardano (ADA) is currently trading near $0.2620, with price action forming a symmetrical triangle pattern on the hourly chart. The token has been consolidating close to the $0.27 trendline resistance, indicating that the market is approaching a potential breakout zone. As the price continues to compress between rising support and descending resistance, volatility is gradually tightening. If buyers manage to push ADA above the $0.27–$0.28 breakout level, the token could see a quick move toward $0.32–$0.35, where the next supply zone may appear.

ADA price March outlook

ADA Price Prediction 2026

The Cardano price forecast for 2026 points to an important support level on its weekly chart, a range that has consistently acted as a strong pivot point for price trends, and is currently giving off signals of another potential rally. This support level is known for displaying remarkable resilience over time, suggesting that if Cardano’s price in USD can maintain its position above this threshold once again, it could pave the way for significant price movements in 2026.

ADA Price Prediction 2026

Looking back at Cardano’s historical performance on the weekly chart, it shows an extraordinary rally in 2020, when the asset posted staggering gains of nearly 4,000%. During that bullish phase, the Cardano price USD spent an extended period consolidating around the dynamic support trendline, which appears to be a strategic accumulation at discounts from smart money, contributing significantly to its eventual surge. 

If the current market sentiment shifts positively, a resurgence in investor confidence could lead to a recovery. Not ambitiously, even modestly, past performance could give a tremendous surge. Last year’s performance was 4000%. If we assume 1/4 of that momentum, it would result in an increase of approximately 1000%, potentially elevating Cardano’s price to $4.50 by 2026.

Cardano On-chain Analysis

As per Cardano’s on-chain metrics, “Smart Money” accumulation phase is the best observation right now, because the divergence between retail and institutional holders is more vivid than ever.

As the number of addresses holding between 10 and 1 million ADA is declining, and the consistent surge in the 10 million to 100 million coin bracket confirms this, this represents a major supply consolidation. The observation shows that these mega-whales are strategically absorbing the “weak hands” during price dips, effectively building a rock-solid fundamental floor for the asset. Also, the fact that the 1M to 10M coin bracket is also growing confirms that professional high-net-worth investors seem to be positioning for a recovery, too.

Cardano onchain

Similarly, the surge to 4.57 million total holders despite a grueling 2025 proves that Cardano’s ecosystem is expanding its reach even in a “stress test” environment. This growth in the holder base suggests that the asset is not being abandoned; rather, it is being redistributed into a more stable, long-term foundation. When a holder count rises as prices fall, it signals that the market views current levels as a deep-value opportunity rather than a reason to exit.

ADA Santimnet Data

Additionally, the Weighted Sentiment flipping the 0 line to 0.656 is a crucial momentum trigger. Professionally, this “0-line flip” indicates that the aggregate social and market bias has shifted from fear to optimism. 

ADA Weighted Sentiment

Combined with the strategic whale accumulation, this sentiment pivot suggests that the “disbelief” phase is ending and that a bullish rally is likely once the remaining retail sell pressure is fully absorbed by the growing whale cohorts.

Cardano (ADA) Price Prediction 2026 – 2030

Price PredictionPotential Low ($)Average Price ($)Potential High ($)
20262.753.003.25
20274.504.755.00
20285.255.505.75
20296.757.257.75
20309.009.7510.25

This table, based on historical movements, shows ADA prices to reach $10.25 by 2030 based on compounding market cap each year. This table provides a framework for understanding the potential Cardano price movements. Yet, the actual price will depend on a combination of market dynamics, investor behavior, and external factors influencing the cryptocurrency landscape.

Cardano Price Prediction 2031, 2032, 2033, 2040, 2050

YearPotential Low ($)Potential Average ($)Potential High ($)
203110.5011.0011.25
203213.7514.2514.75
203317.5018.5019.75
204034.2551.7569.25
2050128.25228.75329.50

Based on the historic market sentiments and trend analysis of the altcoin, here are the possible Cardano price targets for the longer time frames.

Never Miss a Beat in the Crypto World!

Stay ahead with breaking news, expert analysis, and real-time updates on the latest trends in Bitcoin, altcoins, DeFi, NFTs, and more.

FAQs

What is Cardano’s (ADA) price prediction for 2026?

Cardano could trade between $2.75 and $3.25 in 2026, with an average near $3. If bullish momentum strengthens, some forecasts see ADA potentially reaching $4.50.

How much will Cardano cost in 2030?

Cardano could trade between $9.00 and $10.25 by 2030, with an average near $9.75 if adoption grows and the broader crypto market continues expanding.

How high can Cardano go in 2040?

Long-term projections suggest Cardano could reach up to $69 by 2040 if blockchain adoption accelerates and ADA maintains strong ecosystem growth.

What will ADA be worth in 2050?

Some long-term models estimate ADA could reach around $228 on average and up to $329 by 2050, depending on global adoption and market maturity.

Is Cardano a good long-term investment?

Cardano is considered a long-term project due to its research-driven development, scalability upgrades, and focus on decentralization.

What factors could drive ADA’s price higher in the future?

ETF approval, institutional adoption, network upgrades, and improved macro conditions could all positively impact ADA’s price.

Pi Network Price Rally Accelerates Ahead of Kraken Listing: Can PI Token Break $0.30?

Pi Network Gains Attention Today With New Update

The post Pi Network Price Rally Accelerates Ahead of Kraken Listing: Can PI Token Break $0.30? appeared first on Coinpedia Fintech News

Pi Network price is gaining momentum as speculation around an upcoming Kraken listing of the PI token continues to fuel renewed interest among crypto traders. The PI price rally comes at a time when the broader cryptocurrency market has been moving largely sideways, allowing select altcoins with strong catalysts to outperform.

Over the past month, Pi Network has emerged as one of the stronger-performing tokens in the market, attracting attention from traders looking for assets with clear momentum drivers. With multiple catalysts converging, including a major exchange listing, network upgrades, and the upcoming Pi Day event, market participants are closely watching whether Pi Network price could be preparing for a larger breakout.

Kraken Listing Buzz Driving Market Attention

The latest rally appears to be largely fueled by reports that Kraken plans to list Pi Network’s token, with trading expected to begin around March 13.

Exchange listings often act as major catalysts for crypto assets because they significantly increase liquidity, accessibility, and global exposure. When a token becomes available on a major exchange, it opens the market to millions of new traders.

Coming soon: $PI@PiCoreTeam Pi Network is a mobile-first Layer-1 blockchain and developer platform enabling accessible crypto mining via smartphone, with a utility-based ecosystem on an identity-verified mainnet.

Trading starts March 13

Get ready → https://t.co/47fNCUnRqD pic.twitter.com/nPmrRElAPW

— Kraken Listings (@krakenlistings) March 12, 2026

Kraken is one of the most established cryptocurrency exchanges globally, and a listing could potentially introduce a new wave of demand for the PI token. Historically, crypto assets often experience strong pre-listing rallies, as traders accumulate positions ahead of the anticipated increase in trading volume.

Pi Network Price Analysis: Breakout Structure Forming

Pi Network appears to be forming a bullish recovery structure after an extended consolidation phase. At the time of writing, Pi token price is trading at $0.25, surged over 11%. The token recently reclaimed a key demand zone between $0.22 and $0.24, where buyers have consistently stepped in to defend the price. Since then, PI has started forming higher lows, suggesting growing bullish momentum. Furthermore, a bullish crossover of 20 day EMA and 50 day EMA was spotted which hints at accumulation. The Relative Strength Index and MACD indicator has continued to plot positive readings, favoring the bullish thesis.

Key Support Levels

$0.24 – Immediate support

$0.22 – Strong demand zone

$0.20 – Structural support

Holding above these levels keeps the short-term bullish structure intact.

Pi network price

Key Resistance Levels

$0.28 – Near-term resistance

$0.32 – Breakout confirmation

$0.38–$0.40 – Major supply zone

If buyers manage to push Pi Network price above $0.32, the next upside target could be the major resistance zone between $0.38 and $0.40. A breakout above that level could mark a trend reversal and attract additional trading momentum.

Key Catalysts Behind Pi Network Price Rally

Several catalysts appear to be driving the latest Pi Network price rally, pushing the token into the spotlight among traders.

  • Kraken Listing 

The planned Kraken listing on March 13 has sparked significant speculation across crypto communities. The move could introduce Pi Network to a broader investor base and significantly improve trading liquidity.

  • Protocol v20.2 Network Upgrade

Another important development is the completion of the Protocol v20.2 upgrade, finalized on March 12. The update required all mainnet nodes to migrate to the upgraded version, marking an important milestone in Pi Network’s ongoing “Step 3” migration phase. The upgrade improves network stability, strengthens infrastructure, and prepares the ecosystem for potential future integrations such as DeFi applications. For investors, successful network upgrades often signal active development and long-term project progress, which can support bullish sentiment.

  • Pi Day Rally Anticipation

Market sentiment is also being supported by the upcoming Pi Day celebration on March 14, a major annual event for the Pi Network community. Historically, Pi Day has been associated with project updates, ecosystem announcements, and increased community engagement. Traders are speculating that the event could bring additional developments related to ecosystem growth or the Pi decentralized exchange (PiDEX).

The convergence of these catalysts has created a strong narrative for PI, helping drive renewed buying interest.

RIVER Price Explodes 24% as $1M Tokens Get Staked: Is a Breakout Coming?

River Price Rebounds 22% After LBank Listing Relief Rally or Another Trap

The post RIVER Price Explodes 24% as $1M Tokens Get Staked: Is a Breakout Coming? appeared first on Coinpedia Fintech News

While the broader crypto market continues to trade in a sideways range, RIVER token has emerged as one of today’s top gainers, rallying nearly 24% over the past 24 hours. The sharp price surge appears to be driven by growing ecosystem activity, particularly after the project revealed that over $1 million worth of RIVER tokens are now locked in staking.

The milestone has quickly captured the attention of traders and investors, signaling rising participation and long-term commitment from token holders.

$1M RIVER Staked in Ecosystem

According to a recent update shared by the River ecosystem, the total amount of RIVER tokens locked in staking has surpassed the $1 million mark, with the latest figures showing approximately 1.04 million tokens currently staked. Staking allows token holders to lock their assets in the network to support ecosystem functions and governance. In return, participants often receive rewards or increased influence over network decisions.

Total ~$1M $RIVER staked
longer commitment = higher voting power pic.twitter.com/J2fy5GSAlr

— River (@RiverdotInc) March 11, 2026

In the River ecosystem, longer staking commitments translate into higher governance voting power, encouraging users to lock their tokens for extended periods.

Supply Reduction May be Driving the RIVER Price Rally

One of the key factors behind today’s price surge could be the reduction in circulating supply caused by staking activity. When a significant portion of tokens becomes locked in staking contracts, fewer coins remain available for trading on the open market. This tightening of supply can amplify price movements, especially when new buying interest enters the market. For smaller-cap tokens like RIVER, even moderate increases in demand can trigger sharp price movements due to relatively lower liquidity.

RIVER Price Prediction: Consolidation Within Demand Zone

RIVER price appears to be stabilizing after its previous parabolic rally, with the asset currently consolidating inside a key demand zone. On the daily chart, the token has been trading within a horizontal accumulation range between approximately $14.5 and $18, suggesting that buyers are gradually stepping in to defend this region. This zone has acted as a strong support base, where repeated price reactions indicate sustained demand.

RIVER price chart

The most important support levels to watch include: $16 and $14.5. As long as the token price remains above the $14.5 support region, the broader structure remains constructive and suggests continued consolidation before a potential move higher. A breakdown below this level could invalidate the current accumulation structure and open the door for further downside.

On the upside, RIVER faces several resistance levels: $18.5 and $22 zone. A decisive breakout above $18.5 could signal the beginning of a new bullish leg, with buyers potentially targeting the $22–$30 range in the near term.

Social Momentum Adds to Market Interest

The staking milestone has also gained traction across crypto social media platforms, further amplifying attention around the project. Such updates often attract short-term traders looking to capitalize on emerging narratives and trending altcoins. As the news circulated across the crypto community, buying activity appeared to accelerate, helping push the token higher.

For now, the $1 million staking milestone appears to be the key catalyst behind RIVER’s latest rally, positioning the token as one of the more closely watched altcoins in today’s market.

Bittensor (TAO) Price Could Surge to $270 as Analyst Spots Adam & Eve Pattern

Bittensor (TAO) Price Surges, Will Bulls Push Above $434 for a New 2025 High

The post Bittensor (TAO) Price Could Surge to $270 as Analyst Spots Adam & Eve Pattern appeared first on Coinpedia Fintech News

While the broader crypto market continues to move sideways with limited momentum, Bittensor (TAO) is quietly showing signs of relative strength. The AI-focused token (TAO) has climbed around 4% in the past 24 hours and nearly 9% over the past week, standing out in an otherwise consolidating market. Now, with analyst spotting a bullish Adam & Eve pattern and derivatives data turning positive, traders are beginning to eye a potential breakout that could push TAO price toward the $270 level.

Analyst Highlights Bullish Adam & Eve Pattern

Crypto analyst Ali Martinez recently pointed out that Bittensor (TAO) appears to be forming an Adam & Eve pattern on the 4-hour chart, a technical structure that often signals the start of a strong upward move.

The pattern typically forms when a sharp “Adam” bottom is followed by a rounded “Eve” recovery, indicating that selling pressure is weakening while buyers gradually step back into the market.

TAO price

If the structure confirms with a breakout above resistance, analysts suggest TAO price could rally toward the $250–$270 zone, which now stands as the next key upside target. Technical traders often view this pattern as a high-probability reversal setup, particularly when it appears alongside improving market sentiment.

Derivatives Data Signals Growing Bullish Sentiment

Derivatives data is also strengthening the bullish narrative around TAO price. According to Coinglass data, the TAO long/short ratio is currently hovering near 1.4, suggesting that long positions significantly outweigh short positions. A ratio above 1 generally indicates bullish trader sentiment, and the current reading shows growing confidence that TAO may continue climbing in the near term.

TAO long/short ratio

This shift in positioning suggests that market participants are increasingly betting on upside continuation rather than downside risk.

While liquidation heatmap data further highlights an interesting setup for TAO. A significant cluster of short liquidations appears above the current price zone around $205–$220. If buyers manage to push the price through this range, it could trigger forced liquidations of short positions.

TAO liquidation map

Such events often lead to rapid price surge, as traders rush to close losing positions while momentum traders enter new longs. At the same time, downside liquidation clusters remain relatively limited, suggesting that current price levels continue to attract demand.

TAO Price Analysis: Is a Major Rally Next?

With technical patterns aligning, derivatives sentiment turning bullish, and price momentum strengthening, Bittensor price appears to be entering a potentially decisive phase. If TAO price manages to clear its immediate resistance zone, the next key upside targets sit near $220, followed by the $250–$270 range highlighted by analysts.

TAO price chart

However, if the token experiences renewed volatility, TAO could retest support levels around $190–$195, where buyers have previously stepped in. For now, the token’s relative strength in a sideways market, combined with improving trader sentiment, suggests that Bittensor may be positioning for its next major move.

Toncoin Price Prediction 2026, 2027 – 2030: Will TON Price Reach $10?

Toncoin (TON) Price Prediction

The post Toncoin Price Prediction 2026, 2027 – 2030: Will TON Price Reach $10? appeared first on Coinpedia Fintech News

Story Highlights

  • The live price of the TON token is  $ 1.34131305
  • A confirmed breakout phase could drive TON price toward $10 by the end of 2026.
  • Sustained ecosystem expansion may push TON price near $50 by 2030.

Toncoin (TON) price is currently navigating a decisive structural phase. Trading near $1.34, the asset has moved away from prolonged downside pressure and is now stabilizing above long-term support. Rather than printing new lows, price action shows controlled pullbacks and gradual higher-low formation, suggesting accumulation rather than distribution.

Fundamentally, Toncoin benefits from its positioning within a broader consumer-facing ecosystem, giving it exposure beyond traditional DeFi cycles. Tokens with embedded user channels often experience valuation repricing once liquidity conditions align. As 2026 progresses, the market appears to be testing whether TON can convert its stabilization phase into a sustained breakout.

Toncoin Price Today

Cryptocurrency Toncoin
Token TON
Price $1.3413 up 3.11%
Market Cap$ 3,290,869,854.40
24h Volume$ 75,097,691.8845
Circulating Supply2,453,468,892.2563
Total Supply5,156,525,552.8796
All-Time High$ 8.2350 on 15 June 2024
All-Time Low$ 0.3906 on 20 September 2021

Coinpedia’s Toncoin Price Prediction 2026

Toncoin appears to be shifting from prolonged consolidation into early structural repair. If resistance levels above $2.50 convert into support during 2026, the asset could enter a multi-quarter uptrend capable of testing the $10 region. 

Coinpedia’s price prediction for Toncoin (TON) depends on longer term, sustained adoption and expanding liquidity cycles which may support valuation growth toward $50 by 2030.

YearPotential Low ($)Potential Average ($)Potential High ($)
20261.005.0010.00

Toncoin (TON) Price March 2026 Outlook

Toncoin is currently trading near $1.31, moving in a consolidation phase after recent market volatility across major altcoins. The $1.25–$1.28 region now acts as an immediate support zone where buyers have recently stepped in, helping the price stabilize. If TON continues holding above this support, the token could attempt a short-term recovery toward the $1.50–$1.60 resistance range, which represents the next liquidity area visible on the chart. A stronger move above this region could open the path toward $1.85–$2.00, where previous price reactions occurred. However, if market sentiment weakens and TON fails to defend the $1.25 support, the price could slide toward the $1.10–$1.00 demand zone before a stronger recovery attempt develops.

Overall, March may remain a consolidation and range-building period for Toncoin, with traders watching whether the token can reclaim higher resistance levels while maintaining support above the $1.25 range.

Toncoin (TON) Price Prediction 2026

Looking ahead to 2026, Toncoin’s trajectory will likely depend on the continued expansion of the TON ecosystem and its integration with messaging platforms and decentralized applications. The network has been positioning itself as a scalable infrastructure layer capable of supporting payments, decentralized services, and Web3 applications.

From a market structure perspective, the first significant milestone would be reclaiming the $2.50–$3.00 range, which could signal that the token has moved beyond its accumulation phase. Once this level is secured, Toncoin could gradually move toward $4–$5, where stronger resistance zones may appear.

Toncoin (TON) Price Prediction 2026

If ecosystem growth continues and broader crypto market liquidity improves, Toncoin could potentially climb toward the $6–$8 range by 2026, reflecting both network adoption and renewed investor interest in large-cap blockchain infrastructure projects.

Toncoin Long-Term Price Prediction 2027-2030

YearPotential Low ($)Potential Average ($Potential High ($)
20261.005.0010.00
20273.508.0015.00
20286.0014.0022.00
202910.0025.0035.00
203018.0032.0050.00

Toncoin (TON) Price Prediction 2026

In 2026, Toncoin price could project a low price of $1.00, an average price of $5.00, and a high of $10.00.

TON Coin Price Forecast 2027

As per the Toncoin Price Prediction 2027, Toncoin may see a potential low price of $3.50 The potential high for Toncoin price in 2027 is estimated to reach $15.00.

Toncoin Crypto Price Prediction 2028

In 2028, Toncoin price is forecasted to potentially reach a low price of $6.00, and a high price of $22.00.

Toncoin Price Projection 2029

Thereafter, the Toncoin  (Toncoin) price for the year 2029 could range between $10.00 and $35.00.

TON Price Prediction 2030

Finally, in 2030, the price of Toncoin is predicted to maintain a steady and positive. It may trade between $18.00 and $50.00.

Toncoin (TON) Price Forecast 2031, 2032, 2033, 2040, 2050

The long-term projection assumes Toncoin sustains relevance in enterprise blockchain use cases, with growth moderating over time as the asset matures.

YearPotential Low ($)Potential Average ($)Potential High ($)
203125.0040.0060.00
203248.0062.0075.00
203350.0073.0090.00
2040117.00200.00320.00
2050220.00350.00500.00

Toncoin (TON) Price Prediction: Market Analysis?

Year202620272030
Changelly$10$22$25
CoinCodex$11$18$30
WalletInvestor$14$15$27
Never Miss a Beat in the Crypto World!

Stay ahead with breaking news, expert analysis, and real-time updates on the latest trends in Bitcoin, altcoins, DeFi, NFTs, and more.

FAQs

What is Toncoin (TON) and how does it work?

Toncoin (TON) is the native token of the Ton blockchain, enabling fast payments, smart contracts, and access to decentralized apps within its ecosystem.

What is the predicted Toncoin price for 2026?

Toncoin could trade between $1.00 and $10.00 in 2026, with an average price near $5.00, depending on market trends and adoption.

How much is Toncoin worth in 2030?

Toncoin could range from $18.00 to $50.00 in 2030, with growth driven by ecosystem expansion and increased user adoption.

What is the Toncoin price prediction for 2040?

By 2040, Toncoin could trade between $117 and $320, assuming long-term blockchain adoption and sustained market relevance.

Is Ton a good buy?

Toncoin may be a strong investment if adoption grows and the network maintains relevance, but like all crypto, it carries market risks.

Is Toncoin a good long-term investment?

Toncoin’s long-term outlook is positive if the network maintains relevance, expands adoption, and sustains demand within its ecosystem.

❌