Reading view

XRP Price Near Breakout? Hidden Signal Shows Whales and ETF Demand Rising

Ripple XRP cross-border payments partnership

The post XRP Price Near Breakout? Hidden Signal Shows Whales and ETF Demand Rising appeared first on Coinpedia Fintech News

XRP is sitting at a make-or-break level, and the signals are turning hard to ignore. The weekly chart shows price once again testing a long-standing ascending trendline, a zone that has repeatedly acted as a strong buying opportunity in past cycles. At the same time, momentum is quietly building beneath the surface. ETF inflows are climbing, and whales are pulling large amounts of XRP off exchanges, tightening supply just as price compresses near support.

With both technical and on-chain signals aligning, XRP’s current setup is starting to look less like consolidation, and more like a breakout waiting to happen.

ETF Inflows Cross $1.4 Billion, Underscoring Institutional Demand

Institutional participation in XRP has strengthened notably in 2026, with cumulative inflows into spot-based investment products surpassing $1.4 billion. This represents a sharp increase in demand and pushes total tracked volumes beyond $3 billion. 

XRP ETF

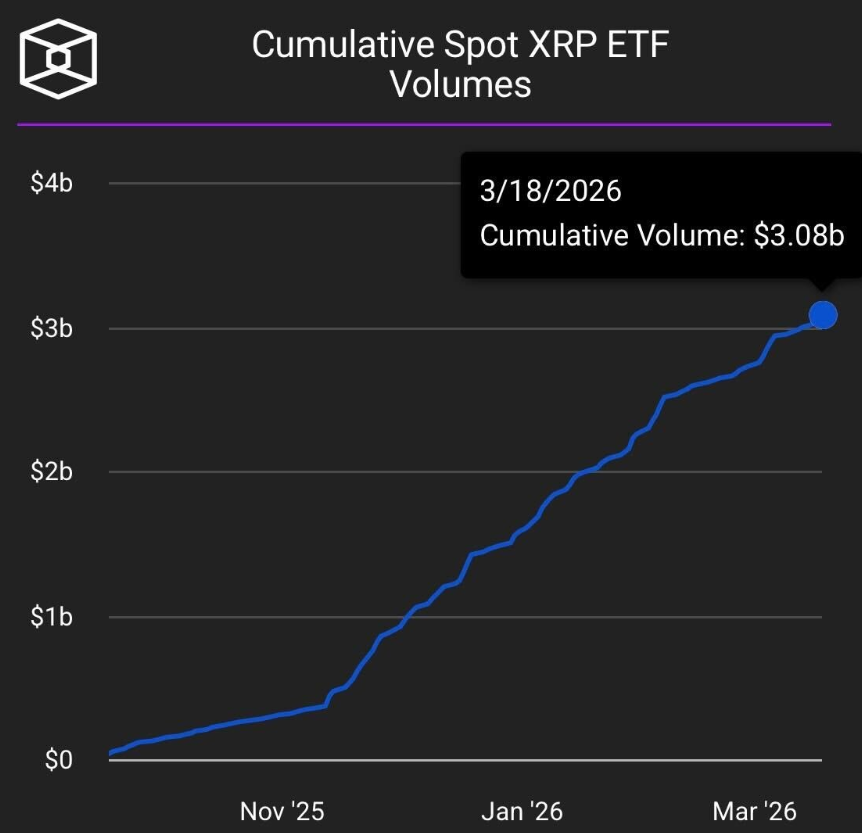
Such sustained inflows typically reinforce price stability during corrective phases while establishing a base for medium-term expansion. The persistence of capital allocation into XRP-linked products indicates growing confidence among larger market participants, even as short-term price action remains subdued.

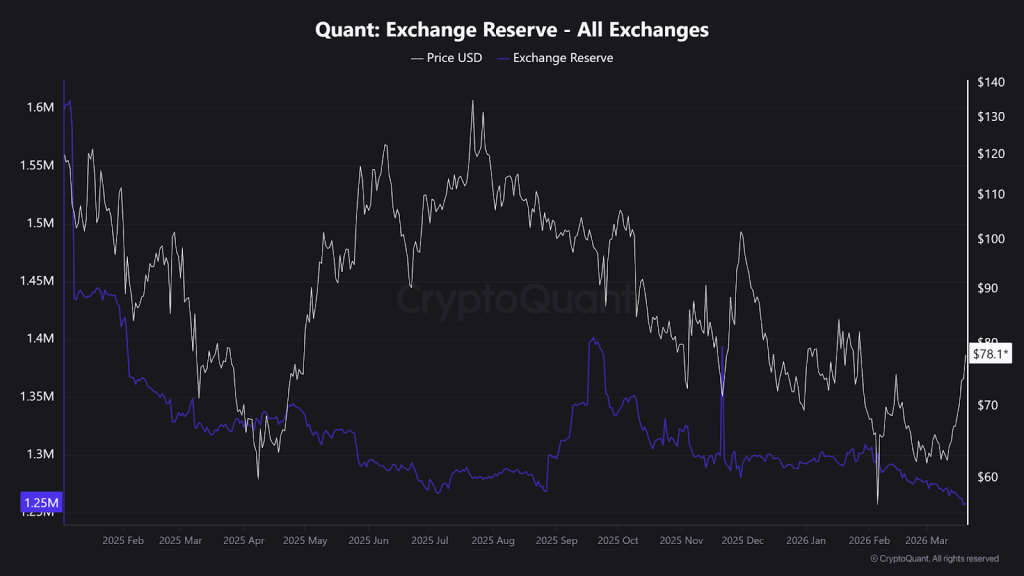
Large-Scale Whale Withdrawals Point to Supply Constriction

On-chain data highlights a parallel trend of significant XRP outflows from centralized exchanges, led predominantly by Binance. A single-day withdrawal of 530 million XRP in early February marked one of the largest movements in recent months, followed by consistent daily outflows averaging close to 50 million XRP through March.

XRP whales

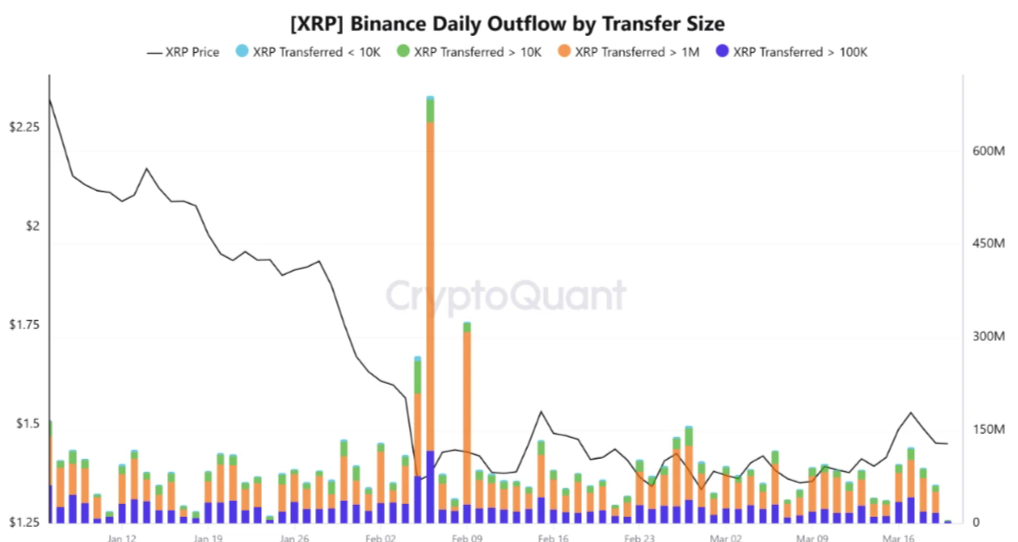
Notably, transactions exceeding one million XRP continue to dominate activity, indicating that large holders are actively repositioning. This shift reduces available exchange liquidity and introduces the potential for supply-side pressure, a condition often associated with upward price repricing.

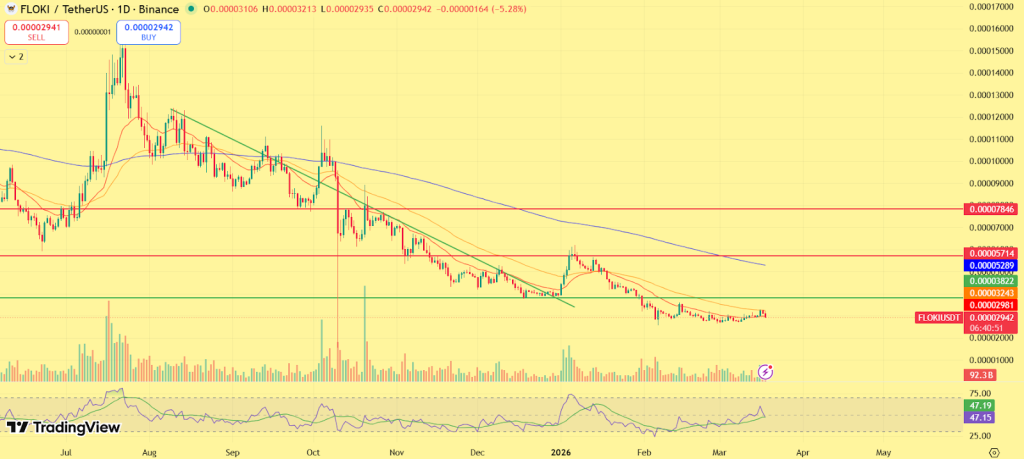
XRP Price Analysis: Descending Structure Approaches Inflection

XRP remains within a broader descending channel, characterized by a sequence of lower highs since its previous peak. However, price action has begun to compress near the lower boundary of the structure, suggesting weakening bearish momentum.

XRP price chart

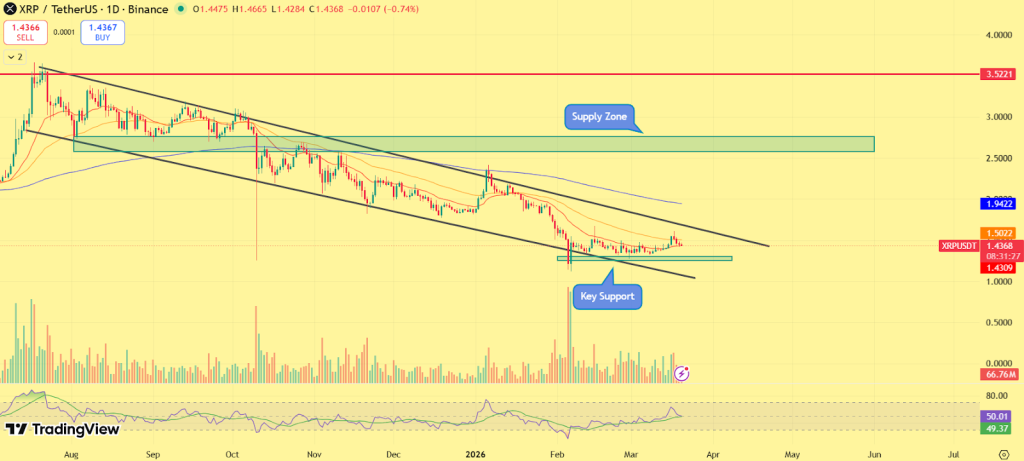
Immediate support is established in the $1.40–$1.43 region, which has so far prevented further downside expansion. A secondary support level is positioned near $1.20. On the upside, initial resistance is observed at $1.50, followed by a more significant barrier between $1.90 and $2.00, where both trendline resistance and a historical supply zone converge.

A breakout above the descending resistance could invalidate the current structure and initiate a broader trend reversal.

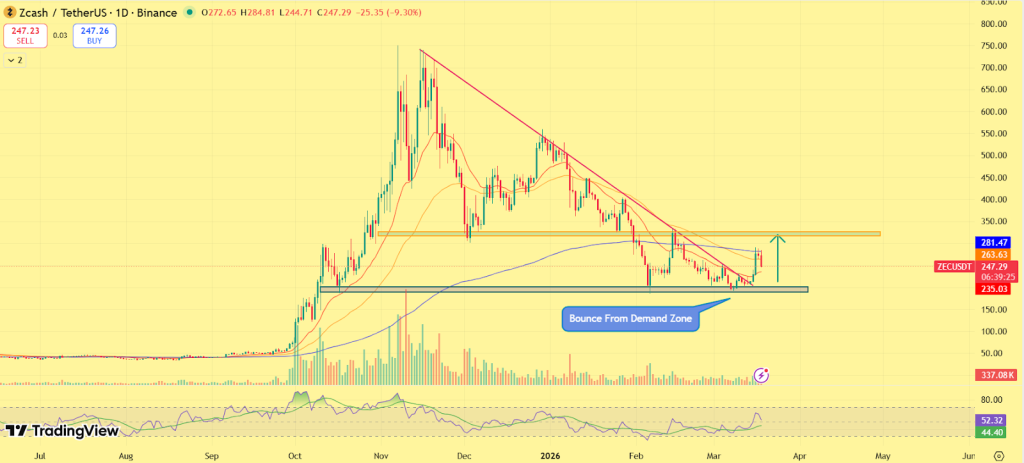
Analyst Insight: Long-Term Trendline Reinforces Bullish Structure

Market analyst Ali Charts has pointed to XRP’s long-term ascending trendline on the weekly timeframe, highlighting it as a key structural support. According to the analysis: XRP has respected this trendline across multiple cycles. Recent price action shows another bounce from this support zone. The structure suggests a potential higher-low formation

XRP weekly chart

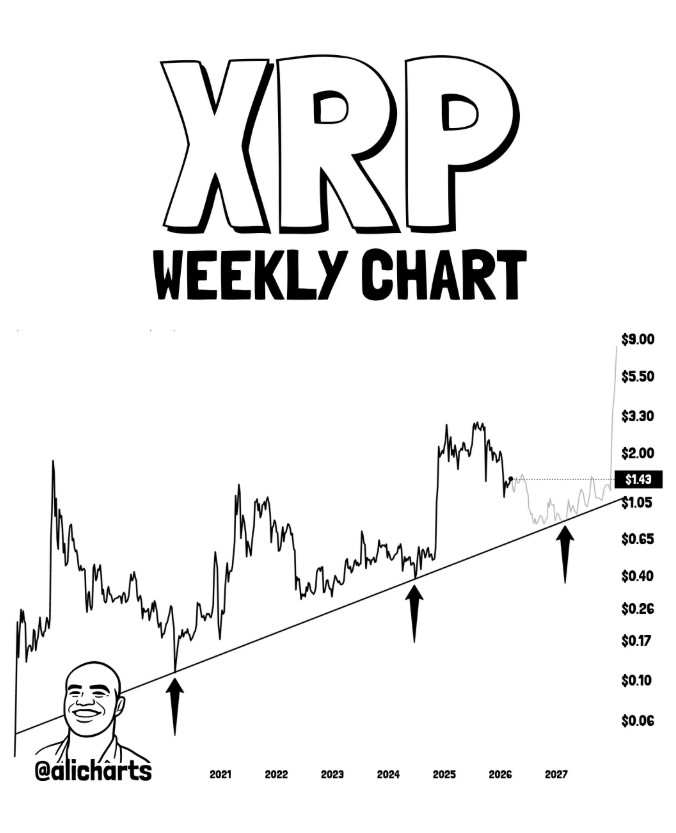
This external validation strengthens the broader technical outlook, indicating that XRP is not only stabilizing but doing so within a historically significant support framework.

Outlook: Accumulation Phase Nearing Resolution

XRP appears to be transitioning through a late-stage accumulation phase, supported by rising institutional inflows and continued whale activity. While price action remains constrained within a descending structure, the compression of volatility suggests that a decisive move may be imminent.

A confirmed breakout above the $1.90 resistance zone would likely open the path toward the $2.50–$3.00 range. Conversely, failure to maintain current support levels could delay recovery.

At present, XRP remains positioned at a critical inflection point, with both fundamental and technical indicators signaling the potential for a high-momentum move once key levels are breached.

Pi Network Price Bounces Back After Protocol 20 Upgrade: Is the Worst Over?

Pi Network Price Bounces Back After Protocol 20 Upgrade Is the Worst Over

The post Pi Network Price Bounces Back After Protocol 20 Upgrade: Is the Worst Over? appeared first on Coinpedia Fintech News

Pi Network (PI) price has bounced sharply today, rising over 8% to $0.1911, marking its strongest recovery attempt since the recent sell-off. After days of downside pressure, the latest move signals that buyers are stepping back in, absorbing supply as selling momentum fades. The rebound comes at a critical time, with PI attempting to stabilize after a correction driven largely by profit-taking.

This shift suggests the market may be transitioning from weakness to early recovery.

Protocol 20 Upgrade Strengthens Structural Narrative

A critical element supporting the current recovery is the rollout of Protocol 20, which reinforces Pi Network’s long-term development trajectory. The upgrade is designed to enhance:

The Pi Mainnet has successfully upgraded to Protocol 20, laying the foundation for supporting smart contracts. Node operators, please ensure your systems are up to date and stay tuned for instructions regarding the upcoming v21 upgrade.

— Pi Network (@PiCoreTeam) March 19, 2026
  • Network scalability and efficiency, improving transaction processing
  • Ecosystem infrastructure, enabling broader functionality
  • User and developer engagement, supporting future adoption

In early-stage ecosystems like Pi Network, upgrades serve as confidence anchors, signaling continued progress and reducing uncertainty. While they may not trigger immediate price surges, they often play a key role in stabilizing sentiment during corrective phases. In this context, Protocol 20 is acting as a fundamental cushion, supporting the current rebound.

PI Price Analysis: From Sell-Off to Rebound – What the Chart Is Showing Now

The Pi Network (PI) price has recently gone through a sharp correction, where the chart shows a clear rejection from the $0.25–$0.27 supply zone, triggering a wave of profit-taking. This led to a controlled decline, with price sliding back toward the $0.17–$0.18 support area, where buyers began to re-enter.

Pi network price chart

Instead of breaking down further, PI formed a stable base, indicating that selling pressure was being absorbed. This phase reflects a shift from aggressive selling to demand-driven stabilization, often seen near short-term bottoms. The latest move adds to this narrative. Today’s 8% rebound to $0.1911 signals that buyers are stepping back in with intent, pushing price away from support and attempting to reclaim lost ground. However, the recovery is still in its early stages and remains below key resistance. Now, the chart is clearly approaching a critical decision zone.

Immediate resistance: $0.20–$0.21 (short-term breakout level)

Major resistance: $0.25–$0.27 (trend reversal zone)

Key support: $0.17–$0.18

If PI manages to break and hold above the $0.20 region, it could build momentum toward the upper range. A decisive breakout above $0.27 would confirm a trend reversal and continuation of upside. On the flip side, failure to sustain the rebound may keep price range-bound, with another test of support possible. At this stage, the chart reflects a classic transition phase, from sell-off to stabilization, and now potentially toward recovery, with the next move dependent on how price reacts at resistance.

Outlook: Recovery Building, But Breakout Confirmation Needed

The Pi Network (PI) price is showing early signs that the worst of the correction may be over, supported by easing sell pressure and strengthening fundamentals.

However, the recovery remains incomplete without confirmation. A decisive move above the upper resistance zone would validate bullish momentum and signal a transition into a new trend phase. Until then, PI is likely to remain in a consolidation-driven recovery, where structure continues to develop. For now, PI token is not trending, it is preparing.

FAQs

Why is Pi Network (PI) price up today?

Pi Network price is up over 8% to $0.1911 as buyers step in near the $0.17–$0.18 support zone, absorbing selling pressure following a sharp correction from the $0.25–$0.27 supply area.

What is Protocol 20 and how does it affect Pi Network?

Protocol 20 is a core upgrade enhancing network scalability, efficiency, and ecosystem infrastructure. It reinforces Pi Network’s long-term development, helping stabilize market sentiment during the current price recovery.

Is Pi Network’s price recovery sustainable?

The recovery shows early strength, but sustainability depends on breaking above $0.20–$0.21 resistance. Without a decisive move higher, Pi may enter a consolidation phase before attempting another breakout.

What is Pi Network price prediction for 2026?

Pi Network could trade between $0.25–$0.50 if growth continues, with upside toward $0.70. Key support may hold near $0.17, depending on demand and adoption.

Quant (QNT) Price Rally Accelerates: Is $100 the Next Stop?

Altcoins to Buy Now: Raoul Pal Says These Three Chains Stand Out

The post Quant (QNT) Price Rally Accelerates: Is $100 the Next Stop? appeared first on Coinpedia Fintech News

Quant (QNT) price is extending its upward move, currently trading around $78 after a sharp 19% weekly surge. The rally reflects a steady shift in momentum, with buyers consistently stepping in on dips and pushing price toward a key resistance zone.

Unlike short-lived spikes, this move has developed through controlled price expansion, indicating that the market is building a stronger foundation rather than overheating. With QNT now approaching the $80 level, attention is turning toward a potential breakout.

Robinhood Listing Adds Fresh Momentum to QNT Rally

A key catalyst behind the recent upside is QNT’s listing on Robinhood, which has significantly expanded access to retail investors. The platform confirmed that QNT is now available for trading on Robinhood Crypto, including major markets like New York. This is a meaningful development, as Robinhood often acts as an entry point for new market participants.

QNT listing

Early wallet activity suggests initial inflows and accumulation, even if volumes remain modest for now. Historically, such listings tend to trigger:

  • Increased visibility and accessibility
  • Fresh retail-driven liquidity
  • Short-term momentum acceleration

The timing is particularly notable, as the listing coincides with an already strengthening technical setup, amplifying the impact of the rally.

Quant Price Analysis: Will QNT Reach $100?

QNT price structure is showing a clear trend reversal. After months of trading under a descending trendline, price has now pushed higher and is attempting to break above this resistance. This marks the first meaningful shift away from the previous downtrend.

QNT price chart

QNT/USDT price chart also highlights a strong demand zone near $55–$65, where repeated downside attempts were absorbed. This base has acted as a foundation for the current rally, reinforcing the idea of accumulation before expansion. Momentum is gradually strengthening, with indicators trending higher while still leaving room for further upside.

Key Levels to Watch

Immediate resistance: $88-90

Next target zone: $90–$100

Support: $68-$72

Demand zone: $60–$65

A confirmed breakout above $80 would validate the bullish structure and open the path toward the $90 region, which aligns with the next major supply zone. If rejected, price may retest the $70 level, but the broader structure would remain intact as long as higher lows continue to form.

On-Chain Data Points to Accumulation Phase

Supporting the rally, on-chain signals indicate that QNT is currently in an accumulation phase rather than distribution. Exchange balances have shown signs of decline, suggesting that tokens are being moved off exchanges and into long-term holding. At the same time, trading volume has increased alongside price, pointing to real demand rather than thin market conditions.

QNT on-chain

Derivatives activity is also picking up, reflecting growing participation and positioning among traders. This combination of tightening supply and rising demand typically creates favorable conditions for continued upside, especially when aligned with strong technical structure.

Final Outlook: Momentum, Structure, and Narrative Begin to Align

The current setup is being driven by a convergence of key factors. The Robinhood listing has improved accessibility, on-chain data points to accumulation, and the technical structure is shifting from downtrend to potential reversal. This alignment across fundamentals, sentiment, and price action increases the probability of a sustained move.

Historically, such conditions often precede strong directional expansions, as multiple layers of the market begin positioning in the same direction. With strong weekly gains, improving demand, and a breakout attempt underway, QNT is positioning itself as one of the more structurally bullish altcoins in the current market phase.

Zcash (ZEC) Price Prediction 2026, 2027–2030: Privacy Coin Growth Ahead

Zcash (ZEC) Price Prediction

The post Zcash (ZEC) Price Prediction 2026, 2027–2030: Privacy Coin Growth Ahead appeared first on Coinpedia Fintech News

Story Highlights

  • The live price of the Zcash token is  $ 245.48443052
  • Zcash price could see a potential upside toward $850 by the end of 2026.
  • ZEC’s long-term expansion scenario points toward $7000 by 2030.

While the broader crypto market remains selective with capital deployment, Zcash (ZEC) is beginning to show structural resilience near the $260 level. Unlike high-beta altcoins chasing speculative momentum, ZEC’s movement is increasingly tied to a deeper theme, digital privacy infrastructure. As surveillance debates intensify globally and compliance frameworks evolve, privacy-centric protocols often move from regulatory uncertainty to strategic importance. Zcash, with its zero-knowledge proof architecture, sits at the center of that discussion.

ZEC has transitioned from prolonged decline into base-building behavior, compressing volatility while defending macro support. The convergence of narrative relevance and structural stabilization is gradually reshaping sentiment around ZEC. With March approaching, traders are watching closely to determine whether this consolidation phase evolves into breakout expansion.

Zcash Price Today

Cryptocurrency Zcash
Token ZEC
Price $245.4844 down -10.39%
Market Cap$ 4,071,745,406.53
24h Volume$ 526,073,185.6954
Circulating Supply16,586,572.9155
Total Supply16,586,572.9155
All-Time High$ 5,941.7998 on 29 October 2016
All-Time Low$ 15.9691 on 05 July 2024

Coinpedia’s ZEC Price Prediction 2026

Coinpedia’s price prediction for Zcash (ZEC) highlights that Zcash price could trend toward $850 by 2026 if the current structural recovery evolves into a macro breakout. Looking further ahead, a sustained adoption cycle and privacy-sector expansion may position ZEC near $7,000 by 2030 under favorable market conditions.

YearPotential Low ($)Potential Average ($)Potential High ($)
2026480650850

Zcash (ZEC) Price March 2026 Outlook

March is unfolding as a decision month for ZEC. After defending the $230–$240 demand zone earlier in the quarter, the ZEC price is now attempting to reclaim intermediate resistance around the $280–$300 corridor. Sustained acceptance above that region would signal a transition from accumulation to expansion. Volume patterns suggest buyers are stepping in gradually rather than aggressively, which typically precedes structured breakouts rather than vertical spikes. If ZEC holds above $250 through March and clears $300 with conviction, the next liquidity band could open toward $380–$420.

However, failure to maintain support above $240 could extend consolidation deeper into Q2 before larger directional confirmation emerges. March, therefore, is less about explosive movement and more about structural confirmation.

ZEC Price Prediction 2026

Looking beyond short-term fluctuations, 2026 represents a potential inflection year for Zcash. Historically, privacy coins tend to outperform during later stages of crypto bull cycles when capital rotates from infrastructure giants into narrative-driven sectors. 

Zcash (ZEC) Price Prediction 2026

If broader market capitalization expands meaningfully through 2026, ZEC could benefit disproportionately from renewed privacy demand. Technically, a sustained break above $350 would invalidate the multi-year downtrend structure and shift long-term market bias. Once $500 is reclaimed, resistance clusters thin considerably until the $700–$850 macro supply region. Under a bullish expansion cycle, Zcash could approach $850 by late 2026, particularly if:

  • Regulatory clarity reduces exchange delisting risks.
  • Privacy technology regains institutional attention
  • Capital rotation intensifies into alternative sectors

ZEC Price Prediction 2026 – 2030

YearPotential Low ($)Potential Average ($Potential High ($)
2026480650850
20277209801200
2028100015002000
2029180030004500
2030310055007000

Zcash (ZEC) Price Forecast 2026

In 2026, the Zcash price could project a low price of $480, an average price of $650, and a high of $850.

ZEC Price Prediction 2027

As per the Zcash Price Prediction 2027, Zcash may see a potential low price of $720 The potential high for Zcash price in 2027 is estimated to reach $1200.

Zcash (ZEC) Price Prediction 2028

In 2028, the Zcash price is forecasted to potentially reach a low price of $1000, and a high price of $2000.

ZEC Price Targets 2029

Thereafter, the Zcash  (Zcash) price for the year 2029 could range between $1800 and $4500.

Zcash (ZEC) Price Prediction 2028

Finally, in 2030, the price of Zcash is predicted to maintain a steady positive. It may trade between $3100 and $7000.

Zcash Price Prediction 2031, 2032, 2033, 2040, 2050

The long-term projection assumes Zcash sustains relevance in enterprise blockchain use cases, with growth moderating over time as the asset matures.

YearPotential Low ($)Potential Average ($)Potential High ($)
2031520065008500
20326800780010000
203377001000011500
2040150002200025000
2050300004000050000

Zcash (ZEC) Price Prediction: Market Analysis?

Year202620272030
Changelly$610$720$1500
CoinCodex$581$690$1400
WalletInvestor$740$800$2000
Never Miss a Beat in the Crypto World!

Stay ahead with breaking news, expert analysis, and real-time updates on the latest trends in Bitcoin, altcoins, DeFi, NFTs, and more.

FAQs

What is Zcash (ZEC) and how does it work?

Zcash is a privacy-focused cryptocurrency using zk-SNARK technology to keep transactions private while still secure on the blockchain.

What is the ZEC price prediction for 2026?

ZEC price prediction for 2026 ranges between $480 and $850, with $650 as a projected average if bullish momentum sustains.

How much will Zcash be worth in 2030?

Zcash could trade between $3,100 and $7,000 by 2030 if privacy adoption expands and the broader crypto market enters a strong cycle.

How high can ZEC price go by 2040?

By 2040, ZEC could potentially reach $25,000 in a mature adoption scenario, with projected averages near $22,000.

What factors influence ZEC’s price growth?

ZEC’s price depends on privacy demand, zk-upgrades, regulatory trends, institutional interest, and adoption of shielded transactions.

Is Zcash a good investment?

Zcash can be a good investment for those seeking privacy-focused crypto, but consider market volatility and technology adoption before investing.

Does ZEC have a future?

Yes, ZEC has a strong future potential as global interest in privacy tech and zk-proof systems grows in finance and blockchain.

Floki Inu (FLOKI) Price Prediction 2026, 2027-2030: How High Can FLOKI Go by 2030?

Floki Inu (FLOKI) Price Prediction

The post Floki Inu (FLOKI) Price Prediction 2026, 2027-2030: How High Can FLOKI Go by 2030? appeared first on Coinpedia Fintech News

Story Highlights

  • The live price of the Floki memecoin is  $ 0.00002961.
  • FLOKI is stabilizing near key support after a prolonged downtrend, with consolidation signaling possible accumulation and a potential breakout into 2026.
  • Long-term projections suggest FLOKI could reach $0.00082 by 2026 and up to $0.0026 by 2030, driven by adoption, ecosystem growth, and market cycles.

As the broader crypto market gradually stabilizes and liquidity begins rotating back into high-beta assets, meme coins are once again starting to show early signs of life. Floki Inu, which previously captured strong retail momentum, is now entering a phase where price action appears to be stabilizing after a prolonged decline.

Currently trading around $0.00002961, FLOKI is no longer extending its downtrend aggressively. Instead, the chart shows a flattening structure near a key demand zone, where price has started consolidating after months of lower highs and lower lows. This shift suggests that selling pressure may be fading, while early accumulation begins to form beneath the surface. With volatility tightening and price hovering near support, FLOKI is approaching a point where a structural shift could define its next major move into 2026.

Read our in-depth FLOKI Price Prediction 2026 and long-term outlook through 2030 to find out.

FLOKI Price Today

Cryptocurrency FLOKI
Token FLOKI
Price $0.0000 down -4.25%
Market Cap$ 282,478,719.95
24h Volume$ 32,340,502.2512
Circulating Supply9,538,578,712,767.10
Total Supply9,652,044,222,409.14
All-Time High$ 0.0003 on 05 June 2024
All-Time Low$ 0.0000 on 09 August 2021

CoinPedia’s FLOKI Price Prediction

Floki Inu continues to evolve beyond a typical meme coin by building an ecosystem around its token. While price has undergone a prolonged correction, the current structure suggests that accumulation may be underway.

Coinpedia’s price prediction suggests that FLOKI could potentially reach around $0.00035 by 2026, while strong market cycles and increased adoption could push the token toward $0.0012 by 2030.

YearPotential Low ($)Potential Average ($)Potential High ($)
20260.0002500.0005350.000820

Floki Inu (FLOKI) Price March 2026 Outlook

FLOKI is currently trading within a tight consolidation range near $0.000028–$0.000031, following an extended downtrend. The $0.000027–$0.000028 zone is acting as immediate support, where buyers have consistently stepped in to defend the price. Meanwhile, the token is attempting to reclaim short-term momentum as it approaches resistance near $0.000032–$0.000034. 

FLOKI (FLOKI) Price March 2026 Outlook

A breakout above $0.000034 could open the path toward $0.00005–$0.000057, which aligns with previous breakdown zones and acts as a key liquidity area. If momentum strengthens further, FLOKI could attempt a move toward $0.00007, where stronger resistance may emerge. On the downside, if the price fails to hold the $0.000027 support, FLOKI could slip toward the $0.000022–$0.000024 demand zone, delaying recovery.

Overall, March appears to be a base-building phase, with the market watching closely for a breakout from this consolidation range to confirm trend reversal.

FLOKI Price Prediction 2026

Looking ahead to 2026, FLOKI’s trajectory will largely depend on market sentiment, meme coin cycles, and ecosystem development. Unlike purely speculative tokens, Floki has been working on expanding its ecosystem through utility-based initiatives, which could support long-term relevance.

From a technical standpoint, the first major recovery signal would be reclaiming the $0.00007–$0.00010 range, which marks a key historical resistance zone. 

Once this level is secured, the token could move toward $0.00020, where stronger selling pressure may appear. If broader market conditions turn bullish and meme coins regain strong retail participation, FLOKI could build sustained momentum. In a favorable scenario, FLOKI could potentially reach around $0.00035 by 2026

FLOKI Crypto Price Prediction 2026 – 2030

YearPotential Low ($)Potential Average ($Potential High ($)
20260.0002500.0005350.000820
20270.0006000.0008000.00100
20280.0009990.001240.00150
20290.001200.001590.00199
20300.001530.002030.00263

Floki Inu (FLOKI) Price Prediction 2026

Moving forward to 2026, the FLOKI price may record a maximum price of $0.000820. With a potential low of $0.000250, the average price could settle at around $0.000535

FLOKI Inu Coin Price Projection 2027

Looking ahead to 2027, the FLOKI crypto token may range between $0.000600 and $0.00100. With this, the average trading price could settle at around $0.000800 for the year.

FLOKI Inu Crypto Price Action 2028

In 2028, the FLOKI coin with a potential surge could reach a high of $0.00150, a low of $0.000999, and an average of $0.00124.

FLOKI Token Price Analysis 2029

Moving into 2029, the  FLOKI coin could range between $0.00120 and $0.00199. Considering the buying and selling pressure, the average price could settle at around $0.00159.

Floki Inu (FLOKI) Price Prediction 2030

By 2030, the value of a single FLOKI token could reach a high of $0.00263, a low of $0.00153, and an average of $0.00203.

Floki Inu Price Prediction 2031, 2032, 2033, 2040, 2050

The long-term projection assumes FLOKI sustains relevance in enterprise blockchain use cases, with growth moderating over time as the asset matures.

YearPotential Low ($)Potential Average ($)Potential High ($)
20310.000800.001300.00180
20320.001000.001800.00250
20330.001300.002200.00300
20400.00600.0100.0150
20500.0200.03500.050

Floki Inu (FLOKI) Price Prediction: Market Analysis?

Year202620272030
Changelly$0.000471$0.0008800.00250
CoinCodex$0.000550$0.0009000.00290
WalletInvestor$0.000660$0.0008400.00320
Never Miss a Beat in the Crypto World!

Stay ahead with breaking news, expert analysis, and real-time updates on the latest trends in Bitcoin, altcoins, DeFi, NFTs, and more.

FAQs

What is the Floki Inu (FLOKI) price prediction for 2026?

FLOKI could reach up to $0.00082 by 2026 in a bullish market, with an average around $0.00053 if momentum and adoption continue steadily.

What will be the price of FLOKI in 2030?

FLOKI could reach around $0.002–$0.0026 by 2030 in a strong bull cycle, supported by adoption, ecosystem growth, and sustained meme coin demand.

What is the price prediction for FLOKI in 2040?

By 2040, FLOKI may trade between $0.006 and $0.015 if it maintains relevance, expands utility, and benefits from long-term crypto market growth.

How high can Floki price go in 2050?

FLOKI could reach up to $0.05 by 2050 in an optimistic scenario, assuming mass adoption, strong utility, and continued relevance in the crypto space.

Is FLOKI a good long-term investment?

FLOKI shows long-term potential due to ecosystem expansion, but remains high-risk. Its success depends on market cycles and real utility growth.

What factors influence FLOKI price growth?

FLOKI price depends on market sentiment, meme coin trends, adoption, ecosystem development, and overall crypto liquidity conditions.

❌