Chainlink price is doing that frustrating thing again looking weak on the surface while quietly flashing signals that something bigger might be brewing underneath. This is the current stage what many don’t like because this phase tests patience and rewards it later. Right now, the LINK Price is clearly stuck, sentiment is mixed, but the data? It’s telling a very different story. And honestly, it’s getting harder to ignore.
Reserves Drop, Accumulation Rises
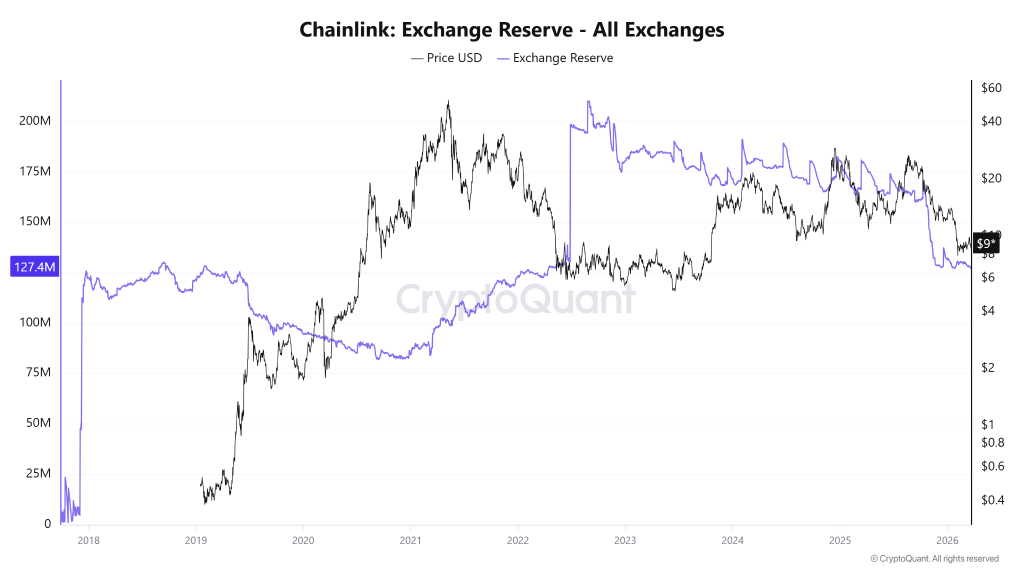
Let’s start with the obvious contradiction. While Chainlink price struggles to reclaim momentum, exchange reserves are still collapsing.
From a peak of roughly 210 million LINK in 2022, reserves have now dropped to around 127.4 million. That’s not a small dip it’s a total structural shift, leaving nearly 50% of exchange reserves means something. Yes, and what we can extract from this chart is clearly that the tokens are leaving exchanges, and historically, that doesn’t happen unless holders are playing the long game.
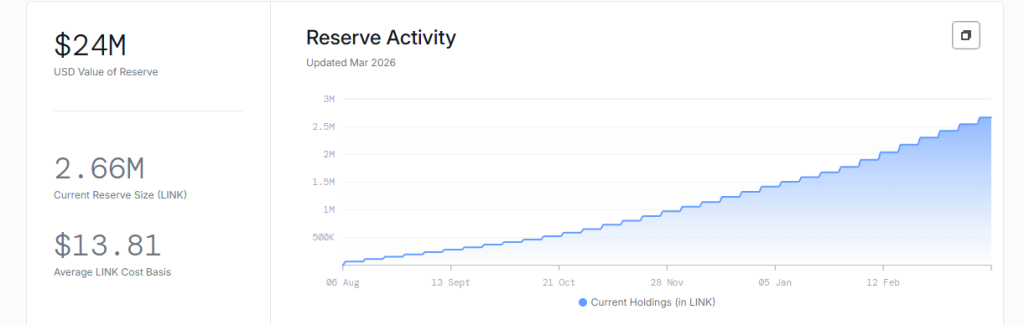
Now layer in the 2,663,585 LINK accumulated by the Chainlink Reserve, with latest inflow recorded on March 19th. This isn’t retail speculation, it’s a system designed to funnel both offchain enterprise revenue and onchain service usage back into the ecosystem, this rise tells not just the inflow rising but also means usage is still high of Chainlink’s ecosystem.
Well, supply is shrinking while adoption is expanding. That imbalance doesn’t stay quiet forever.
Adoption Narrative Gets Louder
But let’s be real, LINK price doesn’t move on tokenomics alone. It needs a narrative, and Chainlink’s got one.
Today, the network announced that it is now tied into a $58B+ annual corporate actions problem, working alongside Euroclear, which reportedly holds €40.7 trillion in assets under custody. That’s not crypto-native hype that’s traditional finance scale.
Euroclear has €40.7 trillion ($46+ trillion) in assets under custody.
Together with Chainlink, Euroclear is solving the yearly $58B+ corporate actions problem.
And it doesn’t stop there. LINK has been classified as a digital commodity by both the SEC and CFTC, while integrations stretch across major institutional players like Amundi and tokenized fund initiatives. Add partnerships targeting private credit markets across multiple global regions, and suddenly the “oracle provider” label starts to feel outdated.
It’s positioning itself as infrastructure. Whether the market is ready to price that in? Different question.
Chainlink Price Faces Key Levels
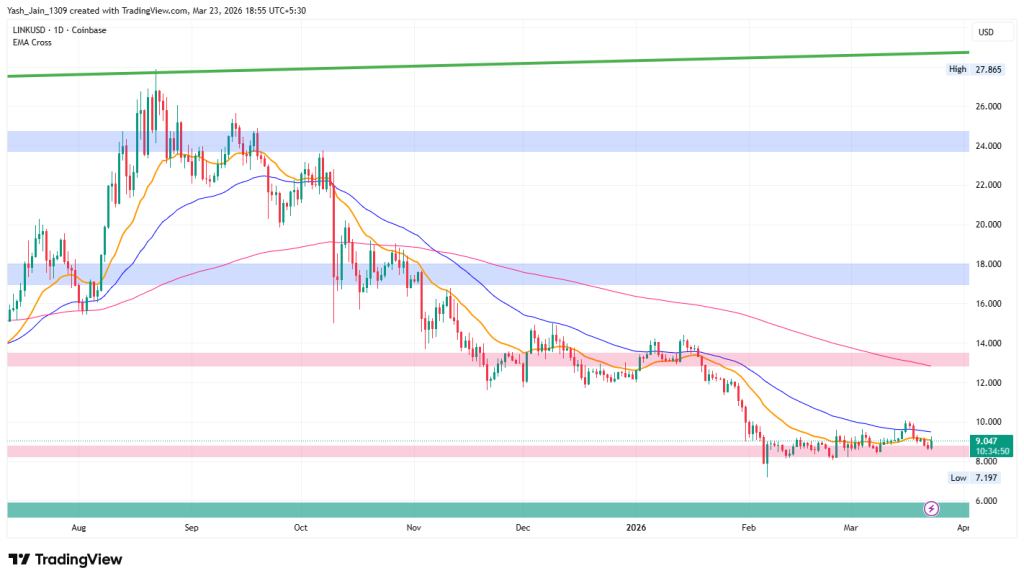
Now zoom back into reality, yes now we talk the chart. Chainlink price is currently holding above the $8 support, but it’s boxed in under the 20-day and 50-day EMA bands. That’s not bullish territory. Not yet.
If bulls manage to break through and reclaim $10, things could accelerate quickly toward $14. That’s the upside scenario traders are eyeing.
But flip the script and this matters because at this point one thing comes straight is that if $8 gives way, the downside opens up toward $6. Clean, simple, and brutal.
So, what’s next? The fundamentals are stacking, the supply is tightening, and the narrative is expanding. But until price confirms, it’s just potential.
And in crypto, potential doesn’t pay until it suddenly does. Chainlink price sits right in that tension zone.
SUI shows strong bullish momentum in early 2026, backed by rising TVL, ecosystem growth, and renewed investor confidence.
If key resistance breaks, SUI could target $3–$5 in 2026, with long-term potential extending toward $15–$18 by 2030.
As a next-generation Layer 1 blockchain, Sui is redefining the architecture of the decentralized web by introducing an object-centric model where assets, data, and permissions are natively ownable and programmable. Built to handle the demands of modern commerce, the Sui Stack provides a modular toolkit that allows developers to scale on resilient infrastructure while delivering high-performance experiences without typical blockchain trade-offs.
From powering institutional capital markets and DeFi to even revolutionizing the gaming sector, the network has already secured a significant foothold with a Total Value Locked (TVL) of $583 million, per the official website.
By prioritizing verifiable security and composable scaling, Sui ensures that value created within its ecosystem is shared rather than extracted. In this comprehensive SUI price prediction 2026–2030, we analyze how this business-ready infrastructure and growing industry adoption will impact SUI’s token and market valuation in the years to come.
SUI token price is currently in a corrective phase after reaching a peak of $5.36 in late 2024. It is currently testing the support level at $0.80, with a potential decline to the critical $0.50 level. If SUI/USD stabilizes at $0.50, this could indicate a possible reversal.
Key resistance levels to monitor are $1.05, $1.60, and $2.00. A breakout above $3.50 would confirm a trend reversal. In the meantime, it is a “buy the dip” phase for long-term investors.
Sui (SUI) Price Prediction March 2026
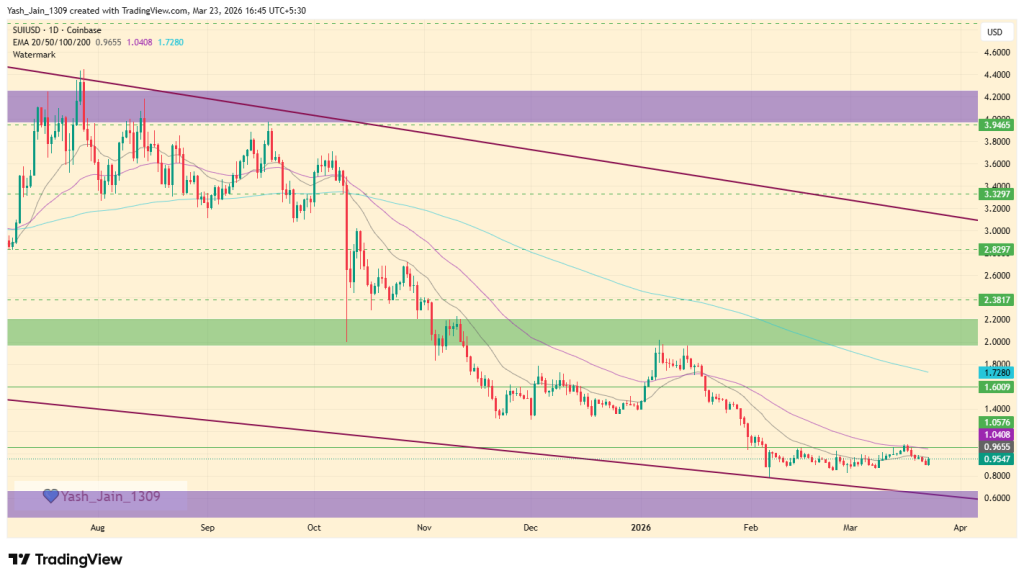
In early 2026, the SUI price tested the $2.00 level but encountered strong selling pressure, resulting in a decline to a low of $0.80 in February. Since then, the price has been consolidating just below the $1.00 mark.
As March progresses, SUI/USD finds itself at a critical juncture, as the price struggles to break through the $1 resistance level. If this struggle continues, the price may move to lower levels. Specifically, if the $0.80 support fails, the price could drop further, seeking support in the $0.50 to $0.60 range.
Conversely, if the price manages to break above $1.05, it could signal a local bottom and initiate a rally towards $1.60, with the potential for a re-test of $2.00 by the end of the month.
Sui (SUI) Crypto Price Prediction 2026
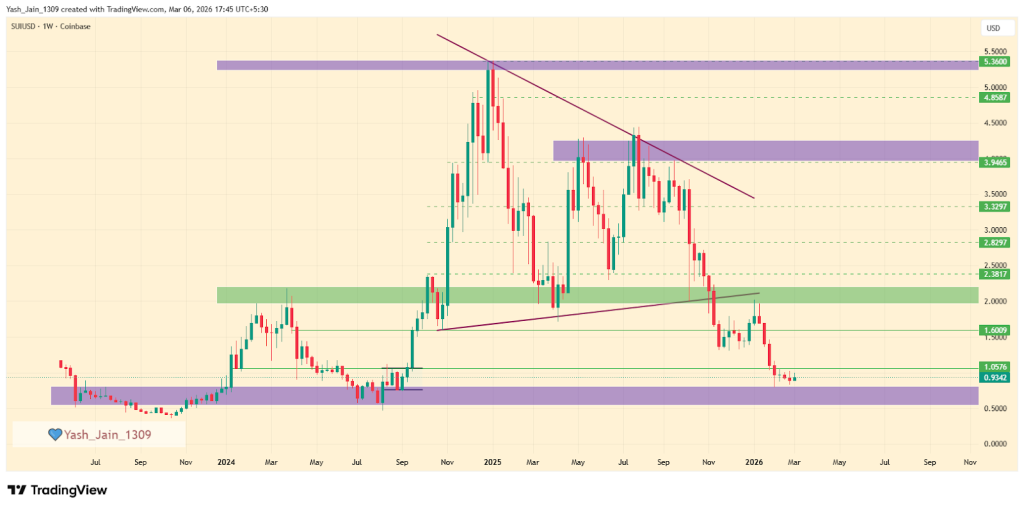
The weekly price action for SUI/USD reveals a market in a major corrective phase after its late-2024 peak, currently in Q1 2026, searching for a definitive long-term bottom.
What we witnessed is that after the 2024’s explosive rally that topped out near $5.36, the asset entered a persistent downtrend, characterized by a series of “lower highs” capped by a prominent descending resistance line. This primary trendline has remained unbroken throughout 2025, consistently forcing the price toward deeper support levels as the initial hype cycle cooled.
Currently, the SUI price is testing $0.80 support after losing $1.05 support in Q1 2026. The odds suggest a chance of reaching the $0.50 support zone if it fails to hold $0.80, because the $0.50 area is of immense technical importance, as it represents the original “genesis” accumulation level from early 2024.
The price has dipped a lot, and now it’s showing signs of stabilization as sellers are about to reach exhaustion once it hits $0.50. Real consolidation could begin, and a true reversal to fruit has better odds. This area serves as the “line in the sand” for bulls; maintaining this floor is essential to prevent a complete technical breakdown and to begin building a new base for the next market cycle.
Looking ahead, the chart identifies several key resistance levels that SUI must reclaim to shift its bearish structure. The immediate hurdle lies at the $1.05, $1.60, and $2.00 horizontal zones. A successful bounce from the current demand floor would likely target these levels first.
However, a true trend reversal will only be confirmed if SUI breaks and closes above the long-term descending trendline, currently near $3.50. Until that breakout occurs, the asset remains in a “buy the dip” accumulation phase for long-term investors.
SUI Crypto Price Prediction 2026 – 2030
Year
Potential Low ($)
Potential Average ($)
Potential High ($)
2027
$4
$6
$8
2028
$8
$10
$12
2029
$10
$13
$16
2030
$12
$15
$18
Sui (SUI) Price Prediction 2027
Subsequently, the SUI price range can be between $4 to $8 during the year 2027.
SUI Prediction 2028
Beyond the previous ATH,SUI bullish momentum may gain pace and will see another bullish spark in 2028. Specifically, as per our SUI Price Prediction, the potential SUI price range in 2028 is $8 to $12.
SUI Price Forecast 2029
Thereafter, the SUI price for the year 2029 could range between $10 and $16
Sui (SUI) Price Prediction 2030
Finally, in 2030, the price of SUI is predicted to maintain a steady and positive. It can trade between $12 and $18.
SUI Price Prediction 2031, 2032, 2033, 2040, 2050
Based on the historic market sentiments and trend analysis of the largest cryptocurrency by market capitalization, here are the possible SUI price targets for the longer time frames.
Year
Potential Low ($)
Potential Average ($)
Potential High ($)
2031
$8
$10
$15
2032
$10
$13
$18
2033
$12
$15
$22
2040
$20
$32
$40
2050
$30
$70
$150+
Never Miss a Beat in the Crypto World!
Stay ahead with breaking news, expert analysis, and real-time updates on the latest trends in Bitcoin, altcoins, DeFi, NFTs, and more.
FAQs
What is the Sui Crypto (SUI) price prediction for 2026?
SUI could trade between $0.50 and $5 in 2026. If it breaks key resistance near $3.50, momentum may push the token toward the $3–$5 range.
How high can Sui Crypto go by 2030?
If adoption continues and the ecosystem expands, SUI could reach $12–$18 by 2030, driven by DeFi growth and network demand.
What is the Sui price prediction for 2040?
Long-term projections suggest SUI may trade between $20 and $40 by 2040, assuming strong blockchain adoption and sustained ecosystem growth.
What is the Sui Coin price prediction for 2050?
By 2050, SUI could potentially reach $30–$150+ if the network becomes widely used across finance, gaming, and Web3 infrastructure.
Where to buy Sui Crypto (SUI)?
You can buy SUI on major crypto exchanges like Binance, Coinbase, KuCoin, and OKX. Simply create an account, deposit funds, and trade for SUI.
Can SUI reach its all-time high again?
Yes, if SUI breaks above key resistance near $3 and market conditions stay favorable, a retest of its $5.35 ATH is possible.
Is SUI a good long-term investment?
SUI shows long-term potential due to its scalable Layer-1 design, growing DeFi adoption, and increasing developer and institutional interest.
What factors are driving SUI’s price growth?
Key drivers include rising TVL above $1B, strong on-chain activity, ecosystem expansion, and SUI’s reputation as a fast, scalable network.
The live price of the Monero crypto is $ 359.68511739.
Monero price made a strong move before but on a decline to a possible $130 low by 2026-end.
The XMR price, with a potential surge, could hit $5,828.30 by 2030
Envision the capability to conduct online payments without a digital footprint; that’s payment privacy. Numerous cryptocurrency assets possess a distinct selling proposition (USP), some safeguard transaction details concerning the parties or institutions involved, but some do not.
But, this transparency enables larger investors and institutional capital to be easily traced. While unshielded transactions are valued by researchers for the accessible information they provide regarding investments, individuals whose data is subject to scrutiny often experience frustration, as they perceive a loss of privacy over their own financial assets.
This is where Monero (XMR) comes in. Since its inception in 2014, Monero has offered robust privacy features. It has become the top choice for users seeking to maintain a high standard of anonymity in blockchain transactions. The impact of Monero’s privacy capabilities was particularly evident in the fourth quarter of 2025.
Despite the government’s tightening of the rules around digital assets, Monero has ranked 21st globally. Driven by rising interest, XMR stands out as a privacy-focused coin. So, what’s coming next for Monero in 2026 and the years to come? In this Monero price prediction 2026-2030 article, we look at the potential price targets.
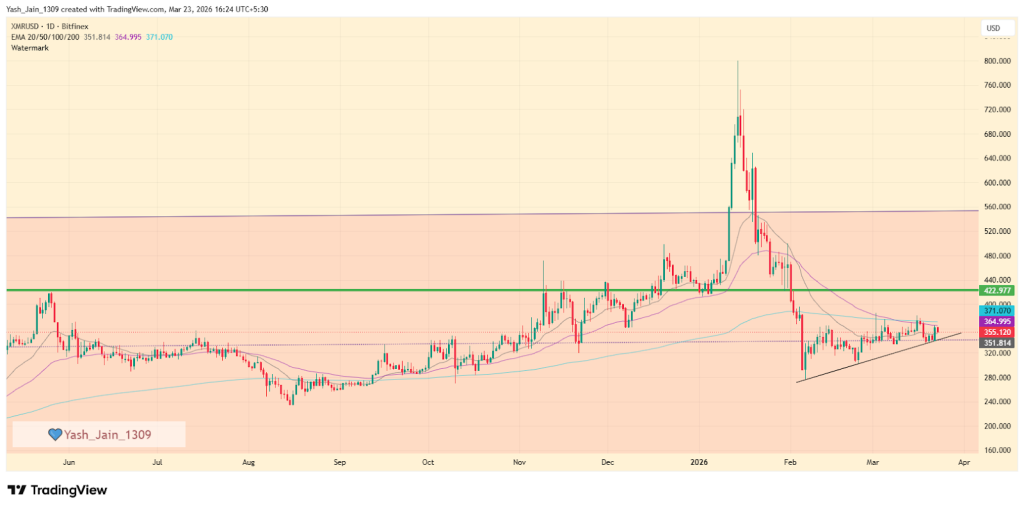
Monero (XMR) surged in Q4 2025, reaching $800 in 2026 before dropping to around $285, indicating bearish dominance. If demand increases, it could revisit $422, but failure to break this level may lead to a decline toward $200 or even $130 by year-end. Currently, XMR is retreating from the upper boundary of its ascending channel and has reached mid-way already, suggesting a correction may be imminent if more ground is lost.
Monero (XMR) Price March 2026 Outlook
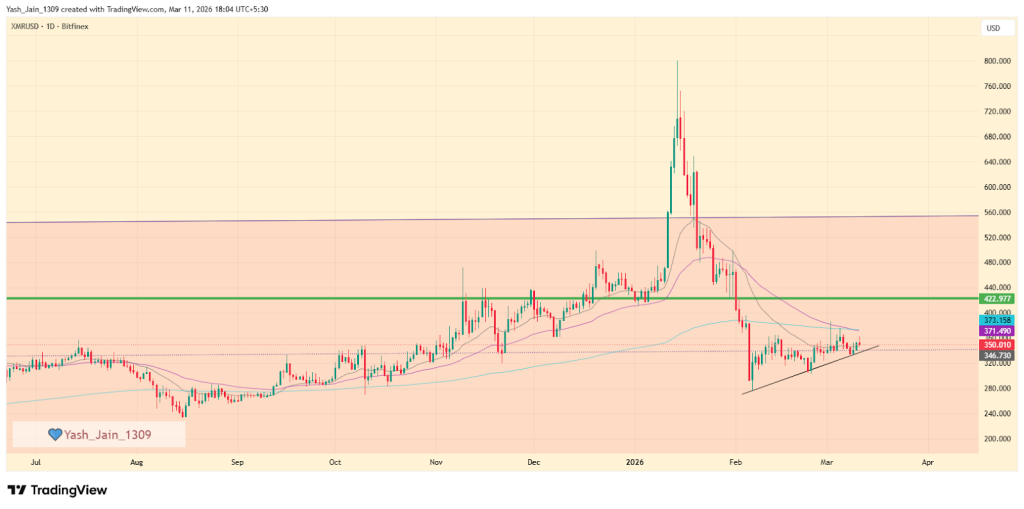
The daily price chart for Monero (XMR) presents a downward trend in the market, accompanied by notable price fluctuations. After experiencing challenges in maintaining stability above $422 in January, XMR crypto saw a significant decline, falling below $370 in February. Nonetheless, there was a brief recovery during the same month, indicating resilience, even as the price encounters resistance near the 200-day EMA and around the $370 threshold.
As we continue progressing in March, the XMR/USD pair has worked to establish a short-term support trendline. Should this level be breached, it may lead to a rapid decline, potentially dropping below $300. Conversely, if this support holds, there remains a hopeful possibility for a retest of the $422 mark by the end of March.
Recent News and Opinions
Per the late February 2026 post from ProbeLab, they show that findings confirm the Monero network’s resilience against surveillance. Analysis reveals that 46% of community nodes have proactively adopted a “ban list,” effectively neutralizing nearly all identified spy nodes. This grassroots defense highlights a robust, decentralized commitment to privacy, strengthening the network’s topology against potential deanonymization attempts.
Monero (XMR) Price Prediction 2026
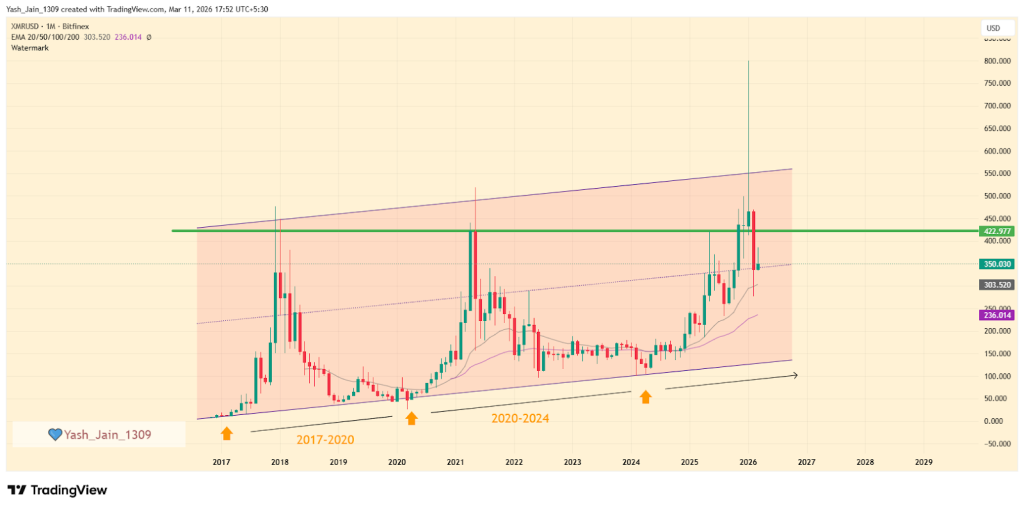
The price action of Monero (XMR) showed remarkable bullish momentum, particularly in Q4 2025, driven by a broader trend in privacy coins, which resulted in a significant price surge during that period.
In 2026, Monero followed the same privacy narrative, continuing the rally and pushing the price to new all-time highs (ATH) of $800. However, this increase was short-lived, as the price dropped to around $285 in February, losing more than 60% from its peak. Additionally, the mid-trendline of an ascending channel was breached, confirming a bearish dominance in the market at that time.
But, the remaining days of Q1 2026 showed some improvements that pushed it back above mid-trendline support, and now we see consolidation going on.
Now, if demand for XMR price increases, it could potentially revisit the $422 mark. It’s important to note that a recovery to this level might not inspire much excitement, as it could form a significant trap for investors. To regain a bullish setup, a weekly close above $422 would be crucial for attracting investor interest.
Conversely, if the price fails to break through $422 or even collapses below mid-trendline support again, then the first half of 2026 could see a drop towards $200 area, which could accelerate to $130 by year’s end to touch the lower border of the ascending channels as a support, like in the past.
Furthermore, it’s essential to recognize that the price has reached the upper boundary of its ascending parallel channel. As with previous patterns, a correction appears to be imminent. When it pierced the upper boundary, it had two choices: break away from the earlier pattern and establish new price action, but it briefly exceeded the channel before falling back within it, echoing historical trends. Ultimately, it returned to the pattern, continuing its legacy from the past.
Monero Crypto Price Prediction 2026 – 2030
Year
Potential Low ($)
Potential Average ($)
Potential High ($)
2027
$910.00
$1000.00
$1200.00
2028
$863.46
$1,726.90
$2,590.35
2029
$1,295.19
$2,590.35
$3,885.53
2030
$1,942.76
$3,885.53
$5,828.30
Monero Price Forecast 2027
Looking forward to 2027, XMR’s price is expected to reach a low of $910, with a high of $1,200 and an average forecast price of $1,000.
XMR Price Prediction 2028
In 2028, the price of a single Monero is anticipated to reach a minimum of $863.46, with a maximum of $2,590.35 and an average price of $1,726.90.
Monero Price Prediction 2029
By 2029, XMR’s price is predicted to reach a minimum of $1,295.19, with the potential to hit a maximum of $3,885.53 and an average of $2,590.35.
Monero (XMR) Price Prediction 2030
In 2030, Monero is predicted to touch its lowest price at $1,942.76, hitting a high of $5,828.30 and an average price of $3,885.53.
The long-term projection assumes Monero sustains relevance in enterprise blockchain use cases, with growth moderating over time as the asset matures.
Year
Potential Low ($)
Potential Average ($)
Potential High ($)
2031
3800
5200
6800
2032
5500
7500
9500
2033
7700
10000
11500
2040
15000
22000
42000
2050
30000
40000
60000
Monero (XMR) Price Prediction: Market Analysis?
Year
2026
2027
2030
Changelly
$720
$900
$1900
CoinCodex
$680
$880
$1800
WalletInvestor
$740
$870
$2000
Never Miss a Beat in the Crypto World!
Stay ahead with breaking news, expert analysis, and real-time updates on the latest trends in Bitcoin, altcoins, DeFi, NFTs, and more.
FAQs
What is Monero (XMR) price prediction for 2026?
Monero could revisit the $422 level if buying demand strengthens. However, if bearish pressure continues, the price may fall toward $200 or even $130 during 2026.
How much will Monero be worth in 2030?
Projections indicate Monero could trade between about $1,942 and $5,828 by 2030, with an estimated average price around $3,885 if adoption continues growing.
How high can Monero price go by 2040?
Long-term projections vary widely, but some estimates place Monero between $2,000 and $5,000 by 2040, depending on adoption and regulation.
What factors influence the price of Monero?
Monero’s price is driven by privacy demand, regulatory developments, network adoption, market sentiment, and overall crypto market trends.
Will Monero be the next Bitcoin?
Monero serves a different role than Bitcoin. Bitcoin focuses on transparency, while Monero prioritizes privacy, making it a niche but valuable crypto asset.
The live price of the TAO token is $ 267.98639735.
Bittensor (TAO) could show a reversal to $500 be H1 2026.
TAO’s long-term outlook targets $1,000–$3,000 by 2030
Bittensor is an open-source protocol that establishes a decentralized, blockchain-based marketplace for machine intelligence. It operates through a network of specialized “subnets,” where participants collaborate to train, share, and evaluate AI models in a peer-to-peer environment. Unlike centralized AI providers, Bittensor employs a unique consensus mechanism known as Yuma Consensus, which rewards the most valuable contributions.
The native token, TAO, is essential to this ecosystem; it is used for staking to secure the network, granting access to AI services, and rewarding miners who provide computational power. By incentivizing the production of high-quality intelligence rather than merely relying on hardware uptime, Bittensor transforms AI into a tradable digital commodity. As the demand for permissionless, scalable AI infrastructure increases, investors remain intrigued by TAO’s Bitcoin-like scarcity and its potential to democratize the future of machine learning.
Now, investors and traders are curious about what the future holds for TAO. To learn more, read this Bittensor (TAO) price prediction 2026-2030.
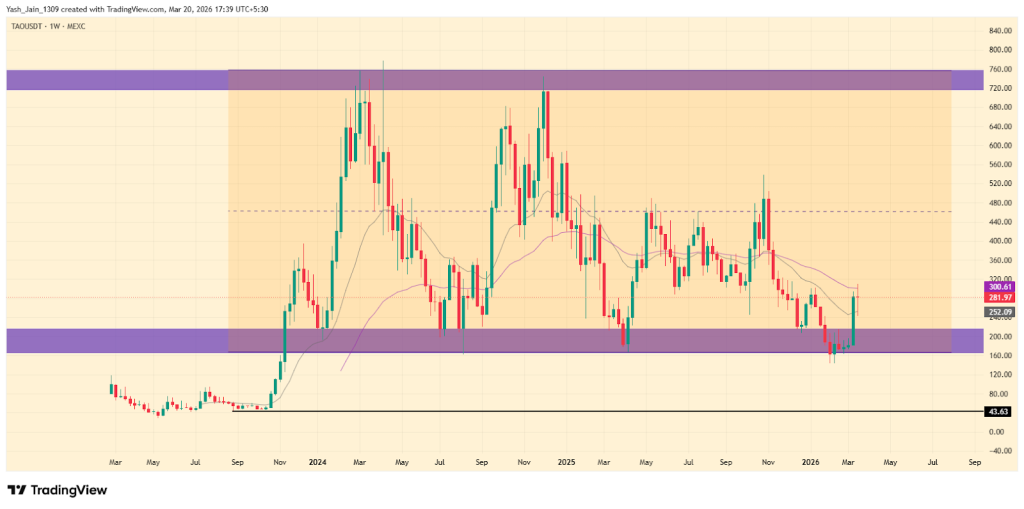
The weekly chart for Bittensor (TAO/USDT) indicates a trading range with support at $160–$200 and resistance around $720–$760. After reaching an all-time high of $760 in early 2024, prices have fluctuated, with 2025 showing weakness under $500. By early 2026, the price held the $160–$200 support, indicating institutional interest returning now. A recent bullish move suggests that if momentum continues, it could lead to a retest of the $500 level by the end of the first half of 2026, which would signal the end of the corrective phase.
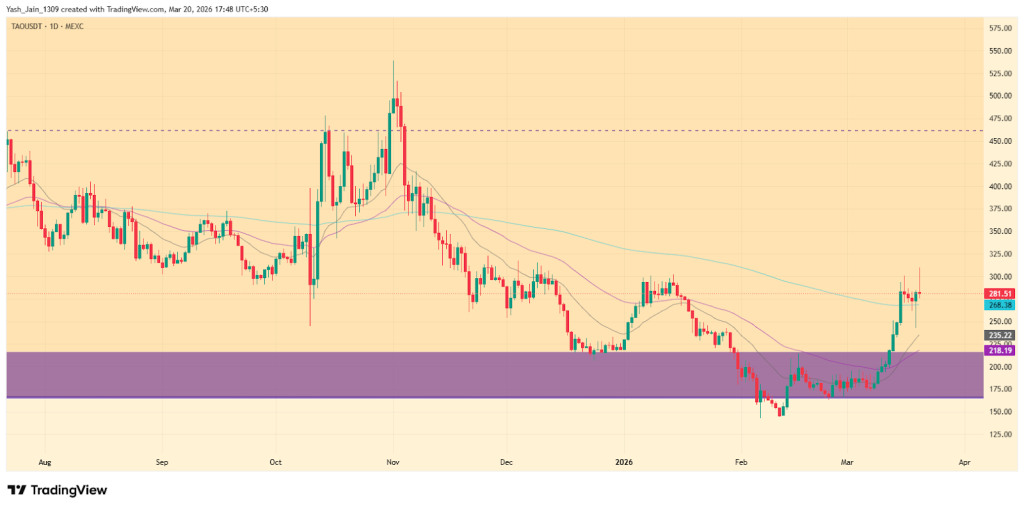
Bittensor (TAO) Price March 2026 Outlook
The Bittensor (TAO) price is currently sustaining above the 200-day EMA band, as March followed a price spike after February, which took liquidity by briefly dipping below $150.Now, if momentum continues in the remaining days of March, a spike towards $360 could be extended, but if consolidation continues, reaching $360 may be postponed to April.
Recent News/Opinions
On March 16th, Grayscale posted about its Bittensor Trust for private placement, offering eligible accredited investors direct exposure to the TAO ecosystem. This move underscores growing institutional interest in decentralized AI, as Grayscale highlights the protocol’s role in leveraging economic incentives for open-source development.
Bittensor (TAO) Price Prediction 2026
The weekly chart for Bittensor (TAO/USDT) reveals a well-defined long-term range that has governed price action since the network’s explosive growth in 2024. This structural parallel channel is anchored by a significant accumulation floor near $160–$200 and a formidable overhead supply ceiling around $720–$760.
In Early 2024, TAO reached its All-Time High (ATH) of approximately $760. Despite a volatile year, the price repeatedly cycled between the channel’s borders, demonstrating high demand at the lower bounds and aggressive profit-taking at the upper extremes.
But throughout 2025, market momentum shifted into a lower-intensity regime. The price largely remained capped under the $500 psychological barrier. A brief Q4 2025 rally attempted to reclaim the upper range but was rejected at $535, leading to a sharp retracement back to the primary demand zone by early 2026.
As of March 2026, the price has successfully defended the $160–$200 support zone for the third time in two years. This “triple-bottom” characteristic suggests strong institutional interest at these valuations.
The current weekly candle shows a significant bullish impulse. If the TAO price can maintain this momentum and breach local resistance levels during the first half of 2026, the technical path clears for a retest of the $500 supply area. A sustained close above the mid-range would signal that the corrective phase of 2025 is over, potentially shifting the narrative back toward the upper triple-digit regions.
Bittensor Crypto Price Prediction 2026 – 2030
Year
Potential Low ($)
Potential Average ($
Potential High ($)
2027
400
720
1000
2028
600
820
1200
2029
800
1150
2000
2030
1000
1800
3000
Bittensor (TAO) Price Prediction 2027
As per the Bittensor Price Prediction 2027, Bittensor may see a potential low price of $400. The potential high for Bittensor price in 2027 is estimated to reach $1000.
TAO Price Prediction 2028
In 2028, Bittensor price is forecasted to potentially reach a low price of $600 and a high price of $1200.
Bittensor Price Forecast 2029
Thereafter, the Bittensor (Bittensor) price for the year 2029 could range between $800 and $2000.
Bittensor (TAO) Price Prediction 2030
Finally, in 2030, the price of Bittensor is predicted to remain steadily positive. It may trade between $1000 and $3000.
The long-term projection assumes Bittensor sustains relevance in enterprise blockchain use cases, with growth moderating over time as the asset matures.
Expanding exchange-ecosystem demand could lift BNB price toward $2000 by the end of this year.
Long-term network usage growth may extend BNB price toward $10,000.
Binance Coin (BNB) suggests a fundamental shift in how the asset responds to broader market dynamics. In 2026, the token’s performance increasingly reflects on-chain utility and ecosystem liquidity rather than mere speculative volatility. This transition from reactive price swings to a more structured price action indicates a maturing market environment.
As the ecosystem stabilizes, the technical narrative centers on long-term accumulation and the absorption of supply within established demand zones. Sustained network activity across the Binance Smart Chain provides a foundational backdrop for this consolidation, potentially setting the stage for a period of extended price discovery. By focusing on fundamental network health and institutional integration, the outlook for the next several years leans toward organic growth and structural resilience within the global digital asset landscape.
So, what’s next for the BNB price in the rest of 2026 and beyond? What can be the future price movements? Let’s get into the Binance Coin (BNB) Price Prediction 2026–2030.
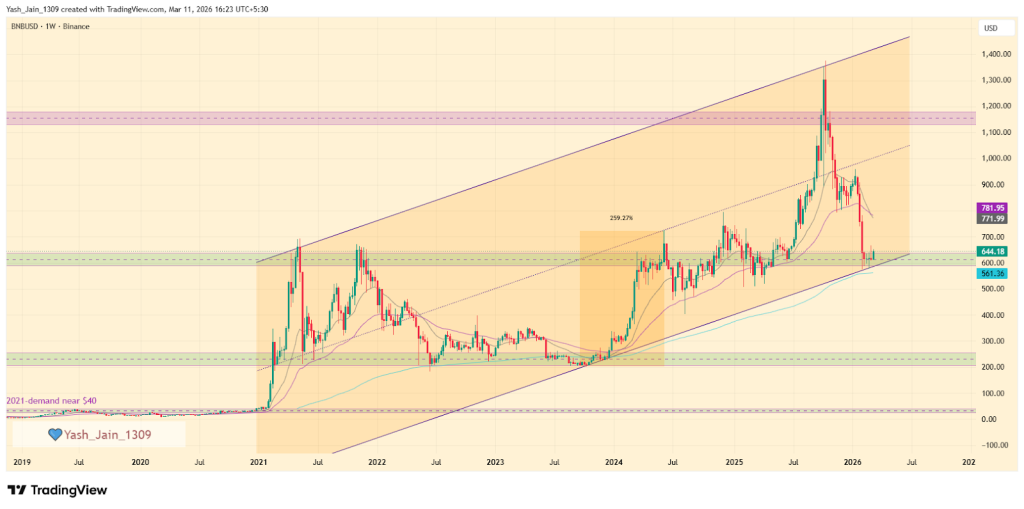
The BNB/USD chart reveals a long-term ascending channel that is currently testing a crucial support level at $600 in Q1 2026, suggesting a potential accumulation phase. For 2026, a recovery towards $1,000 is anticipated, with the price possibly reaching the median of the channel by Q3. However, if the price remains below $600, the risk of a more significant drop to $200 increases.
Binance Coin (BNB) Price Prediction March 2026
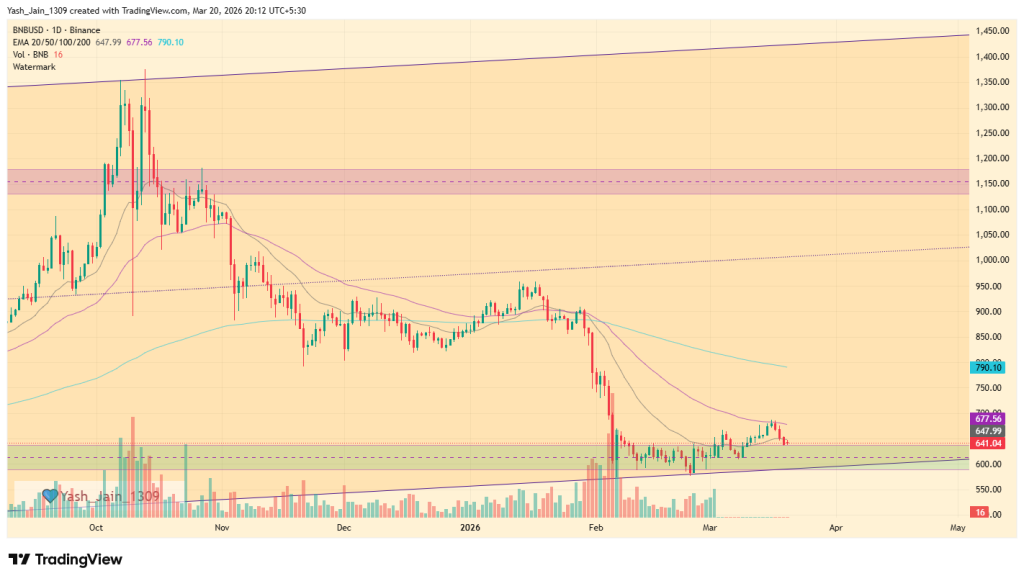
In Q3 2025, we saw a 125% rally from the $600 support level to $1,375. However, by Q4 2025 and Q1 2026, the price returned to the $600 demand area, completely wiping out those gains. Since February, there has been visible accumulation on the daily chart around this $600 demand area, indicating that it could serve as a strong support level where bullish momentum might resume.
Despite the broader market pessimism, the consolidation continued throughout March, demonstrating resilience as the price remained above the $600 mark without further declines. In March of Q1 2026, long-term accumulation may persist, and short-term reactions could turn bullish, as early March indicators already suggest. If bullish pressure increases, we could see BNB price retest the $750 level by the end of March, but if short-term reactions stay muted, then further consolidation could continue throughout March.
Recent News/ Opinions
A recent ruling news on March 7th came from the US federal court that it has positively dismissed all anti-terrorism claims against Binance, alleviating a significant legal burden. In the Southern District of New York, a judge concluded that the plaintiffs, comprising 535 individuals citing 64 attacks from 2017 to 2024, did not establish sufficient evidence to demonstrate that Binance had assisted or conspired with terrorist organizations. This decision marks a commendable step forward for Binance, affirming its commitment to compliance and integrity.
Binance Coin (BNB) Price Prediction 2026
Based on the technical structure of the BNB/USD weekly chart, the price action reflects a long-term ascending channel (or wedge) that has defined the asset’s trajectory since the massive demand surge from the $40 level in early 2021. This multi-year uptrend culminated in a new all-time high of approximately $1,375 in late 2025, validating the token’s utility and its position within the Binance ecosystem. Currently, the market is witnessing a convergence of horizontal price levels with channel’s dynamic trendline support, which reinforces the technical significance of the current price zone.
As of Q1 2026, BNB price is testing a critical turning support zone around the $600 horizontal support, which aligns precisely with the lower boundary of the primary ascending channel. This area is currently serving as a consolidation floor, suggesting a period of institutional accumulation. Historical precedent highlights the importance of this trendline; a similar touchpoint in late 2023 at the $200 range served as the launchpad for a massive rally, though it took roughly 238 days to reach the channel’s median line.
Looking ahead through 2026, the primary bullish thesis anticipates a recovery toward the $1,000 psychological level. If the recovery pace mirrors previous cycles, BNB/USD could reach the channel’s middle band by Q3 2026. However, if consolidation extends further into the year, the recovery might be more gradual, stretching toward the year-end.
Conversely, a decisive break below the $600 footing would invalidate the current setup, significantly increasing the probability of a deeper correction toward the major $200 demand zone.
BNB Onchain Analysis
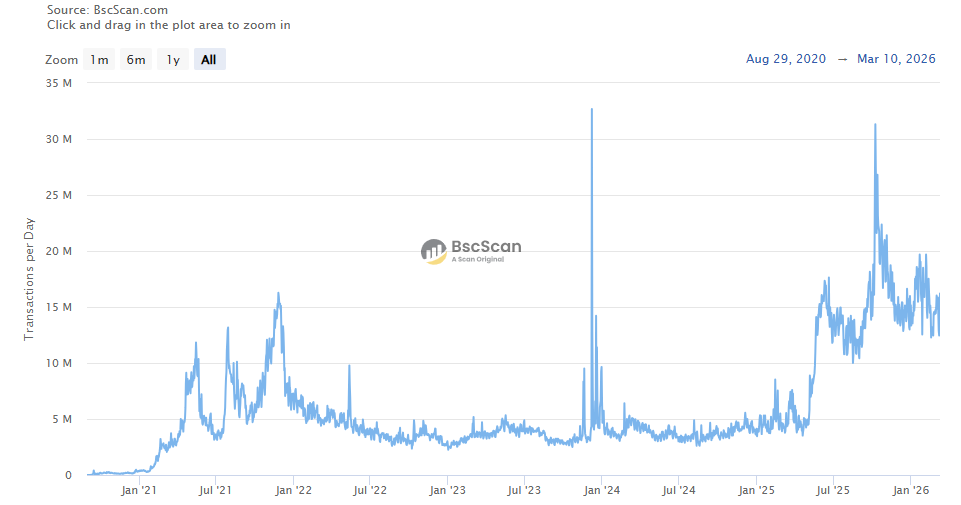
Recent on-chain data highlights the network’s resilience, with daily transactions stabilizing at 15 million in Q1 2026 despite market fluctuations. This sustained utility, paired with total unique addresses nearing the 800 million mark, signals a consistent rise in global adoption. These fundamental metrics suggest a robust foundation for long-term ecosystem growth and structural asset valuation.
Binance Coin Crypto Price Prediction 2026 – 2030
Year
Potential Low ($)
Potential Average ($
Potential High ($)
2027
1200
1420
1800
2028
1600
1950
2300
2029
2100
3250
3900
2030
2500
3800
4500
Binance Coin Price Prediction 2027
As per the Binance Coin Price Prediction 2027, Binance Coin may see a potential low price of $1200. The potential high for Binance Coin price in 2027 is estimated to reach $1800.
BNB Price Prediction 2028
In 2028, Binance Coin price is forecasted to potentially reach a low price of $1600 and a high price of $2300.
Binance Coin Price Prediction 2029
Thereafter, the Binance Coin (Binance Coin) price for the year 2029 could range between $2100 and $3900.
Binance (BNB) Coin Price Prediction 2030
Finally, in 2030, the price of Binance Coin is predicted to remain steadily positive. It may trade between $2500 and $4500.
The long-term projection assumes Binance Coin sustains relevance in enterprise blockchain use cases, with growth moderating over time as the asset matures.
Stay ahead with breaking news, expert analysis, and real-time updates on the latest trends in Bitcoin, altcoins, DeFi, NFTs, and more.
FAQs
What is the BNB price prediction for 2026?
BNB could recover toward $1,000 in 2026 if the $600 support holds and Binance ecosystem demand grows, supported by rising network usage and liquidity.
What will be the BNB price in 2030?
BNB could trade between $2,500 and $4,500 by 2030 if blockchain adoption grows and the Binance ecosystem maintains strong network activity.
How high can BNB price go by 2040?
Long-term projections suggest BNB could reach $13,000–$38,000 by 2040 if the network expands globally and maintains strong adoption across DeFi and Web3.
What factors influence Binance Coin’s price?
Price depends on exchange network usage, liquidity, adoption trends, historical support/resistance zones, and institutional participation.
Is Binance Coin (BNB) a good long-term investment?
BNB is often viewed as a strong long-term asset due to exchange utility, token burns, and ecosystem growth, though crypto investments always carry risk.
SHIB enters a key demand zone in 2026, with potential for breakout or gradual recovery if bulls hold support and market momentum strengthens.
Long-term outlook remains positive, with SHIB potentially reaching up to $0.000130 by 2030 as adoption, demand, and ecosystem growth improve.
Shiba Inu (SHIB) is a decentralized cryptocurrency operating within the Ethereum ecosystem and remains one of the most actively traded meme-based digital assets in the market. After experiencing extended price corrections over the past cycle, SHIB entered 2025 under sustained consolidation, with volatility gradually compressing near long-term support levels.
While recent price action has remained range-bound, technical structure suggests that SHIB may be approaching a multi-year inflection point. As compression continues and market participation rebuilds, attention now shifts to whether 2026 can initiate a new macro expansion phase for SHIB.
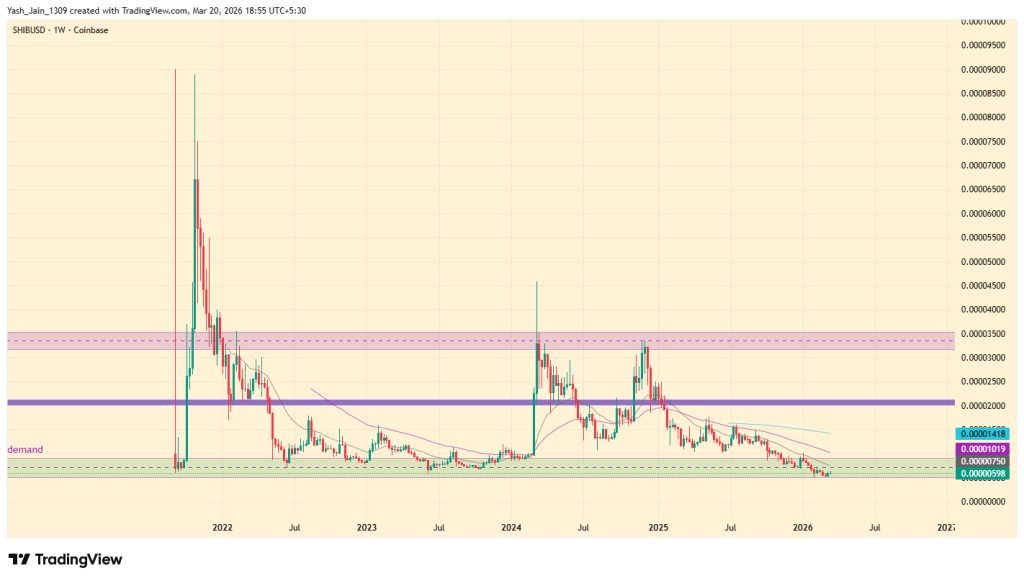
Shiba Inu (SHIB/USD) is entering a key demand zone as of Q1 2026, a signal that long-term holders may be positioning for the next market cycle.
Two potential outcomes are possible for 2026: a quick parabolic breakout to higher levels or a gradual recovery towards the $0.00001600 to $0.00001800 range. Maintaining the demand floor will be crucial for SHIB’s price action in the first half of 2026.
Shiba Inu (SHIB) Price Prediction March 2026
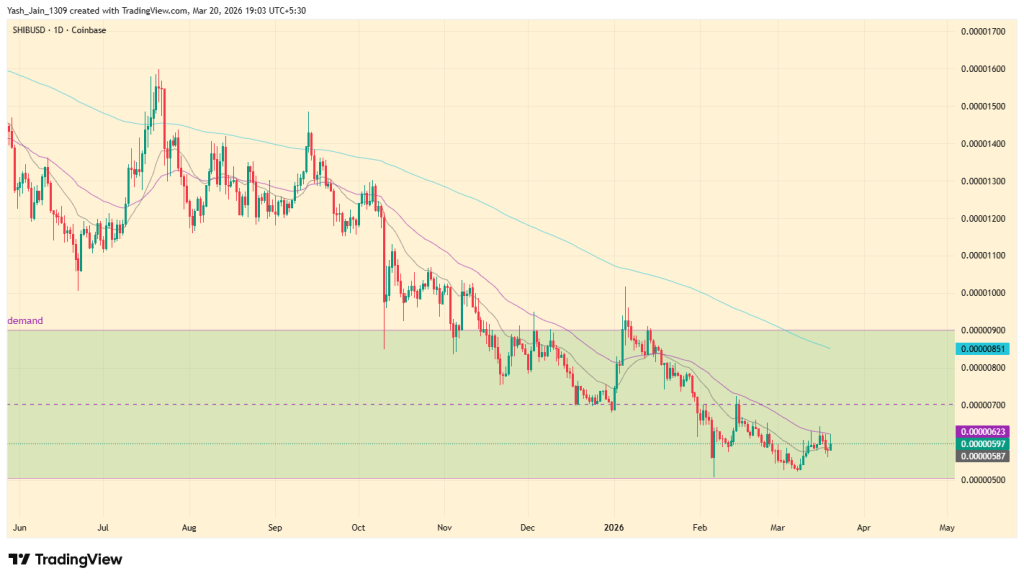
On the daily chart, the SHIB price is currently trapped within a consolidation box, built inside a multi year long-term accumulation range. Throughout most of the first quarter, the SHIB price fell to the lower end of this range at $0.0000050.
However, since mid-March, there has been a noticeable increase in bullish demand, suggesting that the middle of this accumulation range could be retested by the end of March at $0.0000070. If this bullish momentum does not continue, it could lead to a return to the support level of $0.0000050 within this range.
SHIB News / Opinions
Biconomy has announced a significant update for Shiba Inu enthusiasts, offering up to 380% APR in rewards through their $SHIB Earn Products. This promotion, launched on February 10, invites users to subscribe and maximize their holdings via these high-yield decentralized finance incentives.
Shiba Inu Price Prediction 2026
The weekly chart for Shiba Inu (SHIB/USD) shows the price descending into a historically significant and “spectacular” demand zone as of Q1 2026. This green-shaded accumulation area has acted as a powerful springboard in the past, most notably fueling the parabolic rallies of late 2021 and the aggressive surge in early 2024. The current price action suggests that SHIB is once again entering a phase of high-interest absorption, where long-term holders typically begin positioning for the next major market cycle.
While the symptoms of a potential 2026 breakout are building, history indicates two possible paths forward. A high-volatility spike could see SHIB rapidly reclaim higher resistance levels, mirroring its previous explosive moves. However, if a massive breakout does not materialize immediately, the asset is likely to follow a more measured, “gradual” recovery path. In this conservative scenario, the initial recovery targets would focus on reclaiming the 200-day EMA and establishing a foothold in the $0.00001600 to $0.00001800 range.
Regardless of the speed of the move, the primary narrative remains the defense of this multi-year demand floor. The ability of the bulls to hold this level throughout the first half of 2026 will be the deciding factor in whether SHIB undergoes a rapid repricing or a steady, trend-following climb toward its mid-term resistance clusters.
SHIB Crypto Price Prediction 2026 – 2030
Year
Estimated Low Price
Estimated High Price
Estimated Average Price
2027
$0.0000200
$0.0000300
$0.0000150
2028
$0.0000250
$0.0000500
$0.0000350
2029
$0.0000340
$0.0000790
$0.0000650
2030
$0.0000580
$0.0001300
$0.0000950
Shiba Inu Coin Price Price Prediction 2027
Shiba Inu (SHIB) price range can be between $0.0000200 to $0.0000300 during the year 2027.
Shiba Inu Memecoin Price Forecast 2028
In 2028, Shiba Inu is forecasted to potentially reach a low price of $0.0000250, and a high price of $0.0000500.
SHIB Coin Price Targets 2029
Thereafter, the SHIB price for the year 2029 could range between $0.0000340 and $0.0000790.
SHIB Coin Price Prediction 2030
Finally, in 2030, the price of SHIB is predicted to maintain a steady and positive. It may trade between $0.0000580 and $0.0001300.
Based on the historic market sentiments and trend analysis of the largest cryptocurrency by market capitalization, here are the possible SHIB price targets for the longer time frames.
Year
Potential Low ($)
Potential Average ($)
Potential High ($)
2031
0.000220
0.000340
0.000480
2032
0.000260
0.000400
0.000580
2033
0.000310
0.000500
0.000700
2040
0.000550
0.000850
0.001300
2050
0.000900
0.001500
0.002300
SHIB Price Prediction: Market Analysis?
Year
2026
2027
2030
Changelly
$0.000085
$0.000140
$0.000320
DigitalCoinPrice
$0.0000920
$0.000150
$0.000350
WalletInvestor
$0.0000340
$0.0000520
$0.0000980
Never Miss a Beat in the Crypto World!
Stay ahead with breaking news, expert analysis, and real-time updates on the latest trends in Bitcoin, altcoins, DeFi, NFTs, and more.
FAQs
What is the Shiba Inu (SHIB) price prediction for 2026?
SHIB price predictions for 2026 range between $0.0000200 and $0.000099, depending on whether the token confirms a long-term breakout.
What could drive SHIB price growth by 2030?
Growth could come from adoption, token burns, DeFi expansion, and a stronger crypto market pushing demand higher over time.
Will Shiba Inu reach $1 dollar by 2040?
Reaching $1 is highly unlikely due to SHIB’s large supply, requiring massive market cap growth far beyond realistic projections.
What will Shiba Inu be worth in 2050?
By 2050, SHIB could reach between $0.000900 and $0.002300 depending on long-term adoption, burns, and crypto market expansion.
What are the main factors influencing SHIB price growth?
SHIB’s price is driven by market sentiment, token burns, ecosystem development, overall crypto cycles, and broader risk appetite.
Is Shiba Inu a good investment for the long term?
SHIB may have long-term potential with ecosystem growth, but it remains volatile, so investors should carefully manage risk.

Chainlink pic.twitter.com/mzyPedfH6z