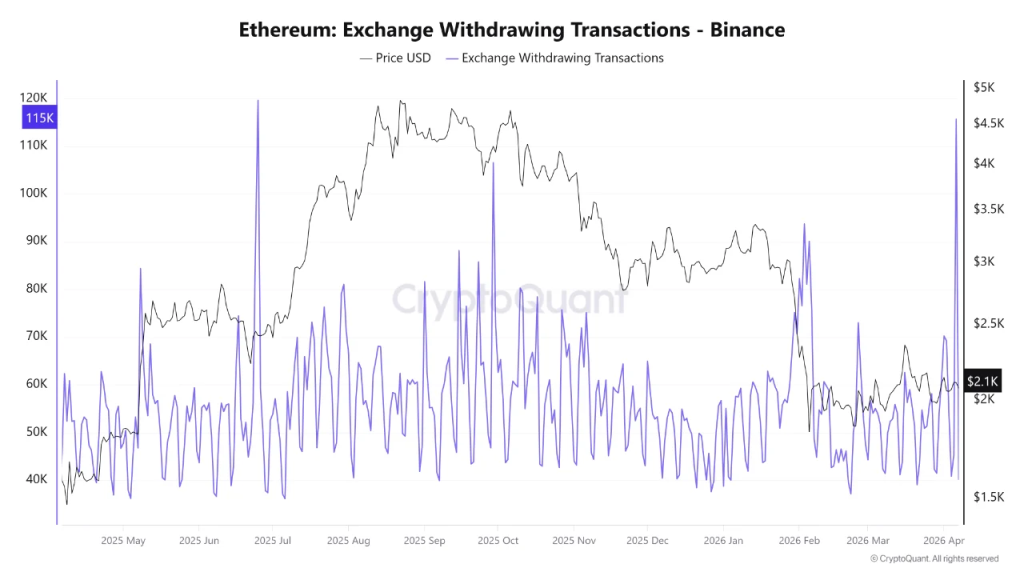
ETH price is looking sluggish on the surface while the underlying data quietly tells a very different story. On Binance, Ethereum withdrawal transactions just hit their highest level since 2025, clocking in at roughly 115,685 transactions in a single day. Sounds bullish, right? Well… yes and no. Because while the number of transactions exploded, the total amount withdrawn sat at around 352,000 ETH. Not exactly whale-sized.
Small investors drive massive ETH withdrawal spike
Here’s where it gets interesting. The analyst’s data shows a mismatch between a high transaction count and a relatively modest volume, which suggests one thing: this isn’t whales moving size. It’s retail.
Lots of them. Instead of a few massive withdrawals, what we’re seeing is a swarm of smaller transactions. Think distribution, not concentration. That usually points to individual investors pulling funds off exchanges as either for long-term holding or shifting into private wallets.
And historically, that kind of behavior leans bullish. Coins leaving exchanges reduce immediate sell pressure. Simple supply dynamics.
ETH price lags despite aggressive buying pressure
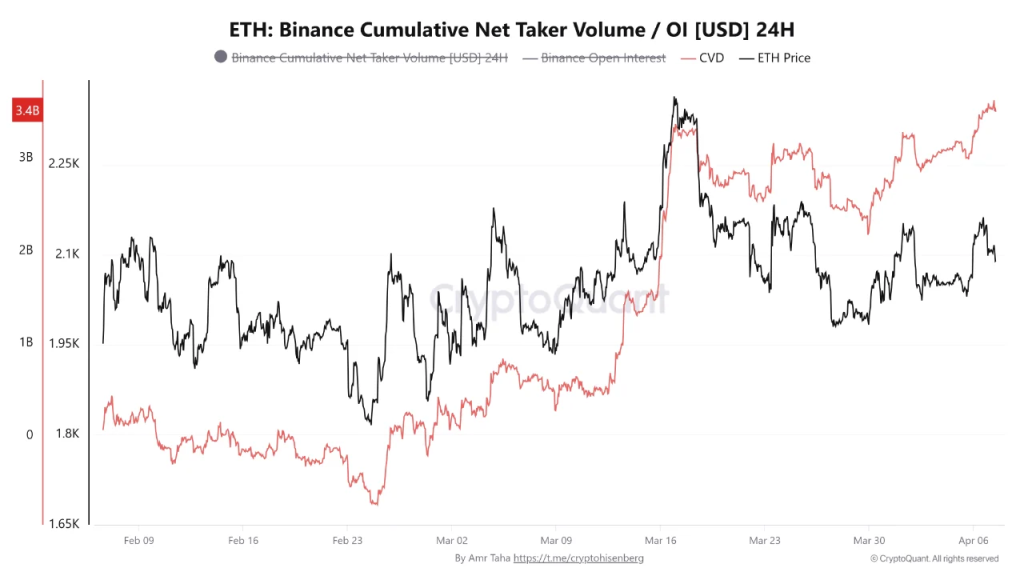
Because at the same time, another data shared by analyst point is quietly building a case for demand. Binance’s cumulative net taker volume has surged to around $3.4 billion.
That’s aggressive buying. Real buying. The kind where traders are hitting market orders, not just placing passive bids.
Yet ETH price? Still below its mid-March highs. Yeah, that’s the divergence.
Normally, this kind of sustained buying pressure would push price higher. But right now, it’s not translating. Which suggests something else is happening either steady sell-side absorption or just a market that’s moving slower than the flows beneath it.
Well, this kind of setup isn’t uncommon before larger moves. When you’ve got rising aggressive buying and increasing withdrawals (especially from smaller wallets), it often signals accumulation. Not the flashy kind. The quiet kind.
The kind that doesn’t show up in price immediately. Instead, it builds. Slowly. Until one day, price catches up and sometimes usually fast.
But let’s be real there’s no guarantee. Markets can stay disconnected from fundamentals longer than most traders can stay patient.
ETH price awaits confirmation from market breakout
So, ETH price is stuck in that awkward phase where the data looks supportive, but the chart hasn’t confirmed it yet. Withdrawals are rising. Buying pressure is strong. But price? Still hesitating.
If ETH starts reclaiming higher levels while this demand profile holds, it could signal that buyers have been in control all along.
Until then, it’s just potential energy. And in crypto, that can either explode upward or fizzle out completely.
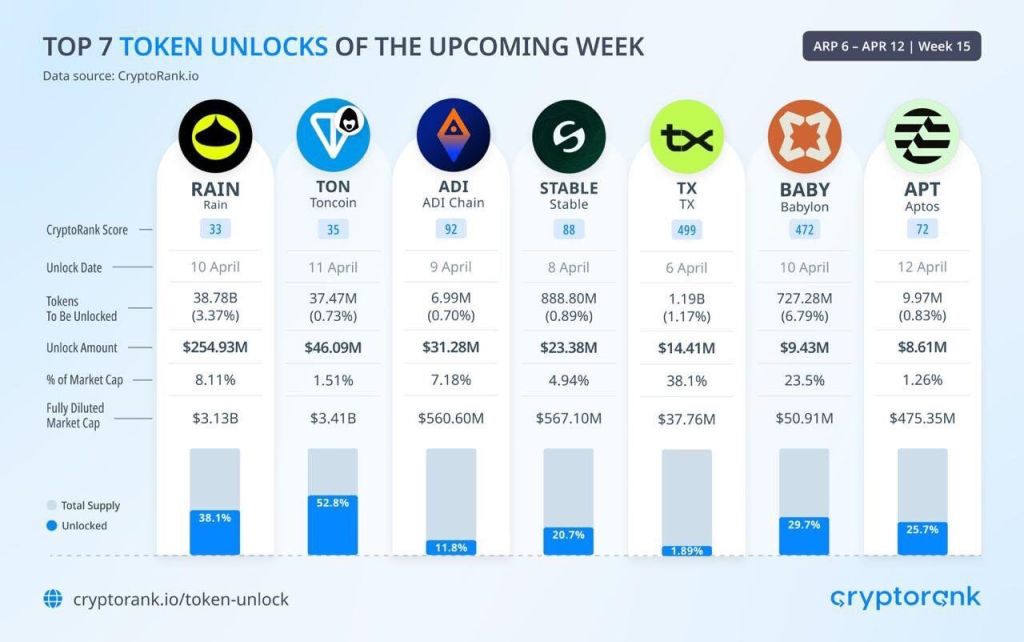
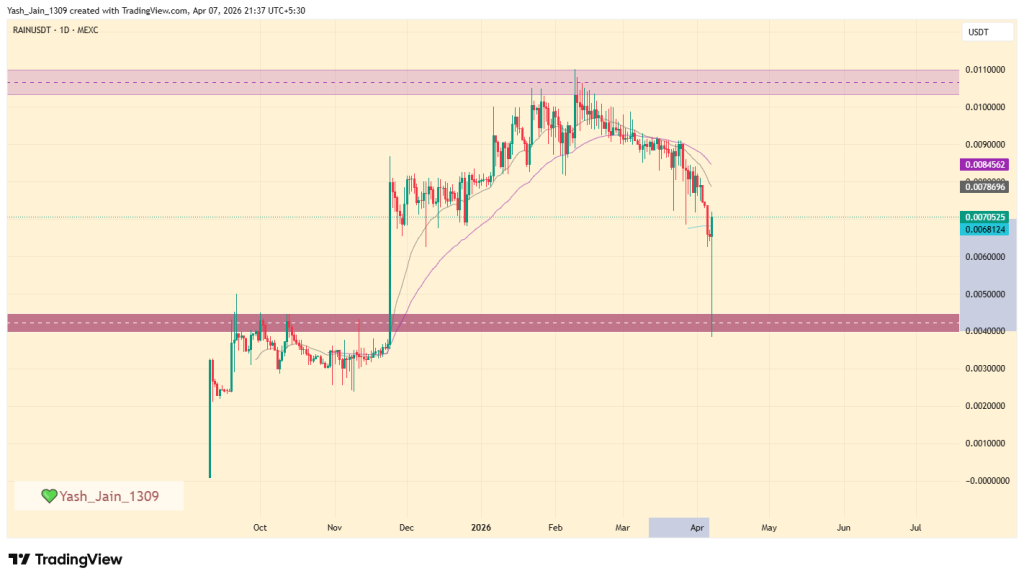
RAIN price leaves traders questioning everything, they saw. One moment it’s collapsing, the next it’s ripping higher like nothing ever happened. And yes, it’s all happening right before a major token unlock. Let’s not pretend that’s a coincidence and to go to deeper is the viable option.
Firstly, on April 10, nearly 38 billion RAIN tokens around are set to hit the market. That’s about 3.37% of the circulating supply being released in one go.
Naturally, traders didn’t wait around to see what happens next. The market started reacting early, with visible dumping as participants positioned ahead of the event. It’s the usual playbook anticipate supply, sell first, ask questions later.
And honestly, they might not be wrong. These kinds of concentrated unlocks often bring selling pressure, especially when early investors or insiders decide to cash out.
RAIN price crash turns into aggressive recovery
But here’s where things get messy. RAIN price didn’t just drop, it flushed hard. The token fell to $0.00400 in what looked like a full-blown breakdown. Stop losses? Obliterated.
Then, almost immediately, it reversed. Price climbed back to $0.0070, marking roughly a 75% rebound from the lows. A complete recovery, as if the dump never even happened.
Call it a liquidity hunt. Call it market manipulation. Either way, it did its job as weak hands got shaken out.
And somewhere in that chaos, someone bought the bottom. They’re sitting pretty right now.
Ecosystem growth fails to offset weak adoption signals
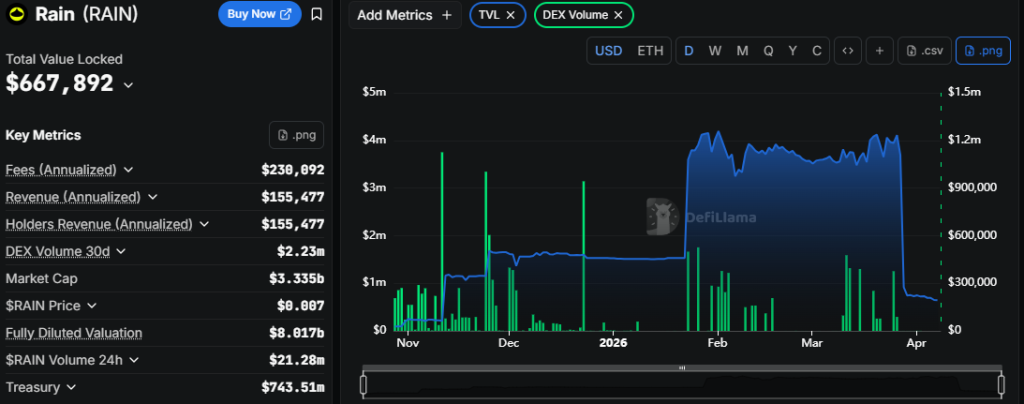
Now zoom out a bit, and the fundamentals tell a more complicated story. RAIN isn’t standing still. The project recently rolled out an SDK designed for AI agents and launched a $5 million grants program aimed at building prediction market platforms. There’s also a card program expected in Q2 2026.
Sounds solid, right? Well, here’s the catch as user adoption isn’t exactly keeping up. Total Value Locked (TVL) has been stagnant around $4 million for months and then dropped sharply to just $639,107 in April. That’s not a small dip that’s a sentiment killer.
So while development is moving forward, actual usage is… questionable.
Even market cap terms this action adds to the confusion. It dipped below $2 billion before bouncing back to $3.42 billion, suggesting buyers are still lurking but not exactly in control.
So what now? RAIN price is caught between two forces: incoming supply pressure from the token unlock and short-term bullish demand that just absorbed a brutal sell-off.
If history is any guide, volatility isn’t going anywhere. And with April 10 around the corner, the real move might not have even started yet.
TRUMP Coin price forecast for 2026 goes up to $14-42, on optimistic conditions.
Price predictions suggest potential highs of $212.25 by 2030.
The TRUMP coin, a Solana-based token strongly tied to Donald Trump, has had a volatile journey. It captured headlines with a viral campaign offering top holders a gala dinner with the U.S. President, which propelled its price to an astonishing high of $49. The subsequent plunge quickly flagged the token as a massive pump-and-dump.
Now, trading at severely discounted levels, the token is gaining renewed interest from investors looking for a potential turnaround, making it a potential future returnee on Google searches. Crucially, the coin lost a lot and barely retains a market cap and volume, signaling that a dedicated memecoin community is still trying hard to revive the president’s surname.
This ongoing activity suggests the possibility of a future trigger, perhaps a major political event or direct action from Trump that could reignite speculative demand. This analysis summarizes the key TRUMP coin price predictions from 2026 through 2030.
The TRUMP asset has seen declining interest, but recent efforts, like the new game launching on the App Store, are starting to make a difference. The “Trump Billionaire Game” is set to hit the Apple Store on May 5, 2026, and could help revitalize the asset this year after the struggles of 2025.
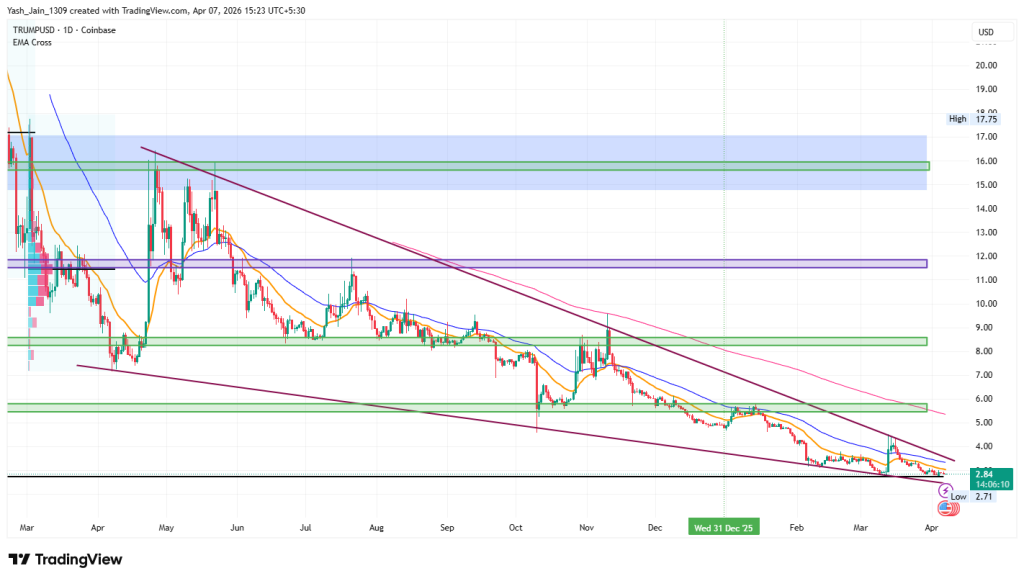
Moreover, the Q1 was stretched in a downtrend and further chaos through iran war as a lot of hate came for Trump, but April could show a spike and could possibly start a breakout in Q2 2026 from the upper boundary of a falling wedge pattern. If demand increases, we can expect a rebound to $6 in April. However, if demand doesn’t pick up, prices may drop further.
Trump Token Price Prediction 2026
In 2025, the TRUMP token did not appear to be a dead asset, particularly with the announcement of the “Trump Billionaire Game,” which added a utility aspect beyond its initial memecoin status. The launch is scheduled for May 5th, 2026, on the Apple Store.
However, the outlook for 2026 is complicated by the 2025 and Q1 2026 market performance, where bulls struggled significantly against robust bearish sentiment. This dynamic reflects the speculative and often volatile nature of TRUMP’s price movement throughout 2025, and that extended into Q1 2026.
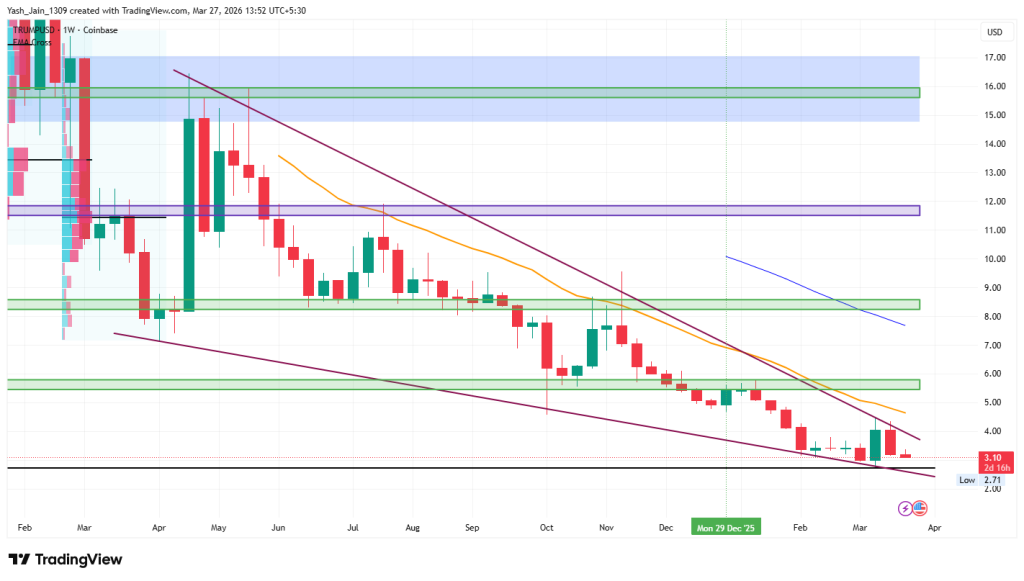
As we look forward to the possibilities 2026 may bring, particularly with Donald Trump’s ongoing influence in the political arena, the potential for adoption of his game is indeed compelling. On the price front, the weekly chart showcases an intriguing setup; we’ve recently seen a demand coming back, and March showed a spike with recent claims of the top holder of Trump to be invited for a dinner with Trump, which fueled short-term hype, but it wasn’t a big trigger of momentum.
The price pattern indicates a falling wedge, reflecting a tightly compressed trading range, much like a coiled spring ready to unleash its energy, making the pattern more interesting for the TRUMP price.
Given this technical formation, a rebound appears likely. If bullish momentum emerges in the Q2 2026, it will be crucial to monitor the $5.50 resistance level. A decisive breakout above this level could signal a significant rally, potentially advancing toward $8.50 as the uptrend unfolds and could extend to $16 if demand remains stable.
Year
Potential Low ($)
Potential Average ($)
Potential High ($)
2026
$3
$18
$26
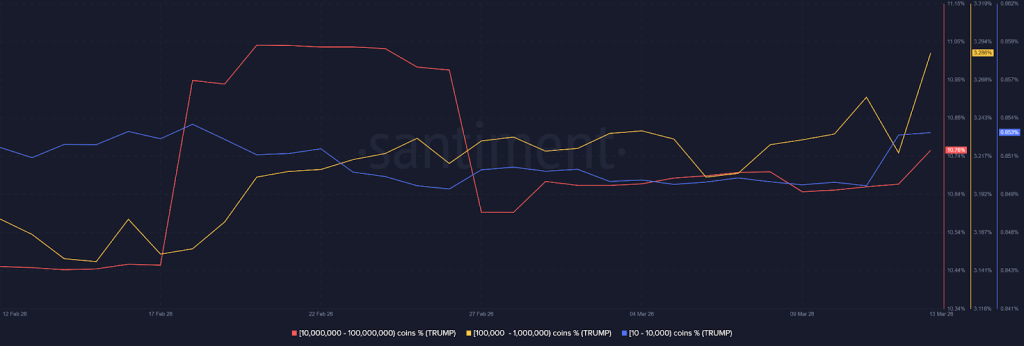
Trump Coin On-Chain Analysis
The Santiment data for the TRUMP token reveals a significant shift in holder dynamics through early March 2026. While mid-sized “shark” wallets (yellow) are aggressively accumulating, the largest whale tier (red) shows more cautious, fluctuating interest. This indicates retail-to-mid-tier conviction is currently driving the momentum over massive institutional-scale positioning.mem
Official TRUMP Coin Price Prediction 2026 – 2030
Year
Potential Low ($)
Potential Average ($)
Potential High ($)
2026
$5.00
$7.10
$11.20
2027
$6.05
$12.65
$18.90
2028
$8.20
$18.20
$27.50
2029
$12.40
$28.10
$44.80
2030
$18.10
$45.10
$69.90
Official Trump (TRUMP) Price Prediction 2026
By 2026, the value of a single OFFICIALTRUMP coin price could reach a maximum of $42.00, with a potential low of $14.00. With this, the average price could land at around the $28.00 mark.
TRUMP Coin Price Prediction 2027
Looking forward to 2027, the TRUMP coin Price may range between $21.00 and $42.00, and a potential average value of around $63.00.
TRUMP Token Price Prediction 2028
The Trump price could achieve the $94.25 milestone by the year 2028. However, the viral memecoin could record a low of $31.50 and an average price of $62.00 if the crypto market turns bearish.
TRUMP Coin Price Forecast 2029
During 2029, the TRUMP crypto could reach a maximum trading value of $141.50 with a potential low of around $88. Evaluating the market sentiments, the average price of this altcoin could settle at around $94.50.
Official Trump (TRUMP) Price Prediction 2030
The TRUMP memecoin crypto prediction for the year 2030 could range between $70.75 to $212.25. Considering the buying and selling pressure, the average price could be around $141.50 for that year.
What Does The Market Say?
Firm Name
2026
2030
Mudrex
$100
$600
Icobench
$150
$500
Binance
$14.63
$17.78
Never Miss a Beat in the Crypto World!
Stay ahead with breaking news, expert analysis, and real-time updates on the latest trends in Bitcoin, altcoins, DeFi, NFTs, and more.
FAQs
What is the TRUMP coin and how does it work?
TRUMP coin is a Solana-based memecoin tied to Donald Trump’s brand, driven by hype, community support, and speculative trading.
Is TRUMP coin a safe investment in 2026?
TRUMP coin is highly volatile and speculative. It may offer gains, but investors should assess risks and avoid relying only on hype.
What is the TRUMP coin price prediction for 2026?
In 2026, TRUMP coin may trade between $5 and $11.20, depending on demand, market sentiment, and political or social triggers.
What is the official Trump coin price prediction for 2030?
Official Trump coin could range between $18.10 and $69.90 by 2030, depending on market trends, demand, and overall crypto sentiment.
How high can Trump token go by 2040?
By 2040, TRUMP token could exceed $69.90 if long-term adoption, political relevance, and crypto market expansion continue to grow.
Price prediction for 2026 targets $0.85, with potential highs of $3.50.
The Pi coin price forecast for 2030 highlights a price target as high as of $22.00
Pi Network’s vision of mobile-based crypto mining attracted millions worldwide, making it a standout community-driven project. However, its lack of exchange listings, limited liquidity, and minimal real-world integration now challenge its sustainability.
As the broader crypto landscape shifts toward utility-based projects and DeFi innovation, Pi Coin struggles to maintain relevance. As a reason, the PI price faced a seamless fall. While social and Google search curiosity still remains high, especially with growing searches like “1 Pi to INR” and “1 Pi to PKR,” the absence of strong fundamentals keeps Pi price recovery uncertain.
This is leaving investors questioning whether this once-hyped token can ever reclaim its lost glory. As a result, the current period aligns perfectly with the current year’s calendar to change soon, making people intrigued towards the PI price prediction for 2026-2030.
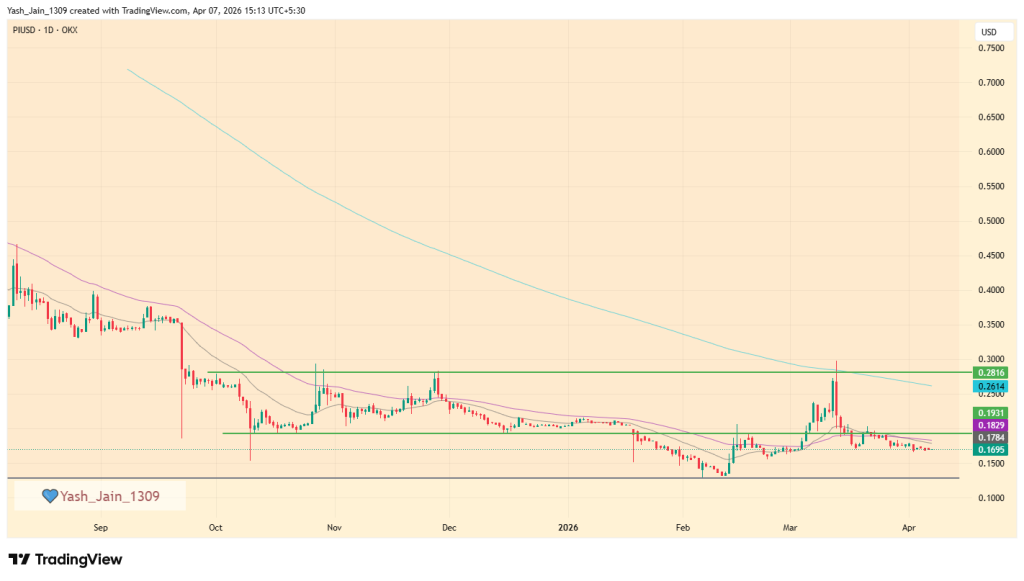
The daily chart for Pi Network (PI) shows the price has been struggling to maintain bullish momentum, remaining pinned below the $0.28 resistance since the fourth quarter of 2025. Throughout Q1 2026, the majority of the price action was contained above the $0.19 level, which acted as a primary pivot for the market. However, as Q2 begins in April, PI price has started sliding back below this threshold, indicating a weakening of buyer support and a potential shift toward a more bearish narrative.
Currently, the asset is at a critical technical juncture. If the downward pressure continues and PI breaks below the significant $0.125 support floor, it could trigger a capitulation move toward new lows. Conversely, if bulls can reclaim the previous range and reverse the current slide, April could witness a relief rally aimed at retesting the $0.28 resistance zone. Until a decisive breakout occurs above the 200-day EMA (currently near $0.26), the overall trend remains biased toward the downside or extended consolidation.
Pi Network Price Prediction 2026: Potential Scenarios for a Reversal
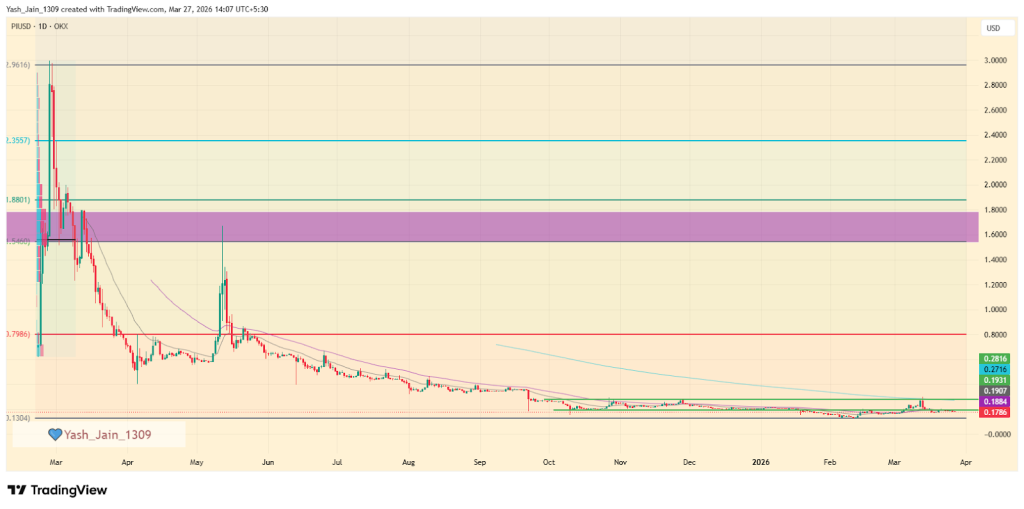
Pi’s price remained within its consolidation range of $0.19 to $0.28 during the fourth quarter of 2025. However, in January, it fell outside this range, hitting a new low of $0.1297.
This shift indicated a strong bearish momentum, with PI investors selling off their holdings as if there was no chance of recovery. Many investors and traders began to view it as a dead asset, comparing it unfavorably to memecoins.
Despite a short-term upward movement in February and March that pushed the PI price back above $0.28, the long-term price prediction for 2026 showed no significant improvement, with the price still following a dominant decline.
At this time, while the PI price was at its weakest long-term levels, the short-term rally still suggested a potential recovery. As this optimism was largely fueled by the announcement of a few ecosystem updates on X in early March, along with an exchange listing on Kraken, the surge saw the price retest $0.28 by mid-March. Hopes were high that the newly announced plans could revitalize the struggling ecosystem.
However, that point failed to materialize sustained demand; in fact, from mid-March onward, the price faced strong rejection at $0.28 and slipped below $0.19, approaching February’s low of $0.13. If bearish momentum continues, then new lows could be formed a new.
Despite the challenges posed by the bear market, which has suppressed momentum across the entire cryptocurrency sector, no altcoin has successfully staged the anticipated rally. Much of this stagnation can be attributed to a lack of liquidity, with new investors remaining cautious and many feeling apprehensive about the prevailing bearish sentiment.
Nonetheless, the outlook for 2026 remains somewhat optimistic for the sector if geopolitical conditions show signs of improvement. Also, If PI can generate sufficient demand, it may attract a few more drops of liquidity. Only if the broader market improve, the likelihood of a substantial rally could increase, but a crucial factor will be confidently breaking through the $0.28 resistance level.
Pi Coin Price Targets 2026 – 2030
Year
Potential Low ($)
Potential Average ($)
Potential High ($)
2026
$0.85
$2.25
$3.50
2027
$1.25
$3.25
$5.25
2028
$2.00
$5.50
$8.50
2029
$3.50
$8.50
$13.75
2030
$5.50
$13.75
$22.00
Pi Network Price Prediction 2026
The Pi crypto prediction for the year 2026 could range between $0.85 to $3.50. Considering the buying and selling pressure, the average price could be around $2.25 for that year.
Pi Coin Price Prediction 2027
During 2027, the Pi network value could reach a maximum trading value of $5.25 with a potential low of $1.25. Evaluating the market sentiments, the average price of this altcoin could settle at around $3.25.
Pi Token Price Projection 2028
By 2028, the value of a single Pi coin price could reach a maximum of $8.50 with a potential low of $2.00. With this, the average price could land at around the $5.50 mark.
Pi Network Price Analysis 2029
Looking forward to 2029, the Pi coin Price may range between $3.50 and $13.75, and a potential average value of around $8.50.
Pi Network Price Prediction 2030
As per our Pi Coin Price Prediction 2030, the Pi coin value in 2030 could reach a high of $22.00. However, the viral altcoin could record a low of $5.50 and an average price of $13.75, if the crypto market turns bearish.
Market Analysis
Firm Name
2025
2026
2030
CoinCodex
$ 2.08
$ 1.48
$ 2.63
priceprediction.net
$1.08
$1.61
$6.74
DigitalCoinPrice
$107.98
$125.57
$265.95
*The aforementioned targets are the average targets set by the respective firms.
Conclusion
The Pi Network’s recent developments—from major token accumulation and Banxa integration to Binance listing rumors—are clear indicators that Pi is no longer just a test project. As market conditions turn favorable and institutional interest grows, Pi Coin is entering a new phase of maturity.
Never Miss a Beat in the Crypto World!
Stay ahead with breaking news, expert analysis, and real-time updates on the latest trends in Bitcoin, altcoins, DeFi, NFTs, and more.
FAQs
What is Pi Coin prediction for 2026?
Pi Coin is expected to trade between $0.85 and $3.50 in 2026, with an average price of around $2.25 based on current market conditions.
What is the Pi Network price prediction for 2027?
Pi Coin could range between $1.25 and $5.25 in 2027, with an average value of approximately $3.25 if demand and adoption increase.
What will be the value of Pi in 2028?
In 2028, Pi Coin may trade between $2.00 and $8.50, with an average price near $5.50 as ecosystem growth improves.
How high can a Pi Coin go in 2030?
Pi Coin could reach a maximum price of $22.00 by 2030, with an average value of $13.75 under favorable market conditions.
What will be the value of 1 Pi Coin in 2040?
By 2040, Pi Coin could range between $15 and $50, depending on adoption, real-world utility, and overall crypto market growth.
The live price of the MANA crypto token is $ 0.08486501.
Price predictions for 2026 range from $0.247 – $0.40.
By 2030, the MANA price could surge toward $4.90 due to growing trader activity.
Decentraland (MANA) is one of the earliest and most recognizable names in the metaverse sector. Built on Ethereum, Decentraland allows users to own virtual land, create experiences, and participate in a digital space using its native token, MANA.
While the overall metaverse narrative has cooled since its 2021 peak, Decentraland continues to maintain an active ecosystem focused on virtual events, social experiences, and creator-led development.
If you’re curious about Decentraland’s future and wondering whether MANA is a good investment, this MANA price prediction 2026–2030 will walk you through its potential growth and long-term outlook.
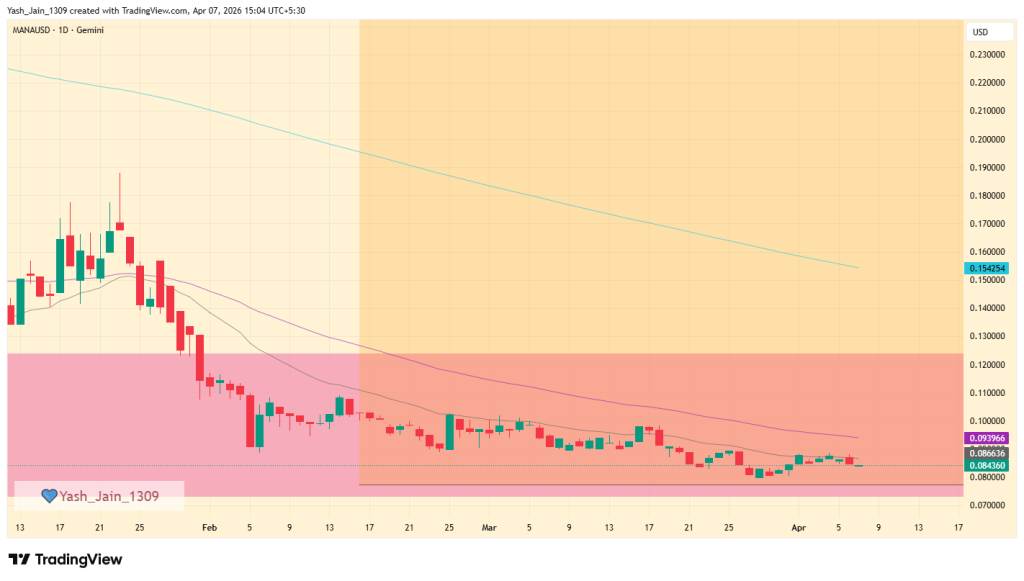
The MANA price has recently retraced to a significant multi-year demand zone in the first quarter 2026, demonstrating a consolidation phase on the price chart that indicates a potential exhaustion of long-standing selling pressure. As we entered the second quarter in April, this consolidation continues. However, should a favorable catalyst arise, we could see the price ascend toward the upper boundary of this demand zone at $0.125. Conversely, if such a catalyst does not materialize, we may experience an extension of this consolidation throughout April.
Decentraland (MANA) Price Prediction 2026
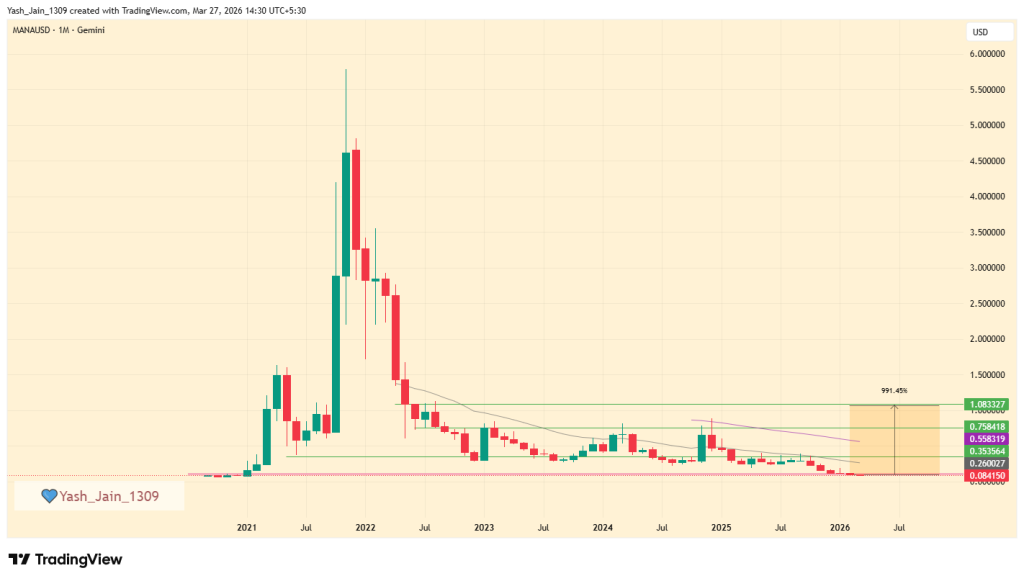
MANA crypto’s multi-year performance chart reflects a dramatic 98% decline since the FTX crash in 2022, leading many enthusiasts and investors to speculate about the project’s potential end.
This sharp price depreciation has instilled fear among investors, who have witnessed continuous negative price action for years. However, it is essential to consider the historical support level that has been in place since early 2021, which warrants attention despite the recent stagnation in price movement.
Although the project has experienced considerable setbacks over the past half-decade, there still remain arguments for a potential revival. The primary argument is the avoidance of delisting from several exchanges, indicating that MANA/USD continues to pursue efforts aimed at market recovery and still retains decent liquidity in a project with an over $250 million market cap.
Thus, the current retest of this support level is particularly noteworthy. A reversal at this juncture could result in substantial upward momentum. Conversely, if this support range is breached, it would likely reinforce perceptions of MANA crypto as a failing venture.
That said, it is crucial to closely monitor the $0.35 level. Should MANA successfully breach this level and maintain above it with a weekly close, this would signify a significant “Change of Character” for the price dynamic. Under such circumstances, a conservative target of $1.00 for the year may be warranted.
Price Prediction
Potential Low ($)
Average Price ($)
Potential High ($)
2026
0.95
1.45
1.95
MANA On-Chain Analysis
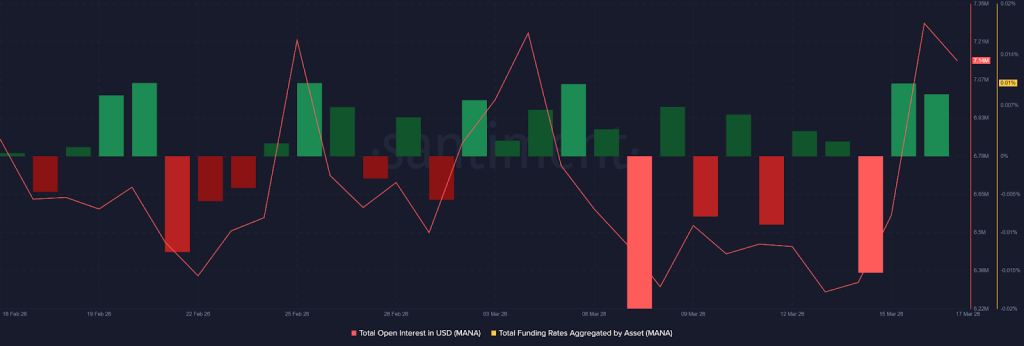
On-chain metrics for Decentraland (MANA) as of mid-March 2026, the asset is exhibiting a notable shift in market sentiment and trader behavior. Over the past 30 days, Open Interest (OI) has trended upward, peaking recently near the $7.14 million mark.
This climb in OI, coupled with funding rates that are stabilizing or turning positive (reaching approximately 0.01%), suggests that new capital is entering the market and traders are increasingly willing to pay a premium to hold long positions.
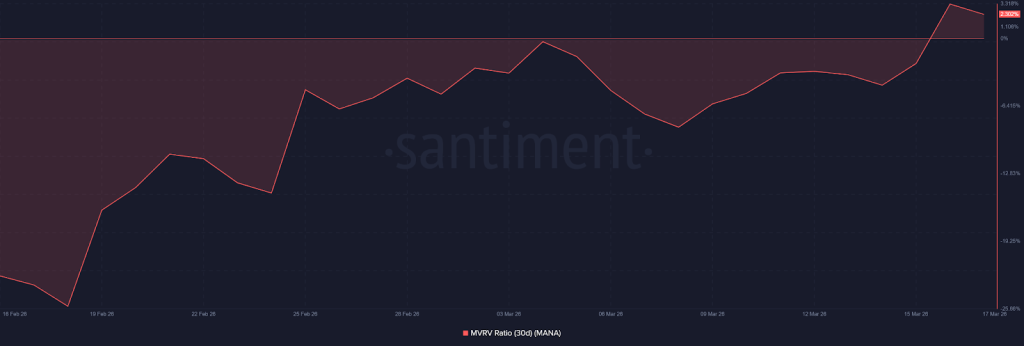
The profitability profile of short-term holders has also undergone a significant transformation. The 30-day MVRV Ratio has flipped above the zero line, currently sitting at approximately 2.39%. This transition into positive territory indicates that the average address that acquired MANA within the last month is now seeing “green” on their investment.
While this signals a return of bullish momentum, it also suggests that the asset has moved out of the “opportunity zone” and into a phase where some traders might begin to consider taking profits.
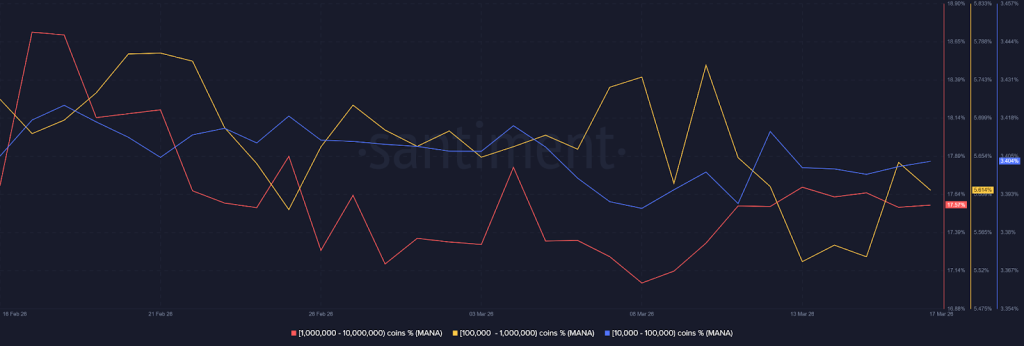
Furthermore, the supply distribution data reinforces this narrative of accumulation by larger stakeholders. Throughout March, addresses holding between 10,000 and 10 million MANA have seen a synchronized rise in their percentage of the total supply.
Specifically, the mid-tier “whale” and “shark” brackets (the 100k–1M and 1M–10M cohorts) have recovered from their late-February lows, signaling that significant players are positioning themselves for further upside. This collective accumulation by influential wallet tiers often serves as a foundational support for sustained price action.
Decentraland MANA Price Prediction 2026 – 2030
Price Prediction Years
Potential Low ($)
Average Price ($)
Potential High ($)
Decentraland (MANA) Price Forecast 2026
0.95
1.45
1.95
MANA Token Price Forecast 2027
1.55
2.15
2.85
Decentraland Price Analysis 2028
2.45
3.05
3.65
Decentraland Price Prediction 2029
3.55
3.95
4.35
MANA Price Prediction 2030
4.15
4.65
5.15
Decentraland (MANA) Price Forecast 2026
According to forecast prices and technical analysis, Decentraland’s price is projected to reach a minimum of $0.95 in 2026. The maximum price could hit $1.95, with an average trading price of around $1.45.
MANA Token Price Forecast 2027
Looking forward to 2027, MANA’s price is expected to reach a low of $1.55, with a high of $2.85 and an average forecast price of $2.15.
Decentraland Price Analysis 2028
In 2028, the price of a single Decentraland is anticipated to reach a minimum of $2.45, with a maximum of $3.65 and an average price of $3.05.
Decentraland Price Prediction 2029
By 2029, Decentraland’s price is predicted to reach a minimum of $3.55, with the potential to hit a maximum of $4.35 and an average of $3.95.
Decentraland (MANA) Price Prediction 2029
In 2030, the MANA coin price is predicted to touch its lowest price at $4.15, hitting a high of $5.15 and an average price of $4.65.
What Does The Market Say?
Year
2026
2027
2030
CoinCodex
$0.26
$0.39
$0.67
Tokenmetrics
$0.78
$1.41
$2.11
DigitalCoinPrice
$0.33
$0.61
$3.32
Never Miss a Beat in the Crypto World!
Stay ahead with breaking news, expert analysis, and real-time updates on the latest trends in Bitcoin, altcoins, DeFi, NFTs, and more.
FAQs
What is Decentraland (MANA) and how does it work?
Decentraland is a virtual world on Ethereum where users buy land, create experiences, and trade using the MANA token.
What is the predicted price of MANA in 2026?
MANA could trade between $0.247 and $0.40 in 2026, with potential upside if it maintains key support and adoption grows.
What is Decentraland’s price prediction for 2030?
By 2030, MANA could reach a high of $4.92, a low of $4.15, and an average price of $4.65, reflecting adoption and growing metaverse use.
How high could MANA price go in 2040?
Over the long term, MANA may see substantial growth if adoption and virtual land demand expand, potentially reaching a high of $12–$15 by 2040.
What drives the price of MANA?
MANA’s price is influenced by virtual land demand, user growth, creator tools, and on-chain activity in Decentraland.
Can Decentraland compete with other metaverse projects?
Yes, if Decentraland expands events, gaming, and creator tools, it could attract more users and remain a top metaverse platform.
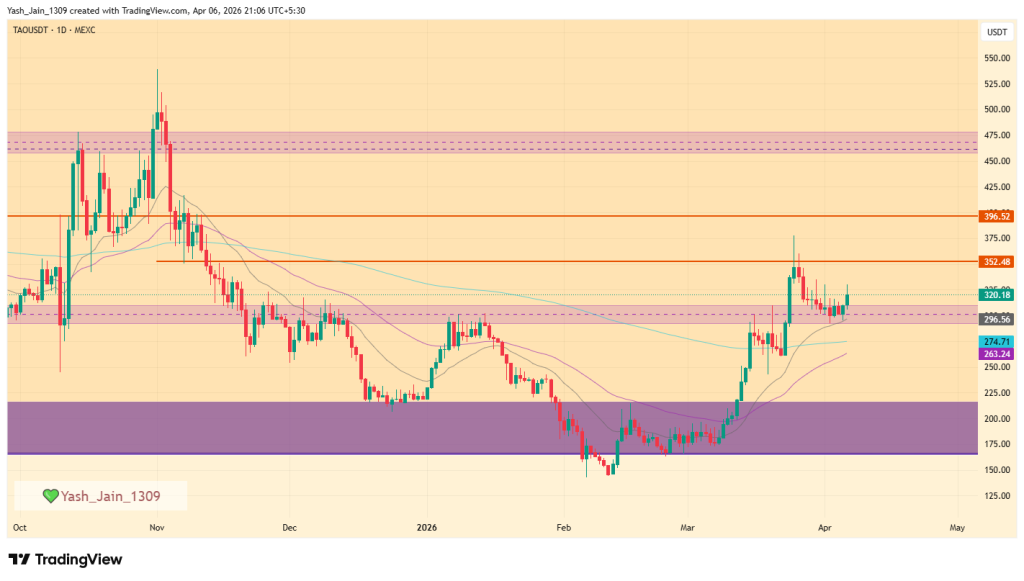
TAO price showed a sharp 10% intraday surge pushed it cleanly off a key level around $300, flipping what used to be resistance into support. That’s bullish structure. Clean. Convincing.
But is it that simple, and will price keep rising? Let’s find out.
TAO price breakout builds strong bullish momentum
The move from $300 wasn’t random. That level had been acting like a ceiling in march, and now in April it’s holding as a floor. That’s the kind of shift traders watch closely and this demand area is being tested right now.
If momentum sticks, the next logical checkpoints sit at $352 and $396. Those aren’t fantasy targets they’re areas TAO price has already respected before. So revisiting them? Totally on the table.
And of course, the optimism doesn’t stop there. Some market voices are already calling for a much bigger move, with expectations stretching as high as $500 before June. The narrative? TAO isn’t just rallying it’s “ fundamentals are dominating.”
$TAO looks ready to keep dominating through April and into May.
Well, while TAO price action looks solid, derivatives data is starting to look… uncomfortable.
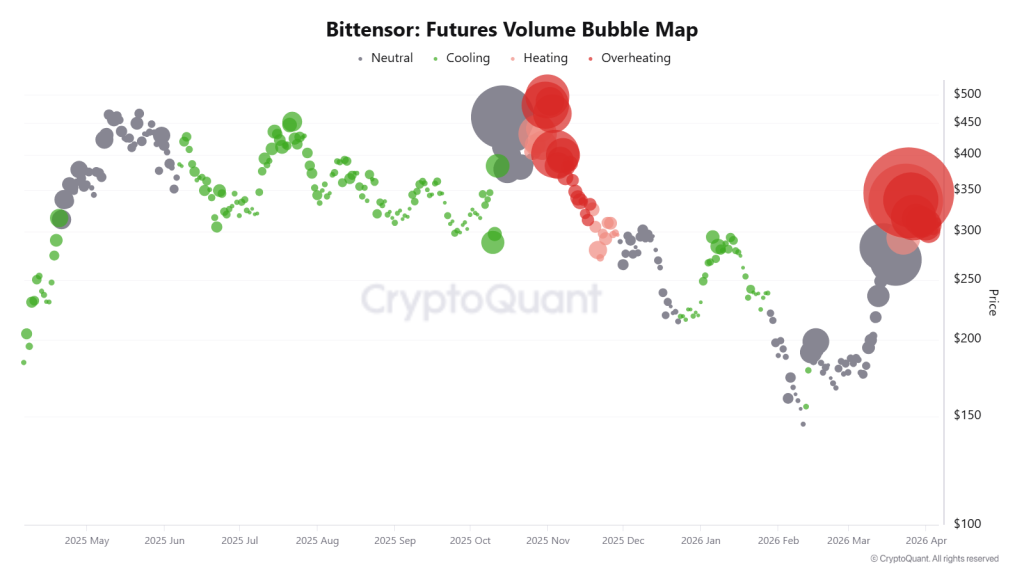
The futures volume bubble map from CryptoQuant platform shows heavy leveraged activity stacking up right between $300 and $350. Not just elevated but red hot overheated state. That’s usually not a sign of stability. It’s a sign of crowding.
And crowded trades don’t end well. We’ve seen this before. Back in Q4 2025, a similar overheating phase didn’t lead to continuation but it triggered a sharp correction. If history rhymes, this current setup could be laying the groundwork for a pullback rather than a breakout.
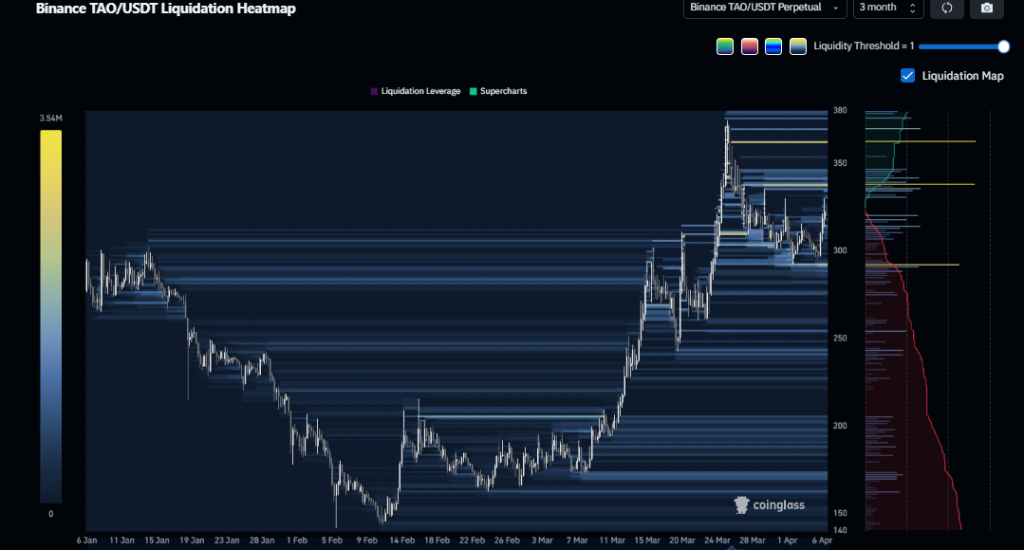
Bearish liquidation signals add pressure on upside
Now layer in liquidation data, and things get even more interesting. Right now, the structure leans bearish.
That means if TAO price stalls or dips, downside liquidations could accelerate the move lower. Basically, the same leverage that’s fueling upside momentum can flip and become a liability real fast.
So while spot traders see strength, derivatives traders are quietly building a risk scenario underneath.
Chainlink price is quietly sitting at a pressure point and if you’ve been around crypto long enough, you know that’s usually when things get interesting. Not loud. Not flashy. Just… tense.
Between March 23 and April 5, the network pushed out 18 new integrations across 9 services and 22 different chains. That’s not hype that’s steady infrastructure expansion that its been doing for several months now. And yet, LINK price hasn’t exploded.
Growing integrations signal deeper ecosystem expansion
Beginning from its demand then its been high and its utility isn’t slowing down is clearly evident from several metrics. If anything, it’s accelerating. Those 18 integrations aren’t just numbers they reflect Chainlink embedding itself deeper into the plumbing of crypto.
Chainlink Adoption Update
Recently, there were 18 integrations of the Chainlink standard across 9 services and 22 different chains.
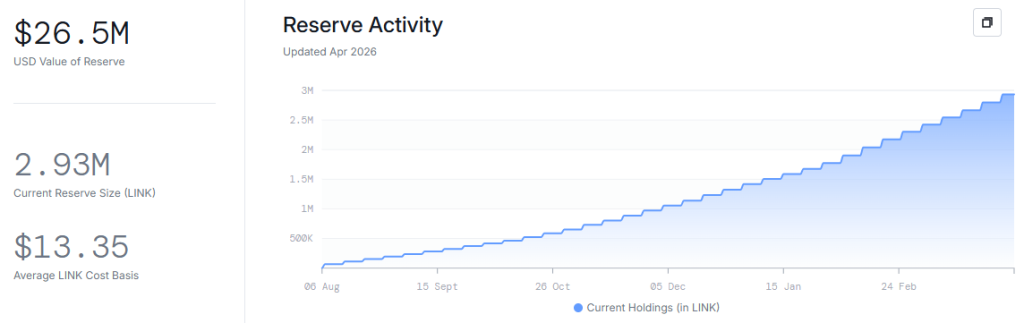
Meanwhile, the Chainlink Reserve is quietly stacking. As of April 2, it has accumulated 2.93 million LINK, funded through a mix of on-chain and off-chain revenue streams. That’s not retail speculation that’s systematic accumulation.
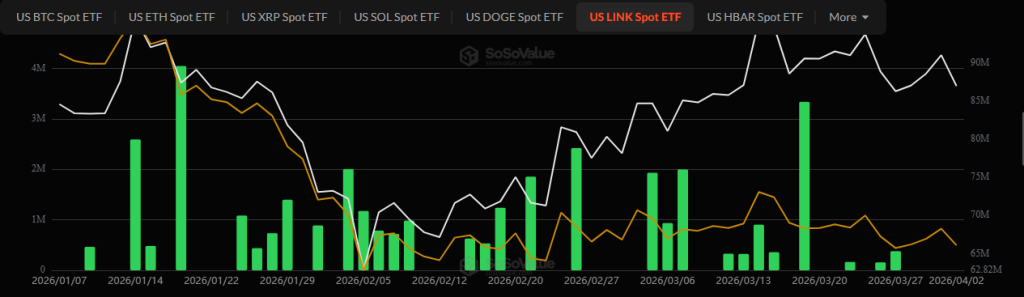
And then there’s the ETF angle. No outflows. None. Only inflows so far. That’s about as clean a signal as you get in a market that loves mixed messages.
But still we look at LINK price that hasn’t broken out, yet. Why? Because markets don’t move on fundamentals alone. They move on positioning.
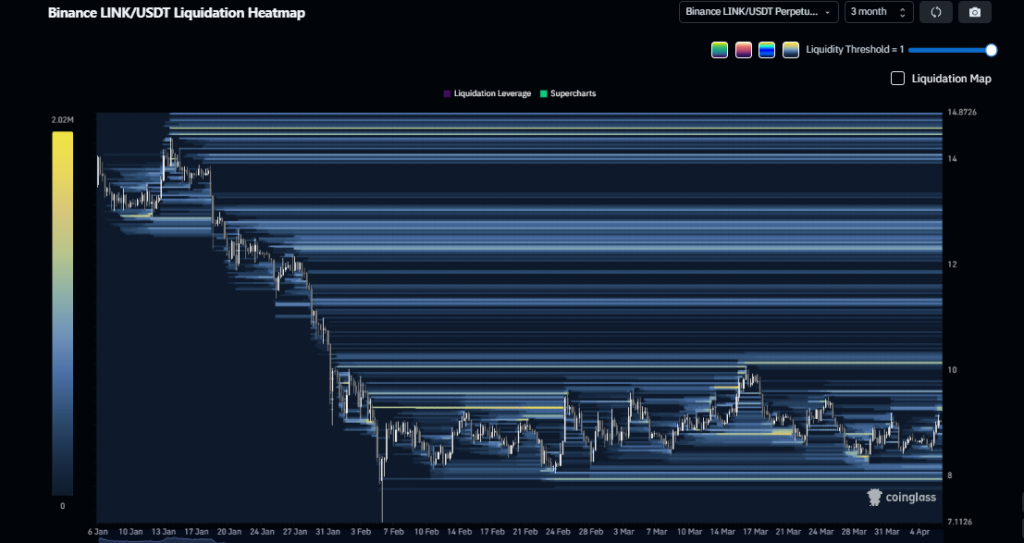
Chainlink price stuck between leverage heavy zones
Zoom into the liquidation heatmap and things get clearer. There’s heavy leverage stacked at $8 support and $10 resistance. That’s your battlefield.
Break below $8? You’re likely looking at a cascade toward $6 as long positions unwind. Flip $10? That’s where things get violent in a good way with a potential short squeeze pushing price toward $12 and even $14.
And right now? It’s stuck in between. Waiting. This kind of setup isn’t random. It’s engineered by market participants loading up on leverage, creating pockets of liquidity that price eventually hunts.
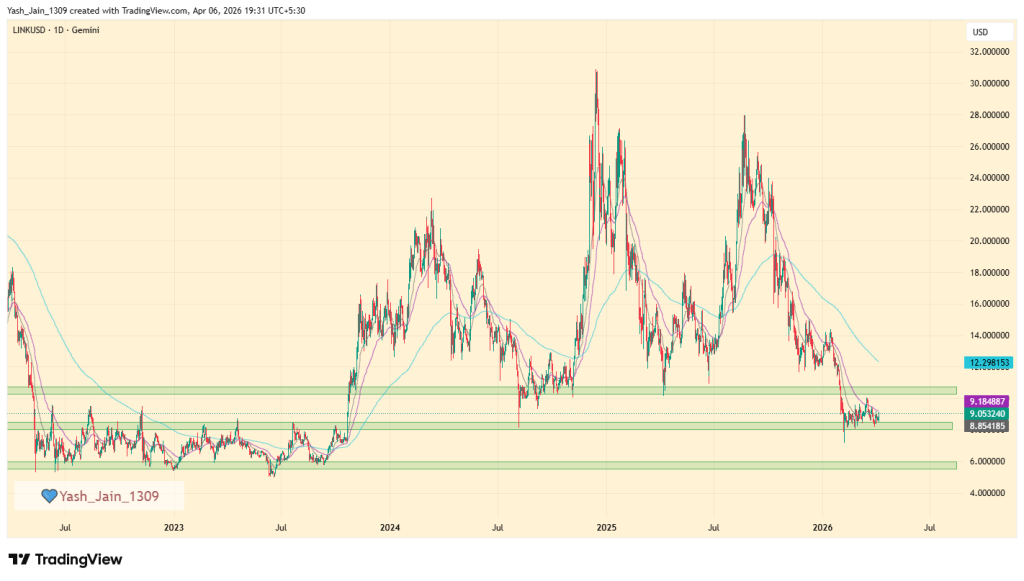
Bullish bias builds but risks remain real
Similarly, the daily chart also leans slightly bullish. Not overwhelmingly but enough to suggest buyers aren’t done yet. But markets don’t care about “slight.” They care about conviction.
If $8 holds, it reinforces demand and sets the stage for a breakout attempt above $10. If it cracks, the entire structure shifts, and suddenly everyone starts talking about downside targets again. So yeah, the setup matches how derivatives liquidation map showed. At this time it is clean but it’s also fragile.
Cronos coin price is expected to go as high as $0.3000 to $0.3500 in 2026.
CRO crypto may cross the $1 mark, with a potential high of $1.3190 by 2029.
Cronos (CRO) serves as the backbone of the Cronos Chain, a high-performance, open-source ecosystem engineered by Crypto.com. Designed to bridge the gap between traditional finance and Web3, CRO acts as a versatile utility token that facilitates instantaneous, low-cost global transactions while powering a vast suite of DeFi applications, perpetuals, and fiat-integrated markets.
Driven by institutional-grade infrastructure and a rapidly expanding global footprint, CRO’s market performance increasingly reflects a surge in investor confidence and real-world utility. As the network matures into 2026, its role in the next generation of digital asset exchange becomes even more pivotal.
In this analysis, we leverage advanced technical indicators and historical performance models to forecast the trajectory of Cronos. Whether you are a long-term holder or a strategic investor, this guide provides essential price projections for 2026 and through to 2035, helping you determine if CRO/USD is the missing piece for your portfolio.
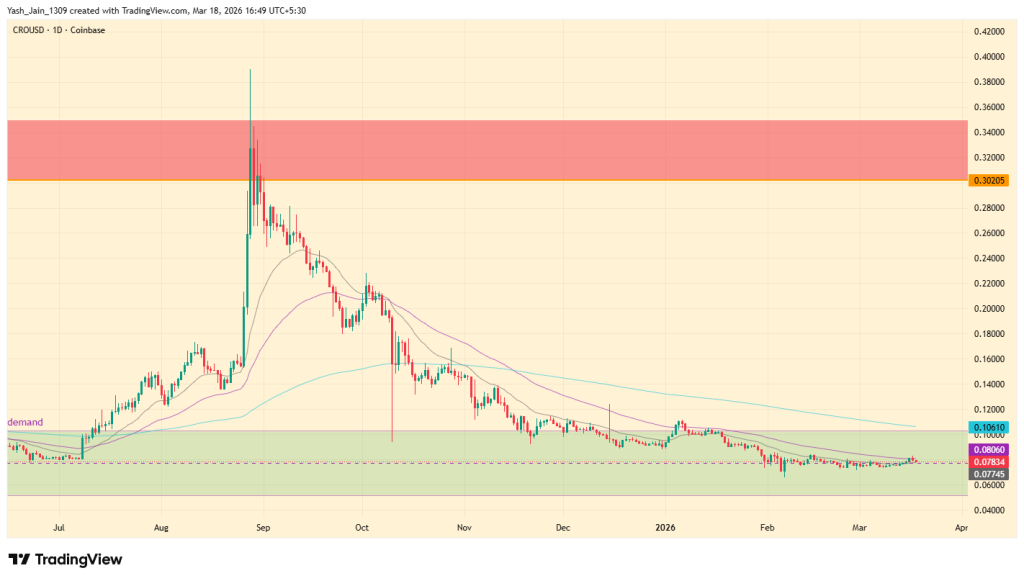
Currently, the Cronos price is experiencing a period of consolidation on the daily chart, hovering around the key horizontal line at approximately $0.0777, which marks an important multi-year demand range (indicated in green). This phase indicates a decrease in momentum, and if this trend continues, we could observe its persistence into March.
On a more optimistic note, should the price successfully break above $0.1000, we can anticipate a robust move towards the 200-day EMA band, potentially reaching around $0.1200 by April. However, if bearish factors come into play, we might see the price retreat to the lower end of the current demand range, possibly down to around $0.0600.
Recent Updates & Network News
On February 5, 2026, Cronos announced the development of a unified trading platform offering tokenized stocks, commodities, and prediction markets. This expansion is supported by a strategic integration with Fireblocks, providing the secure, institutional-grade custody infrastructure necessary for market makers to trade at scale.
Following this, a post on February 28 announced the Cronos v1.7 Network Upgrade is scheduled for March 10 at 07:00 GMT. This technical maintenance will involve approximately 30 minutes of downtime to align with recent SDK updates and implement RPC performance improvements to ensure long-term chain stability.
CRO Price Prediction for 2026
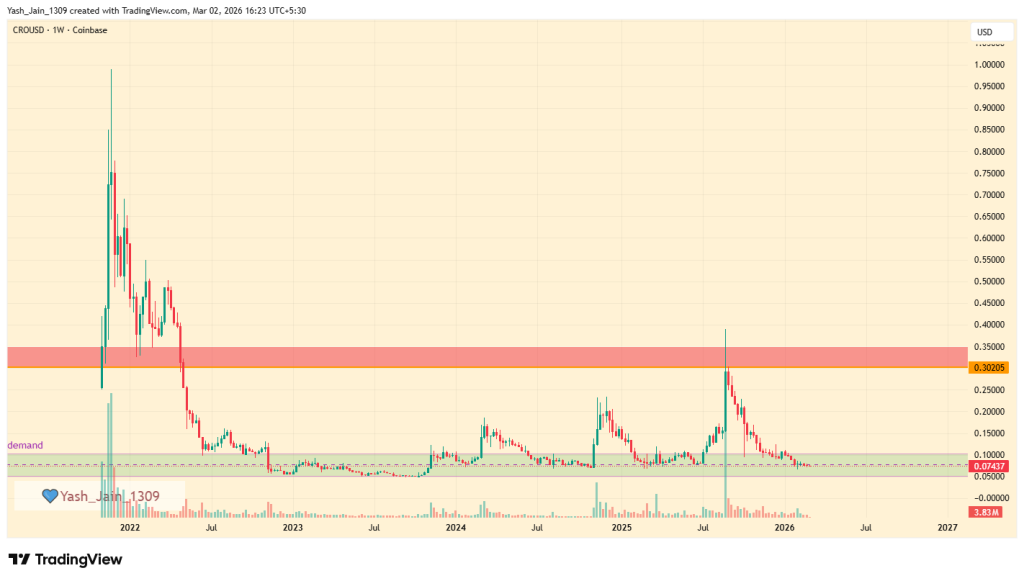
The weekly chart for CRO/USD reveals a persistent long-term structure defined by a well-established accumulation zone. Since late 2023, Cronos has consistently found a floor within the $0.0500 to $0.1000 demand area. This “buy zone” has historically triggered significant rallies, notably in late 2024 and mid-2025, where the price peaked at $0.3900.
As of early 2026, CRO has returned to this familiar base, setting the stage for its next major move.
The current weekly price action suggests a period of base-building. We are seeing a repeat of the historical pattern where CRO enters a deep consolidation phase before a vertical expansion.
Supply Zone: The primary target for a breakout lies between $0.3000 and $0.3500.
The Pivot Point: Simply hitting the supply zone isn’t enough; for a true trend reversal, CRO must flip this resistance into support to reclaim its 2022 highs.
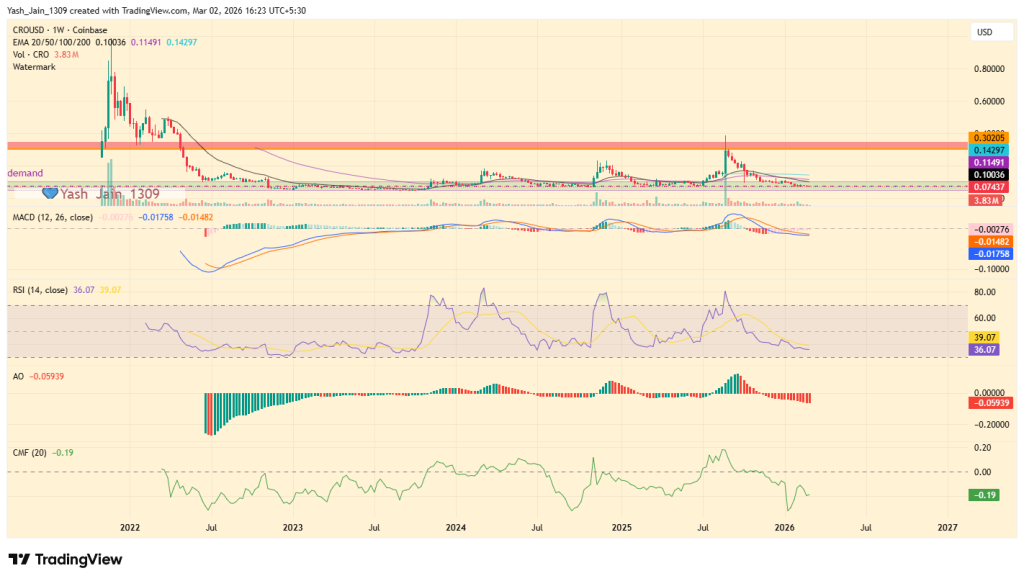
Moreover, While the price remains flat, the underlying “engine” of the market (indicators) is starting to show signs of exhaustion from the bears:
In MACD for instance we are currently approaching a weekly bullish cross. Historically, this cross has served as the starting gun for intensified consolidation that eventually leads to a breakout at later stage.
CMF is the most encouraging sign. The CMF has bounced sharply from a low of -0.32. This move toward the zero line suggests that selling pressure is fading and capital is starting to stabilize within the ecosystem.
RSI & AO, Both indicate that the “cooling off” period is still in effect. This lack of a clear direction in RSI confirms we are in a neutral accumulation phase, which is often known as the quiet before the storm.
What Makes CRO Interesting in 2026?
In 2026, Cronos (CRO) stands out as a unique bridge between high-finance and retail utility. The landscape shifted dramatically in late august 2025 when Trump Media Group announced a $6.42 billion CRO Digital Asset Treasury strategy, signaling a massive institutional endorsement of the token’s scarcity.
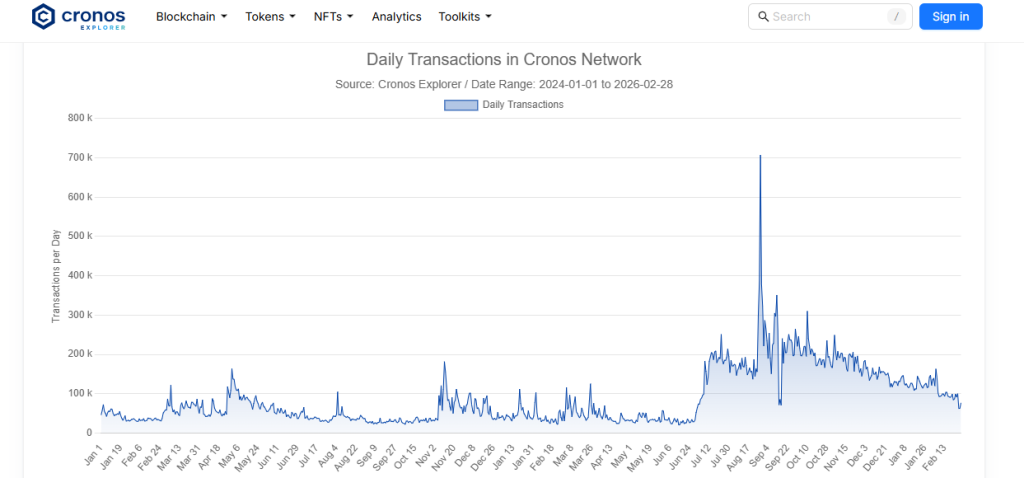
Beyond the headlines, Cronos remains a technical powerhouse with zero downtime over four years. It currently supports 150M+ users via the Crypto.com ecosystem and powers payments for 10M+ merchants. While the broader market has cooled in Q1, Cronos maintains a healthy 100,000 daily transactions, proving its resilience. This blend of “battle-tested” infrastructure and “institutional-grade” liquidity makes it a critical pillar of the 2026 digital economy.
Cronos (CRO) Price Prediction for 2027-2035
Year
Minimum Price ($)
Maximum Price ($)
Average Trading Price ($)
2027
0.1690
0.3490
0.2490
2028
0.3570
0.6990
0.5090
2029
0.7100
1.3190
0.9890
2030
1.3490
2.4010
1.8210
2031
2.4200
4.1990
3.2350
2032
4.2210
7.1000
5.5290
2033
7.1090
11.5050
9.1650
2034
11.5910
18.4510
14.7650
2035
18.4290
28.7110
23.1990
Cronos Token Price Prediction for 2027
By 2027 Cronos token price is expected to trade between $0.1690 and $0.3490. The average expected trading cost is $0.2490.
CRO Price Prediction for 2028
In 2028, CRO price is expected to trade between $0.3570 and $0.6990. The average expected trading cost is $0.5090.
Cronos (CRO) Crypto Price Prediction for 2029
Experts expect Cronos crypto to trade between $0.7100 and $1.3190 in 2029. The average expected trading cost is $0.9890.
CRO Price Prediction for 2030
Based on technical CRO price analysis it is expected to trade between $1.3490 and $2.4010 in 2030. The average expected trading cost is $1.8210.
CRO/USD Price Prediction for 2031
Based on technical analysis by experts, in 2031 CRO/USD is expected to trade between $2.4200 and $4.1990. The average expected trading cost is $3.2350.
Cronos Price Prediction for 2032
Following 2031, in 2032, Cronos price is expected to trade between $4.2210 and $7.1000. The average expected trading cost is $5.5290.
CRO Token Price Prediction for 2033
In 2033, CRO token price is expected to trade between $7.1090 and $11.5050, with an average expected trading cost of $9.1650.Price Prediction for 2034
CRO Crypto Price Prediction for 2034
Based on technical analysis by cryptocurrency experts, in 2034 CRO crypto is expected to trade between $11.5910 and $18.4510. The average expected trading cost is $14.7650.
CRO Price Prediction for 2035
According to technical analysis by top specialists, the CRO price is projected to range from $18.4290 to $28.7110 by 2035. The anticipated average trading price is $23.1990.
Never Miss a Beat in the Crypto World!
Stay ahead with breaking news, expert analysis, and real-time updates on the latest trends in Bitcoin, altcoins, DeFi, NFTs, and more.
FAQs
What is the Cronos (CRO) price prediction for 2026?
CRO is expected to trade within the $0.05–$0.35 range in 2026, with a breakout above $0.30 needed to confirm a bullish reversal.
Can Cronos (CRO) reach $1 by 2030?
Based on long-term projections, CRO could trade between $1.34 and $2.40 by 2030 if adoption and momentum continue.
Is Cronos a good long-term investment through 2035?
Long-term forecasts suggest gradual growth toward higher ranges by 2035, but returns depend on adoption and market cycles.
What could drive CRO price growth in 2026?
Institutional integration, network upgrades, rising utility, and a confirmed bullish MACD cross could support upside momentum.
Artificial Superintelligence Alliance’s price could hit a maximum trading price of $1 in 2026
With a potential surge, the FET price may record a high of $12.45 by 2030.
As artificial intelligence continues to dominate global headlines, blockchain-based AI infrastructure projects are once again attracting investor attention.
Among them, the Artificial Superintelligence Alliance (ASI) stands out as a strategic merger of major AI-focused blockchain entities.
Founded through the collaboration of Fetch.ai, SingularityNET, and later CUDOS, the alliance aims to create the largest open-source, decentralized ecosystem focused on Artificial General Intelligence (AGI).
The FET token, originally native to Fetch.ai and now central to the ASI ecosystem, serves as the utility, governance, and settlement layer across AI services.
So let’s dive straight into CoinPedia’s Artificial Superintelligence Alliance (FET) price prediction for 2026, 2027, and 2030.
Artificial Superintelligence Alliance (FET) Price Targets For April 2026
The Artificial Superintelligence Alliance (ASI) is expanding its AI agent marketplace, making it easier for users and applications to access various AI services.
If ASI successfully integrates its offerings, it will be able to host AI models on its network, facilitate communication and collaboration among AI agents, and enable users to pay for AI services directly on the blockchain. Additionally, ASI is working to establish partnerships with businesses interested in utilizing AI.
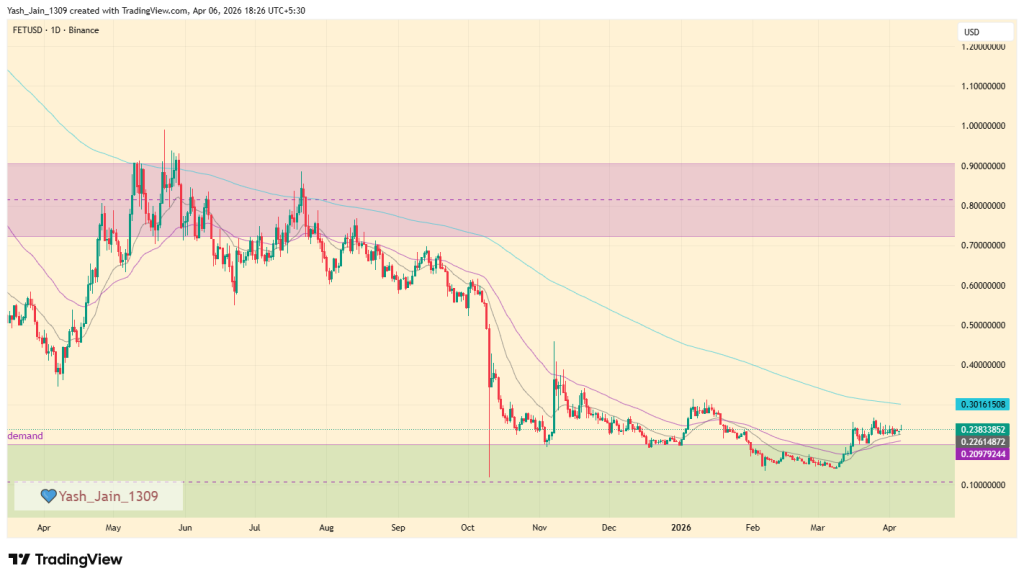
As more people begin to use AI on the network and the demand for computing power increases, this could drive up activity and potentially push the FET price towards $0.32 by April 2026. The price already reached $0.25 in mid-March, now approaching the 200-day EMA band. It has also found support in the green box, which aligns with a multi-year demand zone. If bearish pressure increases, the price could re-enter this support zone; however, if it continues on its upward trajectory, testing $0.32 could be within reach or even higher.
Unlike many AI tokens driven by hype, the Artificial Superintelligence Alliance (FET) is building a foundation in decentralized compute and autonomous agents. This shift from speculation to real-world utility suggests that FET’s value will increasingly mirror actual network usage. As companies adopt these decentralized services, the organic demand for the token could provide a structural floor for long-term growth.
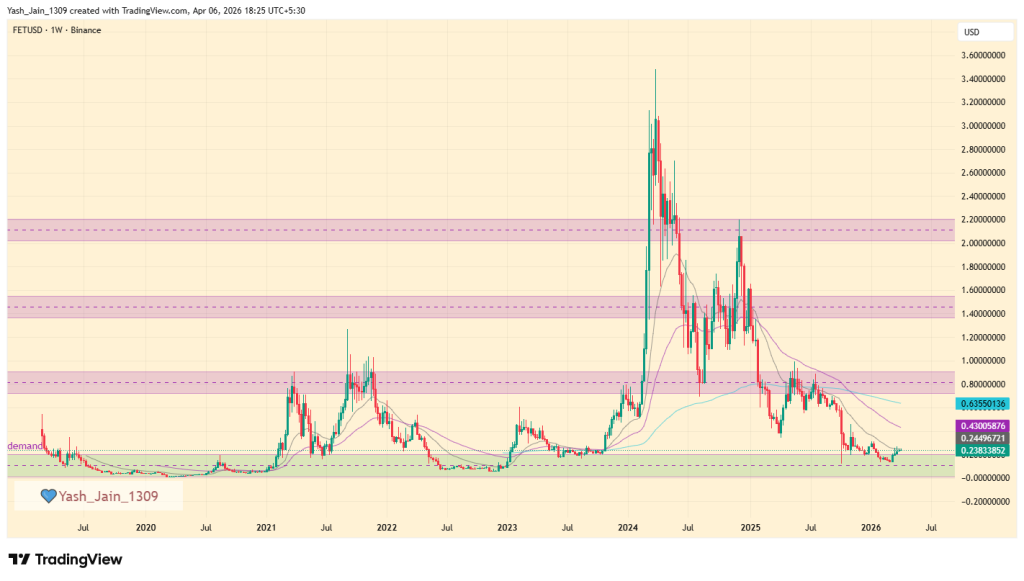
Technically, FET’s 2026 outlook remains tied to key market cycles. A potential low of $0.0582 serves as a deep support zone during “risk-off” periods. However, as the ecosystem matures, an average price of $0.0913 is expected as it maintains a steady trend. In a bullish breakout scenario, FET could surge toward $0.3013, driven by high-volume demand for decentralized AI infrastructure.
FET Price Prediction 2026 – 2030
Year
Potential Low ($)
Potential Average ($)
Potential High ($)
2026
$0.0921
$0.340
$0.950
2027
$0.173
$0.820
$2.14
2028
$0.468
$1.938
$5.53
2029
$1.40
$4.30
$8.05
2030
$2.126
$6.78
$12.45
FET Price Prediction 2027
Growing wider adoption of autonomous AI agents in supply chains, logistics, and digital services could push FET near $2.14
FET Price Forecast 2028
By 2028, if decentralized AGI frameworks mature and institutional AI infrastructure adopts ASI tooling, FET may approach $5.53.
FET Coin Price Prediction 2029
In 2029, AGI research networks integrate token-based compute markets, and valuation expansion could drive FET toward $8.
What will Fetch AI be worth in 2030?
In a strong AI-dominant economy where decentralized compute markets compete with centralized cloud providers, FET could test $12.45
As per CoinPedia’s FET Price Prediction, the exponential growth observable in the field of artificial technologies will boost the value of AI tokens in the crypto world
If the alliance successfully aligns AI compute markets, decentralized agents, and open-source model hosting under one economic framework, FET could gradually reclaim the $0.950 range in 2026.
Year
Potential Low ($)
Potential Average ($)
Potential High ($)
2026
$0.0921
$0.340
$0.950
Never Miss a Beat in the Crypto World!
Stay ahead with breaking news, expert analysis, and real-time updates on the latest trends in Bitcoin, altcoins, DeFi, NFTs, and more.
FAQs
What is Artificial Superintelligence Alliance (FET)?
Artificial Superintelligence Alliance (FET) is a merged AI-blockchain ecosystem uniting Fetch.ai, SingularityNET, and CUDOS to power decentralized AI services.
What is the Artificial Superintelligence Alliance (FET) price prediction for 2026?
FET could trade between $0.09 and $0.95 in 2026, depending on AI adoption, network growth, and overall crypto market momentum.
What could FET be worth by 2030?
If decentralized AI scales globally, FET may test $12 by 2030, though long-term growth depends on real-world usage and regulation.
What Is the FET Price Prediction for 2040 and How High Can It Go?
By 2040, FET could trade between $25 and $40 if decentralized AI and AGI adoption expand globally with strong ecosystem growth.
What is the price prediction for FET in 2050?
By 2050, FET may exceed $60 in a mature AI economy, assuming sustained adoption, real utility, and stable crypto regulations.
Is FET a good long-term AI crypto investment?
FET offers exposure to decentralized AI infrastructure. Its long-term value relies on adoption, partnerships, and sustainable ecosystem growth.
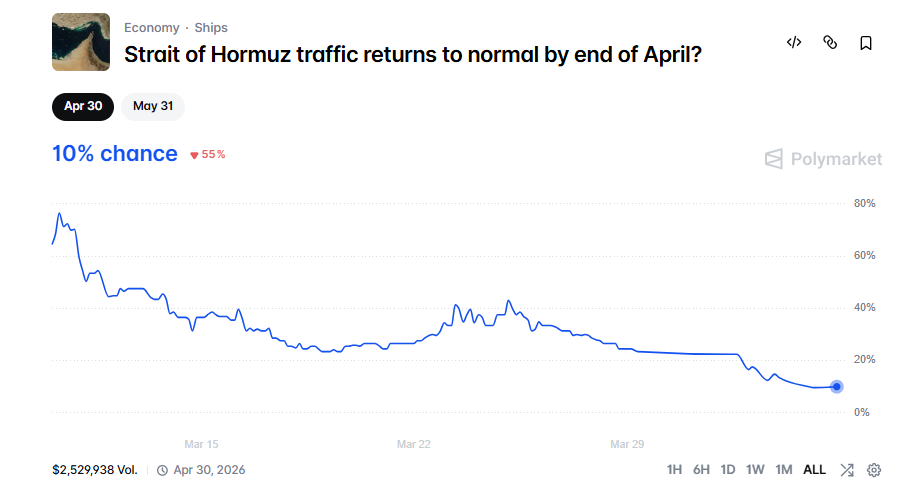
Prediction markets aren’t just side bets anymore they’re becoming the rawest form of crowd sentiment. And right now, prediction markets are painting a pretty grim picture for April.
Take the Strait of Hormuz question. Just weeks ago, confidence that traffic would normalize by the end of April sat at a comfortable 76.5%. Fast forward to today, and that number has collapsed to 10%. Intraday, it briefly hovered around 11.5%, but even that didn’t hold.
That’s not a dip. That’s a full-blown sentiment breakdown.
Prediction markets flip sharply on war outlook
So what changed? Well, a steady stream of aggressive geopolitical rhetoric has pushed traders to rethink their bets. The market isn’t just reacting to headlines; it’s reacting to tone, escalation, and the probability of things getting worse before they get better.
And the numbers don’t lie. With $2.52 million in total volume and over $141K in daily activity, this isn’t some illiquid corner of the internet. People are actively pricing in risk and they’re leaning heavily toward prolonged conflict.
In simple terms? April isn’t expected to calm down. It’s expected to get louder.
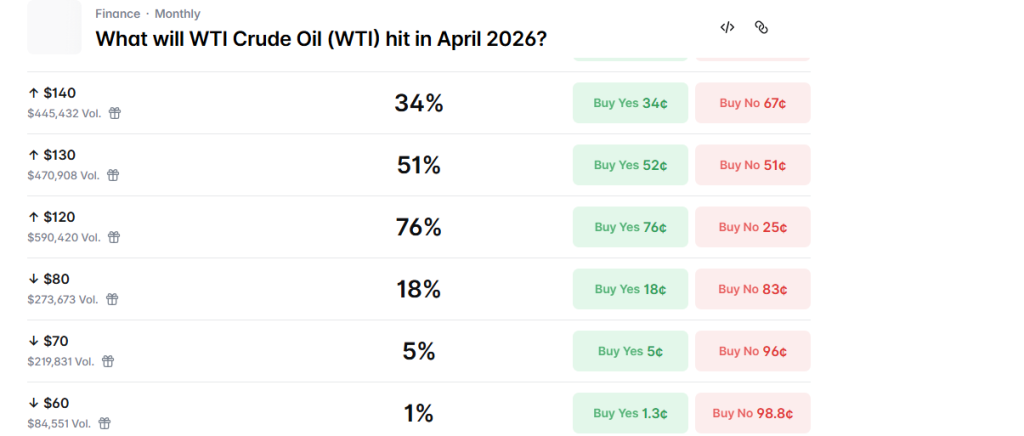
Oil bets explode as conflict fears intensify
Now flip over to another prediction market: oil. The question “what will WTI crude hit in April 2026” reveals even more about where sentiment is heading. A striking 76.5% of participants believe oil will cross $120. More than half, 53.5%, think it’ll break $130. And nearly a third are betting on $140 or higher.
Only 17.5% are betting on a drop to $80. That’s the minority view which is kind of the “things get better” scenario.
But right now geopolitical drama isn’t looking better yet. This kind of positioning screams one thing: expectation of continued disruption.
Crypto market caught in geopolitical crossfire
So where does this leave crypto? Right in the middle of it. Today’s Truth Social post highlights pride in his past tariff plans that allegedly created new U.S. jobs but also resulted in a 55% trade deficit. He concluded by stating he is “getting rid of nuclear Iran to make America great again.”
— Commentary Donald J. Trump Posts From Truth Social (@TrumpDailyPosts) April 4, 2026
When global conflict intensifies, it doesn’t just hit oil infact it ripples through equities, commodities, and yes, digital assets like BTC, ETH, and other’s included. If the Strait of Hormuz remains unstable, global trade routes stay under pressure. That’s not exactly bullish for risk assets.
Short term, that means volatility. Sharp moves, quick reversals, and plenty of fakeouts.
Long term? That’s a different story. But right now, markets aren’t thinking long term but they’re reacting in real time.
Sentiment points to volatile April ahead
So Prediction markets are already answering that question, just not in a comforting way.
With probabilities shifting this aggressively, traders are positioning for chaos, not clarity. And when sentiment aligns this strongly, markets tend to follow at least in the short term.
Prediction markets might not be perfect. But right now, they’re telling a very clear story: April isn’t priced for peace. It’s priced for pressure.
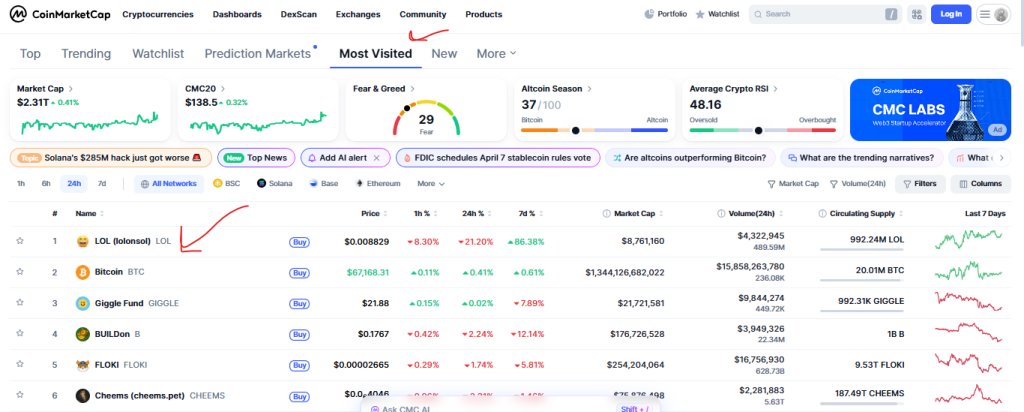
LOL token price just did what memecoins do best which is steal the spotlight when no one’s looking. In the past 24 hours, it quietly climbed to the top of the most-visited charts, overtaking even the usual heavyweights like Bitcoin on Coinmarketcap especially. Not bad for a project sitting at a $9.56 million market cap and trading around $0.009642.
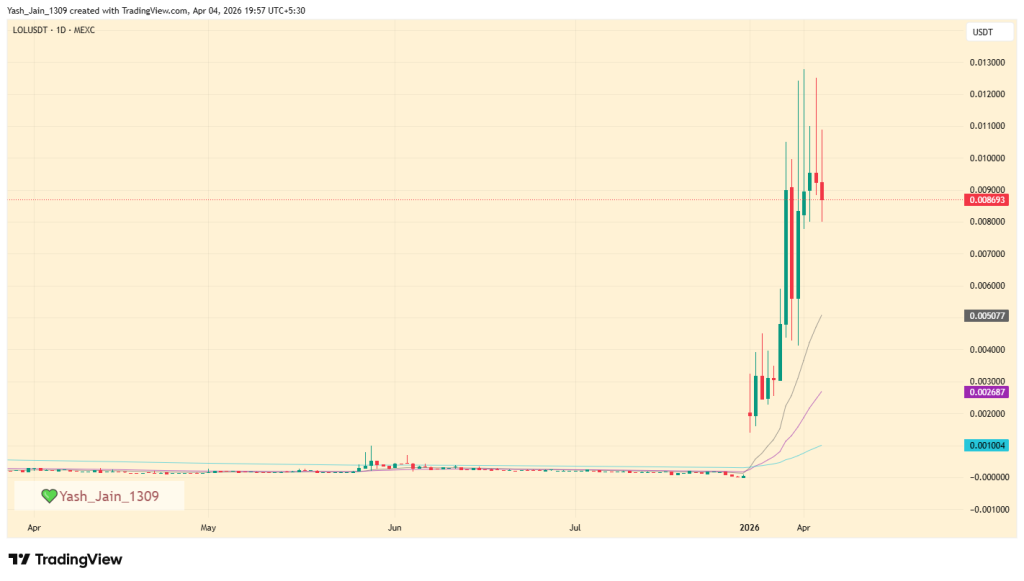
Explosive rally sends LOL token trending hard
Pull up the LOL/USDT chart and it’s obvious why traders suddenly care. Between March 23 and April 1, the token ripped from $0.001401 to $0.012774 thats an almost 800% surge. That’s not a rally, that’s a vertical sprint.
Since then, things have cooled… slightly. The price has slipped back to around $0.009582, but it’s still up roughly 580% from its starting point. And here’s the weird part it’s not collapsing like most low-cap memecoins after a move like that.
Instead, it’s printing wicks near the top. That usually means one thing: indecision. Buyers want higher, but sellers aren’t done yet.
Whale activity and hype fuel momentum
So what’s keeping it alive? A mix of speculation, hype, and just enough narrative to keep traders interested.
A memecoin whale recently scooped up $8.01K worth of LOL around a $9.44 million valuation. Not massive, but enough to get attention in a low-liquidity environment.
— Whale Watch by Moby (@whalewatchalert) April 4, 2026
Then there’s the chatter. Discussions around potential funding deals, future growth plans, and even possible major exchange listings are floating around. Add in the usual “biggest meme” claims and you’ve got the perfect cocktail for retail curiosity.
And yeah, it’s working. That’s why LOL token price is sitting at the top of the most-visited rankings despite being ranked deep in the market.
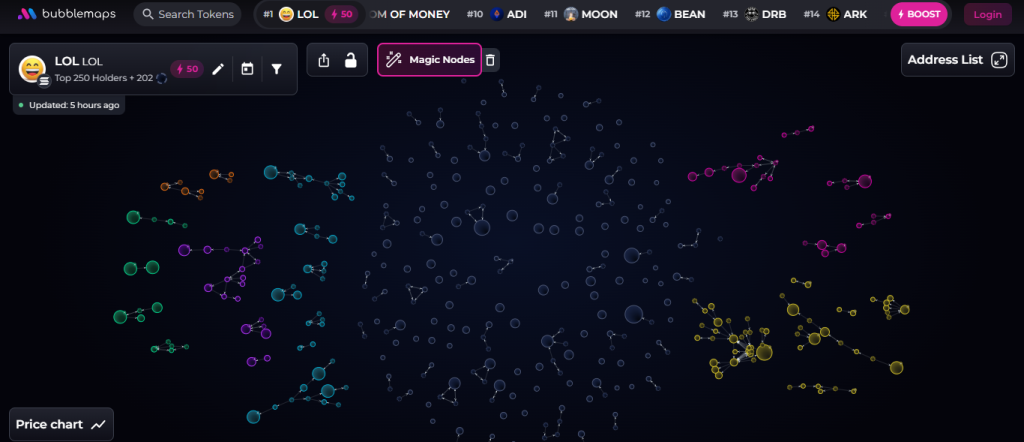
Now here’s where the story shifts. On-chain data isn’t nearly as fun as price charts but it’s a lot more honest. Bubble map analysis shows something less comforting: clustered supply.
Instead of a wide, decentralized spread of holders, there are visible interconnected groups of wallets especially yellow, pink, teal clusters that suggest coordinated ownership. These aren’t random retail wallets. They’re linked. And that’s a problem.
Because when large chunks of supply sit in connected hands, it creates the perfect setup for a coordinated exit. One move, multiple wallets, and suddenly liquidity disappears. Retail? Usually left holding the bag.
Momentum holds, but structure remains fragile
So, what’s next? Honestly, odds suggests at this point is that it’s a coin flip just like most memecoins at this stage.
If hype keeps building and demand flows in, LOL token price could push higher. That’s how these things work. Momentum feeds momentum.
But let’s be real, practical and mature because underneath the hype, the structure isn’t exactly bulletproof. Supply concentration, speculative demand, and thin liquidity don’t make a stable foundation. For now, LOL token price is riding the wave. The question is how long before the wave turns.
Notcoin may possibly hit $0.200 by 2030 if support holds and adoption strengthens steadily.
NOT remains in consolidation, with key support at $0.00030
Notcoin (NOT) began as a viral sensation, pioneering the “tap-to-earn” model on Telegram and onboarding over 35 million users into the TON ecosystem.
However, the initial euphoria gave way to a significant “demise” in market value, as the token plummeted over 95% from its 2024 highs to a current market cap of approximately $39M. This decline was driven by massive airdrop sell pressure and a lack of sustainable utility beyond the initial clicker game.
Today, the NOT token is attempting a “strategic resurgence,” evolving from a simple game into a gaming hub and DeFi platform. It now powers the “Not Games” ecosystem, serves as collateral in DeFi protocols, and even backs a digital Visa card with buyback mechanisms.
Can this pivot from hype to infrastructure restore investor confidence, or was the viral spark a one-time phenomenon? To explore its potential recovery, read our Notcoin price prediction 2026-2030 for a deep dive.
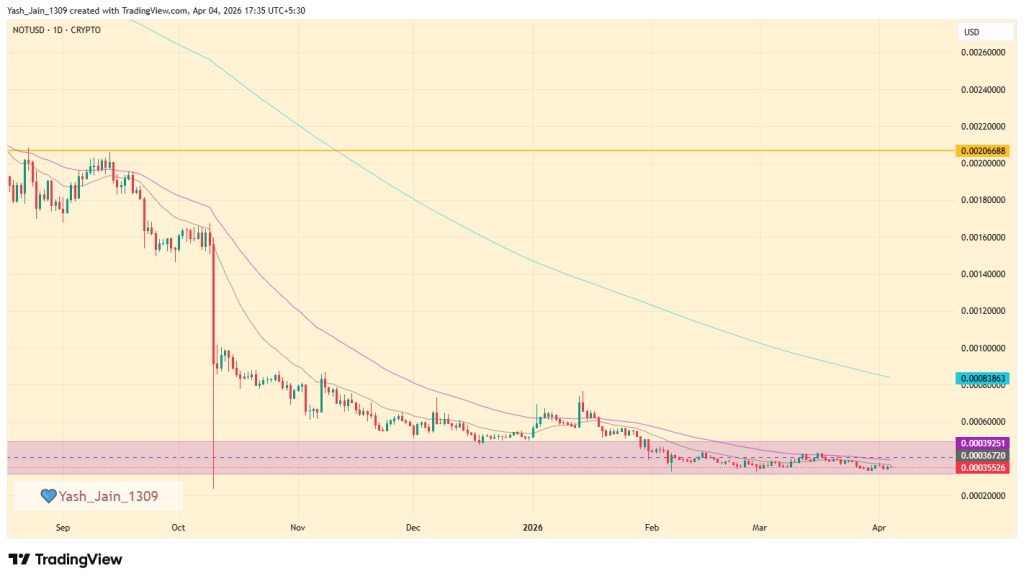
As April has begun and Q1 ended, Notcoin’s price action remains defined by stability rather than expansion. The $0.00030–$0.00035 range has emerged as a key support zone, where selling pressure has consistently eased. As long as NOT holds above this area, the risk of deeper downside remains limited, and price is likely to continue moving sideways.
On the upside, initial resistance is located near $0.00060, followed by a broader recovery zone between $0.0010 and $0.0015. These levels have capped price during previous attempts and will likely require time and steady participation to overcome. Now after Q1, April is unlikely to deliver a sharp breakout. Instead, its importance lies in whether Notcoin can maintain its base and slowly build higher structure, setting the stage for recovery later in the year.
Recent News/ Opinions
On April 2, 2026, Notcoin unveiled its latest evolution, “Nothing,” an independent media platform where artists and creators lead the narrative. Moving beyond its gaming origins, this new initiative invites talents and spectators to participate in a developing story that turns “nothing into something” through decentralized creative expression.
On March 6, 2026, Notcoin announced that its “Glance” play-to-earn game has introduced new quests, allowing players to earn free NOT tokens upon successful completion. This integration strengthens the project’s ecosystem by incentivizing active gameplay and rewarding the community through interactive challenges.
Notcoin (NOT) Price Prediction 2026
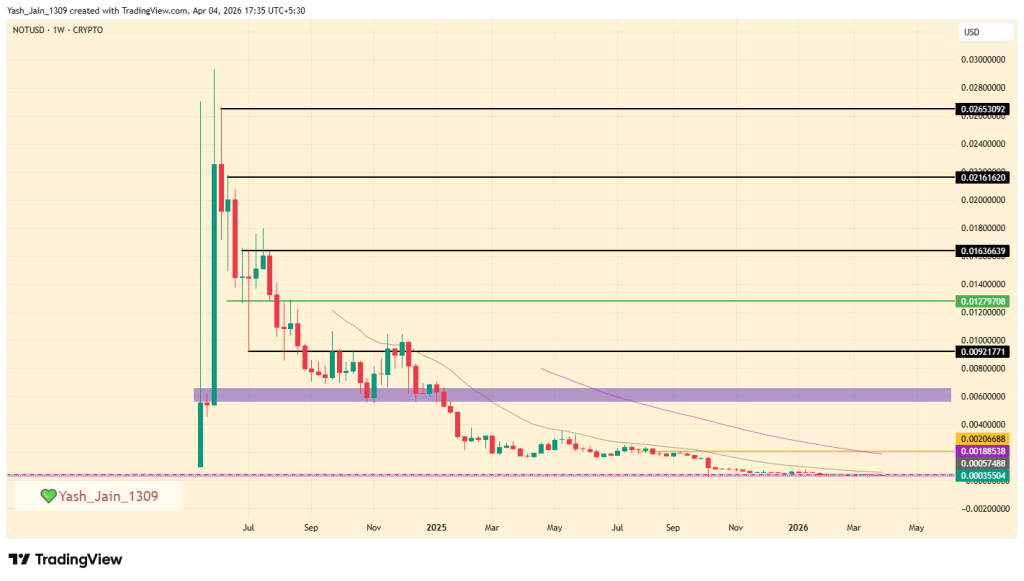
The weekly chart for NOT/USD illustrates a classic “hype-to-capitulation” cycle. Following its Q2 2024 launch, the token experienced a massive parabolic surge, peaking near $0.029. However, this was met with intense selling pressure, breaking key psychological supports at $0.012 and $0.009.
By 2025, the price entered a persistent “bleeding” phase, characterized by lower highs and diminishing volume. Currently, in H1 2026, the asset is trading at extreme lows around $0.00035-$0.00040, deep within a terminal consolidation zone. For a reversal, bulls must reclaim the $0.002 level to break the long-term bearish structure.
Notcoin Crypto Price Prediction 2026 – 2030
Year
Potential Low ($)
Potential Average ($
Potential High ($)
2027
0.035
0.055
0.080
2028
0.060
0.095
0.140
2029
0.110
0.160
0.190
2030
0.150
0.180
0.200
Notcoin Price Prediction 2027
As per the Notcoin Price Prediction 2027, Notcoin may see a potential low price of $0.035. The potential high for Notcoin price in 2027 is estimated to reach $0.080.
Notcoin (NOT) Price Forecast 2028
In 2028, Notcoin price is forecasted to potentially reach a low price of $0.060 and a high price of $0.140.
Notcoin Crypto Price Prediction 2029
Thereafter, the Notcoin (Notcoin) price for the year 2029 could range between $0.110 and $0.190.
Notcoin (NOT) Price Prediction 2030
Finally, in 2030, the price of Notcoin is predicted to remain steady and positive. It may trade between $0.150 and $0.200.