Bittensor may be entering one of its most important phases, yet the market is barely paying attention. While TAO continues to trade nearly 60% below its peak, a combination of institutional infrastructure, tightening supply, and shifting market structure is beginning to reshape its positioning. Price is no longer falling, sentiment remains muted, and capital is starting to move quietly beneath the surface.
The real question now isn’t why TAO price is down, it’s whether this quiet phase is where the next expansion is being built.
Institutional Access Expands With BitGo Integration
The latest shift comes from BitGo’s partnership with Yuma, introducing institutional-grade access to Bittensor subnet tokens. This allows clients to stake and trade subnet assets through a secure, unified platform, removing a major barrier for institutional capital.
A big moment for subnet tokens and meaningful step forward for institutional participation in Bittensor $TAOhttps://t.co/APcziR00g3
The significance lies in timing. Infrastructure is being built while TAO remains deeply discounted, suggesting early positioning rather than reactive participation. Historically, this sequence, where access improves before price, has often preceded capital inflows. At the same time, Bittensor’s subnet ecosystem continues to expand, approaching $1.5 billion in cumulative value. This steady growth highlights that network activity is progressing independently of price volatility.
TAO Price Holds Discount Zone as Structure Begins to Shift
TAO’s current structure reflects a transition rather than continued decline. After peaking near $767, the asset is now trading around $240–$250, holding firmly within the $236–$258 demand zone. This level has consistently absorbed selling pressure, indicating that downside momentum is weakening. Instead of trending lower, token price is stabilizing, suggesting that accumulation is gradually replacing distribution.
Momentum indicators support this shift. The Stochastic RSI remains in oversold territory, historically associated with accumulation phases. At the same time, moving averages are compressing, signaling reduced volatility and the potential for a directional move ahead. This is typically the phase where early capital positions, long before momentum becomes obvious.
However, confirmation remains critical. The $320–$383 range acts as the structural pivot. A breakout above this zone would signal a shift in market control and open the path toward higher levels.
Derivatives Data Signals Positioning Reset
Derivative metrics reinforce the same narrative. Funding rates remain low, reflecting the absence of aggressive long positioning, while open interest has stabilized after prior volatility.
This indicates that leverage has reset and speculative pressure has eased. Rather than chasing momentum, market participants appear to be rebuilding positions gradually. Such conditions often emerge during early-cycle phases, where positioning occurs quietly before broader participation returns.
Bittensor’s Fundamentals Strengthen the Narrative
Bittensor’s fundamental backdrop is evolving alongside its market structure. The first TAO halving has reduced block rewards by 50%, tightening supply dynamics at a time when price is already in a discount zone. The introduction of Dynamic TAO (dTAO) adds another layer of utility, enabling subnet-specific tokens and integrated liquidity mechanisms. This expands the network’s functionality and strengthens long-term demand drivers.
Institutional signals are also emerging. Exposure within AI-focused funds is increasing, while discussions around a potential ETF later in 2026 add a forward-looking catalyst. Notably, nearly 70% of TAO supply remains staked despite the drawdown, reflecting strong holder conviction and reinforcing the ongoing accumulation phase.
Outlook
TAO is not yet in a confirmed uptrend, but the conditions around it have clearly shifted. TAO price has stabilized, leverage has reset, and institutional infrastructure is expanding at a time when sentiment remains subdued. If TAO reclaims the $320–$383 zone, the structure transitions from accumulation to expansion. Until then, the current phase remains critical, where positioning builds quietly before the market begins to react.
Arbitrum has moved quickly to contain fallout from the KelpDAO exploit, freezing over 30,766 ETH, but the real story is unfolding in the market reaction. Instead of breaking lower, ARB price is holding steady near its base, hinting that selling pressure may already be exhausted. With derivatives positioning shifting and price structure stabilizing, the current setup raises a key question: Is ARB preparing for a reversal while sentiment remains cautious?
Arbitrum Contains Exploit, Limits Market Fallout
In a coordinated emergency response, Arbitrum’s Security Council confirmed the freeze of 30,766 ETH tied to the exploit, acting in collaboration with law enforcement and internal technical teams. The funds have been moved to a secure intermediary wallet, effectively removing access from the exploiter.
The Arbitrum Security Council has taken emergency action to freeze the 30,766 ETH being held in the address on Arbitrum One that is connected to the KelpDAO exploit. The Security Council acted with input from law enforcement as to the exploiter’s identity, and, at all times,…
Importantly, the intervention was executed without impacting users or applications on the network, reinforcing that the issue remained isolated. The move reflects a controlled containment strategy, reducing the risk of broader contagion across the ecosystem. At the same time, it highlights how governance mechanisms are increasingly being used to manage high-impact on-chain events.
ARB Price Hold Gains, Early Accumulation Emerging
Despite the negative trigger, ARB has not extended its downtrend. Instead, ARB price action is stabilizing within a defined accumulation range between $0.10 and $0.12, where consistent demand has absorbed selling pressure.
The structure shows repeated demand absorption at these lows, suggesting that sellers are losing momentum. More notably, the short-term moving averages have begun to turn upward, with a bullish crossover signaling early momentum recovery.
However, the larger trend remains capped under a descending resistance zone near $0.18–$0.20. Until that level is reclaimed, the current move remains a base-building phase rather than a confirmed breakout.
For Arbitrum, the next move will likely be dictated by a breakout from this structure. A sustained push above the $0.14–$0.15 region could open upside toward the $0.18–$0.20 resistance zone. On the downside, the $0.10 level remains critical. A breakdown below this base would invalidate the current accumulation narrative and expose ARB to further weakness.
Liquidation Data Signals Shift in Market Dynamics
Derivative data reinforces the evolving setup. During the downtrend, long liquidations dominated, reflecting forced exits and weak positioning. That dynamic is now changing.
Recent sessions show an increase in short liquidations, indicating that bearish positions are being squeezed as price stabilizes. This shift typically marks the early phase of a sentiment reset, where downside conviction begins to weaken. Meanwhile, open interest and trading volume remain stable, suggesting that new positions are being built gradually rather than driven by short-term speculation
Final Words
Arbitrum’s rapid response to the exploit has contained immediate risks, but the real signal lies in the market’s reaction. With price holding steady, accumulation forming, and short pressure easing, ARB appears to be transitioning out of its weakest phase.
If momentum continues to build and resistance levels are reclaimed, this phase could evolve into a broader reversal. For now, ARB remains in a critical zone, where stability could turn into strength, or hesitation could invite another leg down.
Ethereum (ETH) still appears range-bound on the chart, but the underlying data is starting to diverge in a meaningful way. Over the past week, more than 101,000 ETH has been accumulated, pushing large holdings close to 5 million ETH, while spot ETF inflows have now crossed $12 billion, with consistent capital entering the market. At the same time, Ethereum continues to hold firmly above the $2,300 level, showing sustained demand despite the absence of a breakout.
This kind of disconnect between price action and underlying flows rarely persists for long. When accumulation and institutional demand build while price remains compressed, it typically signals positioning ahead of expansion, not after it. If this divergence continues to develop, Ethereum’s next rally may not start with a visible trigger, it may already be forming beneath the surface.
Trend Structure Shifts as SuperTrend Flips Bullish
Ethereum’s broader trend structure has begun to turn, supported by a key technical signal. The SuperTrend indicator has flipped bullish on the daily timeframe for the first time in over a year, marking a shift in directional bias after a prolonged corrective phase. This transition is occurring while ETH is still trading below major resistance, which makes it structurally significant rather than reactive.
Such early trend reversals typically indicate that downside pressure has weakened and the market is entering a transition phase. When combined with stable price behavior, it often reflects the beginning of a new cycle rather than the end of the previous one.
Accumulation Expands as Large Holders Position Early
On-chain and treasury data show that accumulation is not only present but accelerating. BitMine added 101,627 ETH within a single week, pushing its total holdings to approximately 4.976 million ETH. This marks one of the largest accumulation phases recorded in recent months and reflects a clear increase in exposure from large players.
BITMINE ADDS 101,627 ETH IN ONE WEEK
BitMine’s total $ETH holdings have reached 4.976 MILLION after the latest accumulation. One of its biggest weekly accumulation since December 15, 2025. pic.twitter.com/aPJHAtsm9y
Accumulation is taking place while Ethereum remains within a defined range, rather than during a breakout. This indicates that buying is driven by positioning at current levels, not by momentum. Such behavior is typically associated with early-stage accumulation, where capital enters before broader market participation.
ETF Inflows Show Consistent Institutional Demand
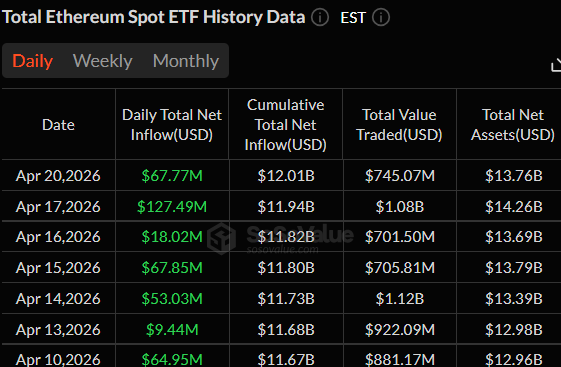
Institutional flows are reinforcing the same trend observed in accumulation data. Ethereum spot ETFs have now recorded $12.01 billion in cumulative inflows, with recent sessions showing steady capital entry. On April 20 alone, inflows reached $67.77 million, continuing a sequence of positive net flows following earlier volatility.
Total net assets have climbed toward $13.7 billion, reflecting sustained allocation rather than short-term interest. The shift from mixed flows to consistent inflows suggests that institutions are gradually increasing exposure under stable market conditions. This type of demand typically supports longer-term price structure rather than short-lived movements.
Ethereum Price Analysis: Structure Builds After Sharp Reset
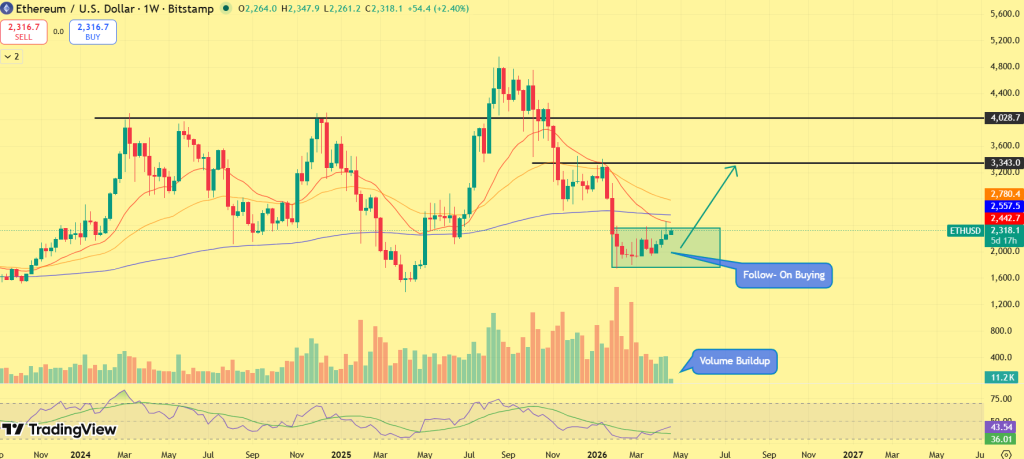
Ethereum’s recent price action reflects a clear shift from distribution to accumulation following a sharp downside reset. After failing near the $4,000–$4,500 resistance zone, ETH saw a strong breakdown that pushed price toward the $2,200–$2,000 region, where demand has now started to stabilize the structure.
Since the drop, ETH price has moved into a consolidation phase, holding above this base while forming a short-term range. However, during the consolidation, volume buildup indicates that participation is increasing even without a breakout. This type of behavior typically reflects absorption rather than selling pressure.
At the same time, the ETH/USDT price chart shows a developing “follow-on buying” zone, where higher lows are beginning to form after the initial rebound. This suggests that buyers are stepping in progressively, not aggressively, which is consistent with early-stage accumulation rather than late-stage momentum.
On the upside, the immediate level to watch sits near $2,800, which acts as a key resistance. A sustained move above this level would confirm strength and open the path toward $3,300, where the next supply zone is positioned. On the downside, the $2,200–$2,300 range remains critical. A breakdown below this zone would weaken the current structure and indicate that accumulation has not fully stabilized yet.
Overall, Ethereum is no longer in a corrective phase, but it has not transitioned into expansion either. The current structure reflects a base-building phase, where demand is gradually returning before any directional move unfolds.
Price predictions for 2026 range from $0.70 to $1.20.
ARB could extend toward $6 by 2030, if recovery structure holds.
Arbitrum (ARB), one of the leading Layer-2 scaling solutions on Ethereum, is currently navigating a phase where strong ecosystem relevance contrasts with prolonged price weakness. While the network continues to play a key role in DeFi and Layer-2 infrastructure, its price action has remained under sustained pressure.
Following an extended downtrend, ARB is now stabilizing near lower demand zones, suggesting that selling momentum may be gradually easing. However, the absence of strong upside movement indicates that the market remains in a transitional phase rather than a confirmed recovery.
This creates a critical question: is Arbitrum forming a long-term base after capitulation, or does the structure still reflect weak demand? With 2026 already underway, attention now shifts to whether ARB can reclaim key resistance levels and transition into a recovery phase. Read on as we break down Arbitrum’s April outlook and full-year price trajectory.
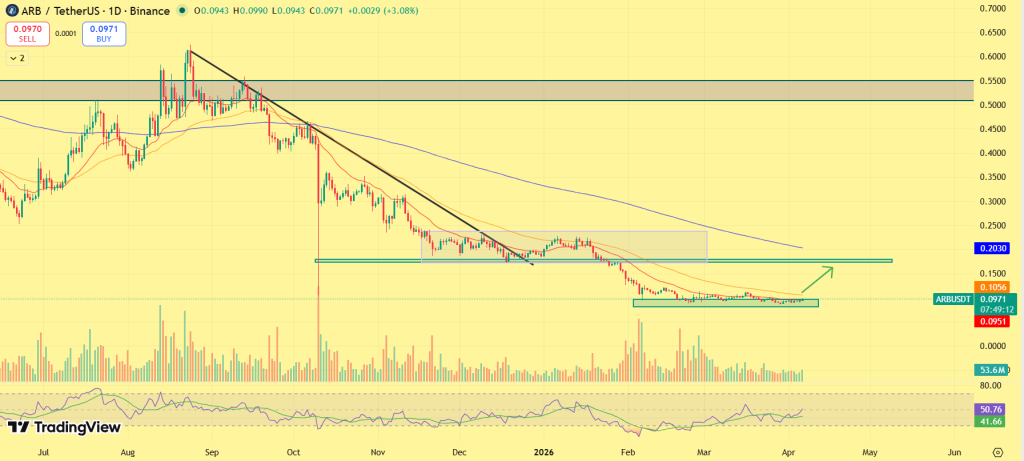
The broader outlook for Arbitrum in 2026 suggests a market transitioning from a prolonged downtrend into a potential recovery phase, with scope for a significant structural shift if key levels are reclaimed. Following its earlier cycle highs, ARB entered a sustained bearish phase throughout 2025, marked by a descending resistance structure and consistent lower highs. This trend extended into early 2026, eventually pushing the price into a deep value zone where it is now attempting to stabilize.
At present, ARB is forming a base near its lower demand region, indicating that downside pressure is gradually weakening. This phase typically reflects early accumulation, where long-term participants begin positioning ahead of a potential trend reversal.
Looking ahead, the primary objective for ARB is to reclaim its immediate resistance near $0.12, followed by stronger structural levels around $0.18 and $0.20. A breakout above these zones would signal a shift in market structure, opening the path for a broader recovery. If this recovery phase gains traction, supported by renewed liquidity, Layer-2 adoption, and ecosystem growth, ARB could gradually move toward the $0.70 to $1.20 range, representing a return toward higher valuation bands seen in previous cycles.
However, such a move would require sustained strength and confirmation across multiple resistance levels. Until then, the asset remains in a rebuilding phase, where failure to hold the $0.08 support could delay recovery and extend consolidation.
Arbitrum (ARB) News Update
The Arbitrum Security Council has taken emergency action to freeze the 30,766 ETH being held in the address on Arbitrum One that is connected to the KelpDAO exploit. The Security Council acted with input from law enforcement as to the exploiter’s identity, and, at all times,…
Based on the historic data and trend analysis of the cryptocurrency along with the market sentiments, here are the possible Arbitrum price targets for the longer time frames.
Year
Potential Low ($)
Potential Average ($)
Potential High ($)
2031
4.00
5.80
8.00
2032
5.00
7.30
9.80
2033
6.50
8.20
11.00
2040
9.00
13.00
20.00
2050
13.00
22.00
32.00
Arbitrum (ARB) Price Prediction: Market Analysis?
Year
2026
2027
2030
Changelly
$1.20
$2.40
$6.00
DigitalCoinPrice
$1.90
$2.60
$5.70
WalletInvestor
$25.60
$1.00
$5.20
Never Miss a Beat in the Crypto World!
Stay ahead with breaking news, expert analysis, and real-time updates on the latest trends in Bitcoin, altcoins, DeFi, NFTs, and more.
FAQs
What is the Arbitrum (ARB) price prediction for 2026?
In 2026, ARB is expected to trade between $0.70 and $1.20 if it holds key support and confirms a long-term recovery trend.
What is the ARB price prediction for 2030?
ARB price prediction for 2030 suggests a potential range between $4.60 and $7.00, assuming sustained adoption and market growth.
What is the Arbitrum price prediction for 2040?
Arbitrum price prediction for 2040 indicates a possible range of $9 to $20 if Ethereum scaling demand remains strong long term.
What is the Arbitrum price prediction for 2050?
Arbitrum price prediction for 2040 indicates a possible range of $9 to $20 if Ethereum scaling demand remains strong long term.
What could impact Arbitrum’s price the most?
ARB price is influenced by Ethereum activity, Layer-2 adoption, overall crypto market trends, and broader investor sentiment.
Is Arbitrum a good long-term investment?
Arbitrum shows long-term potential due to Ethereum adoption, but ARB remains volatile and best suited for investors with risk tolerance.
If demand for decentralized GPU infrastructure expands, RNDR could climb toward $18 by 2026.
With sustained growth in AI computing and Web3 infrastructure, Render could potentially reach $100 by 2030.
Render (RNDR), a leading decentralized GPU rendering network, is emerging as a key infrastructure layer in the rapidly expanding AI and digital content economy. Initially built to power distributed rendering for creators and studios, the network is now evolving into a broader compute marketplace, enabling scalable GPU access for AI workloads, 3D rendering, and real-time applications.
The recent transition to Render Network on Solana has significantly improved transaction efficiency and scalability, positioning the protocol to handle higher demand from both developers and enterprise users. At the same time, growing interest in AI-driven applications and GPU-intensive workloads is strengthening Render’s long-term utility narrative.
As demand for decentralized compute continues to rise, the focus for 2026 shifts toward adoption and network utilization. The key question remains whether Render can convert this expanding use case into sustained growth and price momentum, as the market increasingly values real-world infrastructure over speculative narratives.
This article delves into Render’s 2026 outlook and long-term price prediction, analyzing whether these catalysts can translate into a sustained breakout. Explore this Render price prediction 2026 and beyond, filled with expert insights and ambitious forecasts.
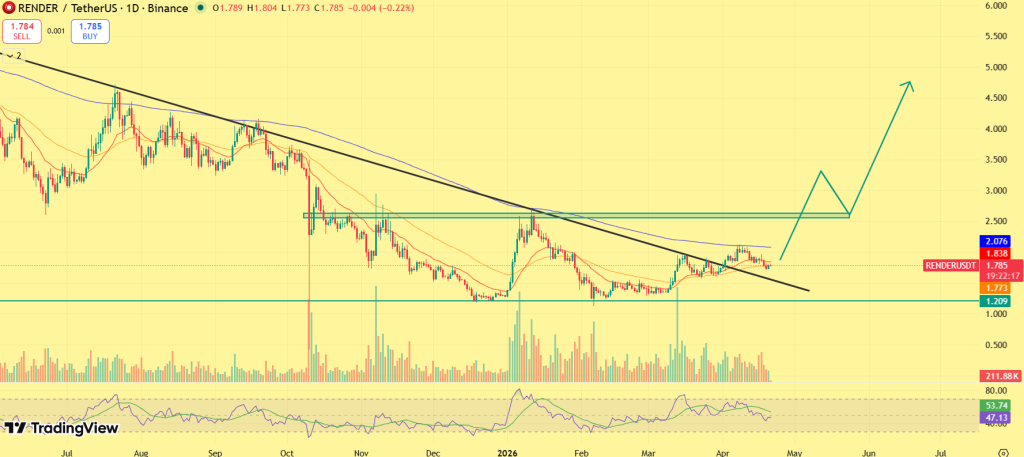
The short-term outlook for Render (RNDR) in April 2026 suggests a consolidation phase, where price action is stabilizing following recent volatility while attempting to build momentum for a broader breakout. Recent projections indicate that RNDR is likely to trade within a moderate range during April, with short-term targets clustered between the $2.0 and $2.50 zone, reflecting a period of base formation rather than aggressive expansion.
Render appears to be holding above key support levels, while gradually forming higher lows, an early indication of strengthening market structure. This suggests that selling pressure is easing, even as buyers remain selective. If RNDR manages to reclaim immediate resistance near the $3 level with sustained volume, it could trigger a short-term momentum shift toward the $4–$5 range, aligning with early-stage trend reversal conditions. However, failure to break above resistance may keep the price confined within a consolidation band, delaying further upside expansion.
Overall, Render is expected to trade within the $2 to $2.40 range, with breakout confirmation dependent on sustained strength above the $2 resistance zone.
Coinpedia Render (RENDER) Price Prediction 2026
The broader outlook for Render (RNDR) in 2026 reflects a transition phase, where the asset is attempting to rebuild momentum after a prolonged correction from its previous highs. Following its peak near the $13–$14 region, RNDR entered a consolidation structure, with price stabilizing around lower demand zones.
As 2026 progresses, the structure appears to be gradually shifting. RNDR is forming a base above key support zones, while improving fundamentals, particularly rising demand for GPU compute and AI workloads, are strengthening its long-term narrative. This suggests that the current phase may represent a foundation for the next major upward move.
If buyers continue to defend the accumulation range and push the price above critical resistance levels near $5–$7, it could trigger a broader trend reversal. In such a scenario, momentum expansion could accelerate toward the $10–$14 range, with a potential extension toward $16–$18 under a strong bullish cycle. However, failure to sustain above key breakout zones may delay this trajectory, keeping RNDR within a prolonged consolidation phase before a confirmed expansion.
Overall, Render is likely to trade between $5 and $18 this year, with upside dependent on sustained AI-driven demand, network adoption, and successful breakout above macro resistance levels.
RENDER News and Catalysts
AI Narrative Regains Momentum, Driving RNDR Rotation: Render is seeing renewed attention as capital rotates back into AI-linked crypto assets, with GPU infrastructure narratives gaining traction across the market, supporting RNDR’s positioning as a core decentralized compute layer.
Network Activity Stabilizes Alongside Developer Progress: Recent data points to steady development activity and consistent network usage, indicating that underlying adoption remains intact even as speculative interest cools, often a precursor to more sustainable price expansion.
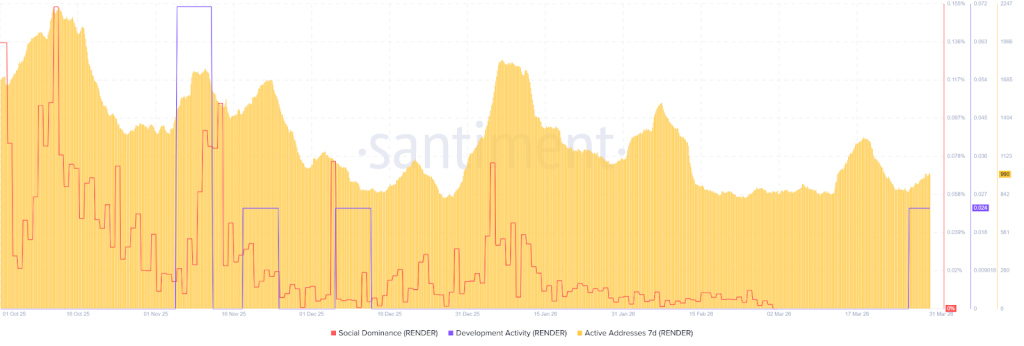
Render (RENDER) On-Chain Analysis
Render’s on-chain data reflects a constructive setup, where underlying network strength is stabilizing while speculative excess resets. Active addresses (7D) remain relatively steady despite recent price fluctuations, indicating that core network usage continues to hold. This consistency suggests that demand for Render’s GPU infrastructure is not purely speculative, but supported by ongoing utilization.
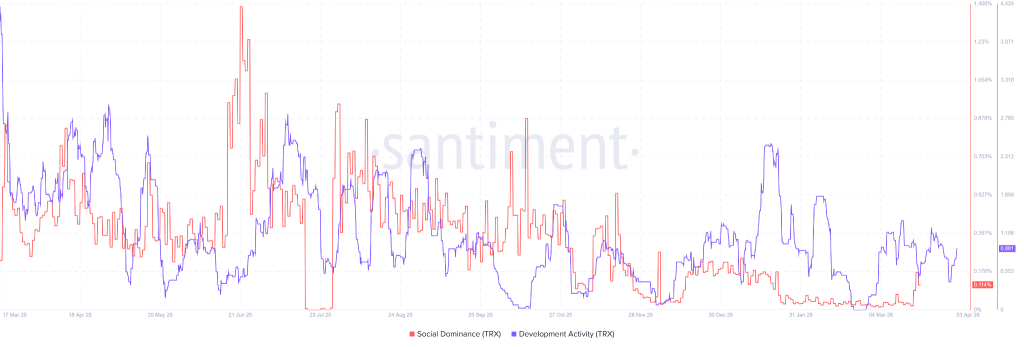
At the same time, development activity shows periodic spikes, highlighting continued protocol-level progress and active ecosystem development. Sustained builder engagement is a critical signal, particularly for infrastructure-focused projects where long-term value is driven by adoption and technological advancement.
Meanwhile, social dominance has trended lower compared to previous peaks, reflecting reduced hype-driven participation. This decline often marks the unwinding of speculative interest, creating conditions for more sustainable, fundamentally driven growth.
The combination of stable network usage, ongoing development momentum, and cooling social hype points toward a reset phase that typically precedes stronger, more sustainable expansion cycles.
Render appears to be transitioning from a hype-driven phase into a utility-backed growth cycle, where continued adoption and real-world demand for decentralized GPU compute could act as the primary drivers of its next upward move.
The long-term projection assumes Render sustains relevance in enterprise blockchain use cases, with growth moderating over time as the asset matures.
Year
Potential Low ($)
Potential Average ($)
Potential High ($)
2031
90
100
130
2032
120
170
200
2033
180
240
300
2040
250
360
450
2050
500
670
750
RNDR Price Prediction: Market Analysis?
Year
2026
2027
2030
Changelly
$6.20
$9.50
$18.00
CoinCodex
$10.00
$18.00
$22.00
Binance
$14.00
$20.00
$30.00
Never Miss a Beat in the Crypto World!
Stay ahead with breaking news, expert analysis, and real-time updates on the latest trends in Bitcoin, altcoins, DeFi, NFTs, and more.
FAQs
What is Render (RNDR) used for?
Render is a decentralized GPU network that lets creators and developers access distributed computing power for AI workloads, 3D rendering, gaming, and visual computing.
What is the Render (RNDR) price prediction for 2026?
Render could trade between $5 and $18 by 2026 if adoption of decentralized GPU computing and AI infrastructure continues expanding across blockchain and tech industries.
How much will Render be worth in 2030?
Render could trade between $62 and $100 by 2030 if decentralized GPU networks gain adoption and demand for AI computing infrastructure continues rising.
What is the RENDER Token price prediction for 2050?
By 2050, Render could potentially reach $500–$750 if decentralized GPU marketplaces remain relevant in AI, cloud computing, and Web3 infrastructure.
Is Render (RNDR) a good long-term crypto project?
Render is considered a strong infrastructure project because it connects unused GPUs with users needing computing power for AI, graphics, and metaverse development.
What factors could drive Render price growth?
RNDR price growth may depend on AI adoption, GPU demand, Web3 infrastructure expansion, and broader crypto market cycles increasing usage of decentralized computing.
Tron’s price 2026 target is $1.20, if breakout structure confirms above $0.50.
TRX’s 2030 projection toward $4 is possible, under a strong ecosystem and stablecoin growth.
TRON’s position in the current market cycle is increasingly being shaped by its dominance in real transactional activity, particularly as a primary settlement layer for stablecoins like USDT. With consistent on-chain demand, strong network revenue, and expanding global usage, TRON continues to stand out as one of the few networks where utility directly supports price stability. At the same time, its price structure is beginning to reflect that strength.
After an extended period of gradual upside, TRX is now holding near the $0.32–$0.33 range, consolidating just below recent highs rather than correcting sharply. This creates a setup where fundamentals and price action are starting to align. As TRON continues to benefit from strong network activity and steady demand, the focus now shifts to whether this consolidation phase can translate into further expansion.
With the market already progressing through 2026, the focus now shifts to whether TRON can sustain its network dominance while translating usage into continued price expansion. Read on as we break down TRON’s April outlook and TRX price prediction 2026-30.
TRON’s short-term structure reflects a steady consolidation phase, with the price holding firm after its recent upward move. Currently trading near the $0.31 region, TRX is maintaining support above key levels while testing resistance near the $0.34–$0.36 zone. This range remains critical in defining the next directional move. The formation of higher lows indicates underlying strength, suggesting that selling pressure is being absorbed.
A sustained breakout above $0.36 could open the path toward the $0.40–$0.45 range, signaling continuation of the broader trend. On the downside, failure to reclaim resistance may lead to extended consolidation, with support expected near $0.28–$0.30.
Coinpedia’s TRX Price Prediction 2026
TRON’s broader trajectory in 2026 is increasingly supported by a combination of sustained network activity and a price structure that continues to hold firm at higher levels. Unlike many altcoins that rely heavily on speculative cycles, TRX is being underpinned by consistent demand through stablecoin settlements, rising transaction volumes, and steady protocol revenue.
TRX price continues to consolidate near highs rather than retracing deeply, suggesting that buyers are actively defending higher levels while absorbing supply. This behavior typically precedes continuation, especially when supported by real usage rather than short-term sentiment.
The key progression now depends on how TRX expands from this base. A sustained move above the $0.35–$0.40 region would likely accelerate momentum, opening the path toward the $0.60–$0.80 range as the next phase of expansion. As higher levels begin to hold and participation increases, the structure can gradually transition into a stronger trending environment.
Under a sustained growth scenario, TRON could advance toward the $0.80–$1.20 range by the end of 2026, driven by continued network dominance, stablecoin activity, and increasing market participation.
Recent Catalysts for Tron (TRX)
TRON continues to lead in USDT transaction volume, reinforcing its role as a core settlement layer in the crypto economy.
Listing expansion and improved accessibility in regulated markets are gradually increasing institutional visibility and liquidity.
Strong on-chain revenue and rising user activity are highlighting TRON’s position as one of the few networks generating consistent real usage, not just narrative-driven demand.
TRX Long-Term Price Prediction 2026-2030
Year
Potential Low ($)
Potential Average ($
Potential High ($)
2026
0.80
1.00
1.20
2027
1.10
1.50
1.90
2028
1.80
2.30
2.80
2029
2.50
3.20
3.70
2030
3.20
3.60
4.00
TRON Coin Price Projection 2027
As per the Tron Price Prediction 2027, Tron may see a potential low price of $1.10. The potential high for Tron price in 2027 is estimated to reach $1.90.
TRON Crypto Price Forecast 2028
In 2028, the Tron price is forecasted to potentially reach a low price of $1.80 and a high price of $2.80
TRON Token Price Action 2029
Thereafter, the Tron (Tron) price for the year 2029 could range between $2.50 and $3.70.
TRON (TRX) Price Prediction 2030
Finally, in 2030, the price of Tron is predicted to maintain a steady positive. It may trade between $3.20 and $4.00.
Tron Price Prediction 2031, 2032, 2033, 2040, 2050
The long-term projection assumes Tron sustains relevance in enterprise blockchain use cases, with growth moderating over time as the asset matures.
Year
Potential Low ($)
Potential Average ($)
Potential High ($)
2031
3.50
4.30
5.20
2032
4.50
6.00
7.00
2033
9.00
11.00
15.00
2040
20.00
28.00
38.00
2050
80.00
110.00
150.00
Tron (TRX) Price Prediction: Market Analysis?
Year
2026
2027
2030
Changelly
$0.95
$1.50
$2.20
CoinCodex
$1.00
$1.80
$3.00
WalletInvestor
$1.50
$2.00
$3.50
Never Miss a Beat in the Crypto World!
Stay ahead with breaking news, expert analysis, and real-time updates on the latest trends in Bitcoin, altcoins, DeFi, NFTs, and more.
FAQs
What is the TRX price prediction for 2026?
TRX could trade between $0.80 and $1.20 in 2026 if it breaks above $0.50 and maintains strong stablecoin settlement growth.
What is the TRX Coin price prediction for 2027?
In 2027, TRX could trade between $1.10 and $1.90 if network growth continues and broader crypto market conditions remain favorable.
What is the TRX price prediction for 2028?
TRX may reach $0.94–$2.07 in 2028, with an average price of $1.50, driven by growing network usage and stablecoin dominance.
How high can TRX price go by 2030?
TRX may reach up to $4.00 by 2030 under strong ecosystem expansion, stablecoin dominance, and sustained crypto market growth.
What is the TRX price prediction for 2040?
By 2040, TRX could trade between $20 and $38 if global blockchain adoption expands and TRON remains a major settlement network.
What is the Tron price prediction for 2050?
In a strong long-term adoption scenario, Tron may range between $80 and $150 by 2050, assuming sustained utility and ecosystem growth.
Is TRX a good investment for the future?
TRX shows strong long-term potential, with projected growth through 2030, backed by real-world use in payments, stablecoins, and global adoption.
Can TRON (TRX) reach $1 in the next bull cycle?
Yes, TRX reaching $1 is possible if resistance flips to support and network activity, especially USDT transfers, keeps expanding.
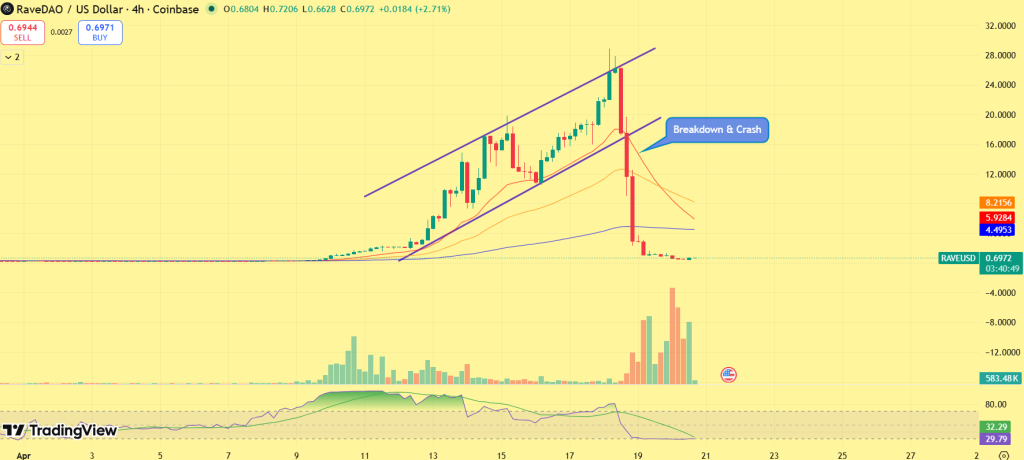
The RaveDAO (RAVE) token has recorded one of the sharpest reversals in recent cryptocurrency trading, plunging more than 100% within 48 hours after a rapid surge, wiping out billions of dollars in market value.
The token had climbed steeply toward the $27 level before reversing course in an equally aggressive sell-off. Liquidity thinned quickly during the downturn, with prices cascading lower as bids evaporated, according to market data.
The abrupt move has drawn industry attention, with major exchanges including Binance, Bitget, and Gate.io now under scrutiny over trading activity around the peak.
Blockchain investigator ZachXBT alleged that insiders may have used large exchanges to engineer a short squeeze, driving prices sharply higher before exiting near the top. The claims have intensified calls for transparency as analysts examine trading patterns during the rally.
Executives at the exchanges acknowledged the situation and said reviews are underway.
Bitget’s managing director, Gracy Chen, said the platform launched an internal investigation shortly after the crash. Binance CEO Richard Teng stated the exchange is reviewing activity and would take action against any “market misconduct.” Gate.io representatives said user protection remains a priority as inquiries continue.
RaveDAO has denied involvement in any coordinated activity. Meanwhile, ZachXBT has reportedly offered a $25,000 bounty for whistleblowers, suggesting further disclosures could emerge.
RaveDAO (RAVE) Price Analysis: Parabolic Rally Ends in a Liquidity Collapse
Market participants said RAVE’s price structure resembled a textbook blow-off top. The token surged rapidly on momentum-driven inflows, reaching the $25–$27 range before reversing within hours.
Once the rally stalled, liquidity deteriorated sharply. The lack of buy-side support triggered a cascade-style sell-off, pushing the token back toward sub-$1 levels.
Analysts note that significant overhead supply now remains. Any short-term recovery could face resistance between $3 and $5, with stronger barriers near $8–$10 where previous trading activity was concentrated.
On the downside, holding above $1 is seen as critical. A sustained break below that level could push the token into deeper illiquid territory.
Multiple factors behind the collapse
Post-crash analysis suggests the move was driven by a combination of factors rather than a single trigger.
The rally appeared to be fueled by low float and speculative inflows, creating conditions for a short squeeze that forced bearish traders to cover positions. However, once upward momentum faded, long positions began unwinding, triggering a reverse liquidation cycle.
This feedback loop, combined with thin liquidity, amplified the speed and scale of the decline.
Market Impact and Outlook: Confidence Shaken, Uncertainty Remains
The episode has raised broader concerns about market integrity in low-liquidity tokens, particularly given the speed of the move and allegations of manipulation.
With exchanges continuing to review trading activity, sentiment remains cautious. Analysts say any near-term price rebounds are likely to be corrective unless key resistance levels are reclaimed with strong volume.
For now, uncertainty dominates the outlook, with both price action and the results of ongoing investigations expected to shape the token’s next move.
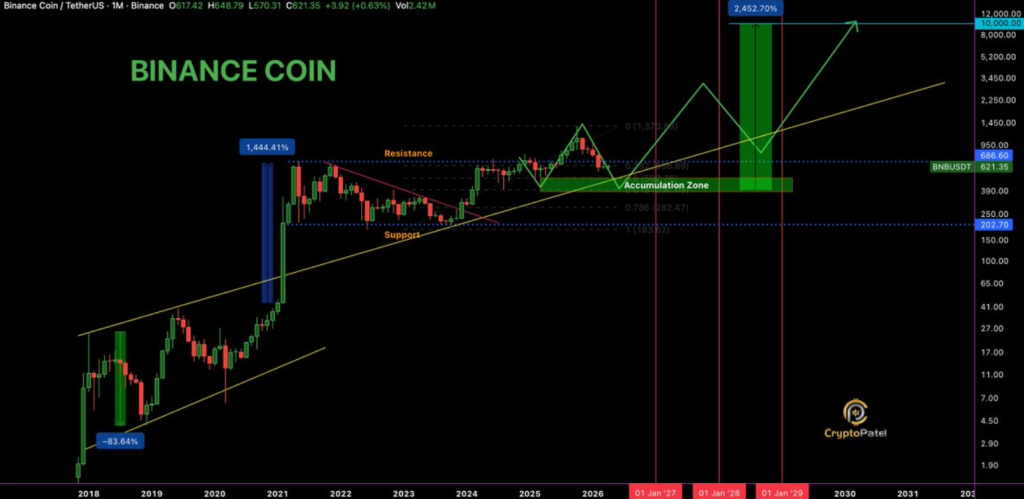
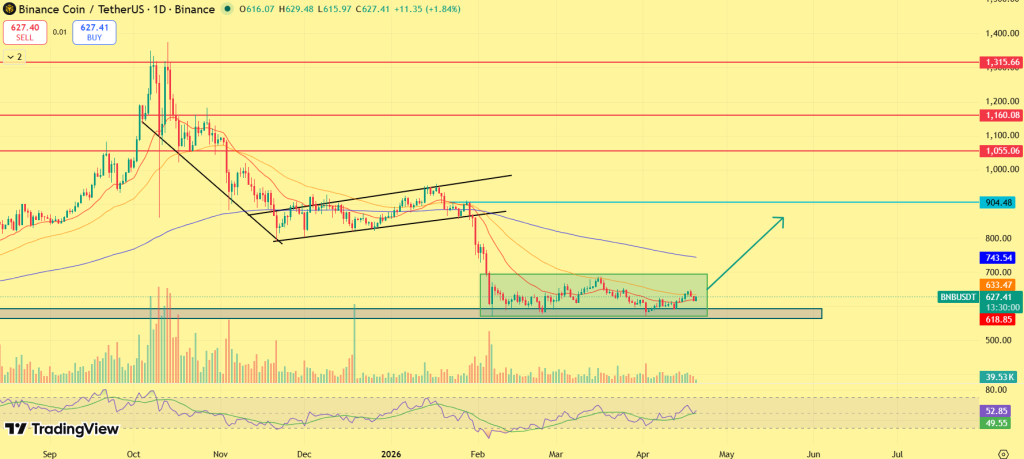
BNB price has once again entered a “boring zone”- a phase where price slows down and momentum fades, but this is exactly where its biggest rallies have started in the past. Currently trading near the $630 level, BNB is moving sideways after a correction, showing stability rather than weakness. At the same time, supply is tightening following a $1 billion token burn, while on-chain data points to continued accumulation.
In previous cycles, similar phases have preceded sharp upside expansions, making the current setup critical. The key question now is whether this quiet consolidation is once again setting the stage for a breakout toward $900, or if BNB price will remain stuck in this range.
Analyst Insight: Why This ‘Boring Zone’ Matters for BNB
A recent analysis from crypto analyst highlights a pattern that many traders often overlook. In the previous cycle, BNB price moved sideways for a long period before suddenly rallying over 1,444%, a move that began when market interest was still low.
The idea is simple. During these quiet phases, price does not move much, which makes it look weak. But in reality, this is where buying happens slowly in the background, while sellers get exhausted. Analyst shows a similar structure forming again. BNB is currently trading in a tight range around $600–$650, holding support and showing no major breakdown despite low momentum.
This type of setup usually means the market is building a base, not topping out. Once enough supply is absorbed, price tends to move sharply as demand returns. In that context, the current “boring zone” is not a sign of weakness, it may be the phase where BNB prepares for its next strong move, just like it did in the past cycle.
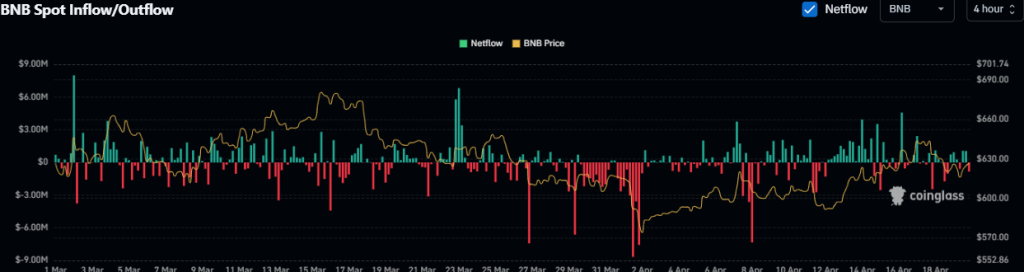
BNB Supply Dynamics Strengthen: Burn and Outflows Support the Base
BNB’s ability to hold firmly near the $600 support zone is being reinforced by underlying supply trends. The network recently completed its 35th quarterly burn, removing around 1.57 million BNB worth over $1 billion from circulation. This has reduced total supply to nearly 134.79 million BNB, continuing its long-term deflationary path toward 100 million tokens.
At the same time, on-chain data shows consistent negative spot netflows, meaning more BNB is being withdrawn from exchanges than deposited. This typically reflects investor accumulation, as assets are moved into holding rather than being prepared for selling.
Even during recent consolidation, outflows have remained steady, indicating that buyers are actively absorbing supply rather than exiting positions. Together, these dynamics, shrinking supply and reduced exchange liquidity, help explain why BNB continues to hold its base, while also supporting the case for a stronger move once demand returns.
Key Levels to Watch: Structure Holds, Breakout Zone Near
BNB price continues to trade within a tight $600–$650 consolidation range, holding firm above its key demand zone while volatility remains compressed. The price action suggests a base formation, where downside attempts are being absorbed and buyers are gradually stepping in.
On the upside, a move above $700 would signal early strength, while a confirmed breakout above $740 could accelerate momentum toward $850–$900. On the downside, the $600 level remains critical. A breakdown below this zone would weaken the structure and may push price back toward the $560–$520 range, delaying any bullish continuation.
With this setup, BNB price can remain range-bound in the near term, but a breakout above resistance is likely to trigger a stronger upside move if momentum follows through.
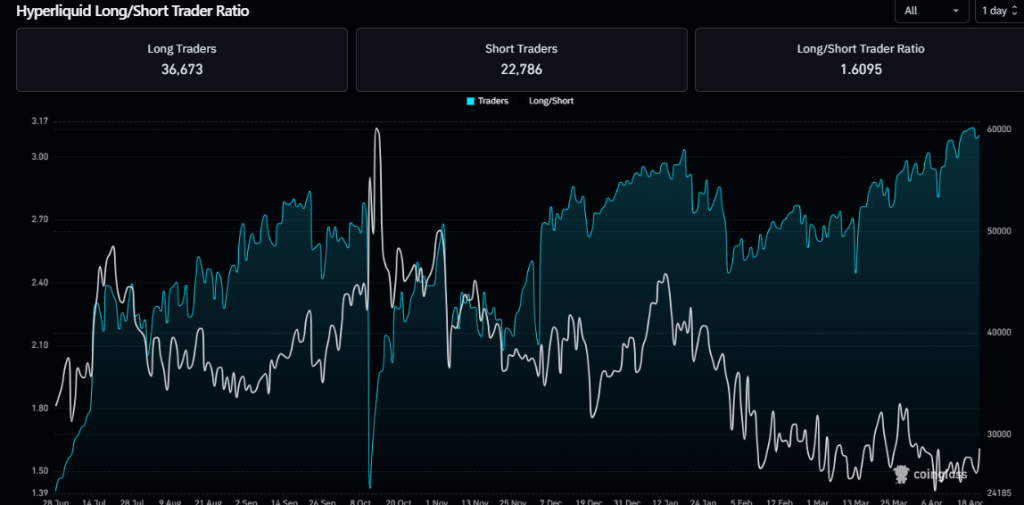
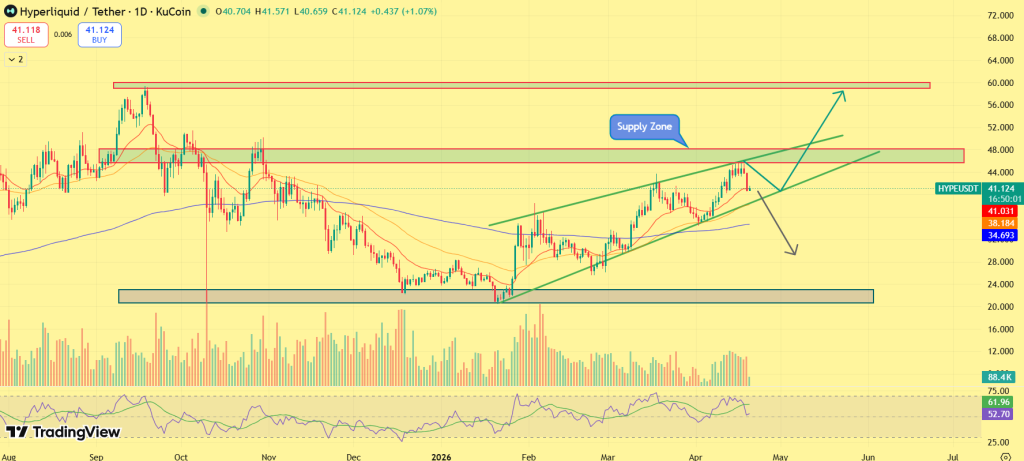
Hyperliquid (HYPE) is at a decisive inflection point after a sharp rejection from the $50 supply zone, and the next move could be extreme on either side. The token has already slipped nearly 5%, signaling early weakness, yet derivatives data still shows a long-heavy market, raising the risk of a squeeze in either direction. At the same time, liquidation clusters are building both above and below current price, setting up a high-volatility breakout scenario.
With structure tightening, HYPE now faces a critical question: Can bulls reclaim momentum and drive a move toward $60, or is a deeper breakdown toward $20 starting to take shape? Read the HYPE price outlook below for more clarity.
Derivatives Positioning: Crowded Longs Raise Risk
Derivatives data shows a long/short ratio of 1.60, with approximately 36,673 long traders vs 22,786 short traders. This indicates a clear bullish bias in positioning. However, such imbalances often create instability. When longs dominate, the market becomes vulnerable to liquidation cascades, especially if price fails to move higher.
Funding sentiment and positioning suggest that traders are already betting on continuation, which reduces upside surprise and increases the probability of a contrarian move or shakeout before any sustained rally.
Hyperliquid Price Analysis: What’s Next for HYPE?
HYPE’s recent price action shows a clear ascending structure, where higher lows continue to form despite repeated rejections from the $48–$50 supply zone. This indicates that buyers are still active, but lack the strength to break overhead resistance, a classic compression setup.
HYPE price is currently trading around the $40–$41 region, sitting right above a rising trendline support. This trendline has acted as a dynamic accumulation zone over the past few weeks, with buyers consistently stepping in on dips. However, the token price remains above the short-term EMAs (20/50), which are now flattening, signaling a transition from impulsive rally to consolidation. However, the 200 EMA still lies above near $48–$50, reinforcing the strength of the supply zone.
If bulls manage to reclaim this zone with volume confirmation, the structure opens up a clean breakout path toward $55–$60, aligning with previous distribution levels. On the downside, a breakdown below the ascending trendline and loss of $38–$35 support would invalidate the bullish structure, exposing a deeper retracement toward the $28–$20 demand zone, where previous accumulation occurred.
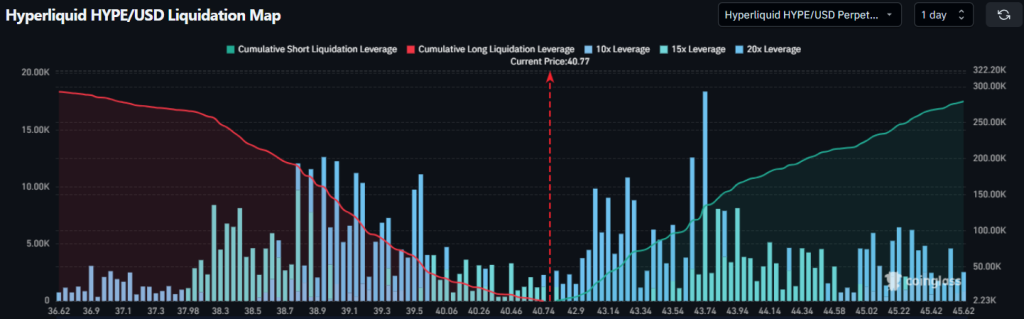
Liquidation Map: Volatility Trigger Zones Identified
Liquidation data provides a clearer view of where the next move could accelerate. On the downside, a significant cluster of leveraged positions is stacked below $38–$35, meaning a breakdown into this zone could trigger forced liquidations, accelerating selling pressure. This aligns with the structural breakdown level on the chart.
On the upside, liquidity is concentrated above $45 and extending toward $50, where short positions and trapped sellers may get liquidated if price breaks out. This creates a liquidity magnet effect, pulling price toward that zone in case of strength. Notably, the liquidation map shows a balanced distribution on both sides, confirming that the market is in a neutral but fragile state, typically seen before large directional moves.
This setup increases the probability of a liquidity sweep first, followed by the actual trend move, meaning traders should expect volatility spikes before confirmation.
Final Take: Market Nears a Decisive Move
HYPE is approaching a critical phase where the current consolidation is unlikely to sustain for long. The combination of tightening price structure, long-heavy positioning, and visible liquidity clusters suggests that a directional move is building.
A sustained push above the $48–$50 supply zone would confirm strength and open the path toward $55–$60, backed by momentum and short covering. On the other hand, a breakdown below $38–$35 support would weaken the structure and increase the probability of a deeper move toward $28–$20 demand levels. The next confirmed move will likely set the tone, not just for the short term, but for HYPE’s broader trend ahead.
HBAR price prediction for 2026 suggests potential highs of $1.05
Long term forecasts indicate HBAR could reach $2.20 by 2030.
Hedera has been making waves in the cryptocurrency space, with a fast and secure blockchain that offers a distinct approach to transaction processing compared to Ethereum and other smart contract chains. It’s permission-only, meaning the blockchain is managed by private companies. Limiting what types of decentralised applications are allowed is what makes Hedera stand out from the rest.
Having entered the top 20 digital assets by market cap in 2024, it is now eyeing a potential leap into the top 10 by the end of 2025. Hedera has also recently ramped up its development activities for its ecosystem. Its ecosystem is strengthening, despite its capped price action. With increasing real-world use cases, institutional interest, and strategic partnerships, many are closely tracking HBAR price chart 2025 to gauge how high the token can rise.
With major companies like Google, IBM, and Chainlink Labs backing the project, and discussions about SEC approved HBAR ETF would flood string liquidity. Many are intrigued that: Will the HBAR Price Reach $1? Let’s discuss this in our Hedera price prediction 2025 article.
As April progresses, HBAR’s price action reflects a market that has been stabilizing after a prolonged corrective phase, with price now holding around the $0.085–$0.09 support zone. Following months of downward pressure and consistent lower highs, the token is beginning to show early signs of base formation, indicating that selling momentum is gradually weakening.
HBAR is currently trading within a tight consolidation range, with price compressing just below short-term resistance while holding firm above key support. This narrowing range suggests that the market is preparing for a directional move, as volatility declines and participation begins to build.
The immediate focus now shifts to the $0.10–$0.11 region. A sustained move above this resistance band would signal a breakout from the current consolidation structure, opening the path toward the $0.13–$0.15 range, where previous supply zones may come into play. If momentum strengthens alongside broader market support, the move could extend further toward $0.18.
However, the structure still requires confirmation. If HBAR fails to reclaim resistance and faces rejection, the price may continue to consolidate within the current range. A breakdown below the $0.085 support could weaken the setup, potentially pushing the asset toward lower levels near $0.075 and delaying recovery.
In this context, HBAR in April may reach the $0.13–$0.15 range if a breakout sustains, while failure to build strength above resistance could keep the price range-bound as the market continues to form a base.
Recent Catalysts For HBAR
Strengthening enterprise narrative, with continued traction from global corporations and governing council expansion, reinforcing Hedera’s long-term institutional positioning.
Rising trading volume and steady price stability near key support suggest early accumulation, indicating that smart money may be positioning ahead of a potential move.
Improving broader market sentiment and capital rotation toward utility-driven altcoins are creating a supportive backdrop for HBAR’s recovery phase.
Coinpedia’s Hedera (HBAR) Price Prediction 2026
Heading deeper into 2026, Hedera is likely to move through a recovery cycle rather than an immediate breakout phase. The current structure suggests that the market is gradually shifting from accumulation toward early expansion.
The first important level to watch is the $0.20–$0.25 range, which previously acted as a major resistance zone. Reclaiming this level would signal that HBAR has moved beyond its base formation and entered a recovery phase. Once this level is secured, the price could move toward $0.40–$0.50, where stronger selling pressure may appear. This zone will act as a key test of whether the recovery has enough strength to continue.
If the broader market enters a bullish phase and enterprise adoption within the Hedera ecosystem continues to expand, HBAR could gradually build momentum. In a favorable scenario, HBAR could reach around $0.65 by 2026, reflecting a structured recovery rather than a sharp rally.
The long-term projection assumes Hedera sustains relevance in enterprise blockchain use cases, with growth moderating over time as the asset matures.
HBAR Price Prediction 2026 – 2030
Year
Potential Low ($)
Potential Average ($
Potential High ($)
2026
0.45
0.80
1.05
2027
0.65
1.00
1.20
2028
0.80
1.10
1.60
2029
0.90
1.60
2.20
2030
1.40
2.20
3.00
HBAR Price Prediction 2026
Moving forward to 2026, forecast prices and technical analysis project that Hedera’s price is expected to reach a minimum of $0.45. The price could escalate to $1.05 on the higher end, with an average trading price hovering around $0.80.
HBAR Price Forecast 2027
Looking ahead to 2027, the optimism around Hedera will lead to steady growth. Hence, the HBAR price is forecasted to reach a low of $0.65, with a potential high touching $1.20 and an average forecast price of $1.00.
Hedera Price Forecast 2028
As we advance to 2028, with moderate gains, the HBAR predictions indicate that the price of a single HBAR could reach a minimum of $0.80, with the ceiling potentially rising to $1.60. Within the range, the average price will be $1.10.
HBAR Price Target 2029
By the time 2029 rolls around, it’s predicted that Hedera’s price will maintain its upward trajectory, reaching a minimum of $0.90, with the maximum price possibly reaching $2.20 and an average of $1.60, reflecting cautious optimism.
Hedera Price Prediction 2030
By the end of this decade, HBAR is predicted to touch its lowest price at $1.40, aiming for a high of $3.00 and an average price of $2.20. Hence, the prediction suggests stable long-term growth for Hedera’s market value.
LINK price prediction for 2026 suggests potential highs of $65
Long-term forecasts indicate LINK could reach $200 by 2030.
Chainlink (LINK), the leading decentralized oracle network, is entering a phase where expanding fundamentals are beginning to align with a developing technical structure. As adoption accelerates across real-world asset (RWA) tokenization, cross-chain interoperability, and institutional integrations, the network continues to strengthen its position as a core infrastructure layer within the blockchain ecosystem.
Despite this progress, LINK remains priced near the $9 level, significantly below its previous cycle highs, indicating that the market may still be in an accumulation phase. From a technical standpoint, price action is stabilizing above key support, while resistance near the $12–$15 range continues to cap upside momentum.
Looking ahead to 2026, the key consideration is whether Chainlink can translate its expanding utility into sustained demand, with a confirmed move above resistance likely to signal the beginning of a broader trend reversal. Here, we take a closer look at Chainlink’s price prediction for 2026 and beyond, assessing whether its growing role in blockchain infrastructure can drive a sustained breakout.
Chainlink’s short-term outlook for April 2026 reflects a consolidation phase, with price stabilizing around the $9 level while attempting to build a base above immediate support. Despite improving fundamentals, LINK continues to face resistance in the $10–$12 range, which remains a key zone for momentum confirmation.
The formation of higher lows suggests early signs of stabilization, although a sustained breakout has yet to materialize. A move above $12, supported by stronger participation and volume, could shift momentum toward the $14–$16 range, marking an early-stage trend reversal. On the downside, failure to reclaim resistance may keep LINK range-bound, with support expected near the $8 level.
Overall for April 2026, LINK is likely to trade within the $8 to $16 range, with breakout confirmation dependent on sustained strength above $12.
LINK Recent News and Catalysts
CCIP adoption is accelerating, with growing institutional integrations reinforcing Chainlink’s role in cross-chain and RWA infrastructure.
On-chain volume via CCIP is rising, signaling increasing real-world usage of Chainlink’s interoperability layer.
New data integrations across DeFi and exchanges are strengthening Chainlink’s position as a core on-chain data provider.
Coinpedia’s Chainlink Price Prediction 2026
Chainlink’s 2026 trajectory is increasingly tied to its ability to convert expanding network utility into sustained demand and capital inflows. LINK remains in a recovery phase, with price still trading below key macro resistance zones despite strengthening fundamentals. The network’s growing role in real-world asset (RWA) tokenization, cross-chain interoperability, and institutional integrations provides a strong foundation, but market confirmation remains dependent on price reclaiming higher levels.
In a bullish scenario, where adoption of Chainlink’s infrastructure, particularly CCIP and oracle services, continues to scale alongside broader market expansion, LINK could advance toward the $50 to $65 range, aligning with previous cycle valuations and renewed capital inflows.
A base-case outlook assumes gradual adoption growth without aggressive market expansion, positioning LINK within the $25 to $55 range over the course of the year. In a downside scenario, where market conditions weaken or adoption growth slows, LINK may remain range-bound below $35, extending its consolidation phase despite improving fundamentals.
Chainlink Crypto Price Prediction 2026– 2040
Year
Potential Low ($)
Potential Average ($
Potential High ($)
2026
35
50
65
2027
70
80
95
2028
75
85
120
2029
80
110
150
2030
120
170
200
2035
250
350
450
2040
400
520
650
Chainlink (LINK) Price Prediction 2026
As per Chainlink’s Price forecast for 2026, the high price could be $55, the low may reach $35. This makes the average around $50.
LINK Price Prediction 2027
Moving to 2027, the LINK Price projects that it might hit a high price of $95 potentially. With a $70 low and an average of $80
Chainlink Price Analysis 2028
Moving to 2028, the Chainlink Price Forecast predicts a high price of $104. On the flip side, the low may fall to $58, and the average is projected to be around $85.
Chainlink Price Forecast 2029
As per Chainlink Price Forecast 2029, LINK’s high price is predicted to be $150, with a low of $80 and an average of $110.
Chainlink Price Prediction 2030
Finally, as per the Chainlink Price Forecast 2030, LINK’s price can reach a high price of $200. With a low of $120 and an average of $170.
LINK/USD Price Prediction 205
As per Chainlink Price prediction 2035, LINK’s high price is predicted to be $450, with a low of $250 and an average of $350.
Chanlink (LINK) Price Targets 2040
Finally, as per the Chainlink Price Forecast 2040, LINK’s price can reach a high price of $650. With a low of $400 and an average of $520.
Chainlink (LINK) On-Chain Analysis
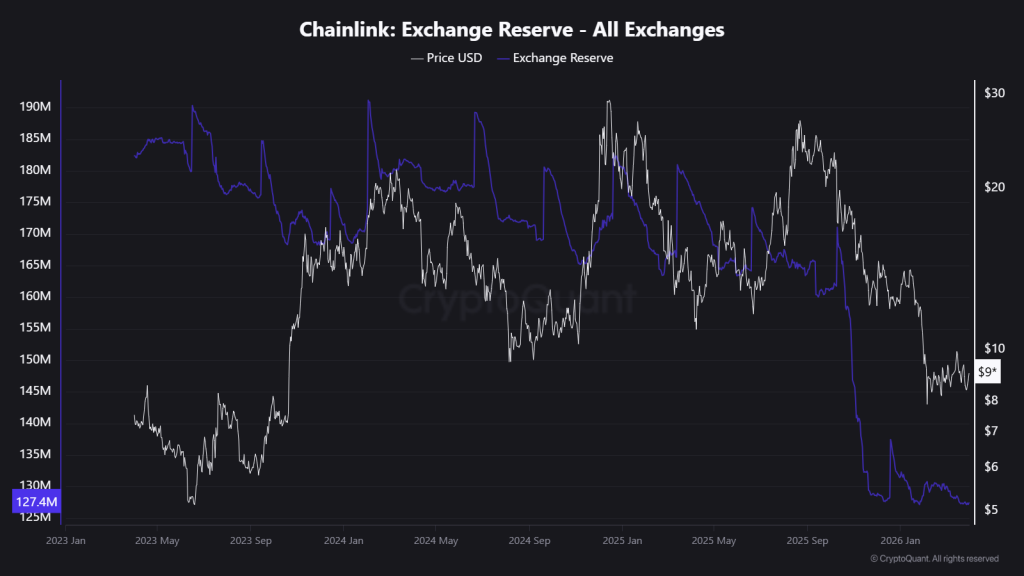
Chainlink’s on-chain metrics are increasingly pointing toward a tightening supply environment, supported by sustained exchange outflows and elevated whale activity.
Data on exchange reserves shows a persistent decline in LINK balances held across trading platforms, suggesting that tokens are being systematically moved into off-exchange storage. This trend is typically associated with reduced immediate sell-side liquidity and a shift toward longer-term holding behavior.
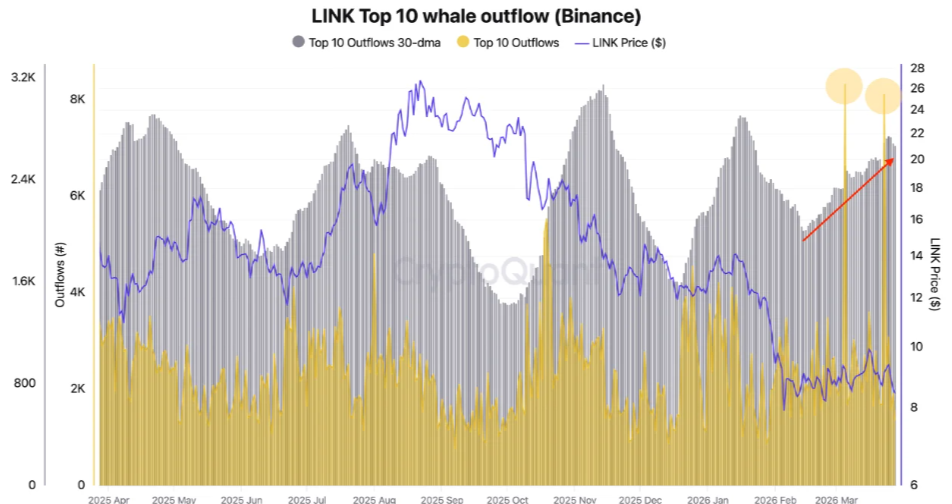
In parallel, whale outflows, particularly from major venues such as Binance, have intensified, with large transactions indicating active repositioning by high-value participants. These flows are generally interpreted as accumulation, especially when occurring alongside declining exchange reserves.
The interaction between these metrics highlights a contraction in available supply within the liquid market, while ownership appears to be consolidating among larger holders. Such conditions often precede periods of price expansion, provided that demand-side catalysts emerge.
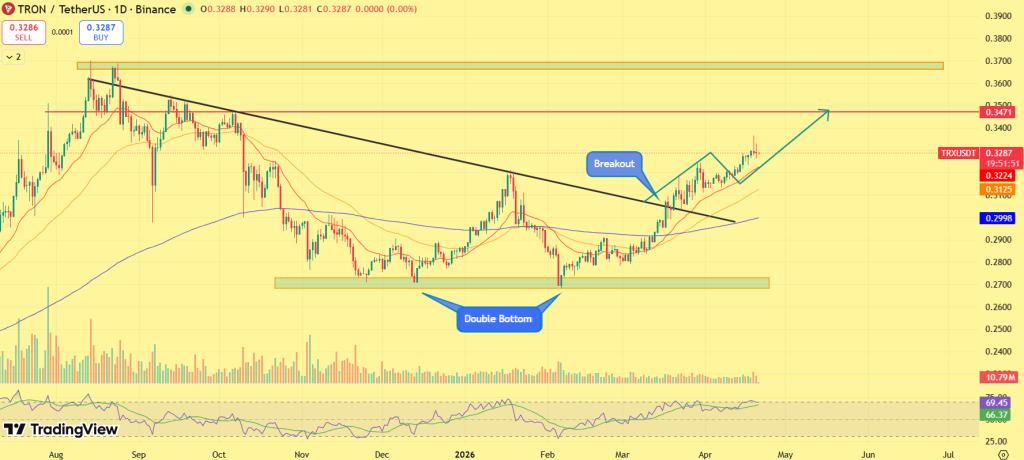
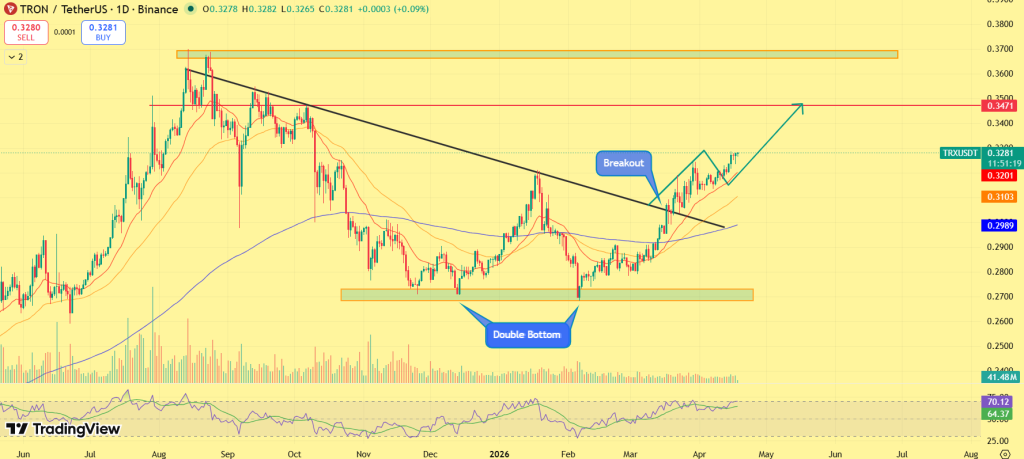
TRON is holding a bullish structure after confirming a breakout above its descending resistance, with price now sustaining above key levels. Following the breakout, TRX price continues to trade steadily above the $0.30 zone, forming consistent higher lows rather than sharp volatility. This controlled price action reflects ongoing accumulation, with buyers maintaining strength across sessions.
At the same time, strong network performance, highlighted by $826.9 million in Q1 revenue, is reinforcing the underlying demand. The key question now is whether this steady structure can translate into a sustained move higher.
TRON’s latest data highlights a strong fundamental backdrop supporting the current price structure. The network generated approximately $826.9 million in Q1 2026 revenue, placing it among the top blockchain ecosystems in terms of real usage. This growth is largely driven by stablecoin transfers, transaction volume, and consistent activity across decentralized applications.
At the same time, development activity remains stable, while social dominance has cooled, indicating reduced speculative noise. This combination reflects a low-hype, high-utility environment, where demand is driven by actual usage rather than short-term sentiment. Such conditions typically support price stability and accumulation phases.
TRX Price Analysis: Breakout Holds as TRX Forms Higher Lows
TRX price structure has shifted from a downtrend into a recovery phase. After forming a double bottom near $0.27–$0.28, the price established a strong demand base, preventing further downside. The key structural shift came with a breakout above the descending trendline, signaling weakening selling pressure.
Since the breakout, TRX has not shown aggressive upside but instead continues to form higher lows above $0.30–$0.31, reflecting controlled accumulation. This type of movement indicates sustained buying rather than speculative spikes. Short-term EMAs are gradually trending upward, supporting the current structure. As long as TRX holds above the breakout zone, the trend remains intact.
On the upside, immediate resistance lies near $0.34–$0.35, and a sustained move above this range could open the path toward $0.38, the next major supply zone. A breakdown below $0.30 would weaken the bullish structure and signal loss of momentum.
Final Take
TRON is maintaining a steady post-breakout structure, supported by both strong fundamentals and improving technicals. With price holding above key levels and network growth remaining strong, the setup favors continuation as long as support is maintained.
A move above $0.35 would confirm further upside potential, while holding above $0.30 remains critical. At this stage, TRX is positioned in a controlled accumulation phase within a bullish structure, with the potential to extend higher if momentum sustains.
Chainlink is approaching a decisive phase as on-chain activity begins to rise near a critical price zone. After an extended correction, LINK is now holding firm above key support while exchange outflows increase. With price stabilizing and structure tightening, the market is entering a phase where a directional move becomes more likely.
On-Chain Data Shows Supply Reduction and Accumulation
Recent on-chain activity highlights a clear shift in supply dynamics. More than 257,000 LINK tokens (~$2.45M) have been withdrawn from Binance within a short period. Such movements typically indicate that tokens are being transferred to private wallets, reducing immediate sell-side liquidity. Alongside this, whale wallets have accumulated nearly 200,000 LINK (~$1.8M), suggesting that larger participants are positioning within the current price range.
At the same time, network activity and development metrics remain stable, indicating that the decline in price has not been driven by weakening fundamentals. This combination reflects a supply contraction phase supported by steady underlying activity, which is often observed during accumulation periods.
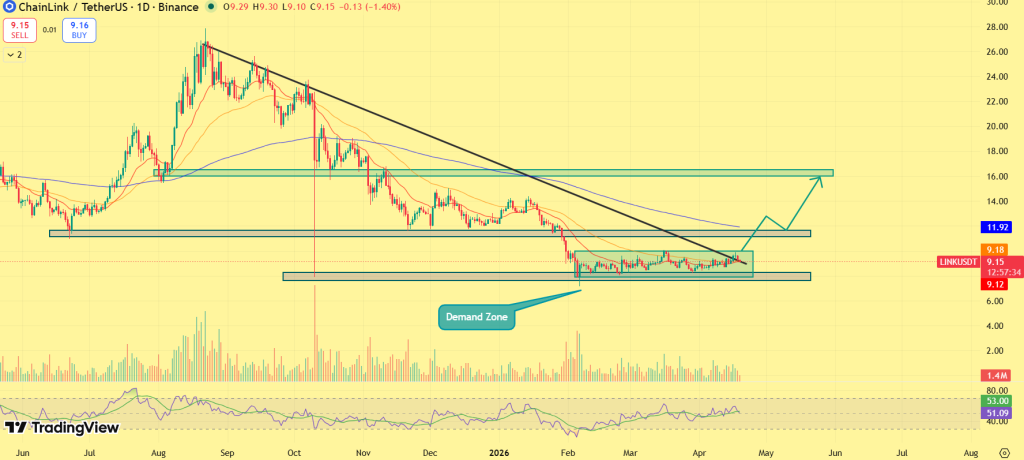
LINK Price Analysis: Downtrend Exhaustion Followed by Base Formation
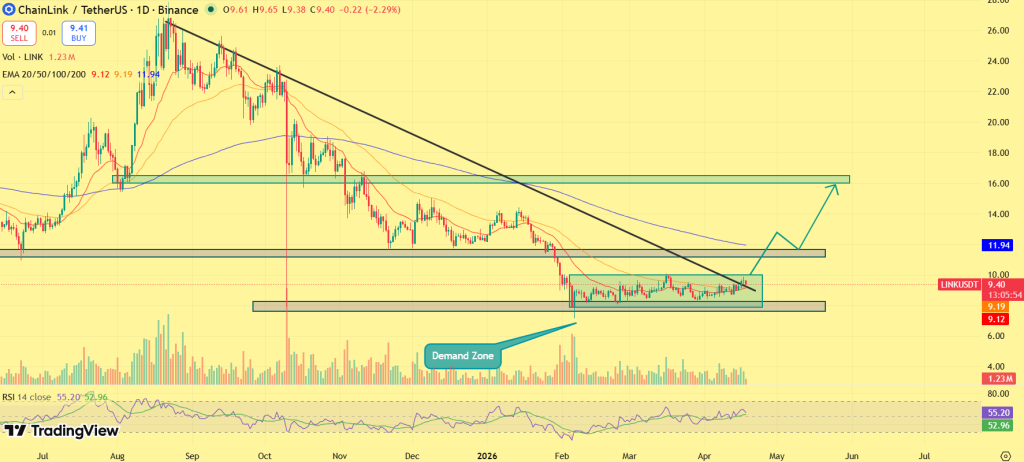
LINK’s price structure shows a clear transition from a trending phase to stabilization. After a prolonged decline, price has stopped forming lower lows and is now consolidating within the $9.0–$9.5 demand zone. Multiple attempts to break below this range have failed, confirming strong buyer presence.
The broader structure still reflects a descending trendline resistance, which continues to cap upside movement. However, price is now compressing between this resistance and the demand zone, forming a tightening range. Moreover, the short-term EMAs remain below price but are flattening, indicating that bearish momentum is weakening. This creates a compression structure, where volatility contracts before expansion.
A sustained move above the $11.5–$12 resistance zone would confirm a structural shift, potentially opening a move toward the $15–$16 range, which aligns with the next supply zone. On the downside, a breakdown below $9.0 would invalidate the base formation and expose lower levels.
Final Words
Chainlink is holding a key structural support while on-chain data reflects reduced exchange supply and steady accumulation. LINK price remains within a consolidation range, with resistance still intact. A move above $12 is required to confirm a shift in trend, while holding above $9.0 remains critical. At this stage, LINK is forming a base within a broader corrective structure, with accumulation visible but breakout confirmation still pending.
HBAR is flashing early reversal signals just as momentum begins to build around its institutional narrative. After months of sustained downside, the token is now stabilizing within a key demand zone, with price action tightening and downside pressure fading.
At the same time, Hedera’s growing traction among enterprise players like Google and IBM is bringing the asset back into focus, aligning fundamentals with a shifting market structure. With broader crypto sentiment showing early recovery signs, HBAR is starting to re-enter the spotlight, and the current HBAR price outlook suggests that a decisive move could be closer than expected.
Big Data Narrative: Institutional Layer Supports Base Formation
Hedera’s positioning within the enterprise ecosystem continues to differentiate it from purely speculative assets. The network’s association with major players such as Google and IBM reflects ongoing development around real-world use cases, particularly in areas requiring high throughput and low-cost infrastructure. This creates a fundamental layer of demand that remains intact even during price weakness.
As market conditions stabilize, capital typically rotates toward projects with visible adoption and institutional alignment. HBAR’s current price stabilization near its demand zone coincides with this narrative, suggesting that accumulation may be driven by longer-term positioning rather than short-term speculation.
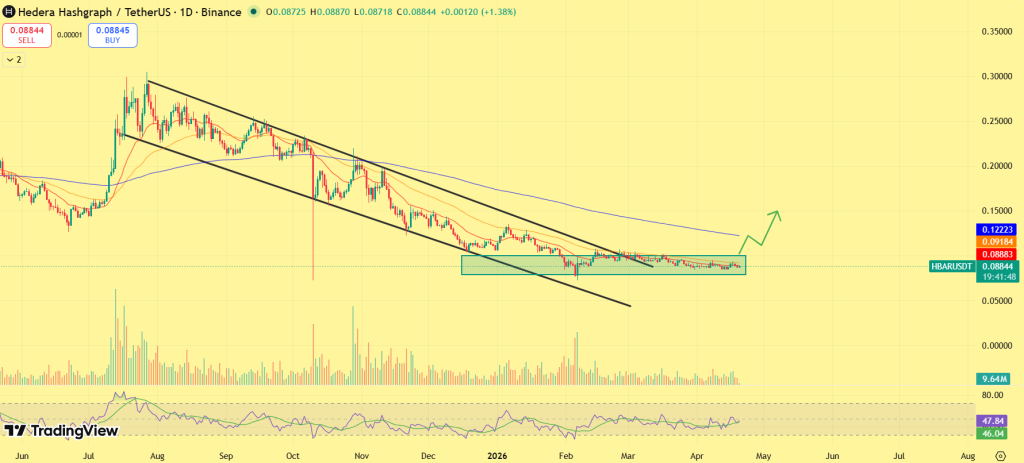
HBAR Price Analysis: Downtrend Exhaustion With Early Breakout Setup
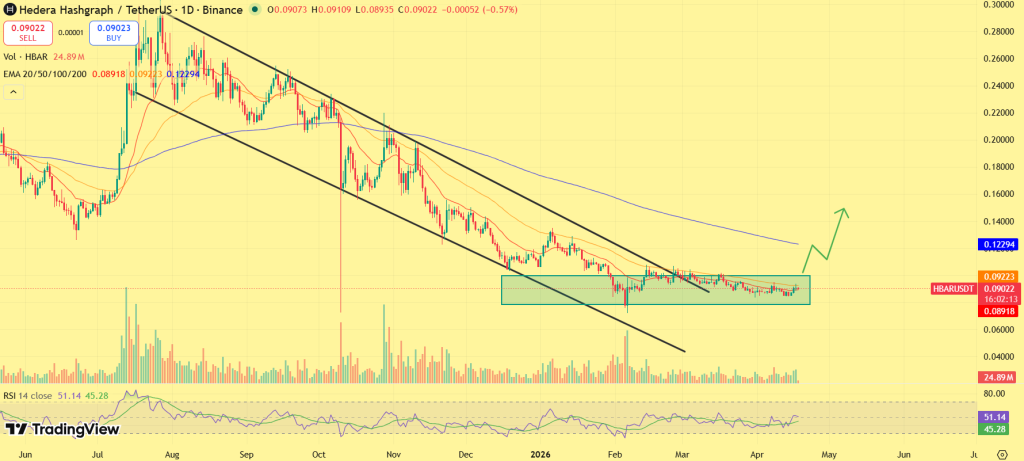
HBAR’s price structure shows a clear transition from trend continuation to stabilization. After a prolonged descending channel, price has stopped printing lower lows and is now consolidating within a defined base. This indicates that downside momentum is weakening, with sellers no longer able to push price significantly lower.
The structure is compressing near the upper boundary of this range, while short-term EMAs are flattening, a signal that bearish pressure is fading. A sustained move above the immediate resistance zone and descending trendline could trigger a continuation toward the $0.10–$0.12 region, where previous supply remains active.
On the downside, the $0.085–$0.09 zone continues to act as a key support. Holding this level maintains the base structure, while a breakdown would invalidate the current setup and extend consolidation. The current formation reflects a base-building phase with breakout conditions developing, rather than an active downtrend.
Derivatives Data: Positioning Shifts as Price Holds
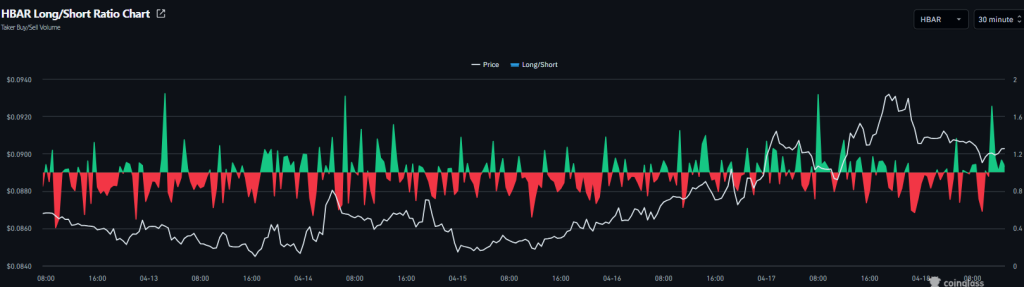
HBAR’s derivatives data shows a transition in positioning rather than a confirmed trend reversal. Short positions have dominated across recent sessions, reflected in consistent negative long/short imbalances. However, the ratio is now moving closer to neutral, with intermittent spikes favoring long positions.
This indicates that while the broader market remains cautious, long exposure is gradually increasing. At the same time, price has stabilized instead of reacting lower to bearish positioning. This divergence suggests that selling pressure is being absorbed, while early accumulation is taking place.
If long positioning continues to build alongside stable price action, it increases the probability of an upside move driven by positioning shifts rather than immediate sentiment change.
Outlook: Structure Builds as Market Conditions Improve
HBAR is no longer extending its downtrend and is instead forming a stable base supported by both technical and fundamental factors. With price holding key levels, derivatives positioning gradually shifting, and institutional narratives remaining intact, the asset is entering a phase where a directional move becomes more likely.
A confirmed breakout above resistance of $0.1020 would validate the transition toward recovery, while continued consolidation would indicate further accumulation.
XRP holds a strong demand zone at $1.30–$1.40. If support remains intact, the token could shift from consolidation to recovery as broader crypto market momentum builds..
Long-term forecasts suggest XRP could reach $5–$6 by 2026 and potentially $18 by 2030, driven by institutional adoption, Ripple partnerships, and global payment integration
Ripple (XRP) Ripple’s XRP remains one of the most closely watched assets in the crypto market, largely due to its strong positioning in the cross-border payments sector and the continued expansion of Ripple’s financial infrastructure. Over the years, Ripple has focused on building partnerships with banks and payment providers to streamline international settlements through blockchain technology. XRP’s long-term outlook continues to revolve around global payment integration, institutional partnerships, and the adoption of RippleNet and On-Demand Liquidity solutions. These developments could gradually strengthen XRP’s role as a bridge asset for international payments.
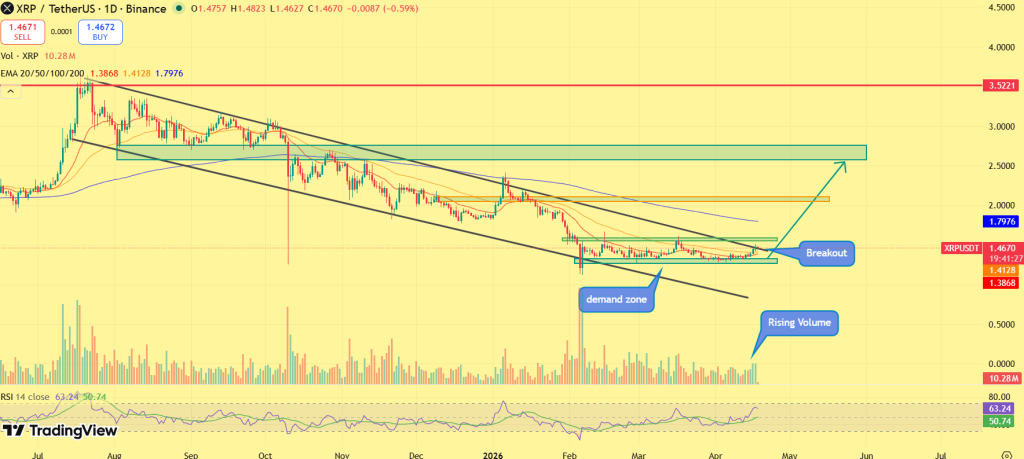
XRP price structure around $1.30–$1.40 has emerged as an important demand zone where buyers have shown consistent interest. If this area continues to hold, the market could gradually shift from consolidation to recovery. With the broader crypto market entering another potential expansion phase, XRP remains positioned as one of the major altcoins that could benefit from renewed institutional and retail participation. Now, making this the most ideal time for XRP price prediction 2026-2030 to be in more focus. Read this to know in depth what’s coming next in XRP.
As April progresses, XRP’s price action reflects a market that is gradually transitioning out of a prolonged corrective phase, with structure beginning to stabilize near the $1.20–$1.30 demand zone. After months of consistent lower highs within a descending channel, the recent compression near support suggests that selling pressure is fading while buyers are starting to step in more actively.
XRP is now trading just beneath a descending resistance trendline, with price tightening into a narrow range as volume begins to rise. This combination of compression and increasing participation typically precedes a directional move, placing the asset at a critical breakout point.
The immediate focus now lies around the $1.60–$1.80 region. A sustained move above this zone would confirm a breakout from the descending structure, opening the path toward the $2.20 level, followed by a potential extension into the $2.10–$2.50 supply zone if momentum continues to build. This aligns with the broader structure where reclaiming lost resistance levels becomes key to shifting sentiment.
However, the structure still requires confirmation. If XRP fails to break above the trendline and faces rejection, the price may continue consolidating within the current range. A breakdown below the $1.30 support could weaken the setup, potentially pushing the asset back toward lower support levels and delaying the recovery phase.
In this context, XRP in April may reach the $2.20–$2.50 range if the breakout sustains, while failure to confirm strength could keep the price range-bound near current levels as the market builds further momentum.
CoinPedia’s XRP Price Prediction 2026
The broader price structure for XRP in 2026 suggests a market transitioning out of a corrective phase, but still awaiting confirmation of a sustained trend reversal. Following its rally in previous cycles, XRP peaked near the $3.50 region before entering a prolonged downtrend, defined by a descending resistance structure and consistent lower highs throughout 2025. This trend has carried into early 2026, with price recently stabilizing near the $1.20–$1.30 demand zone as selling pressure begins to ease.
At this stage, the focus shifts toward whether XRP can reclaim key resistance levels and attract renewed demand. The immediate barrier remains at $1.70, followed by stronger resistance at $2.50 and the major supply zone between $2.60–$2.80. Beyond technical structure, regulatory and institutional catalysts are likely to play a decisive role in XRP’s trajectory through 2026.
Developments around U.S. crypto legislation, particularly frameworks such as the CLARITY Act, aimed at defining digital asset classifications, could provide long-awaited regulatory certainty. For XRP, which has been heavily influenced by legal outcomes, clearer classification could significantly improve institutional confidence and unlock broader participation.
At the same time, ongoing expansion of Ripple’s enterprise payment solutions and XRP Ledger (XRPL) integrations in cross-border settlement continues to strengthen its real-world use case. Any acceleration in adoption among financial institutions or payment corridors could act as a direct demand driver. Additionally, increasing discussion around spot crypto ETF expansion beyond Bitcoin and Ethereum introduces a longer-term narrative tailwind. While speculative at this stage, any progress toward broader altcoin ETF inclusion could materially shift liquidity flows toward assets like XRP.
If these catalysts align with a breakout above key resistance levels, XRP could transition into a recovery phase. A sustained move above $2.50 would signal structural improvement, with a breakout above $3.80 opening the path toward the $6.00–$9.50 range over time. However, until both regulatory clarity and technical confirmation materialize, XRP remains in a transitional phase. Failure to hold the $1.20 support could extend consolidation and delay upside momentum.
Recent News/Catalysts for XRP
Progress around U.S. crypto regulation, especially frameworks like the CLARITY Act, is improving sentiment around XRP’s long-standing legal overhang.
Expansion of XRP utility across payment corridors and enterprise integrations continues to strengthen its real-world demand narrative.
Ongoing XRP Ledger upgrades and ecosystem developments are enhancing network efficiency and institutional readiness.
Improving macro sentiment and broader market recovery are supporting renewed capital rotation into large-cap altcoins like XRP.
XRP On-Chain Outlook
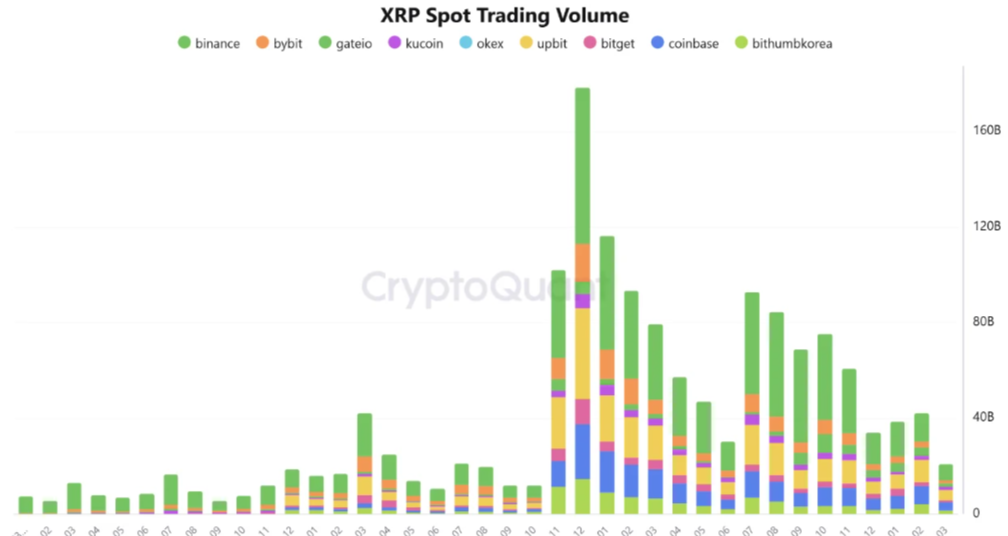
XRP’s on-chain data is currently pointing toward a cooling market environment, where activity has slowed but structural conditions are quietly improving. Spot trading volume across exchanges has dropped to its lowest level since 2024, reflecting reduced participation and weaker short-term momentum. This decline indicates that the market is no longer driven by aggressive trading, but is instead moving through a low-liquidity consolidation phase. At the same time, liquidity remains concentrated on major platforms like Binance, Upbit, and Coinbase, suggesting that while overall activity has declined, core market interest is still intact.
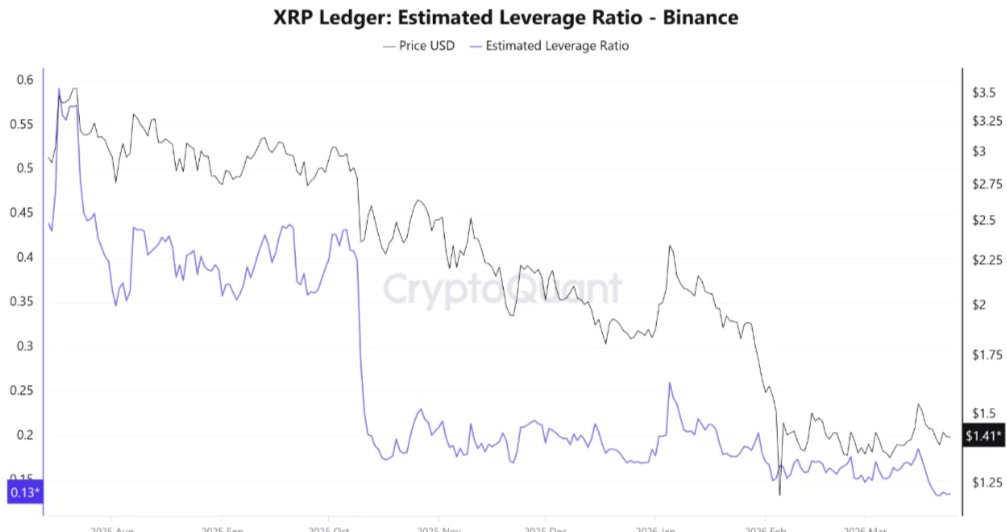
On the derivatives side, a more significant shift is unfolding. XRP’s leverage and open interest in Binance have dropped sharply, signaling a major reset in speculative positioning. The estimated leverage ratio has fallen substantially from previous highs, while open interest has cooled to much lower levels. This indicates that leveraged traders have largely exited or reduced exposure, removing excess risk from the market.
This combination of declining spot activity and reduced leverage suggests that XRP is transitioning from a highly speculative phase into a cleaner, more stable structure. With the market now less crowded and less prone to liquidation-driven volatility, the current setup reflects a reset phase, where pressure is building more gradually.
Overall, XRP’s on-chain signals point toward a market that is not weakening, but resetting after excess, creating conditions that often precede a more sustainable and directional move once momentum returns.
Ripple (XRP) Price Prediction 2026 – 2030
Year
Potential Low ($)
Potential Average ($
Potential High ($)
2026
3.40
6.50
9.50
2027
7.50
10.00
12.00
2028
8.80
11.50
16.00
2029
14.20
19.00
22.00
2030
18.80
23.00
30.00
Ripple (XRP) Price Prediction 2026
The XRP price range in 2026 is expected to be between $3.40 and $9.50
XRP Price Prediction 2027
Ripple (XRP) price range can be between $7.50 to $12.00 during the year 2027.
XRP Price Forecast 2028
In 2028, Ripple is forecasted to potentially reach a low price of $8.80, an average price of $11.50, and a high price of $16.00.
XRP Price Targets 2029
Thereafter, the XRP price for the year 2029 could range between $14.20 and $22.00.
Ripple (XRP) Price Prediction 2030
Finally, in 2030, the price of XRP is predicted to remain steady and positive. It may trade between $18.80 and $23.00.
Based on historical market sentiment and trend analysis, the following are the possible XRP price targets for longer-term time frames.
Year
Potential Low ($)
Potential Average ($)
Potential High ($)
2031
25.00
29.50
35.25
2032
31.50
36.75
41.25
2033
35.75
42.25
47.75
2040
97.50
135.50
179.00
2050
219.25
331.50
526.00
Market Analysis
Year
2026
2027
2030
Changelly
$3.00
$6.50
$17.76
DigitalCoinPrice
$4.20
$7.50
$18.00
WalletInvestor
$4.80
$7.90
$20.00
Never Miss a Beat in the Crypto World!
Stay ahead with breaking news, expert analysis, and real-time updates on the latest trends in Bitcoin, altcoins, DeFi, NFTs, and more.
FAQs
What is the XRP price prediction for 2026?
XRP could trade between $3 and $6 in 2026 if crypto market momentum strengthens and Ripple expands partnerships with banks using RippleNet and ODL.
How high will XRP go in 2030?
XRP could potentially reach $18–$30 by 2030 if the crypto market enters a strong bull cycle and Ripple expands global payment partnerships.
What is the price prediction for XRP in 2031?
Market projections suggest XRP could trade around $25–$35 in 2031, depending on global crypto adoption and Ripple’s continued growth in payment infrastructure.
How much will 1 XRP be worth in 2040?
If adoption of blockchain payments grows and Ripple strengthens its financial network, XRP could trade between $97 and $179 by 2040.
How much will 1 XRP be worth in 2050?
Long-term projections indicate XRP could reach $219–$526 by 2050 if blockchain payment networks become widely used across global financial systems.
What could drive XRP’s price growth long term?
XRP’s long-term growth may depend on global payment adoption, institutional partnerships, and wider use of Ripple’s blockchain infrastructure.
Is XRP a good investment?
XRP may be a promising investment due to its role in cross-border payments and growing institutional adoption, but price volatility and regulation risks remain.
DOGE price prediction for 2026 suggests potential highs of $1.25
Long term forecasts indicate DOGE could reach $3.00 by 2030.
Dogecoin continues to hold its position as one of the most widely recognized meme-driven assets in the market, supported by strong community backing, increasing integration in payment use cases, and periodic attention from high-profile endorsements. While it does not rely on deep protocol-level fundamentals like traditional Layer-1 networks, its strength lies in liquidity, accessibility, and its ability to capture retail-driven momentum during favorable market cycles.
At the same time, its 2026 price structure reflects a shift from prolonged decline toward early stabilization. After trending lower through 2025, DOGE has started forming a base near key demand zones, with price compressing within a defined range rather than continuing downward. This change in behavior suggests that selling pressure is easing, while accumulation is gradually building beneath resistance.
This sets up a familiar pattern. When Dogecoin transitions from low-volatility consolidation into expansion, the move tends to be sharp and sentiment-driven rather than gradual. The current structure indicates that the market is approaching that decision point.
In this Dogecoin price prediction 2026–2030, we will break down how this evolving structure, combined with market momentum and adoption trends, could shape DOGE’s long-term trajectory. Keep reading for more clarity.
Through April, Dogecoin is trading near the $0.095–$0.10 range, reflecting a steady consolidation phase after a prolonged downtrend. The highlighted accumulation zone on the chart continues to act as a reliable base, with buyers stepping in consistently each time price approaches this region. This repeated defense suggests that the market is no longer in aggressive selling mode, but rather in a phase of absorption. As long as this base holds, the structure remains stable with a slight upward bias.
On the upside, the immediate hurdle sits around $0.105–$0.11, which aligns with short-term resistance formed during recent recovery attempts. A sustained move above this level could trigger fresh momentum, allowing DOGE to push toward the $0.13–$0.15 range, where previous rejections have occurred and supply may re-enter.
The structure, however, is still in development. If the breakout extends with volume support, the next area to watch would be near $0.18, although such a move would likely require broader market strength and improved sentiment across altcoins. On the downside, a breakdown below the $0.095 support could weaken the current structure, with price potentially drifting toward the $0.085 region. This would indicate that the consolidation phase needs more time before any meaningful expansion.
For now, April appears less about sharp upside and more about whether DOGE can convert this accumulation phase into a breakout—because once that happens, the move tends to follow quickly.
Coinpedia’s Dogecoin (DOGE) Price Prediction 2026
Moving into the broader 2026 outlook, Dogecoin’s direction will likely be shaped by how the overall crypto cycle develops. Historically, DOGE has not required strong fundamentals to rally, it tends to respond quickly once liquidity and attention return to the market.
A move above $0.15–$0.18 would be the first sign that sentiment is shifting. From there, the next important zone lies around $0.30–$0.35, which could act as a mid-cycle barrier. If DOGE manages to maintain strength above this region, the structure begins to look more constructive, opening the door for a move toward $0.45–$0.50. Such a move would likely depend on broader market participation and renewed interest in meme-driven assets.
At the same time, if Dogecoin price struggles to hold above $0.08, the recovery timeline could extend, keeping DOGE in a longer consolidation phase. Overall, 2026 may not be about explosive moves initially, but rather about gradual rebuilding, with upside accelerating only if market conditions align.
Recent News/Catalysts for Dogecoin (DOGE)
Whale accumulation has picked up near the $0.09–$0.10 zone, signaling renewed confidence and supporting price stability.
Improving broader market sentiment, led by Bitcoin strength, is creating a supportive backdrop for meme coins like DOGE.
Rising social activity and renewed speculation around payment integrations (especially linked to X ecosystem) are driving retail interest.
Increased trading volume during consolidation suggests accumulation rather than distribution at current levels.
Dogecoin Price Prediction 2026 – 2030
Year
Potential Low ($)
Potential Average ($)
Potential High ($)
2026
0.75
1.00
1.25
2027
1.15
1.35
1.50
2028
1.25
1.75
2.00
2029
1.50
2.15
2.65
2030
2.50
2.75
3.00
This table, based on historical movements, shows DOGE price to reach $3 by 2030 based on compounding market cap each year. This table provides a framework for understanding the potential DOGE price movements. Yet, the actual price will depend on a combination of market dynamics, investor behavior, and external factors influencing the cryptocurrency landscape.
Dogecoin (DOGE) Price Prediction 2026
As per Dogecoin’s Price forecast for 2026, the high price could be $1.25, the low may reach $0.75. This makes the average around $1.00.
Dogecoin Price Prediction 2027
Moving to 2027, the DOGE Price projects that it might hit a high price of $1.50 potentially. With a $1.15 low and an average of $1.35
DOGE Coin Price Prediction 2028
Moving to 2028, the Dogecoin Price Forecast predicts a high price of $2.00. On the flip side, the low may fall to $1.25, and the average is projected to be around $1.75.
DOGE Price Prediction 2029
As per Dogecoin Price Forecast 2029, DOGE’s high price is predicted to be $2.65, with a low of $1.50 and an average of $2.15.
Dogecoin (DOGE) Price Prediction 2030
Finally, as per the Dogecoin Price Forecast 2030, DOGE’s price can reach a high price of $3.00. With a low of $2.50 and an average of $2.75.
Shiba Inu has triggered a decisive breakout from a symmetrical triangle, with bulls stepping in aggressively and momentum building fast. After weeks of compression, the move is now unfolding with rising volume, putting SHIB at a critical breakout zone.
With SHIB price already pushing higher, the setup is turning explosive. Can Shiba Inu (SHIB) extend this move into a sharp rally from here?
SHIB Price Outlook: What Do Charts Say?
With the breakout now confirmed, SHIB’s price action is transitioning from consolidation into a continuation phase, supported by improving trend structure and moving averages. The move above the symmetrical triangle marks a clear shift in control, with buyers sustaining price above the breakout zone rather than allowing a pullback. This is important, as holding above the breakout level signals acceptance and strengthens the probability of continuation.
SHIB is now beginning to print higher lows, indicating that buying interest is increasing and dips are being absorbed earlier. This change in structure reflects a gradual shift from a bearish to a bullish market phase. At the same time, moving averages are starting to align in favor of the bulls. The 20-day EMA is now acting as immediate dynamic support, while the 50-day EMA is flattening, suggesting that downside momentum is fading and the trend is stabilizing.
As long as SHIB continues to hold above its breakout zone and maintains support above key moving averages, the structure remains favorable for continuation, with momentum likely to build gradually into the next phase of the trend.
Volume Spikes as Traders Rush Back In
Building on this breakout, underlying market data now reflects a clear rise in participation. Derivatives volume has surged by over 54% to nearly $249 million, while open interest has climbed toward $64 million, indicating fresh capital entering the market. This suggests traders are positioning early for continuation rather than reacting late to price.
At the same time, the long/short ratio remains balanced, keeping the structure stable and reducing the risk of overleveraged positions. Meanwhile, continued exchange outflows signal reduced selling pressure, reinforcing the accumulation trend behind this move.
All Eyes on Resistance – Rally or Rejection?
With structure and momentum aligning, SHIB now enters a decisive phase where key levels will determine the next move. The immediate hurdle sits near $0.0000065–$0.0000072, a zone that has previously capped upside. A strong move above this range could accelerate momentum toward $0.0000075, followed by the broader target near $0.0000080.
On the downside, the breakout zone around $0.0000060 now acts as critical support. Holding this level is essential to sustain the current trend, while a breakdown could pull price back toward the $0.0000058 region. With price positioned between confirmation and rejection, the setup is clear, a breakout continuation could trigger a sharp rally, while failure may lead to a quick reset.
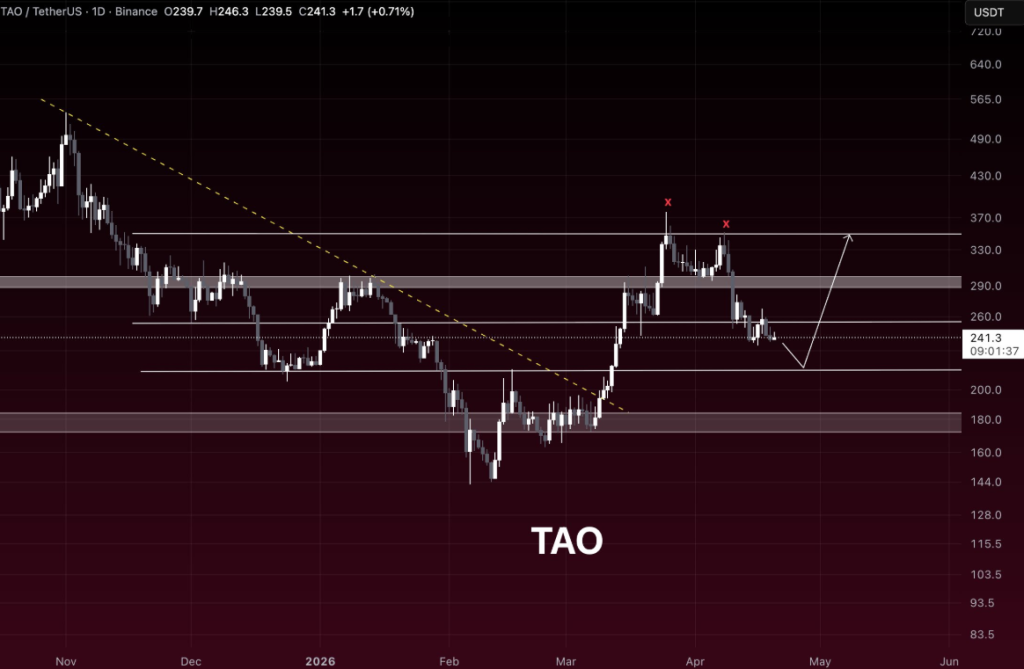
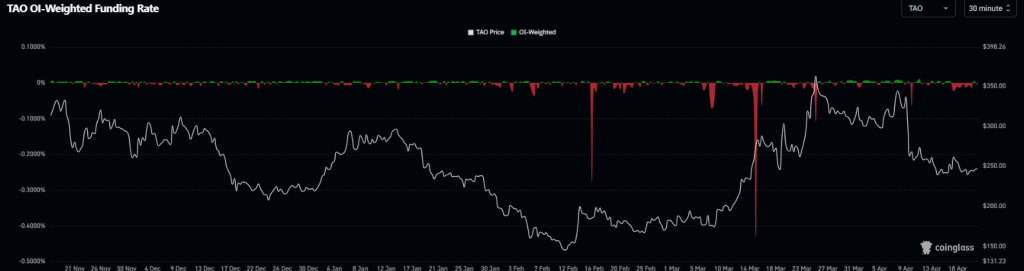
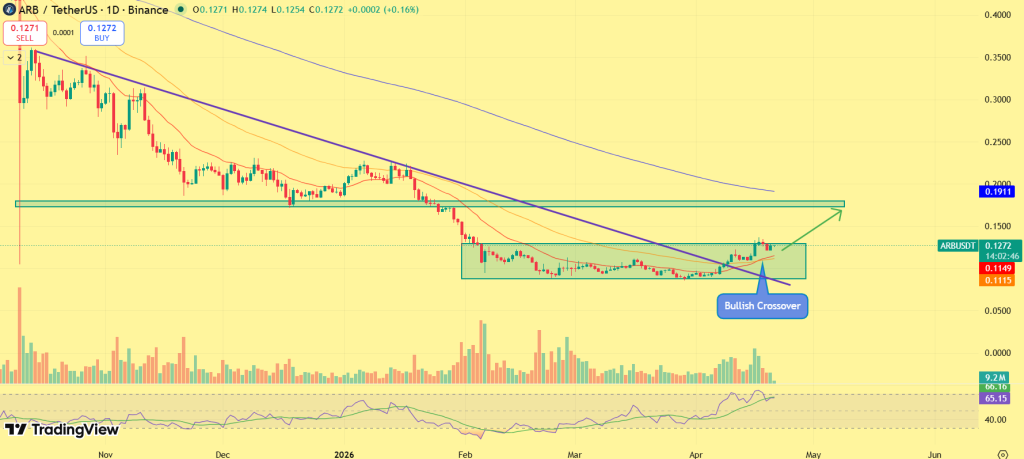
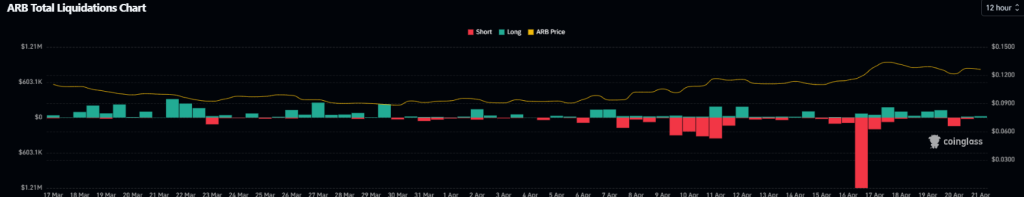
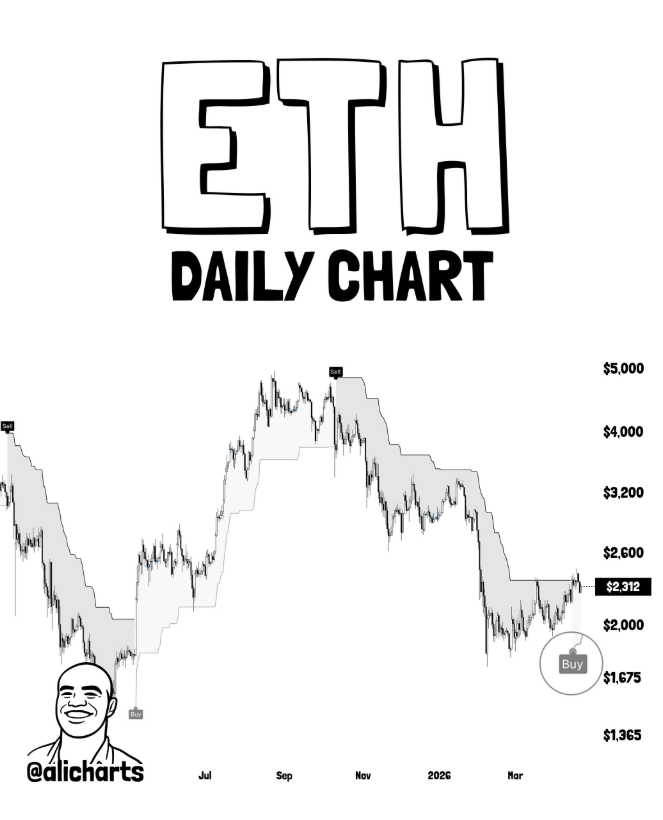
 BITMINE ADDS 101,627 ETH IN ONE WEEK