SPK price is back from the dead and it didn’t come quietly. After months of grinding sideways and shaking out weak hands, the token just ripped higher, smashing through its accumulation phase and tagging $0.063 in April. For something that looked completely forgotten after its brutal post-2025 decline, this kind of move feels… almost suspiciously aggressive.
SPK price breakout ends long painful accumulation phase
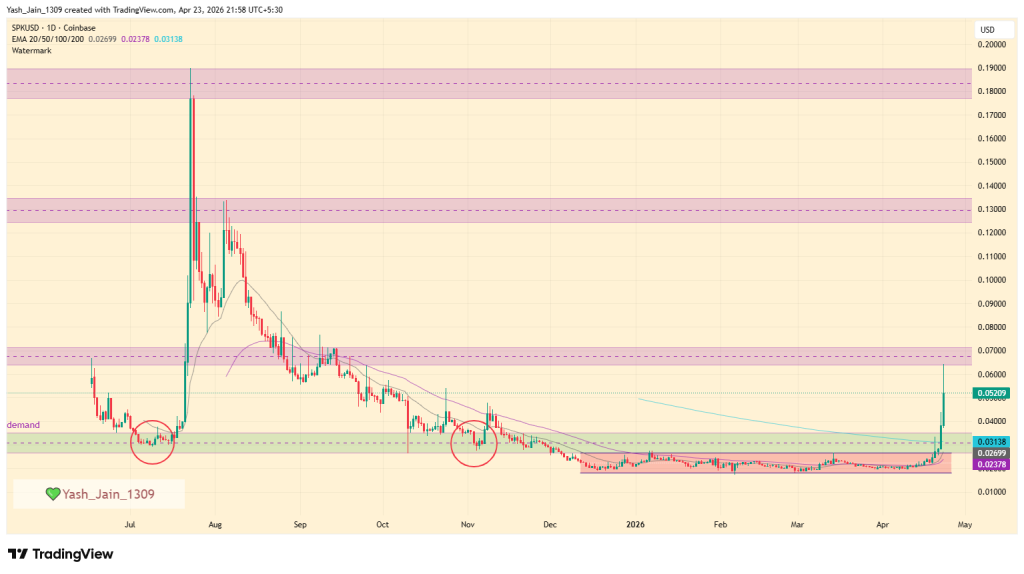
Let’s rewind a bit. SPK price had its moment back in July 2025 with a ridiculous 540% parabolic surge. Then came the hangover months of steady decline, lower highs, and that slow bleed that kills interest more than price.
Eventually, it settled into a deep accumulation range below a key demand zone. Boring, flat, lifeless. Until it wasn’t.
The recent breakout flipped that entire structure. Price didn’t just creep higher it launched strong, reclaiming lost ground and pushing straight into the $0.063–$0.070 supply zone. That’s now the battlefield. Break it, and suddenly $0.130 doesn’t sound so far-fetched anymore.
Upbit listing and staking surge fuel momentum
Today SPK got listed on Upbit’s KRW markets that lit the fire. That’s not just another exchange listing; it’s liquidity, visibility, and a fresh wave of retail attention all rolled into one. And markets love that combination.
At the same time, fundamentals quietly did their job. Total staked SPK has crossed the 500M mark, which signals growing commitment from holders. Add in the Spark Points Program Season 4 which is designed to reward long-term participation and you’ve got a system actively encouraging people not to sell.
Fascinating about how that works. But, the result? A sharp expansion in both confidence and price action. Not exactly rocket science, but effective nonetheless.
Momentum indicators scream strength but caution remains
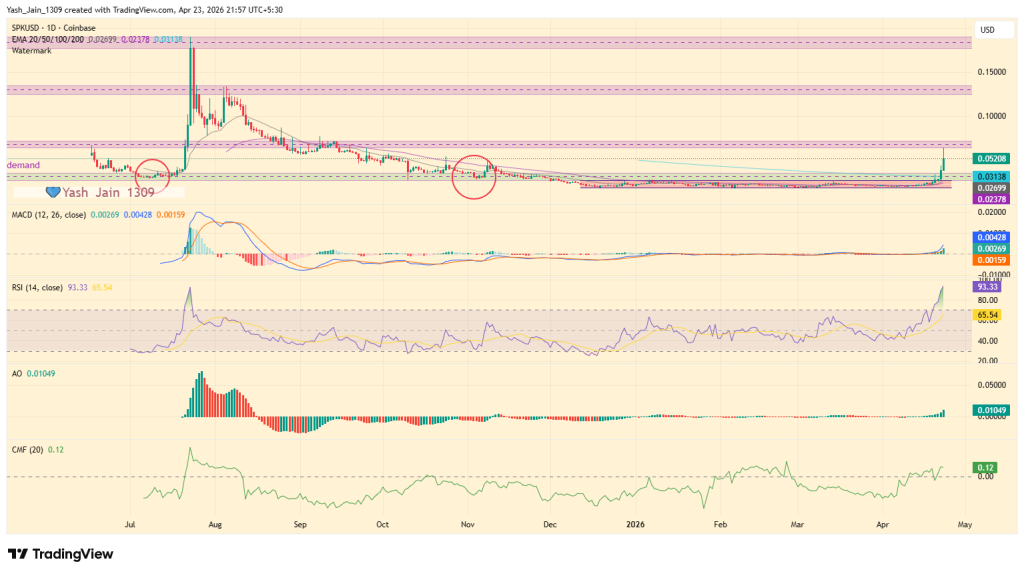
Now let’s talk about what the charts aren’t politely ignoring. RSI is sitting at a wild 93.33. That’s not just overbought but it’s overheated. Historically, levels like this don’t sustain without some kind of pullback, even in strong trends. And yet… momentum refuses to back off.
MACD is firmly bullish, printing expanding signals, while the Awesome Oscillator is pushing higher as well. More importantly, CMF sits at 0.12, confirming that actual capital is flowing in and its not just speculative noise.
So you’ve got this strange mix: a technically overextended asset that’s still attracting real money. That usually means one thing that if a cooldown comes, it’s likely a pause, not a full reversal.
SPK price now sits at a crossroads. Crack the $0.070 supply wall, and the narrative flips entirely toward continuation. Fail here, and you probably get a short-term reset before any serious attempt higher. Either way, SPK price isn’t boring anymore and that alone changes everything.
STABLE price after days of silence it just woke up again and not quietly. A sharp 15% intraday spike has pushed the token back into relevance, fueled less by fundamentals and more by something crypto markets oddly love: attention. This time, it came from the project’s CEO stepping into the spotlight at the RWA & Payments 2026 event in Hong Kong. And fascinatingly, the market noticed and took interest in STABLE price.
CEO spotlight drives STABLE price sudden momentum
The narrative shift was immediate. During the event, the messaging was clear stablecoins aren’t just a category anymore, they’re infrastructure. That kind of framing tends to resonate, especially in a market constantly hunting for the next “big theme.”
So, naturally, STABLE price reacted.
But let’s not pretend this is purely organic growth. The move looks heavily sentiment-driven, sparked by visibility rather than a structural shift in fundamentals. Still, in crypto, narrative often comes first and price follows.
Bullish structure builds as resistance comes into play
Now flip to the chart, because this is where things get interesting.
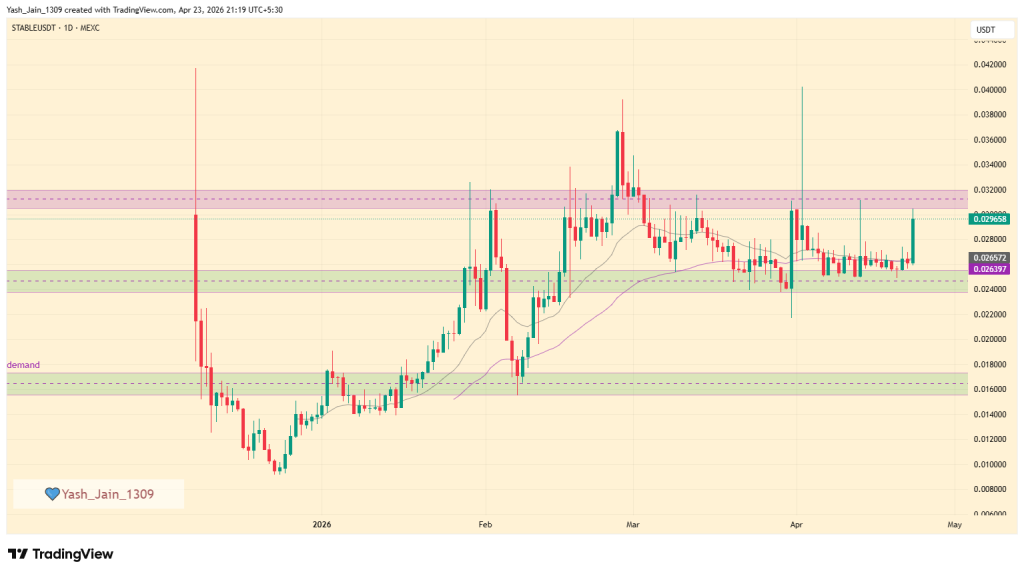
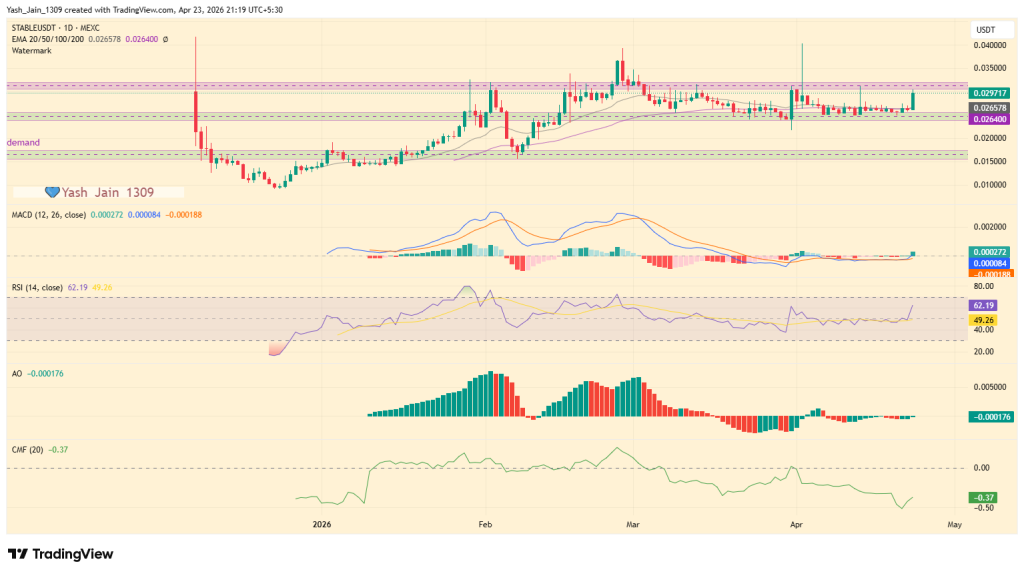
STABLE price has clawed its way back from a consolidation phase and reclaimed the $0.0264 level, which previously acted as a key pivot. That’s not nothing. It suggests buyers are stepping in with intent, especially as price continues to hold above the EMA cluster.
The 20-day and 50-day EMAs are now curling upward, signaling a shift toward short-term bullish momentum. Add to that a fresh MACD crossover with expanding green histogram bars, and suddenly the structure starts to look… constructive.
But here’s the catch. Price is now knocking on the door of the $0.0297 to $0.0320 resistance zone a level that has historically shut down rallies just as quickly as they started.
So yeah, momentum is building. But it’s also being tested.
Momentum rises but money flow tells different story
And this is where things get messy. RSI has climbed to 62.19, comfortably above neutral and edging toward overbought territory. That confirms strength but not exhaustion. There’s still room to run.
However, the Chaikin Money Flow sits at -0.37. That’s a problem. It signals that despite the rising STABLE price, there’s no strong institutional capital backing the move. In simple terms, this rally might be driven more by retail enthusiasm or thin liquidity than by serious accumulation.
Translation? It can move fast… and drop just as quickly. So, what’s next?
If STABLE price breaks and holds above the $0.030 range, the path toward higher levels opens up. But if it fails and especially if it loses the $0.0265 support zone then the downside risk toward $0.016 comes back into play.
Right now, STABLE price is caught between hype and hesitation. And in this market, that’s usually where things either explode or fall apart.
After months of grinding lower inside a falling wedge, the ONDO price chart is finally tightening up and not quietly. With tokenized stocks suddenly back in the spotlight, ONDO might just be sitting on the kind of narrative fuel traders pretend they don’t chase… until they do.
Tokenized stocks narrative suddenly grabs Washington spotlight
Here’s the twist. Tokenized stocks aren’t just a niche experiment anymore they’re getting regulatory attention at the highest level. That alone shifts the tone.
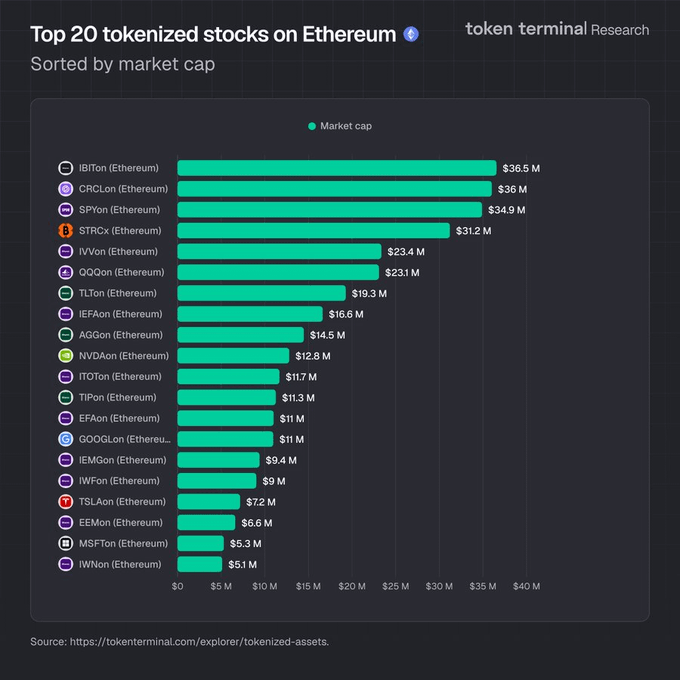
Today Ondo Finance announced on X that Nineteen of the top twenty tokenized stocks on Ethereum now come from Ondo Global Markets. That’s not a small footprint. On Ethereum alone, Ondo’s tokenized stocks and ETFs account for nearly $500 million in total value locked, alongside billions in trading volume and tens of thousands of holders.
And then came the policy angle. A recent statement pointed toward an upcoming “innovation exemption” aimed at facilitating on-chain trading of tokenized securities. Translation? Washington isn’t debating whether this sector should exist but clearly it’s figuring out how to regulate it. Well, that changes things for good in the sector.
Tokenization has Washington's attention.
“We are on the cusp of releasing an 'innovation exemption' to begin facilitating the trading of tokenized securities onchain.”
SEC Chairman Paul Atkins, speaking at the Economic Club of Washington, outlining the regulatory framework… pic.twitter.com/txldrIptrb
ONDO price compresses inside falling wedge structure
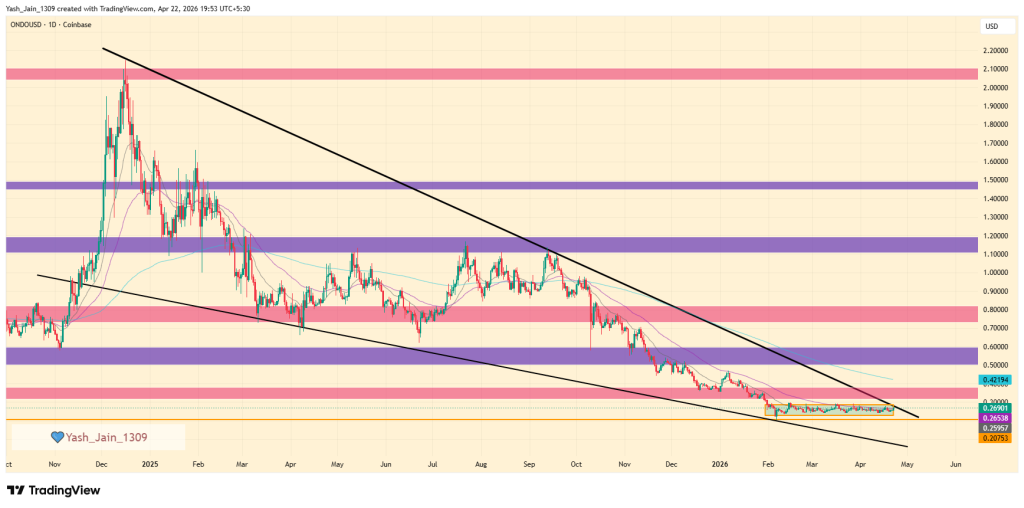
Now flip to the chart, because this is where it gets tactical. ONDO price has been stuck in a prolonged downtrend, forming a clean falling wedge pattern since early 2025. Lately, though, price action has shifted into a tight horizontal consolidation box near the lower boundary, which is kinda classic pre-breakout behavior. But here’s the catch: it’s not just any resistance overhead.
The $0.42 level sits right in line with the 200-day EMA band and the wedge’s upper boundary. That makes it a double-layered barrier and the kind that doesn’t break easily unless momentum shows up with intent.
Still, price is creeping toward it again. Slowly. Quietly. And markets love breaking when everyone’s bored. So, what happens next?
If ONDO price manages a clean break above $0.42, that level flips from resistance into a magnet. Not immediately explosive but structurally important. From there, the next major zone sits near $0.80, which aligns with prior resistance clusters.
But let’s be real. None of that matters if the breakout fails. This setup is binary. Either the falling wedge resolves upward, supported by fresh narrative momentum from tokenized securities… or it drifts sideways and fades back into irrelevance.
Right now, though, the timing is hard to ignore. ONDO price is sitting at the edge of a technical breakout while the tokenized stocks story gains traction at both institutional and regulatory levels. That’s not confirmation but it’s definitely a setup worth watching.
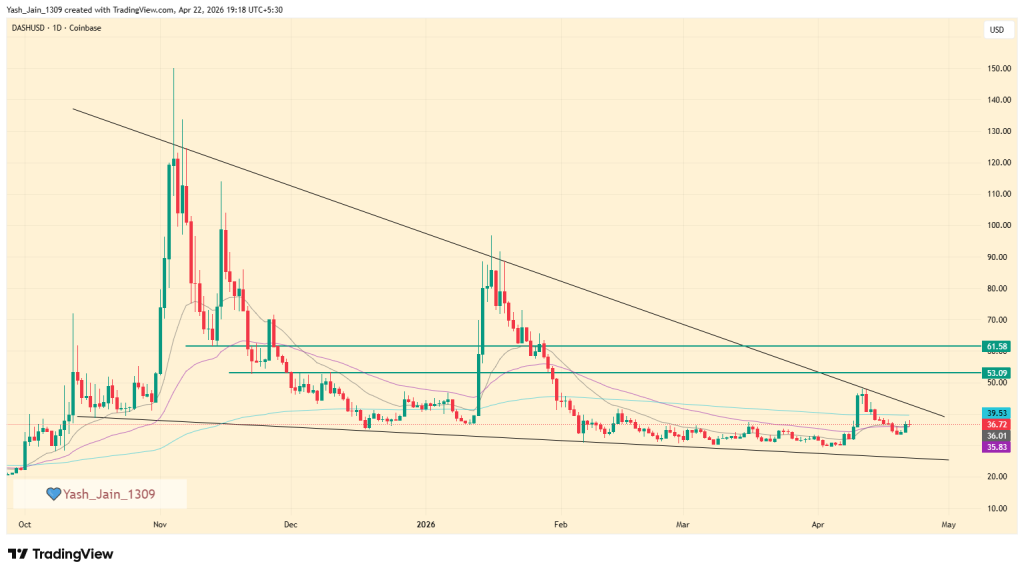
DASH price is sitting right at that uncomfortable edge where patience runs thin and volatility usually kicks the door in. After months of grinding lower since Q4 2025, the daily chart now shows a clear falling wedge structure, and it’s tightening fast. April’s price action isn’t subtle about it either; momentum is compressing, and something’s got to give.
But here’s the catch there’s a ceiling. And it’s not just any ceiling.
Falling Wedge Pressure Builds Toward Key Breakout Zone
The falling wedge has done what it’s supposed to do: squeeze price into a narrowing range while quietly building breakout pressure. Now, DASH price is pressing right into the upper boundary of that structure. Typically, that’s where reversals start to show up.
Except this time, there’s a second wall stacked right on top.
The 200-day EMA around $40 is sitting exactly where the wedge resistance lies. That’s not coincidence ina fact that’s confluence. And in markets, confluence tends to matter more than narratives.
So yeah, breaking $40 isn’t just another level. It’s the most key level right now.
Why $40 Is The Only Level That Matters
As the data suggest, if DASH price clears $40 cleanly meaning a proper breakout, not a weak wick then the structure flips. Simple as that. Now, what happens next depends on how aggressive that move is.
If price rips through $40 with strong momentum, then the $53–$61 resistance zone probably won’t slow things down much. That kind of breakout tends to ignore intermediate levels and go straight for expansion.
But markets aren’t always that generous. If DASH climbs slowly and stabilizes above $40, then $53 and $61 become real checkpoints. Not barriers, but tests. Fail those, and the breakout risks losing steam.
Decentralization Narrative Enters The Conversation Again
And then there’s the timing. While price structures are tightening, the broader crypto space is dealing with a different kind of pressure that’s trust and decentralization doubts.
With recent events involving asset freezes raising eyebrows across the industry, DASH crypto decided to step in with a not-so-subtle reminder. The network publicly stated that it is decentralized and cannot, and will not, censor or surveil users.
PUBLIC SERVICE ANNOUNCEMENT
The Dash network is decentralized and cannot, and will not, censor or surveil its users.
That’s not just PR it’s positioning in people minds that are in fear of assets freezing.
In a market where decentralization is suddenly being questioned again, that message isn’t random. It’s strategic. Whether it actually shifts investor sentiment, though, is a different story.
Artificial Superintelligence Alliance’s price could hit a maximum trading price of $1 in 2026
With a potential surge, the FET price may record a high of $12.45 by 2030.
As artificial intelligence continues to dominate global headlines, blockchain-based AI infrastructure projects are once again attracting investor attention.
Among them, the Artificial Superintelligence Alliance (ASI) stands out as a strategic merger of major AI-focused blockchain entities.
Founded through the collaboration of Fetch.ai, SingularityNET, and later CUDOS, the alliance aims to create the largest open-source, decentralized ecosystem focused on Artificial General Intelligence (AGI).
The FET token, originally native to Fetch.ai and now central to the ASI ecosystem, serves as the utility, governance, and settlement layer across AI services.
So let’s dive straight into CoinPedia’s Artificial Superintelligence Alliance (FET) price prediction for 2026, 2027, and 2030.
Artificial Superintelligence Alliance (FET) Price Targets For April 2026
The Artificial Superintelligence Alliance (ASI) is expanding its AI agent marketplace, making it easier for users and applications to access various AI services.
If ASI successfully integrates its offerings, it will be able to host AI models on its network, facilitate communication and collaboration among AI agents, and enable users to pay for AI services directly on the blockchain. Additionally, ASI is working to establish partnerships with businesses interested in utilizing AI.
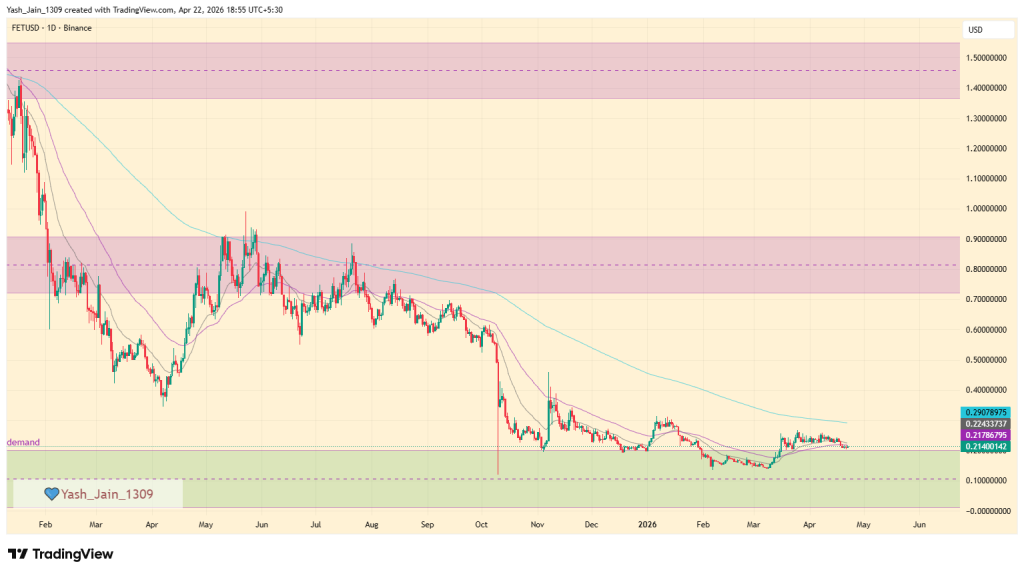
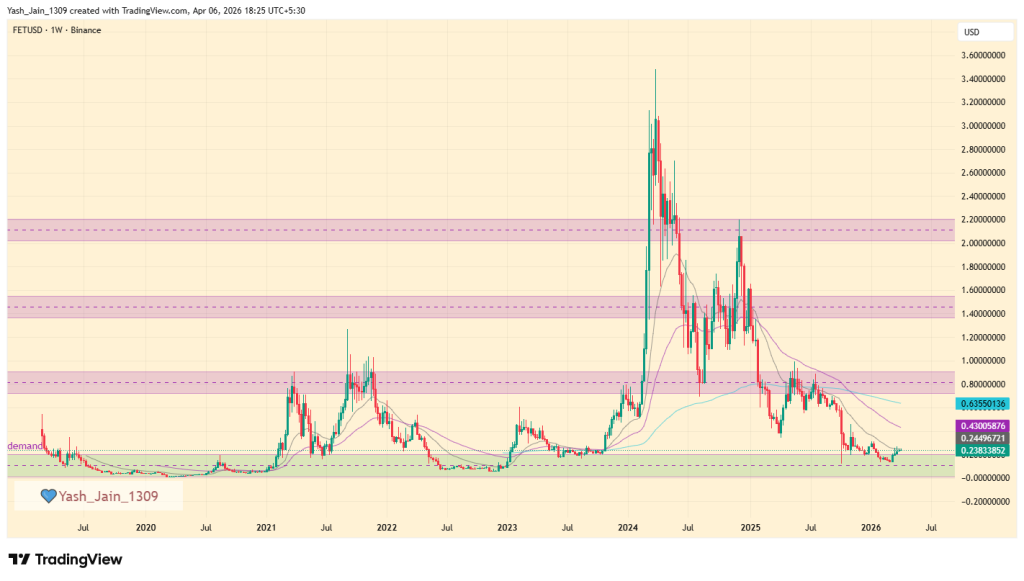
As more people begin to use AI on the network and the demand for computing power increases, this could drive up activity and potentially push the FET price towards $0.32 by late April to May of 2026. The price already reached $0.25 in mid-March, now approaching the 200-day EMA band. It has also found support in the green box, which aligns with a multi-year demand zone. If bearish pressure increases, the price could re-enter this support zone; however, if it continues on its upward trajectory, testing $0.32 could be within reach or even higher.
Unlike many AI tokens driven by hype, the Artificial Superintelligence Alliance (FET) is building a foundation in decentralized compute and autonomous agents. This shift from speculation to real-world utility suggests that FET’s value will increasingly mirror actual network usage. As companies adopt these decentralized services, the organic demand for the token could provide a structural floor for long-term growth.
Technically, FET’s 2026 outlook remains tied to key market cycles. A potential low of $0.0582 serves as a deep support zone during “risk-off” periods. However, as the ecosystem matures, an average price of $0.0913 is expected as it maintains a steady trend. In a bullish breakout scenario, FET could surge toward $0.3013, driven by high-volume demand for decentralized AI infrastructure.
FET Price Prediction 2026 – 2030
Year
Potential Low ($)
Potential Average ($)
Potential High ($)
2026
$0.0921
$0.340
$0.950
2027
$0.173
$0.820
$2.14
2028
$0.468
$1.938
$5.53
2029
$1.40
$4.30
$8.05
2030
$2.126
$6.78
$12.45
FET Price Prediction 2027
Growing wider adoption of autonomous AI agents in supply chains, logistics, and digital services could push FET near $2.14
FET Price Forecast 2028
By 2028, if decentralized AGI frameworks mature and institutional AI infrastructure adopts ASI tooling, FET may approach $5.53.
FET Coin Price Prediction 2029
In 2029, AGI research networks integrate token-based compute markets, and valuation expansion could drive FET toward $8.
What will Fetch AI be worth in 2030?
In a strong AI-dominant economy where decentralized compute markets compete with centralized cloud providers, FET could test $12.45
As per CoinPedia’s FET Price Prediction, the exponential growth observable in the field of artificial technologies will boost the value of AI tokens in the crypto world
If the alliance successfully aligns AI compute markets, decentralized agents, and open-source model hosting under one economic framework, FET could gradually reclaim the $0.950 range in 2026.
Year
Potential Low ($)
Potential Average ($)
Potential High ($)
2026
$0.0921
$0.340
$0.950
Never Miss a Beat in the Crypto World!
Stay ahead with breaking news, expert analysis, and real-time updates on the latest trends in Bitcoin, altcoins, DeFi, NFTs, and more.
FAQs
What is Artificial Superintelligence Alliance (FET)?
Artificial Superintelligence Alliance (FET) is a merged AI-blockchain ecosystem uniting Fetch.ai, SingularityNET, and CUDOS to power decentralized AI services.
What is the Artificial Superintelligence Alliance (FET) price prediction for 2026?
FET could trade between $0.09 and $0.95 in 2026, depending on AI adoption, network growth, and overall crypto market momentum.
What could FET be worth by 2030?
If decentralized AI scales globally, FET may test $12 by 2030, though long-term growth depends on real-world usage and regulation.
What Is the FET Price Prediction for 2040 and How High Can It Go?
By 2040, FET could trade between $25 and $40 if decentralized AI and AGI adoption expand globally with strong ecosystem growth.
What is the price prediction for FET in 2050?
By 2050, FET may exceed $60 in a mature AI economy, assuming sustained adoption, real utility, and stable crypto regulations.
Is FET a good long-term AI crypto investment?
FET offers exposure to decentralized AI infrastructure. Its long-term value relies on adoption, partnerships, and sustainable ecosystem growth.
Cronos coin price is expected to go as high as $0.3000 to $0.3500 in 2026.
CRO crypto may cross the $1 mark, with a potential high of $1.3190 by 2029.
Cronos (CRO) serves as the backbone of the Cronos Chain, a high-performance, open-source ecosystem engineered by Crypto.com. Designed to bridge the gap between traditional finance and Web3, CRO acts as a versatile utility token that facilitates instantaneous, low-cost global transactions while powering a vast suite of DeFi applications, perpetuals, and fiat-integrated markets.
Driven by institutional-grade infrastructure and a rapidly expanding global footprint, CRO’s market performance increasingly reflects a surge in investor confidence and real-world utility. As the network matures into 2026, its role in the next generation of digital asset exchange becomes even more pivotal.
In this analysis, we leverage advanced technical indicators and historical performance models to forecast the trajectory of Cronos. Whether you are a long-term holder or a strategic investor, this guide provides essential price projections for 2026 and through to 2035, helping you determine if CRO/USD is the missing piece for your portfolio.
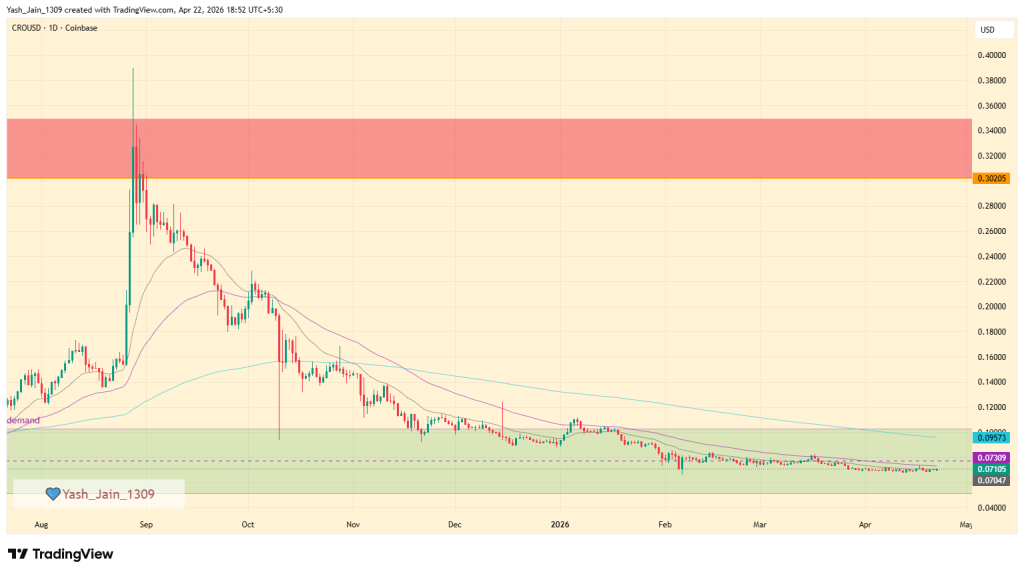
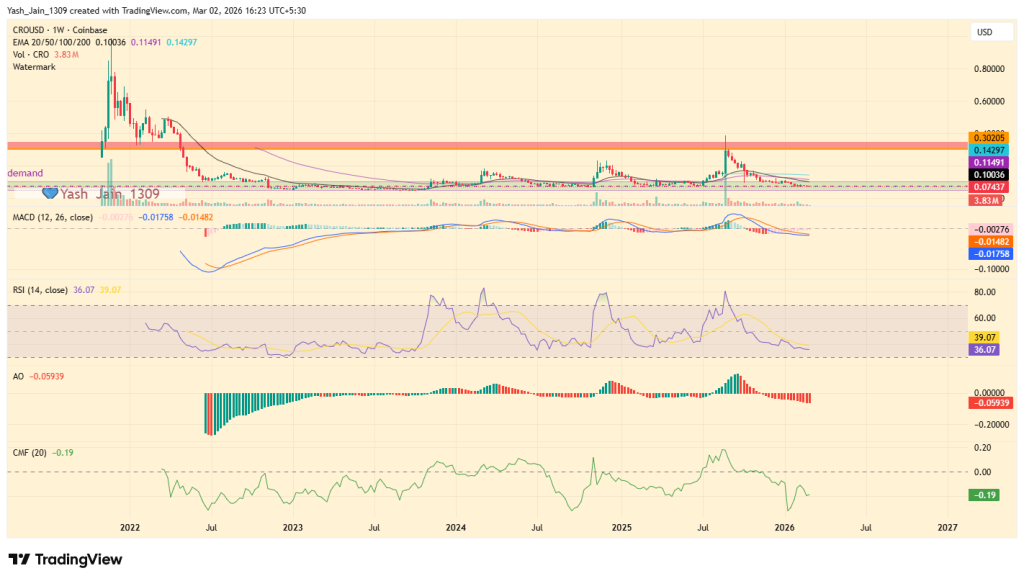
Currently, the Cronos price is experiencing a period of consolidation on the daily chart, hovering around the key horizontal line at approximately $0.0777, which marks an important multi-year demand range (indicated in green). This phase indicates a decrease in momentum, and if this trend continues, we could observe its persistence into March.
On a more optimistic note, should the price successfully break above $0.1000, we can anticipate a robust move towards the 200-day EMA band, potentially reaching around $0.1200 by late April to may. However, if bearish factors come into play, we might see the price retreat to the lower end of the current demand range, possibly down to around $0.0600.
Recent Updates & Network News
On February 5, 2026, Cronos announced the development of a unified trading platform offering tokenized stocks, commodities, and prediction markets. This expansion is supported by a strategic integration with Fireblocks, providing the secure, institutional-grade custody infrastructure necessary for market makers to trade at scale.
Following this, a post on February 28 announced the Cronos v1.7 Network Upgrade is scheduled for March 10 at 07:00 GMT. This technical maintenance will involve approximately 30 minutes of downtime to align with recent SDK updates and implement RPC performance improvements to ensure long-term chain stability.
CRO Price Prediction for 2026
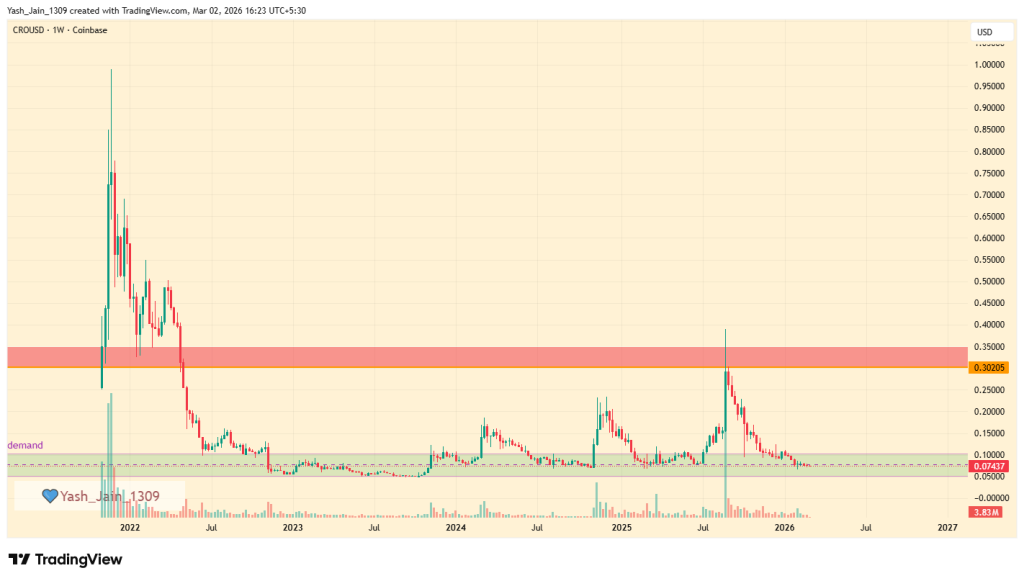
The weekly chart for CRO/USD reveals a persistent long-term structure defined by a well-established accumulation zone. Since late 2023, Cronos has consistently found a floor within the $0.0500 to $0.1000 demand area. This “buy zone” has historically triggered significant rallies, notably in late 2024 and mid-2025, where the price peaked at $0.3900.
As of early 2026, CRO has returned to this familiar base, setting the stage for its next major move.
The current weekly price action suggests a period of base-building. We are seeing a repeat of the historical pattern where CRO enters a deep consolidation phase before a vertical expansion.
Supply Zone: The primary target for a breakout lies between $0.3000 and $0.3500.
The Pivot Point: Simply hitting the supply zone isn’t enough; for a true trend reversal, CRO must flip this resistance into support to reclaim its 2022 highs.
Moreover, While the price remains flat, the underlying “engine” of the market (indicators) is starting to show signs of exhaustion from the bears:
In MACD for instance we are currently approaching a weekly bullish cross. Historically, this cross has served as the starting gun for intensified consolidation that eventually leads to a breakout at later stage.
CMF is the most encouraging sign. The CMF has bounced sharply from a low of -0.32. This move toward the zero line suggests that selling pressure is fading and capital is starting to stabilize within the ecosystem.
RSI & AO, Both indicate that the “cooling off” period is still in effect. This lack of a clear direction in RSI confirms we are in a neutral accumulation phase, which is often known as the quiet before the storm.
What Makes CRO Interesting in 2026?
In 2026, Cronos (CRO) stands out as a unique bridge between high-finance and retail utility. The landscape shifted dramatically in late august 2025 when Trump Media Group announced a $6.42 billion CRO Digital Asset Treasury strategy, signaling a massive institutional endorsement of the token’s scarcity.
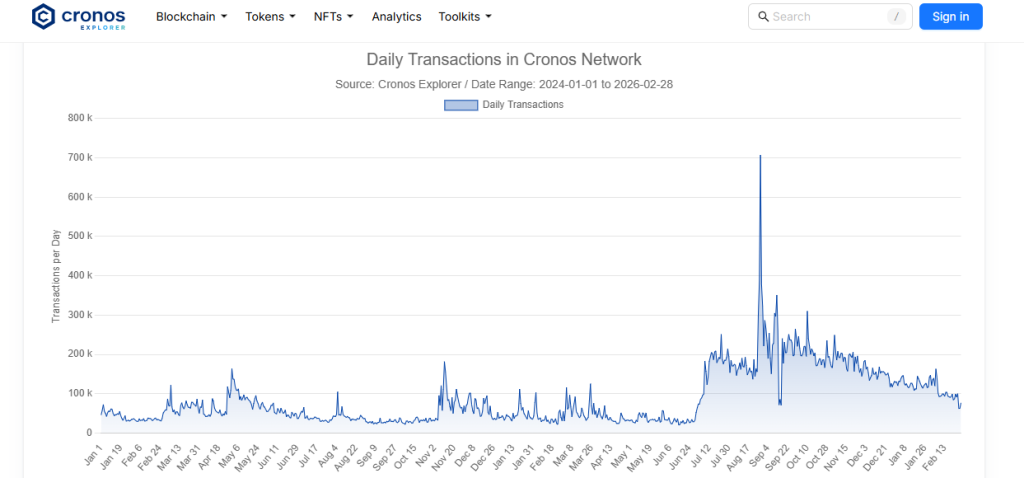
Beyond the headlines, Cronos remains a technical powerhouse with zero downtime over four years. It currently supports 150M+ users via the Crypto.com ecosystem and powers payments for 10M+ merchants. While the broader market has cooled in Q1, Cronos maintains a healthy 100,000 daily transactions, proving its resilience. This blend of “battle-tested” infrastructure and “institutional-grade” liquidity makes it a critical pillar of the 2026 digital economy.
Cronos (CRO) Price Prediction for 2027-2035
Year
Minimum Price ($)
Maximum Price ($)
Average Trading Price ($)
2027
0.1690
0.3490
0.2490
2028
0.3570
0.6990
0.5090
2029
0.7100
1.3190
0.9890
2030
1.3490
2.4010
1.8210
2031
2.4200
4.1990
3.2350
2032
4.2210
7.1000
5.5290
2033
7.1090
11.5050
9.1650
2034
11.5910
18.4510
14.7650
2035
18.4290
28.7110
23.1990
Cronos Token Price Prediction for 2027
By 2027 Cronos token price is expected to trade between $0.1690 and $0.3490. The average expected trading cost is $0.2490.
CRO Price Prediction for 2028
In 2028, CRO price is expected to trade between $0.3570 and $0.6990. The average expected trading cost is $0.5090.
Cronos (CRO) Crypto Price Prediction for 2029
Experts expect Cronos crypto to trade between $0.7100 and $1.3190 in 2029. The average expected trading cost is $0.9890.
CRO Price Prediction for 2030
Based on technical CRO price analysis it is expected to trade between $1.3490 and $2.4010 in 2030. The average expected trading cost is $1.8210.
CRO/USD Price Prediction for 2031
Based on technical analysis by experts, in 2031 CRO/USD is expected to trade between $2.4200 and $4.1990. The average expected trading cost is $3.2350.
Cronos Price Prediction for 2032
Following 2031, in 2032, Cronos price is expected to trade between $4.2210 and $7.1000. The average expected trading cost is $5.5290.
CRO Token Price Prediction for 2033
In 2033, CRO token price is expected to trade between $7.1090 and $11.5050, with an average expected trading cost of $9.1650.Price Prediction for 2034
CRO Crypto Price Prediction for 2034
Based on technical analysis by cryptocurrency experts, in 2034 CRO crypto is expected to trade between $11.5910 and $18.4510. The average expected trading cost is $14.7650.
CRO Price Prediction for 2035
According to technical analysis by top specialists, the CRO price is projected to range from $18.4290 to $28.7110 by 2035. The anticipated average trading price is $23.1990.
Never Miss a Beat in the Crypto World!
Stay ahead with breaking news, expert analysis, and real-time updates on the latest trends in Bitcoin, altcoins, DeFi, NFTs, and more.
FAQs
What is the Cronos (CRO) price prediction for 2026?
CRO is expected to trade within the $0.05–$0.35 range in 2026, with a breakout above $0.30 needed to confirm a bullish reversal.
Can Cronos (CRO) reach $1 by 2030?
Based on long-term projections, CRO could trade between $1.34 and $2.40 by 2030 if adoption and momentum continue.
Is Cronos a good long-term investment through 2035?
Long-term forecasts suggest gradual growth toward higher ranges by 2035, but returns depend on adoption and market cycles.
What could drive CRO price growth in 2026?
Institutional integration, network upgrades, rising utility, and a confirmed bullish MACD cross could support upside momentum.