LayerZero price is on the edge as bears tighten control, pushing ZRO toward a critical support breakdown. The latest 6% drop comes amid weakening recovery attempts and rising sell-side signals, with price now hovering near the $1.35 zone. As on-chain activity hints at potential distribution and market structure continues to deteriorate, this level is shaping up as the last line of defense before a possible acceleration in downside momentum.
Whale Activity Adds Pressure Near Key Support
Recent on-chain data has intensified bearish concerns. A wallet linked to the LayerZero ecosystem deposited 1 million ZRO (worth ~$1.43 million) into Binance, a move typically associated with potential selling intent.
A wallet linked to the LayerZero team deposited 1M $ZRO worth $1.43M into #Binance.
The wallet still holds 29M $ZRO worth $41.34M and is likely to deposit further.
More importantly, the same entity still holds around 29 million ZRO (~$41M). The presence of such large remaining holdings introduces the risk of continued inflows, especially if the market weakens further. Such inflows occurring near a key support level often act as a catalyst for breakdown, as they dampen buyer confidence and reinforce a supply-heavy environment.
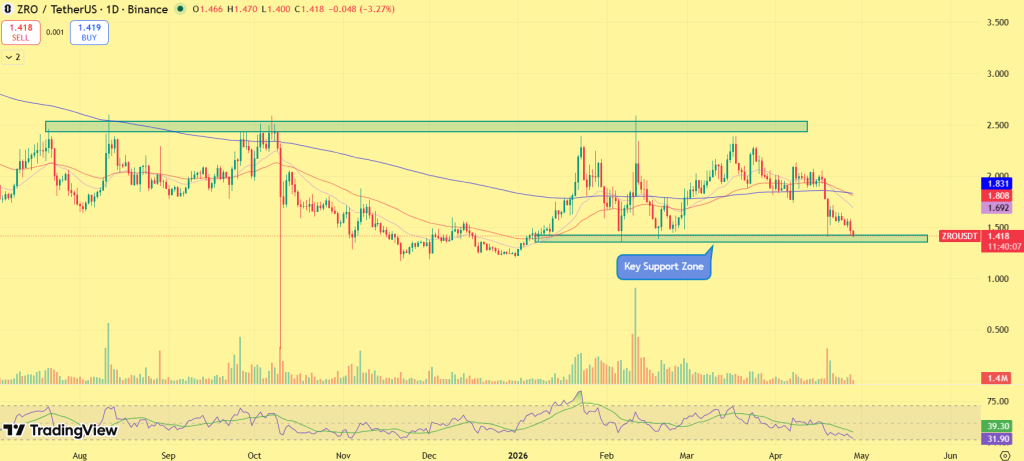
LayerZero remains in a clear downtrend, with rejection near the $1.60–$1.65 supply zone triggering the latest leg lower. The recent session adds to this weakness, with a strong bearish candle and a 6% decline, pushing ZRO directly into the $1.35 support area.
However, structure continues to deteriorate and lower highs remain intact, with recovery attempts capped near $1.48–$1.50, confirming sellers are stepping in earlier on each bounce. ZRO price is also trading below key short-term averages, with a bearish crossover between the 20-day and 50-day MA, reinforcing downside momentum.
The latest move stands out. Instead of consolidation, the coin printed a decisive bearish candle with strong follow-through, indicating active selling rather than passive drift. This kind of price action typically signals continuation, especially when it occurs near a key support level.
With this being another direct test of $1.35, the level is now under pressure. Repeated tests combined with strong downside candles increase the probability of a breakdown, as demand gets absorbed more aggressively. If $1.35 fails to hold, the structure opens toward the next downside zone near $1.10–$1.00. On the upside, any relief bounce would first need to reclaim $1.48–$1.50, followed by a stronger move above $1.60–$1.65 to shift momentum. Until then, the trend remains firmly bearish.
Liquidation Data Shows Long Imbalance
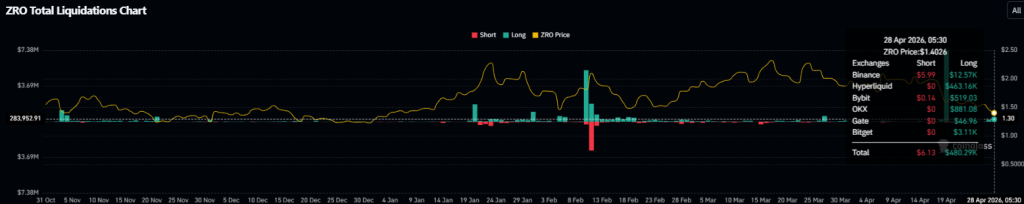
Liquidation data confirms a fragile market setup. Recent data shows ~$480.29K in long liquidations compared to just ~$6.13K in shorts, highlighting a heavily one-sided market. A significant portion of this came from Hyperliquid (~$463K in long liquidations), with additional contributions from Binance and other exchanges.
Meanwhile, short liquidations remain minimal, indicating bears are not under pressure. This imbalance is critical, if price breaks below $1.35, the market could see a long squeeze, where forced liquidations accelerate downside volatility and push prices lower at a faster pace.
Final Take
LayerZero is at a make-or-break level. With persistent downtrend pressure, rising exchange inflows, and a long-heavy market structure, the risk remains tilted to the downside. A clean break below $1.35 could open the door for a sharper correction in the sessions ahead.
Injective (INJ) price is showing early signs of stabilization after a prolonged downtrend, with selling pressure beginning to ease near key support levels. While the broader structure remains cautious, recent price action suggests the market is attempting to build a base rather than extend losses.
This comes as Injective moves closer to a scheduled mainnet upgrade, a catalyst that could influence both network performance and token demand. With price compressing near resistance and sentiment gradually improving, INJ is now approaching a decisive phase.
Injective’s approved mainnet upgrade, expected around April 28, brings both technical improvements and a shift in token economics.
The upgrade focuses on improving execution efficiency and optimizing on-chain modules, making the network more reliable for DeFi and trading use cases. Alongside this, the introduction of INJ token buybacks creates a direct demand mechanism tied to protocol activity. This adds a structural support layer for the token, but price action indicates the market is still waiting for confirmation rather than pricing it aggressively.
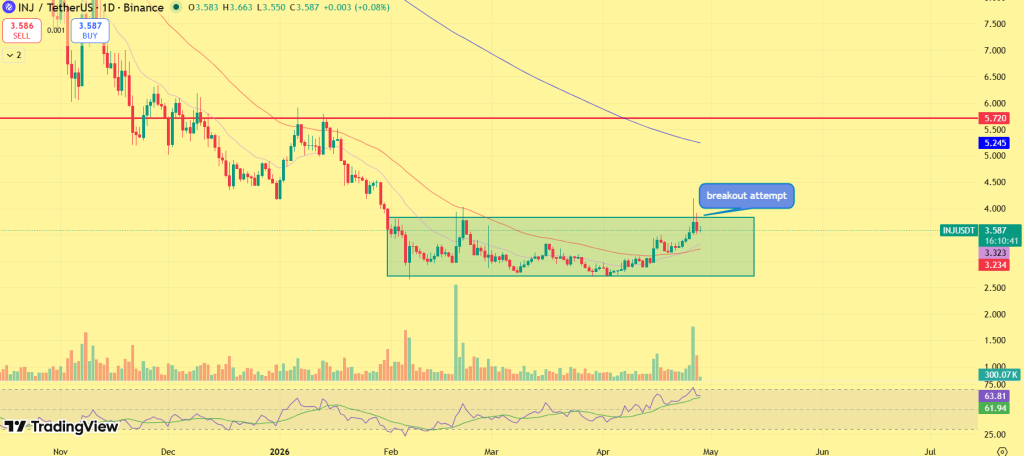
INJ price has moved out of a clear downtrend into a base formation, holding steady in the $3.20–$3.40 demand zone where selling pressure has faded.
Since then, INJ price has been consolidating within a tightening range, forming higher lows while approaching resistance near $3.80–$4.00. This reflects a compression structure, where momentum builds before a potential directional move.
Analyst commentary aligns with this setup, pointing toward a possible breakout as the descending trend weakens. However, confirmation remains key. Currently trading around $3.5–$3.6, INJ is testing this resistance with improving momentum. RSI is pushing toward 60, and volume is gradually expanding, both early signs of strengthening buyer interest.
A sustained move above $4.00 would confirm a breakout and open upside toward $5.20–$5.70. On the downside, $3.20 remains the critical support that holds the current structure intact.
Final Words
INJ remains in a transition phase, with structure improving but confirmation still pending. A sustained move above $4 would shift momentum decisively in favor of buyers, while failure to break could extend the current range. For now, the setup leans constructive, but the breakout is what validates it.
Price predictions for 2026 range from $5.00 to $10.00.
Long term forecasts suggest FIL price may hit $50.00 by the end of 2030.
Filecoin (FIL) is a decentralized storage network that enables users to store and retrieve data securely without relying on centralized cloud providers. FIL has been trading close to its long-term support zones after prolonged corrective phases. Throughout 2025, the token remained largely range-bound, signaling seller exhaustion at lower levels.
This extended consolidation has helped FIL to rebound from the support zone of $1.20. Connecting fundamentals with price action, Filecoin’s steady utility-driven narrative combined with a base-forming chart structure positions the asset for a potential trend transition.
As FIL moves into 2026, the key question remains whether improving on-chain usage and network relevance can translate into sustained upside momentum, shaping the broader price prediction outlook ahead.
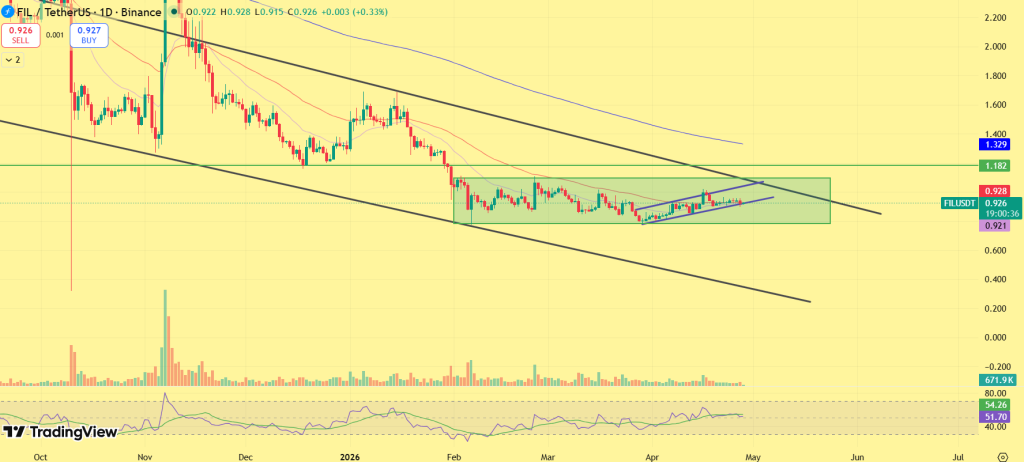
As April comes to a close, Filecoin is showing early signs of stabilization after a prolonged downtrend, with the price now holding near the $0.85–$1.00 range. Selling pressure has eased, and buyers are gradually stepping in on dips, suggesting the market is shifting from decline to base formation rather than continuing weakness.
At the same time, price remains capped below the $1.10–$1.20 resistance zone, which continues to act as the key barrier for any recovery. The current structure reflects compression, where volatility is tightening and price is building pressure just below resistance, often a precursor to a directional move. A confirmed breakout above $1.20 would signal a structural shift, opening the path toward the $1.50–$2.00 range, with further upside possible if momentum strengthens. However, until that breakout occurs, FIL may continue trading within its current range, with $0.75–$0.80 acting as immediate support.
For April–May 2026, FIL remains in a buildup phase, with the next move likely to be defined by a decisive break above $1.20.
Coinpedia’s Filecoin (FIL) Price Prediction 2026
Filecoin’s broader trajectory in 2026 points toward a rebuilding phase, where price is attempting to transition from prolonged weakness into a more constructive structure.
Following its earlier highs, FIL experienced an extended period of decline, driven by fading momentum and consistent supply pressure. This phase pushed the asset into lower valuation zones, where it is now attempting to establish a base. The current structure suggests that the market is stabilizing, but a sustained uptrend will depend on reclaiming higher resistance levels. The first meaningful threshold remains at $1.20, followed by more significant barriers near $2.00 and $2.50.
A move through these levels would indicate strengthening demand and a shift in market positioning, allowing price to gradually expand into higher ranges. Filecoin continues to build its narrative around decentralized storage and data infrastructure. Growth in data demand, network utilization, or enterprise-level integrations could act as key drivers for renewed interest.
If these developments align with improving market conditions, FIL could reprice toward the $3 to $10 range over the course of 2026. However, this outcome would require sustained momentum and progressive confirmation across resistance levels. Until then, Filecoin remains in a recovery phase, with the $0.70 level acting as a critical support base.
Recent Catalysts / News for Filecoin
Rising real usage focus: Filecoin is shifting toward demand-driven growth, with increasing emphasis on paid storage adoption rather than just network capacity.
AI storage narrative strengthening: Growing need for decentralized data storage, especially from AI-related use cases, is positioning FIL as a long-term infrastructure play.
Ecosystem integrations expanding: More blockchain and developer ecosystems are beginning to utilize Filecoin’s storage layer, supporting real utility beyond speculation.
FIL Price On-chain Outlook
Filecoin’s on-chain metrics continue to show steady structural improvement. One of the most talked-about developments is the launch and expansion of Filecoin OnChain Cloud (FOC), a major network upgrade designed to enhance on-chain storage usage and accessibility.
FOC’s deployment marks a shift towards more practical decentralized storage use cases, which could stimulate real demand.
Additionally, whale accumulation activity which surged late in 2025 alongside the rising token holding by large investors may fuel confidence ahead.
FIL Crypto Price Prediction 2026 – 2030
Year
Potential Low ($)
Potential Average ($
Potential High ($)
2026
3.00
6.00
10.00
2027
5.20
8.80
13.50
2028
9.00
12.50
18.00
2029
11.00
17.00
30.00
2030
16.00
25.00
50.00
Filecoin Crypto Price Prediction 2026
The FIL price range in 2026 is expected to be between $3.00 and $10.00.
Filecoin Price Prediction 2027
Filecoin (FIL) price range can be between $5.20 to $13.50 during the year 2027.
FIL Price Prediction 2028
The FIL Network price for 2028 is anticipated to lie within the range of $9.00 to $18.00.
FIL Coin Price Prediction 2029
Thereafter, the FIL price for the year 2029 could range between $11 and $30.00.
Filecoin Price Prediction 2030
Finally, in 2030, the price of FIL is predicted to maintain a steady positive. It may trade between $16.00 and $50.00.
FIL Price Prediction 2031, 2032, 2033, 2040, 2050
Based on the historic market sentiments and trend analysis of the largest cryptocurrency by market capitalization, here are the possible FIL price targets for the longer time frames.
Year
Potential Low ($)
Potential Average ($)
Potential High ($)
2031
55.00
62.00
72.00
2032
62.0
74.00
90.00
2033
70.00
88.00
110.00
2040
140.00
200.00
300.00
2050
320.00
350.00
400.00
FIL Price Prediction: Market Analysis?
Year
2026
2027
2030
Changelly
$15.80
$24.50
$52.10
CoinCodex
$11.90
$17.85
$29.45
Binance
$13.40
$21.10
$44.85
Never Miss a Beat in the Crypto World!
Stay ahead with breaking news, expert analysis, and real-time updates on the latest trends in Bitcoin, altcoins, DeFi, NFTs, and more.
FAQs
What is Filecoin (FIL) and what does it do?
Filecoin is a decentralized storage network where users rent out unused space and store data securely without relying on centralized cloud providers.
What is the Filecoin price prediction for 2026?
Analysts expect Filecoin to trade between $5 and $10 in 2026, supported by network adoption, improving sentiment, and a long base near key support.
Can Filecoin reach $50 by 2030?
Long-term forecasts suggest FIL could approach $50 by 2030 if decentralized storage demand grows and Filecoin strengthens real-world usage.
Is Filecoin a good long-term investment?
Filecoin’s value depends on adoption of decentralized storage. Strong fundamentals and steady utility make it a project to watch long term.
DOGE price prediction for 2026 suggests potential highs of $1.25
Long term forecasts indicate DOGE could reach $3.00 by 2030.
Dogecoin continues to hold its position as one of the most widely recognized meme-driven assets in the market, supported by strong community backing, increasing integration in payment use cases, and periodic attention from high-profile endorsements. While it does not rely on deep protocol-level fundamentals like traditional Layer-1 networks, its strength lies in liquidity, accessibility, and its ability to capture retail-driven momentum during favorable market cycles.
At the same time, its 2026 price structure reflects a shift from prolonged decline toward early stabilization. After trending lower through 2025, DOGE has started forming a base near key demand zones, with price compressing within a defined range rather than continuing downward. This change in behavior suggests that selling pressure is easing, while accumulation is gradually building beneath resistance.
This sets up a familiar pattern. When Dogecoin transitions from low-volatility consolidation into expansion, the move tends to be sharp and sentiment-driven rather than gradual. The current structure indicates that the market is approaching that decision point.
In this Dogecoin price prediction 2026–2030, we will break down how this evolving structure, combined with market momentum and adoption trends, could shape DOGE’s long-term trajectory. Keep reading for more clarity.
Dogecoin (DOGE) Price Prediction for April-May 2026
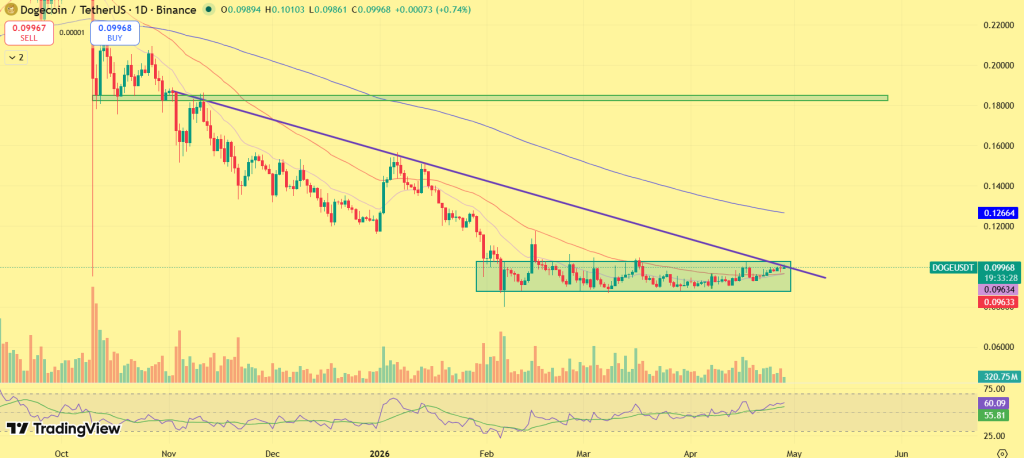
As April comes to a close, Dogecoin continues to trade near the $0.095–$0.10 range, maintaining a steady consolidation phase after its extended downtrend. The highlighted accumulation zone on the chart has remained intact throughout the month, with buyers consistently stepping in on dips, reinforcing this region as a reliable base. This repeated defense suggests that selling pressure has largely been absorbed, shifting the structure from decline to stabilization.
Rather than breaking lower, DOGE is now holding structure with a slight upward bias, indicating that the market is gradually transitioning into an accumulation phase. As long as this base continues to hold into early May, the probability of a breakout attempt increases.
On the upside, the immediate hurdle remains in the $0.105–$0.11 zone, which has capped recent recovery attempts. A sustained move above this level would confirm short-term strength, opening the path toward the $0.13–$0.15 range, where prior supply has historically emerged.
If momentum builds beyond that, the next level to watch sits near $0.18, although such a move would likely require broader market participation and improved sentiment across altcoins. However, the structure still needs confirmation. If DOGE fails to break resistance and slips below the $0.095 support, the price could revisit the $0.085 region, signaling that the consolidation phase needs more time before any meaningful expansion.
As May approaches, the focus shifts from holding support to breaking resistance, because once DOGE clears the $0.11 barrier, the move is likely to accelerate rather than unfold gradually.
Coinpedia’s Dogecoin (DOGE) Price Prediction 2026
Moving into the broader 2026 outlook, Dogecoin’s direction will likely be shaped by how the overall crypto cycle develops. Historically, DOGE has not required strong fundamentals to rally, it tends to respond quickly once liquidity and attention return to the market.
A move above $0.15–$0.18 would be the first sign that sentiment is shifting. From there, the next important zone lies around $0.30–$0.35, which could act as a mid-cycle barrier. If DOGE manages to maintain strength above this region, the structure begins to look more constructive, opening the door for a move toward $0.45–$0.50. Such a move would likely depend on broader market participation and renewed interest in meme-driven assets.
At the same time, if Dogecoin price struggles to hold above $0.08, the recovery timeline could extend, keeping DOGE in a longer consolidation phase. Overall, 2026 may not be about explosive moves initially, but rather about gradual rebuilding, with upside accelerating only if market conditions align.
Recent News/Catalysts for Dogecoin (DOGE)
Retail-driven momentum building again: Social sentiment around meme coins is picking up into May, with Dogecoin seeing renewed retail attention after months of muted activity, often an early signal before volatility expansion.
Whale accumulation near base: Large wallet activity has been gradually increasing around the $0.09–$0.10 zone, indicating accumulation rather than distribution, reinforcing the current support structure.
Altcoin rotation narrative strengthening: As Bitcoin stabilizes near higher levels, capital rotation toward high-beta assets like DOGE is starting to re-emerge, positioning it as a potential beneficiary if momentum expands in May.
Dogecoin Price Prediction 2026 – 2030
Year
Potential Low ($)
Potential Average ($)
Potential High ($)
2026
0.75
1.00
1.25
2027
1.15
1.35
1.50
2028
1.25
1.75
2.00
2029
1.50
2.15
2.65
2030
2.50
2.75
3.00
This table, based on historical movements, shows DOGE price to reach $3 by 2030 based on compounding market cap each year. This table provides a framework for understanding the potential DOGE price movements. Yet, the actual price will depend on a combination of market dynamics, investor behavior, and external factors influencing the cryptocurrency landscape.
Dogecoin (DOGE) Price Prediction 2026
As per Dogecoin’s Price forecast for 2026, the high price could be $1.25, the low may reach $0.75. This makes the average around $1.00.
Dogecoin Price Prediction 2027
Moving to 2027, the DOGE Price projects that it might hit a high price of $1.50 potentially. With a $1.15 low and an average of $1.35
DOGE Coin Price Prediction 2028
Moving to 2028, the Dogecoin Price Forecast predicts a high price of $2.00. On the flip side, the low may fall to $1.25, and the average is projected to be around $1.75.
DOGE Price Prediction 2029
As per Dogecoin Price Forecast 2029, DOGE’s high price is predicted to be $2.65, with a low of $1.50 and an average of $2.15.
Dogecoin (DOGE) Price Prediction 2030
Finally, as per the Dogecoin Price Forecast 2030, DOGE’s price can reach a high price of $3.00. With a low of $2.50 and an average of $2.75.
AAVE price is stabilizing after a recent selloff, with downside pressure fading as buyers defend the $90–$95 support zone. The drop followed short-term negative sentiment, but the move failed to extend, and price has since begun to recover.
At the same time, fresh developments are shifting the narrative. AAVE’s expansion onto Solana and a $20 million liquidity push are reinforcing confidence, bringing renewed participation into the market. With AAVE price now holding above its base and tightening below resistance, the structure is transitioning from weakness into a setup phase where the next move becomes critical.
AAVE Expands to Solana Ecosystem
AAVE’s deployment on Solana via Sunrise extends its accessibility across a high-activity DeFi environment. This integration enables native interaction across wallets, decentralized exchanges, and aggregators, allowing liquidity to move more efficiently across chains.
By tapping into Solana’s user base, AAVE expands its demand surface beyond its existing ecosystem. Such cross-chain expansion typically strengthens long-term participation, as it diversifies liquidity sources and reduces reliance on a single network.
$20M Liquidity Boost Supports Market Stability
AAVE’s ecosystem has also received a $20 million liquidity injection tied to Justin Sun and associated participants. This capital improves market depth and helps absorb volatility, particularly during recovery phases. Increased liquidity reduces downside fragility and allows price to stabilize more effectively after sharp moves.
Together with ecosystem expansion, this strengthens the broader positioning of AAVE as the market transitions out of its recent weakness.
AAVE Price Faces Key Breakout Test Near $110 After Stabilization
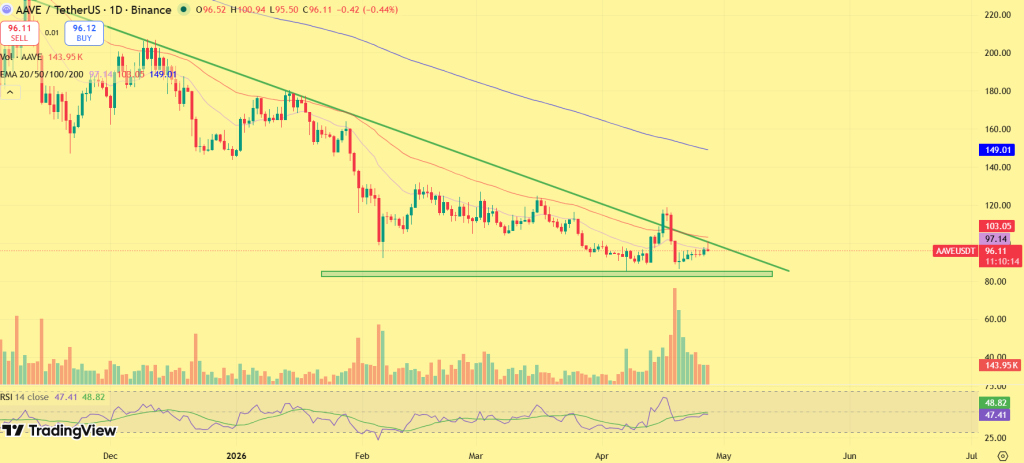
Following the selloff, AAVE price dropped into the $90–$95 demand zone, where selling pressure began to weaken and buyers stepped in. Since then, AAVE price has stabilized between $95 and $100, forming higher lows while compressing beneath a descending resistance trendline from the $140–$150 region. This creates a tightening structure, where price is building pressure below resistance.
The immediate resistance lies at $110–$115. A sustained move above this zone would confirm a structural shift, opening the path toward $130 and potentially $140–$145 if momentum strengthens. Momentum indicators support this recovery phase. RSI has moved back toward neutral levels around 47–50, indicating that bearish pressure has cooled without entering overbought conditions. Volume has also shown early signs of expansion during recovery attempts, reflecting improving participation.
On the downside, the $90 level remains critical. A breakdown below this zone would invalidate the recovery structure and shift AAVE price back into a broader consolidation range.
AAVE Price Eyes Recovery Continuation if $90 Support Holds
With selling pressure absorbed and structure stabilizing, AAVE price is now positioned for a potential continuation of its recovery. Holding above $90 keeps the setup intact, while a breakout above $110 would confirm a move into higher resistance zones. With improving participation and supportive developments, the bias remains tilted toward gradual upside as long as key support holds.
Onyxcoin price has moved into a new range after surging over 50%, with the Upbit listing bringing fresh liquidity into XCN price action. Instead of reacting with a short-lived spike, the move held above resistance, indicating that buyers are stepping in at higher levels. This shift reflects a transition in market behavior, where demand is no longer waiting at lower zones. With XCN price maintaining strength after the breakout, attention now turns to whether this structure can carry forward into the next phase.
Upbit Listing Sparks Liquidity Shift for XCN Token
The Upbit listing introduced a new layer of demand, and the impact is visible in how the XCN price now reacts to market pressure. As access expanded, buying activity shifted from passive accumulation to active participation, lifting the Onyxcoin price directly through resistance levels.
ONYXCOIN SURGES 50% AFTER UPBIT LISTING
Onyxcoin $XCN has rallied sharply following confirmation of its Upbit listing. The token jumped about 50% in the last 24 hours.
At peak, gains extended beyond 64% after the announcement.
This change in order flow allowed price to establish itself in a higher range instead of rotating back into previous zones. Such transitions typically mark the beginning of price discovery, where liquidity moves with the trend rather than waiting below it.
How the Breakout Resets Onyxcoin Price Trend
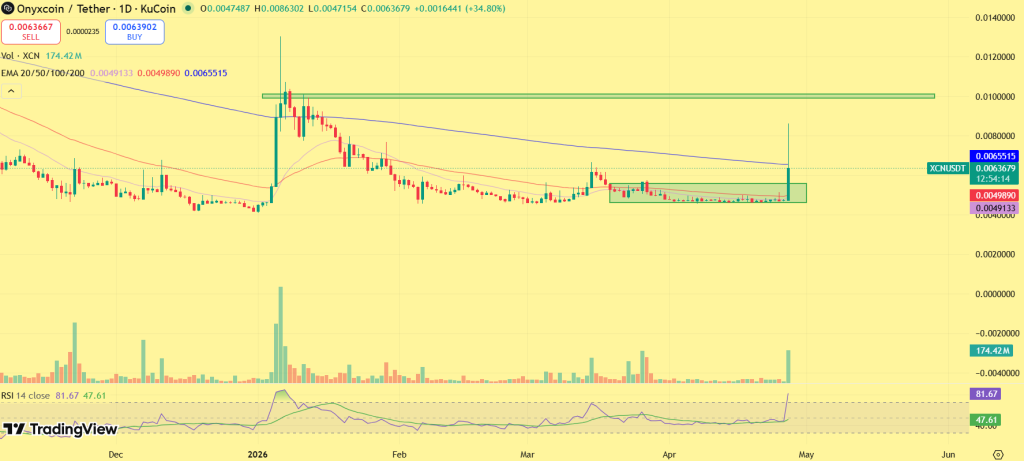
Before the listing-driven move, the Onyxcoin price remained confined within a defined consolidation range, with repeated rejection limiting upside. That structure has now changed. The breakout pushed the XCN price above this range and, more importantly, held it there. The absence of a return to prior levels indicates that the market has accepted a new value zone.
Pullbacks are now being absorbed within this higher range, showing that demand is adjusting upward rather than retreating. This is how a market transitions from accumulation into expansion. With the structure reset, the focus shifts to how the XCN price behaves around its new base. The $0.0060–$0.0065 zone now acts as immediate support. Holding above this level keeps the breakout intact and maintains the current structure.
On the upside, the recent high near $0.0085 becomes the next area of interest. A sustained move above this zone would extend the range, opening the path toward the $0.010–$0.012 region. A move back below support would weaken momentum, but as long as the Onyxcoin price holds above the breakout zone, the structure remains aligned with continuation.
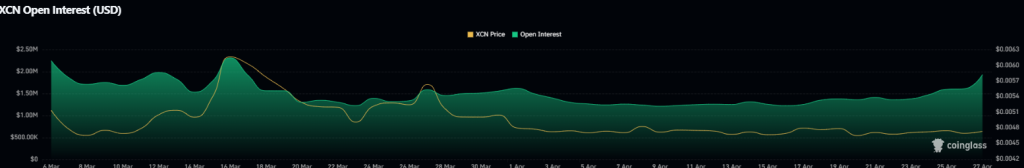
Derivatives Activity Signals Rising Participation
The shift in the Onyxcoin price is supported by broader market participation. As the XCN price advanced, derivatives activity expanded alongside it, with volume surged 10882% and open interest around 430% to $8.60M. This reflects new positions entering the market rather than reactive short covering.
At the same time, positioning remains balanced, allowing the move to develop without immediate signs of excess. This type of participation typically supports continuation, provided liquidity remains consistent.
XCN Price Outlook: Can the Breakout Sustain?
With the breakout holding, the Onyxcoin price remains supported above the $0.006 zone, keeping the current structure intact. A move above $0.0085 would confirm continuation toward the $0.010–$0.012 range, while a drop below support would shift the XCN price back into consolidation. For now, the trend remains aligned higher as long as the base holds.
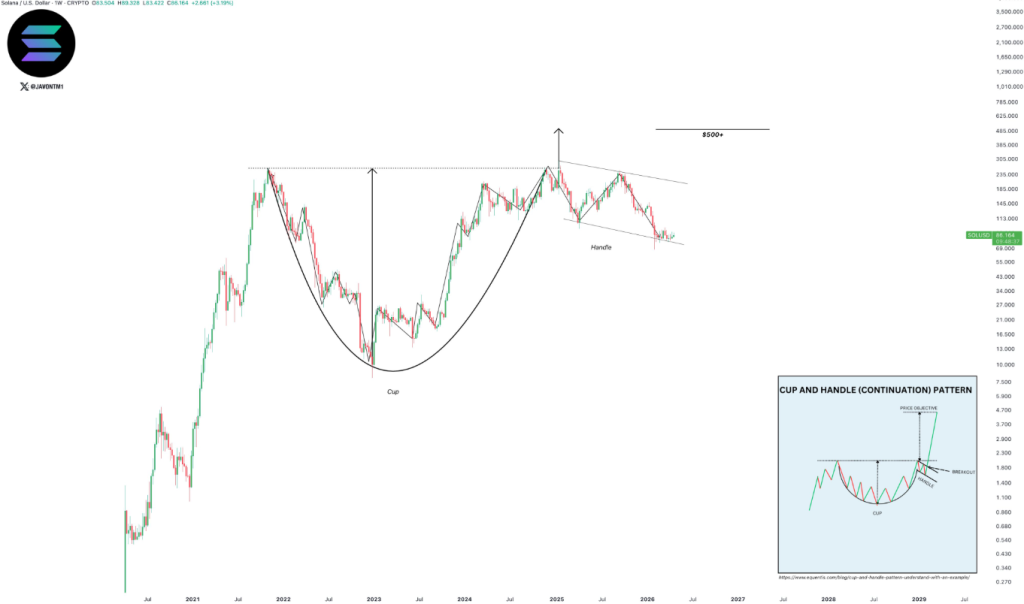
Solana is closing in on a decisive test near $86, with the price holding firm at a level that has yet to reject the move. While the market remains pinned below resistance, the structure behind it has already taken shape. A higher timeframe cup-and-handle formation is nearing completion, and network growth continues to expand alongside rising liquidity, both aligning with the current price strength. With pressure building at this level and no rejection so far, the next move from here carries more weight, either confirming the breakout or keeping the market within its current range, a setup that has been widely discussed across recent Solana News.
Network Growth Builds, but Momentum Remains Uneven
Solana’s underlying network strength continues to expand, even as speculative activity remains soft. Upgrades like Firedancer and Alpenglow are improving scalability and execution speed, positioning the network for sustained demand. At the same time, stablecoin supply has climbed to around $17.4 billion, with growing activity in real-world assets and consistent on-chain usage.
SOLANA ECOSYSTEM WATCH: WHAT'S MOVING ON-CHAIN THIS WEEK$SOL is trading near $86 with the network now sitting at the intersection of major upgrades and a sluggish memecoin recovery. Firedancer is running over 1M TPS, Alpenglow is delivering sub-150ms finality, and the SEC-CFTC… pic.twitter.com/hDdGZMbJZI
However, momentum from high-risk segments has yet to recover, with memecoin-driven activity and network revenue still below prior peaks. This leaves Solana in a position where the foundation is strengthening, but broader momentum is yet to fully align with it.
Solana’s price structure aligns with a developing cup-and-handle formation, where the broader rounding base has already formed and price is now consolidating within the handle phase. While, support continues to hold during this consolidation, with pullbacks getting absorbed early and failing to extend lower. This reflects controlled positioning rather than distribution, keeping the structure intact beneath resistance.
The handle is compressing price just below key levels, with repeated tests failing to trigger downside continuation. This behavior indicates that selling pressure is not expanding despite resistance holding. If this structure confirms with a breakout, the pattern extends beyond short-term targets.
Based on classical technical projections, a completed higher timeframe cup-and-handle opens the possibility of a broader expansion phase, with some long-cycle projections placing Solana price toward the $500 region. That scenario, however, remains conditional on sustained structure, liquidity continuation, and macro alignment.
Key Levels in Focus as SOL Price Tests Resistance
The $86 zone remains the immediate level in play, with price continuing to press against it without meaningful rejection. A sustained move above this region would confirm a breakout from the current compression and open the path toward the $95–$100 range, where the next supply cluster is likely to emerge.
On the downside, the $80–$82 region acts as the first layer of support, where recent pullbacks have been absorbed. Holding above this zone keeps the current structure intact and maintains breakout pressure. A deeper shift below this range would weaken the setup, exposing the $74–$76 area as the next demand zone and signaling a return to broader consolidation rather than continuation.
Outlook
Holding near $86 keeps the structure intact, with the market positioned just below a key resistance zone. If pressure continues to build without rejection, the setup remains aligned for a breakout into a higher range. Failure to hold this structure would keep SOL within consolidation, delaying the move. For now, SOL remains at a decision point, with the next move likely to define short-term direction.
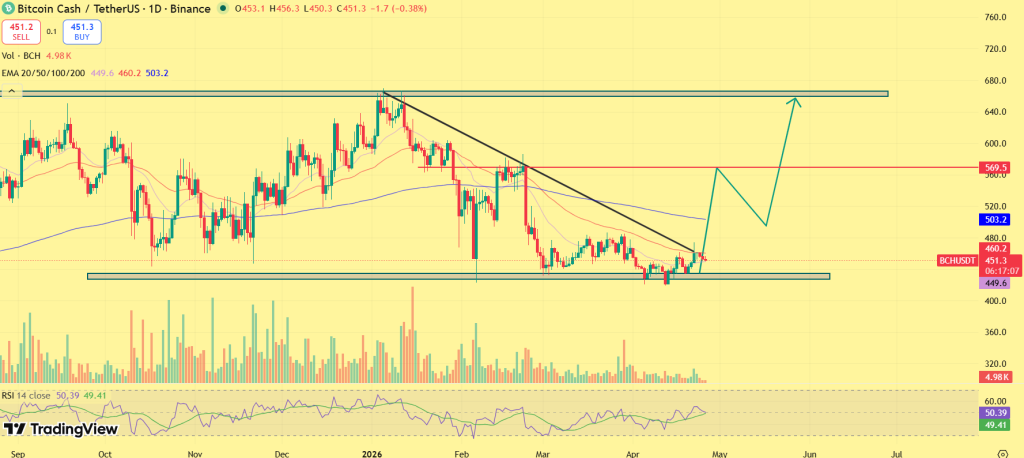
Bitcoin Cash price trades near $466, holding a critical demand zone around $440-$470.
If the market regains strength, BCH could expand toward the $1200 region by the end of 2026.
In a stronger long-term cycle, Bitcoin Cash may price closer to $3,000 by 2030.
Bitcoin Cash (BCH), one of the most established peer-to-peer payment-focused cryptocurrencies, has entered 2026 with renewed momentum as price structure begins to strengthen after a prolonged consolidation phase.
Following months of range-bound movement, BCH has started to show signs of expansion, with buyers gradually stepping in and pushing price toward higher levels. This shift suggests that the coin may be transitioning from accumulation into a potential breakout phase. If momentum continues to build, BCH could be setting up for a move toward $600 in the near term and potentially $1200 over the broader cycle.
The key question now is whether this emerging strength can sustain. Can Bitcoin Cash maintain its momentum and reclaim higher levels in 2026? Here’s a detailed breakdown of 2026-2030-year trajectory.
Bitcoin Cash (BCH) Price Prediction for April 2026
Bitcoin Cash is sitting at a critical point near $455, and the market is no longer drifting, it’s deciding. After weeks of tight movement, price is pressing repeatedly against the $460–$480 resistance zone, while every dip toward $430–$440 continues to get absorbed quickly.
A sustained move above $480 changes the structure. It shifts BCH from consolidation into expansion, opening a move toward $500–$520, where the next major supply sits. If momentum follows through, the upside can extend quickly, especially if the broader market supports altcoin strength.
But until that breakout happens, caution remains. If BCH continues to get rejected near resistance, the market is likely to stay range-bound, with price rotating back toward the $420–$430 support zone. That level has held multiple times, and losing it would delay any bullish continuation.
For April–May 2026, BCH is expected to trade between $480 and $560, with a breakout above $480 acting as the trigger that defines the next move.
Looking ahead, BCH’s broader outlook suggests a market that is moving out of consolidation and into a potential expansion phase. BCH coin has spent considerable time building a base, absorbing supply and stabilizing after previous volatility. This phase often precedes stronger directional moves, particularly when supported by improving structure.
The recovery path depends on reclaiming key levels. The first confirmation lies above $500, followed by a stronger expansion zone near $700–$800. These levels act as checkpoints for sustained momentum. Once these zones are cleared, price behavior typically accelerates, allowing the asset to transition into a higher trading range.
In this scenario, BCH could advance toward the $600–$1200 range in 2026, reflecting a full expansion cycle driven by structural breakout. However, if momentum weakens and key supports fail, the market may revert to a range-bound phase before attempting another move higher.
Recent News/Catalysts For Bitcoin Cash (BCH)
Renewed interest in payment-focused cryptocurrencies, supporting BCH’s core use case.
A protocol upgrade focused on improving network capabilities is approaching, bringing renewed attention to BCH’s utility narrative.
The asset is regaining traction as a low-cost payment alternative, aligning with a market increasingly focused on real-world use cases.
Market rotation toward established altcoins, bringing attention back to legacy assets like BCH.
Bitcoin Cash Price Targets 2026 – 2030
Year
Potential Low ($)
Potential Average ($
Potential High ($)
2026
600.00
850.00
1200.00
2027
820.00
1200.00
1600.00
2028
1100.00
1800.00
2100.00
2029
1500.00
2200.00
2500.00
2030
2000.00
2500.00
3000.00
BCH Price Prediction 2026
In 2026, Bitcoin Cash price could project a low price of $600.00, an average price of $850.00, and a high of $1200.00.
Bitcoin Cash Price Prediction 2027
As per the Bitcoin Cash price Prediction 2027, Bitcoin Cash may see a potential low price of $820.00, The potential high for Bitcoin Cash price in 2027 is estimated to reach $1600.00
BCH Price Analysis 2028
In 2028, Bitcoin Cash price is forecasted to potentially reach a low price of $1100.00, and a high price of $2100.00
Bitcoin Cash Price Prediction 2029
Thereafter, the Bitcoin Cash (BCH) price for the year 2029 could range between $1500.00, and $2500.00
Bitcoin Cash Price Forecast 2030
Finally, in 2030, the price of Bitcoin Cash is predicted to maintain a steady and positive. It may trade between $2000.00 and $3000.00
The long-term projection assumes Bitcoin Cash (BCH) sustains relevance in overall cryptocurrency adoption and the continued development of blockchain payment solutions, with growth moderating over time as the asset matures.
Stay ahead with breaking news, expert analysis, and real-time updates on the latest trends in Bitcoin, altcoins, DeFi, NFTs, and more.
FAQs
What is the prediction for Bitcoin Cash in 2026?
Bitcoin Cash could trade between $600 and $1,200 in 2026, with an average around $850 if the market regains momentum and BCH breaks the key $650–$700 resistance zone.
How much will Bitcoin Cash be worth in 2030?
Bitcoin Cash could trade between $2,000 and $3,000 by 2030, depending on global crypto adoption, market cycles, and BCH’s role in digital payments.
What is the Bitcoin Cash price prediction for 2040?
Long-term projections suggest BCH could reach $8,200 to $12,000 by 2040 if blockchain payments grow and the network maintains strong adoption and relevance.
Can Bitcoin Cash grow beyond its current use case?
Yes, BCH could grow through wider merchant adoption, faster payments, and improved on-chain utility in real-world transactions.
Is Bitcoin Cash a good long-term investment?
BCH has long-term potential due to low fees, fast transactions, and growing merchant adoption, but price depends on broader crypto market trends.
Can Bitcoin Cash reach its all-time high again?
Revisiting previous highs is possible if BCH sees sustained adoption and a confirmed long-term trend reversal, though it’s not guaranteed.
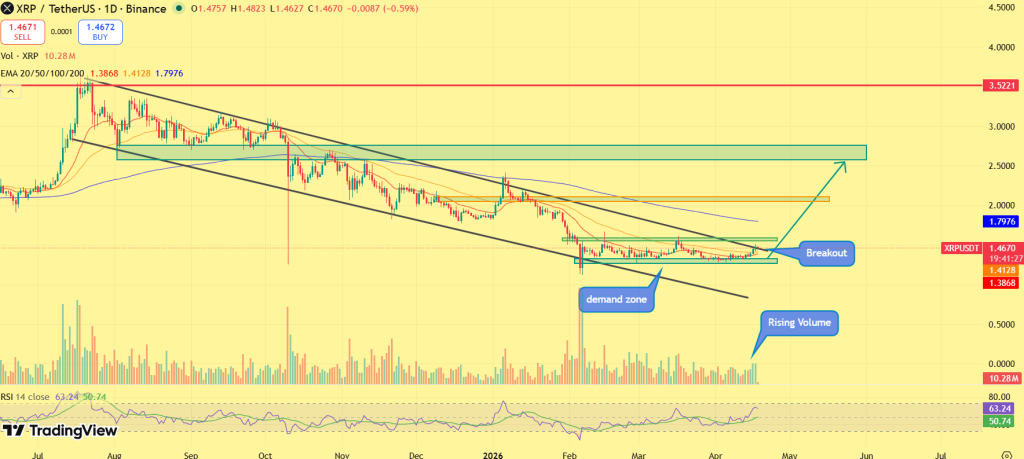
XRP holds a strong demand zone at $1.30–$1.40. If support remains intact, the token could shift from consolidation to recovery as broader crypto market momentum builds..
Long-term forecasts suggest XRP could reach $5–$6 by 2026 and potentially $18 by 2030, driven by institutional adoption, Ripple partnerships, and global payment integration
Ripple (XRP) Ripple’s XRP remains one of the most closely watched assets in the crypto market, largely due to its strong positioning in the cross-border payments sector and the continued expansion of Ripple’s financial infrastructure. Over the years, Ripple has focused on building partnerships with banks and payment providers to streamline international settlements through blockchain technology. XRP’s long-term outlook continues to revolve around global payment integration, institutional partnerships, and the adoption of RippleNet and On-Demand Liquidity solutions. These developments could gradually strengthen XRP’s role as a bridge asset for international payments.
XRP price structure around $1.30–$1.40 has emerged as an important demand zone where buyers have shown consistent interest. If this area continues to hold, the market could gradually shift from consolidation to recovery. With the broader crypto market entering another potential expansion phase, XRP remains positioned as one of the major altcoins that could benefit from renewed institutional and retail participation. Now, making this the most ideal time for XRP price prediction 2026-2030 to be in more focus. Read this to know in depth what’s coming next in XRP.
As April draws to a close, XRP’s price action reflects a market that is gradually transitioning out of a prolonged corrective phase, with structure stabilizing above the $1.30–$1.40 demand zone. After months of consistent lower highs within a descending channel, the recent compression near support suggests that selling pressure has eased while buyers are starting to step in more actively.
XRP is now trading just below a key resistance trendline, with price tightening into a narrow range as participation begins to improve. This combination of compression and rising activity typically precedes a directional move, placing the asset at a critical breakout stage heading into May.
The immediate focus now shifts toward the $1.50–$1.70 region. A sustained move above this zone would confirm a breakout from the descending structure, opening the path toward the $1.90–$2.20 level, followed by a potential extension into the $2.20–$2.50 supply zone if momentum continues to build. This aligns with the broader structure where reclaiming lost resistance levels becomes key to shifting sentiment.
However, the structure still requires confirmation. If XRP fails to break above resistance and faces rejection, the price may continue consolidating within the current range. A breakdown below the $1.30 support could weaken the setup, potentially pushing the asset back toward lower levels and delaying the recovery phase.
In this context, XRP in May may reach the $1.90–$2.50 range if the breakout sustains, while failure to confirm strength could keep the price range-bound near current levels as the market continues to build momentum.
CoinPedia’s XRP Price Prediction 2026
The broader price structure for XRP in 2026 suggests a market transitioning out of a corrective phase, but still awaiting confirmation of a sustained trend reversal. Following its rally in previous cycles, XRP peaked near the $3.50 region before entering a prolonged downtrend, defined by a descending resistance structure and consistent lower highs throughout 2025. This trend has carried into early 2026, with price recently stabilizing near the $1.20–$1.30 demand zone as selling pressure begins to ease.
At this stage, the focus shifts toward whether XRP can reclaim key resistance levels and attract renewed demand. The immediate barrier remains at $1.70, followed by stronger resistance at $2.50 and the major supply zone between $2.60–$2.80. Beyond technical structure, regulatory and institutional catalysts are likely to play a decisive role in XRP’s trajectory through 2026.
Developments around U.S. crypto legislation, particularly frameworks such as the CLARITY Act, aimed at defining digital asset classifications, could provide long-awaited regulatory certainty. For XRP, which has been heavily influenced by legal outcomes, clearer classification could significantly improve institutional confidence and unlock broader participation.
At the same time, ongoing expansion of Ripple’s enterprise payment solutions and XRP Ledger (XRPL) integrations in cross-border settlement continues to strengthen its real-world use case. Any acceleration in adoption among financial institutions or payment corridors could act as a direct demand driver. Additionally, increasing discussion around spot crypto ETF expansion beyond Bitcoin and Ethereum introduces a longer-term narrative tailwind. While speculative at this stage, any progress toward broader altcoin ETF inclusion could materially shift liquidity flows toward assets like XRP.
If these catalysts align with a breakout above key resistance levels, XRP could transition into a recovery phase. A sustained move above $2.50 would signal structural improvement, with a breakout above $3.80 opening the path toward the $6.00–$9.50 range over time. However, until both regulatory clarity and technical confirmation materialize, XRP remains in a transitional phase. Failure to hold the $1.20 support could extend consolidation and delay upside momentum.
Recent News/Catalysts for XRP
Progress around U.S. crypto regulation, especially frameworks like the CLARITY Act, is improving sentiment around XRP’s long-standing legal overhang.
Expansion of XRP utility across payment corridors and enterprise integrations continues to strengthen its real-world demand narrative.
Ongoing XRP Ledger upgrades and ecosystem developments are enhancing network efficiency and institutional readiness.
Improving macro sentiment and broader market recovery are supporting renewed capital rotation into large-cap altcoins like XRP.
XRP On-Chain Outlook
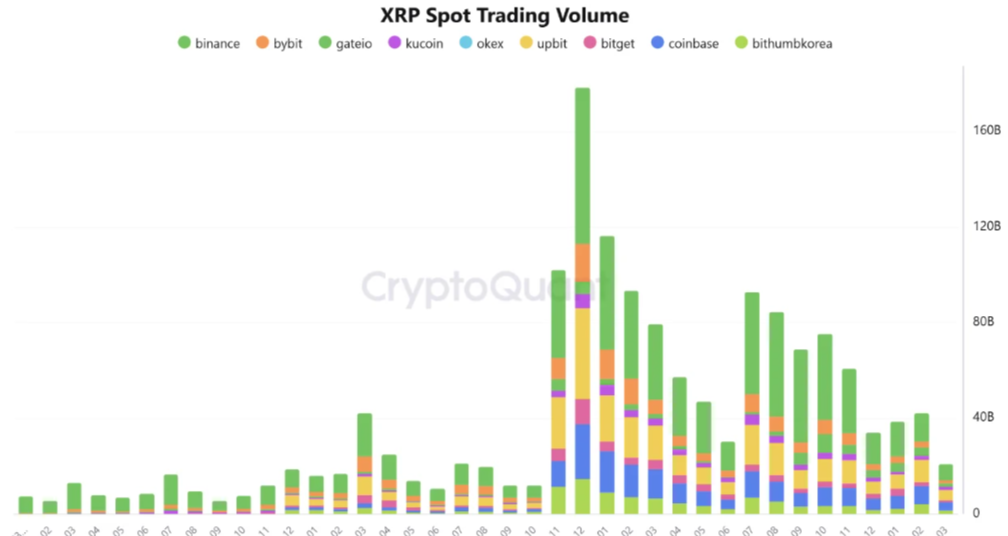
XRP’s on-chain data is currently pointing toward a cooling market environment, where activity has slowed but structural conditions are quietly improving. Spot trading volume across exchanges has dropped to its lowest level since 2024, reflecting reduced participation and weaker short-term momentum. This decline indicates that the market is no longer driven by aggressive trading, but is instead moving through a low-liquidity consolidation phase. At the same time, liquidity remains concentrated on major platforms like Binance, Upbit, and Coinbase, suggesting that while overall activity has declined, core market interest is still intact.
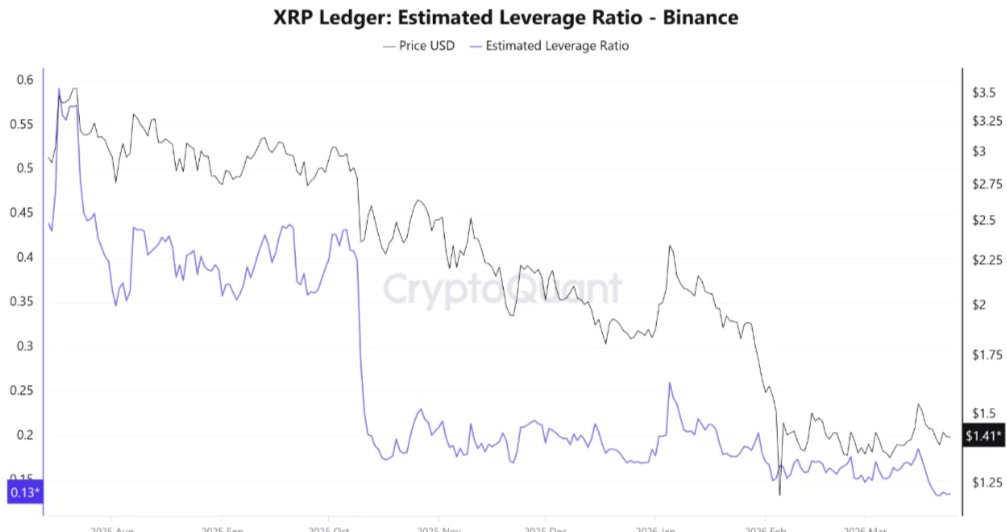
On the derivatives side, a more significant shift is unfolding. XRP’s leverage and open interest in Binance have dropped sharply, signaling a major reset in speculative positioning. The estimated leverage ratio has fallen substantially from previous highs, while open interest has cooled to much lower levels. This indicates that leveraged traders have largely exited or reduced exposure, removing excess risk from the market.
This combination of declining spot activity and reduced leverage suggests that XRP is transitioning from a highly speculative phase into a cleaner, more stable structure. With the market now less crowded and less prone to liquidation-driven volatility, the current setup reflects a reset phase, where pressure is building more gradually.
Overall, XRP’s on-chain signals point toward a market that is not weakening, but resetting after excess, creating conditions that often precede a more sustainable and directional move once momentum returns.
Ripple (XRP) Price Prediction 2026 – 2030
Year
Potential Low ($)
Potential Average ($
Potential High ($)
2026
3.40
6.50
9.50
2027
7.50
10.00
12.00
2028
8.80
11.50
16.00
2029
14.20
19.00
22.00
2030
18.80
23.00
30.00
Ripple (XRP) Price Prediction 2026
The XRP price range in 2026 is expected to be between $3.40 and $9.50
XRP Price Prediction 2027
Ripple (XRP) price range can be between $7.50 to $12.00 during the year 2027.
XRP Price Forecast 2028
In 2028, Ripple is forecasted to potentially reach a low price of $8.80, an average price of $11.50, and a high price of $16.00.
XRP Price Targets 2029
Thereafter, the XRP price for the year 2029 could range between $14.20 and $22.00.
Ripple (XRP) Price Prediction 2030
Finally, in 2030, the price of XRP is predicted to remain steady and positive. It may trade between $18.80 and $23.00.
Based on historical market sentiment and trend analysis, the following are the possible XRP price targets for longer-term time frames.
Year
Potential Low ($)
Potential Average ($)
Potential High ($)
2031
25.00
29.50
35.25
2032
31.50
36.75
41.25
2033
35.75
42.25
47.75
2040
97.50
135.50
179.00
2050
219.25
331.50
526.00
Market Analysis
Year
2026
2027
2030
Changelly
$3.00
$6.50
$17.76
DigitalCoinPrice
$4.20
$7.50
$18.00
WalletInvestor
$4.80
$7.90
$20.00
Never Miss a Beat in the Crypto World!
Stay ahead with breaking news, expert analysis, and real-time updates on the latest trends in Bitcoin, altcoins, DeFi, NFTs, and more.
FAQs
What is the XRP price prediction for 2026?
XRP could trade between $3 and $6 in 2026 if crypto market momentum strengthens and Ripple expands partnerships with banks using RippleNet and ODL.
How high will XRP go in 2030?
XRP could potentially reach $18–$30 by 2030 if the crypto market enters a strong bull cycle and Ripple expands global payment partnerships.
What is the price prediction for XRP in 2031?
Market projections suggest XRP could trade around $25–$35 in 2031, depending on global crypto adoption and Ripple’s continued growth in payment infrastructure.
How much will 1 XRP be worth in 2040?
If adoption of blockchain payments grows and Ripple strengthens its financial network, XRP could trade between $97 and $179 by 2040.
How much will 1 XRP be worth in 2050?
Long-term projections indicate XRP could reach $219–$526 by 2050 if blockchain payment networks become widely used across global financial systems.
What could drive XRP’s price growth long term?
XRP’s long-term growth may depend on global payment adoption, institutional partnerships, and wider use of Ripple’s blockchain infrastructure.
Is XRP a good investment?
XRP may be a promising investment due to its role in cross-border payments and growing institutional adoption, but price volatility and regulation risks remain.
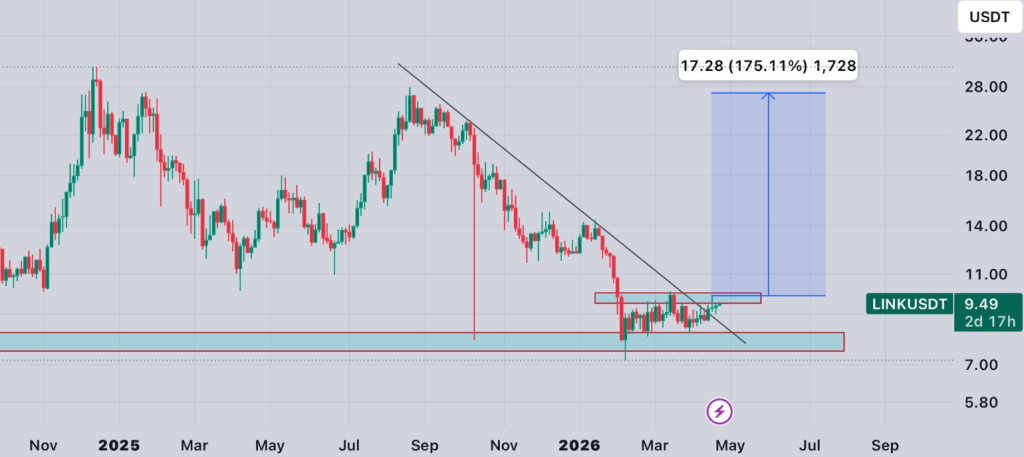
Chainlink is quietly attracting steady capital, with ETF inflows now crossing $111 million while price continues to hold firm near the $9.40 region.
Rather than a sharp breakout, the move is developing through consistent accumulation, with inflows building across multiple sessions. This type of steady demand tends to support structure over time rather than trigger short-lived spikes. With capital continuing to enter while LINK price stabilizes near highs, the current setup reflects underlying strength rather than exhaustion.
ETF Inflows Signal Sustained Institutional Demand
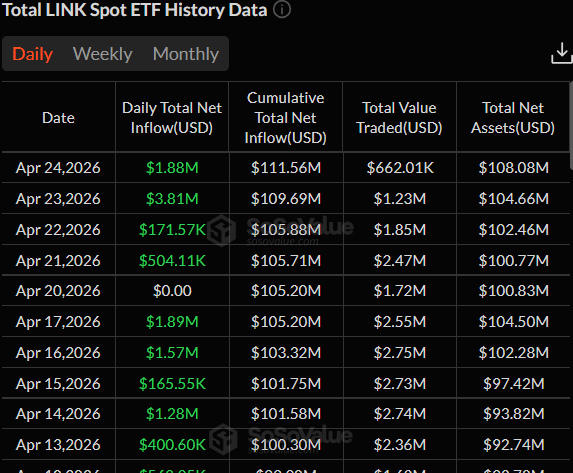
Recent data shows a clear trend in capital allocation toward Chainlink. Daily inflows have remained consistently positive, with $3.81M recorded on April 23 and $1.88M on April 24, pushing cumulative inflows to approximately $111.56M.
At the same time, total net assets have expanded beyond $108M, reflecting continued capital retention within the product. Instead of isolated inflow spikes, the data shows repeated accumulation over consecutive sessions. That suggests ongoing positioning rather than opportunistic entry. As inflows continue to build without sharp reversals, it reflects confidence in holding exposure rather than rotating out quickly. This type of behavior typically supports gradual price stability and longer-term structure development.
Whale Accumulation Builds as Supply Continues to Be Absorbed
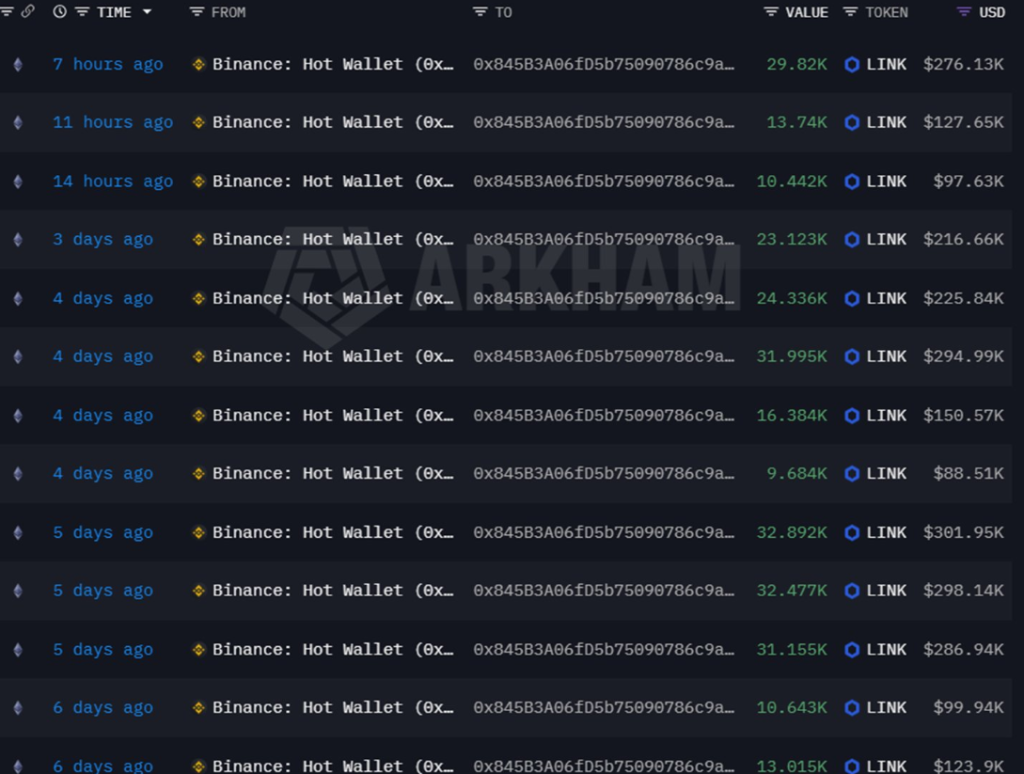
Alongside ETF flows, accumulation from larger players continues to build beneath the surface. A long-term investor wallet has accumulated nearly 2.8 million LINK (≈$2.59M) over the past six days, with entries concentrated around the $9.25 region. The activity remains ongoing, indicating that positioning is still in progress rather than completed.
At the same time, the Chainlink Reserve has added over 123,000 LINK (~$1.1M), taking total holdings beyond 3.3 million LINK. This introduces protocol-level demand alongside external capital inflows. However, upside remains measured. The 19 million LINK unlock from early April continues to act as an overhead supply layer, with the market still working through that liquidity.
Chainlink Price Analysis: Structure Builds as LINK Holds Above Key Zone
After an extended period of consolidation, the structure around the $9.00 region has continued to hold without breakdown, establishing it as a stable base. From there, upside attempts have started to expand, with price pushing toward the $9.40 region while maintaining higher lows within the current range. Pullbacks have remained controlled, failing to break back into lower zones, which indicates that buyers are defending levels rather than reacting late.
Meanwhile, the range is tightening just below local highs, suggesting that the market is stabilizing rather than rejecting the current levels. There is no aggressive expansion or exhaustion behavior, keeping the move orderly. As long as the structure continues to hold above the $9.00–$9.20 region, the current flow remains intact. This keeps the path open toward the next resistance band near $10.20–$10.50, where the market is likely to test supply. A shift below this base would change the structure back into consolidation, but current behavior continues to favor stability with gradual upside pressure.
Final Outlook
With ETF inflows continuing to build and structure holding above key support, Chainlink remains positioned for gradual upside as long as current levels are maintained. While immediate expansion may remain measured, sustained inflows and stable positioning keep the path open toward higher resistance zones, with continuation dependent on holding the established base.
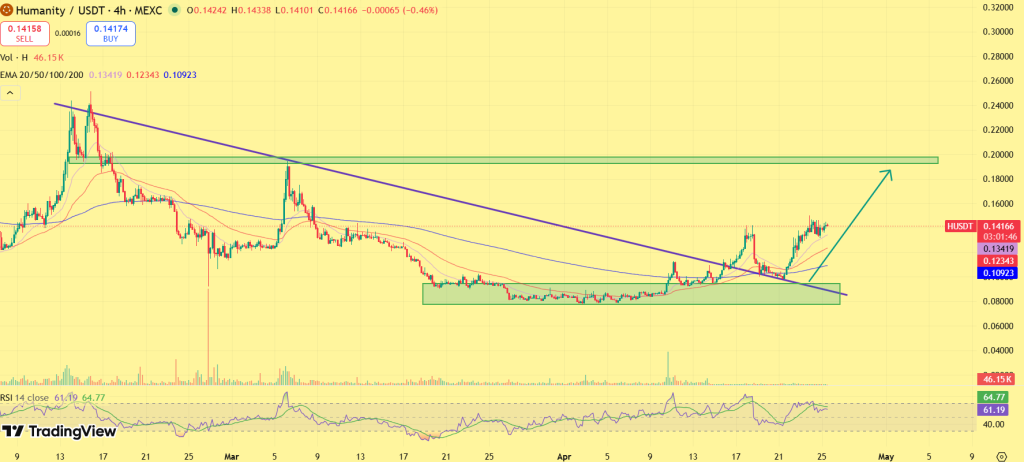
Humanity Protocol (H) price has surged nearly 40% and is holding firm above the $0.120 level, with price consolidating near highs instead of reverting to the prior range, an early indication of strength following the breakout. The level, which capped upside through the previous phase, is now acting as support, and the absence of immediate selling pressure keeps the structure tilted higher.
At the same time, participation is expanding alongside price, reinforcing the move rather than fading into it. With gains being retained and activity building in parallel, the setup shifts from a breakout event toward a continuation structure.
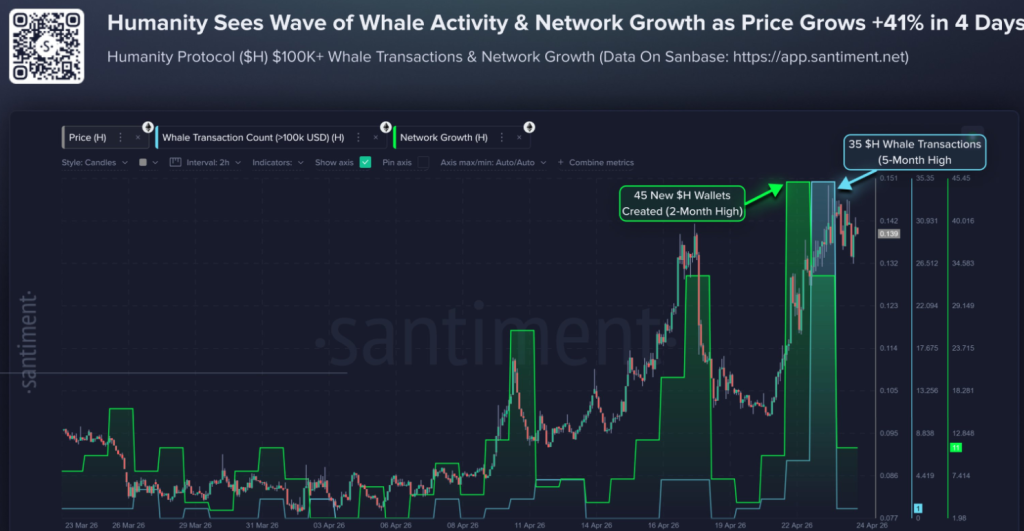
On-Chain Data Signals Rising Participation
On-chain metrics are moving in line with the price shift. Whale transactions have climbed to their highest level in five months, indicating that larger holders are actively positioning during the early phase of the move rather than distributing into strength.
At the same time, network growth has accelerated to a two-month peak, reflecting increasing user activity and fresh participation entering the ecosystem. When both large-holder activity and network expansion move together, the structure tends to strengthen. It suggests that demand is not isolated but distributed, supporting stability at higher levels and reducing the likelihood of a short-lived move.
After multiple sessions of compression around the $0.09–$0.10 zone, downside attempts continued to stall, with selling pressure getting absorbed rather than extended lower. That phase established the base from where the move developed.
As the structure tightened, the descending trendline that capped prior rallies came back into focus. Once that barrier gave way, expansion followed quickly, carrying the move through $0.120 and into a higher range. From there, the key signal was not the breakout itself but the reaction that followed. Instead of rotating back into the prior range, the market held above $0.120 and began forming higher lows just above that level. This shift indicates that the breakout zone is being defended rather than retested as resistance.
Meanwhile, pullbacks have remained shallow, with each dip finding support sooner than the previous one. That behavior keeps the range compressed near highs and limits the ability for supply to re-enter the market. As this structure continues to hold, the breakout remains valid, with $0.120 acting as the base for the current move. A sustained hold above this level keeps the path open toward the next resistance band near $0.16–$0.18, where the market is likely to encounter the next supply.
However, a move back below the breakout zone would shift the structure back into its previous range. Until then, the current flow remains aligned toward continuation.
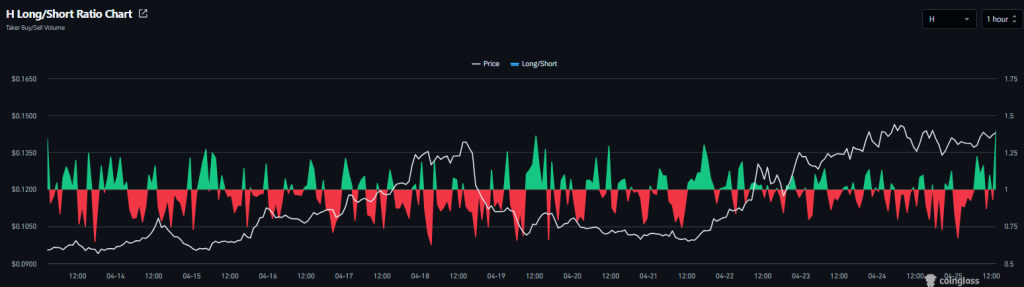
Long/Short Ratio Reflects Strength Without Overcrowding
Positioning data continues to support the broader structure. The long/short ratio holding near 1.39 reflects a bullish bias, but without the imbalance typically seen in overcrowded trades. At the same time, leverage remains contained, reducing the risk of sharp liquidation-driven volatility.
As positioning builds gradually rather than aggressively, the environment remains supportive of continuation, allowing the structure to develop without destabilizing pressure.
Final Take
With the breakout holding and structure stabilizing above $0.120, the current setup continues to lean higher as long as acceptance at this level persists. While upside remains open toward the $0.16–$0.18 zone, the move now depends less on expansion and more on whether the market continues to hold above its base without slipping back into the prior range. A sustained hold keeps continuation in play; a loss of structure would shift the focus back to consolidation.