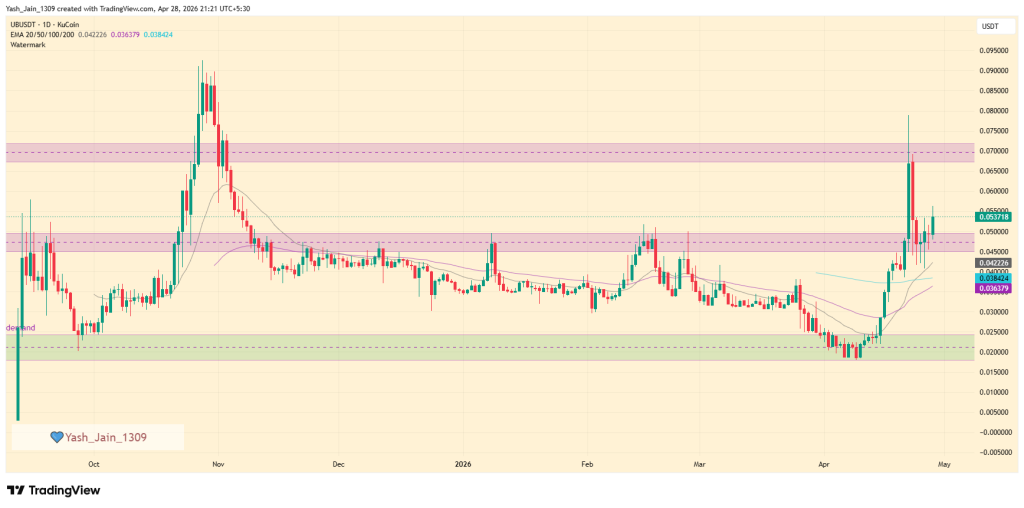
The UB price just is on fire in April that many altcoins still dream about, today after a pull back it woke up again, broke resistance, and reminded traders it still has a pulse. Sitting around $0.0537, the move comes right after the OKX perpetual contract listing news, and yes, the timing isn’t subtle.
A clean breakout, a leverage catalyst, and suddenly everyone’s paying attention again.
Resistance finally cracks after months of pressure
For months, the $0.045–$0.048 zone acted like a brick wall. Price poked it, tested it, got rejected and repeat cycle. Until now.
The UB price has finally pushed through that ceiling and, more importantly, closed above it on the daily timeframe. That’s not just a random spike, basically, it’s a structural shift. Former resistance now flips into support, at least in theory.
But let’s be real. Breakouts are easy. Holding them? That’s where things get messy.
EMA crossover hints at momentum shift
Now here’s where the technical crowd starts nodding.
The 20-day EMA has crossed above the longer-term averages, signaling a clear momentum flip. Short-term trend? Bullish. No debate there.
And price isn’t just above these EMAs but it’s stretched well beyond them. That usually screams strength… or exhaustion. Sometimes both.
So yeah, momentum is here. But it’s not exactly subtle.
Next targets sit higher, but not easy
So, what’s next?
The immediate upside target lands in the $0.068–$0.072 supply zone. That’s where sellers previously stepped in, and chances are, they’ll show up again. If momentum keeps pushing, the longer-term objective sits near $0.090 which is the late October highs.
Sounds clean on paper. But here’s the kicker, since Unibase price doesn’t move in straight lines, especially not after news-driven spikes.
Perpetual listing brings volatility, not stability
Let’s talk about the real catalyst: leverage. The OKX perpetual contract listing isn’t just another headline, as it introduces a whole new layer of volatility. Traders now get to amplify positions, and that usually means sharper moves in both directions.
The 15% intraday surge reflects optimism, sure. But it also sets the stage for classic “sell the news” behavior.
If that kicks in, the UB price could easily wick back toward the $0.050 region. And if things cool further, that freshly broken $0.048 level becomes the line in the sand. Hold it, and bulls stay in control. Lose it, and the breakout starts looking… questionable.
So yeah, momentum is real. Structure is improving. But with leverage entering the chat, things are about to get a lot less predictable.
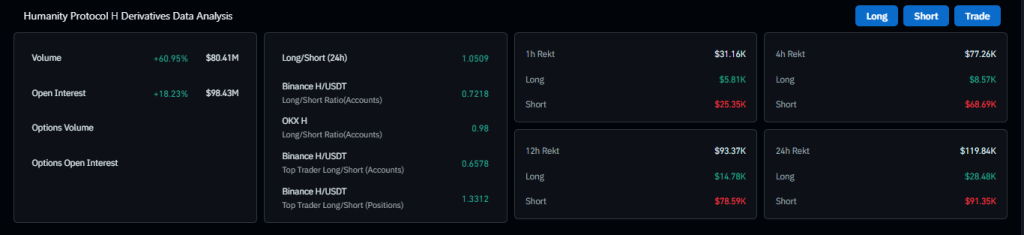
The Humanity Protocol price this week showed remarkable rise and broke the weeks of bearish trend that was dragging through consolidation, H token price suddenly woke up, printing nearly 20% intraday gains and stacking over 65% since 21st April. That’s not random noise. That’s capital coming with intent. And yes, there’s a narrative doing the heavy lifting here.
Demand Zone Bounce Flips Market Structure Fast
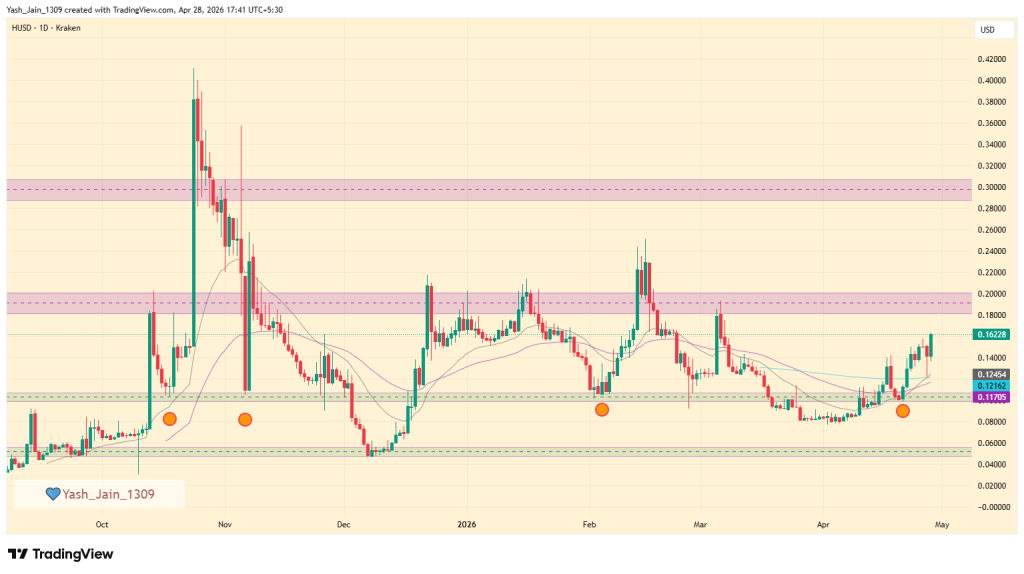
It all started at the $0.100 level. Clean, respected, and more importantly defended area. The Humanity Protocol price bounced sharply from that horizontal demand zone and followed it up with a higher low around April 21.
But here’s where it gets interesting. This wasn’t just spot-driven enthusiasm. Open Interest jumped 18.23% to $98.43M, which means derivatives traders showed up too. Fresh money, not recycled hype.
Volume didn’t stay quiet either which is also up 60.95% to $80.41M. So yeah, this isn’t a sleepy move.
AI Execution Narrative Gives Bulls New Ammunition
Now, let’s talk about the elephant in the room thats “AI”. The latest push isn’t coming from vague “AI integration” buzzwords. It’s sharper than that. The idea? AI isn’t just influencing anymore but it’s executing. Autonomous actions, no clear human behind them. That’s a problem. A big one.
And that’s exactly where Humanity Protocol (H) is trying to wedge itself in as a verifiable identity layer. Anti-fraud infrastructure for an internet that’s starting to lose track of who’s actually responsible.
When AI executes the attack, there's no attacker to trace.@Terencekwok on why verifiable identity has to come before autonomous crime scales beyond attribution pic.twitter.com/nY9D7YBFBV
It’s a compelling pitch and Traders seem to agree on it and this weeks momentum clearly represents that..
Humanity Protocol Price Resistance at $0.200 Now Becomes Battleground
But let’s not get carried away just yet. The Humanity Protocol price is now pushing into a heavy resistance zone between $0.180 and $0.200. This isn’t some minor hurdle but it’s a multi-month ceiling. Breaking it cleanly would flip the entire structure bullish and potentially open a run toward $0.300. That’s the optimistic case.
But, The cautious one? The market is leaning long. Hard. The Long/Short ratio sits at 1.3312, which means a lot of traders are already positioned for upside. That’s confidence but at the same time it’s also risk. If this level rejects, things could unwind quickly.
Long squeeze risk quietly building underneath rally
If the Humanity Protocol price fails to hold above $0.180, a retracement toward $0.117–$0.124 becomes likely. That’s where the market would need to reset, absorb selling, and decide if it actually believes this rally.
Because right now, it’s still proving itself. Momentum is strong. Narrative is stronger. But sustainability? That depends on one thing whether buyers can turn $0.200 from resistance into support. Until then, this rally is impressive… but not untouchable.
The live price of the Polkadot crypto token is $ 1.22328900.
Price predictions for 2026 range from $2.50 to $5.00.
Structural adoption and interoperability narratives could push DOT toward $60 by 2030.
Polkadot (DOT) remains one of the few Layer-0 blockchain networks focused on interoperability. Its architecture allows multiple blockchains to operate together while sharing security.
Recent changes to tokenomics and infrastructure, including Agile Coretime and a supply cap update in March 2026, have altered the network’s economic model. These developments shape expectations for DOT’s price outlook through 2030.
What Is Polkadot?
Polkadot is designed as a multi-chain network. It uses a central Relay Chain to connect independent blockchains called parachains.
This structure allows:
Cross-chain communication
Shared security across networks
Parallel transaction processing
The introduction of Agile Coretime enables more flexible allocation of network resources. This replaces earlier slot-based systems with an on-demand model.
Polkadot Price Today
Cryptocurrency
Polkadot
Token
DOT
Price
$1.2233 -0.92%
Market Cap
$ 2,056,770,089.14
24h Volume
$ 127,038,573.6086
Circulating Supply
1,681,344,379.2843
Total Supply
1,681,344,379.2843
All-Time High
$ 55.0050 on 04 November 2021
All-Time Low
$ 1.1303 on 06 February 2026
Polkadot Price Prediction May 2026
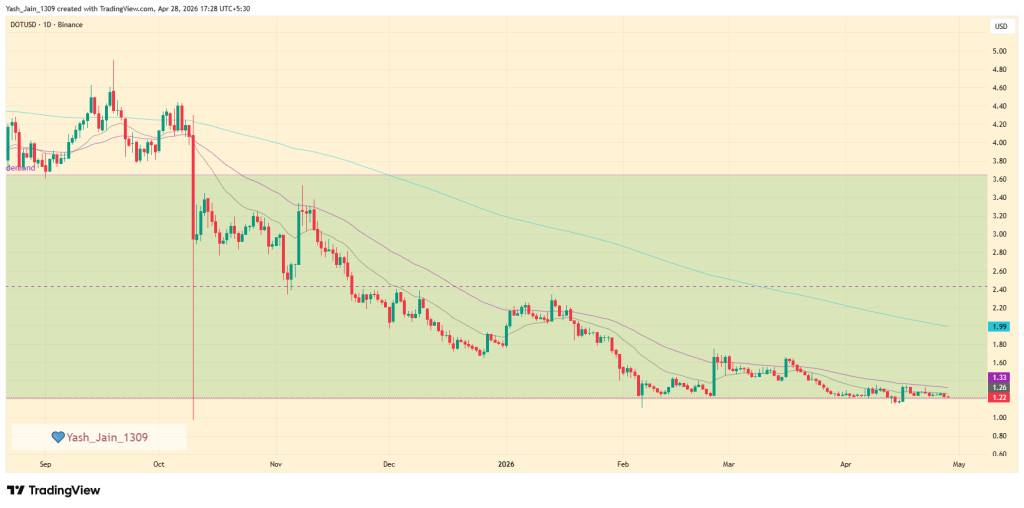
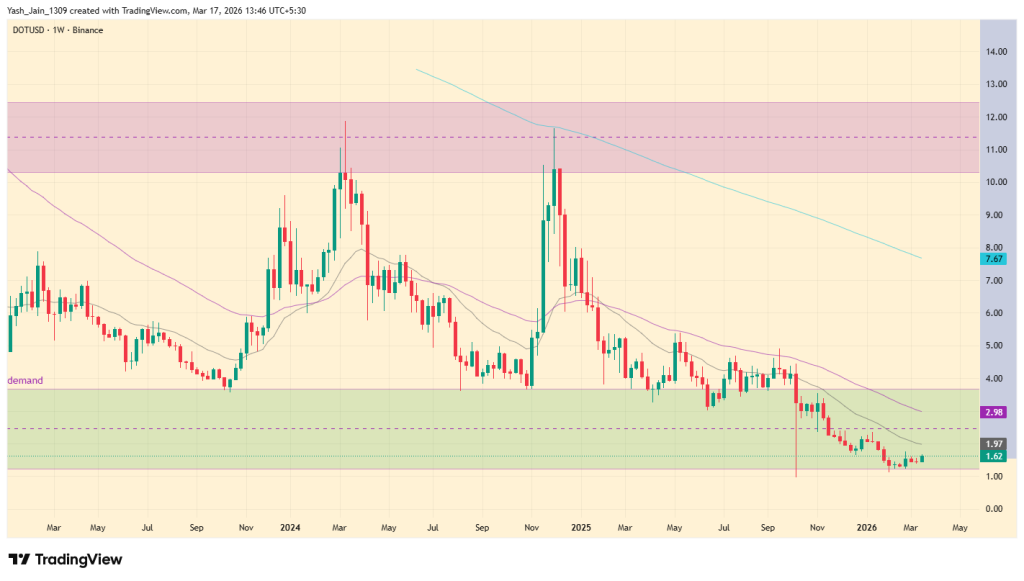
In late 2025, the price of Polkadot (DOT) faced significant selling pressure, causing it to decline into a long-term demand zone between $1.20 and $3.65.
Unfortunately, this downward trend resulted in a breach of the crucial $2.50 middle-band support in the first quarter. The bearish momentum continued into early 2026, pushing the price toward the $1.20 range floor in February, where it ultimately established a stable base. This led to a consolidation phase in March, resulting in a muted first quarter.
However, this muted behavior didn’t end in the first quarter; April in the second quarter displayed similar patterns, and May is just around the corner. If this lack of price movement persists, there is a risk of dropping below the $1.20 mark, which would break the rectangle box formed by the long-term trading range.
Conversely, if demand returns in May, the price could potentially rise toward the 200-day EMA band at $2.00 and possibly aim for the $2.50 level.
Recent news/opinion
On March 9th, DOT announced that the first Polkadot U.S. ETF, trading as TDOT via 21Shares, has officially launched on the Nasdaq exchange. This milestone provides a regulated investment vehicle for the asset, though investors are encouraged to conduct thorough independent research, as this announcement does not constitute financial advice.
Polkadot (DOT) Price Prediction 2026
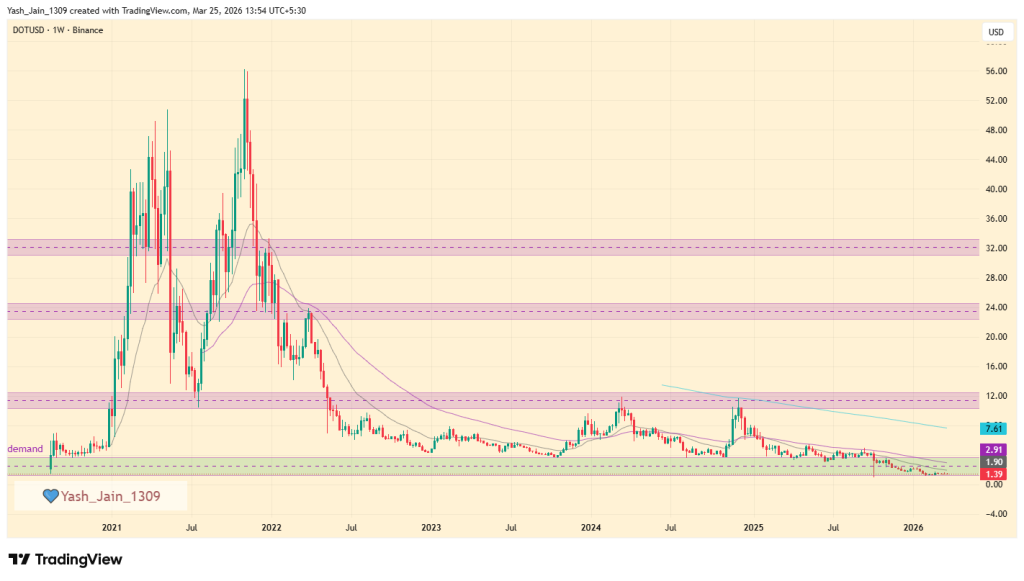
The long-term trajectory of Polkadot price (DOT) reveals a classic “boom and bust” market cycle of massive proportions. Between late 2020 and late 2021, the asset underwent an extraordinary bullish expansion, surging from a low of $1.50 to an all-time high of approximately $56.
This move represented a rally of over 3,500%, establishing a dominant bullish structure on the weekly timeframe. However, the peak in late 2021 marked the beginning of a structural shift, as the market transitioned into a prolonged corrective phase.
The chart shows that the bearish reversal intensified throughout 2022, characterized by the loss of critical psychological and technical support levels at $32 and $24. While a mid-2022 drop to $6.30 was initially perceived by many as a potential market bottom, it wasn’t, and the decline proved more persistent. The downward momentum eventually dragged the price to a low of $3.57 by late 2023.
Despite two notable recovery attempts in early and late 2024, the bulls were unable to reclaim the $12 supply zone, which acted as a heavy ceiling and confirmed the continuation of the macro-downtrend into 2025.
Now in 2026, all these past occurrences make sense, as by the first quarter of 2026, the correction reached a significant milestone as DOT touched a new multi-year low of $1.20. Paradoxically, this price action has brought the asset back close to the “Demand Zone” that ignited the original 2020 bull run.
Currently, DO/USD appears to be entering a phase of deep accumulation, confined within a weekly range of $1.20 to $3.57. This historical symmetry suggests that if the price can successfully consolidate and eventually break above the $3.57 resistance, it may pave the way for a new cyclical uptrend. However, given the depth of the current range, this recovery process is likely to be time-intensive, requiring significant patience before a definitive trend reversal emerges.
Polkadot Onchain Analysis
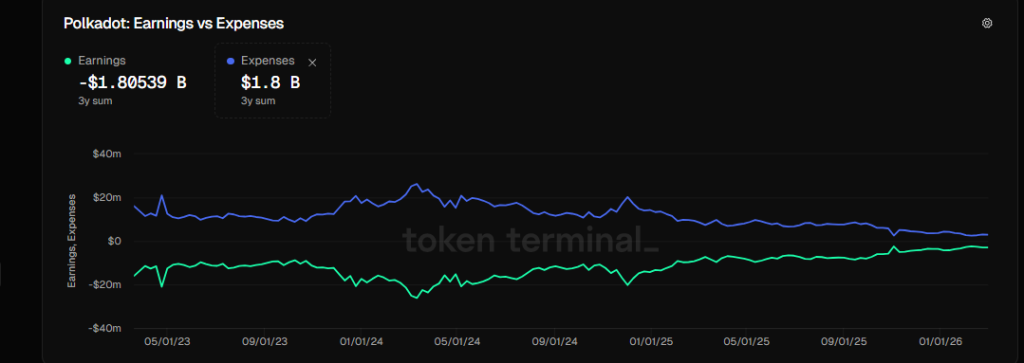
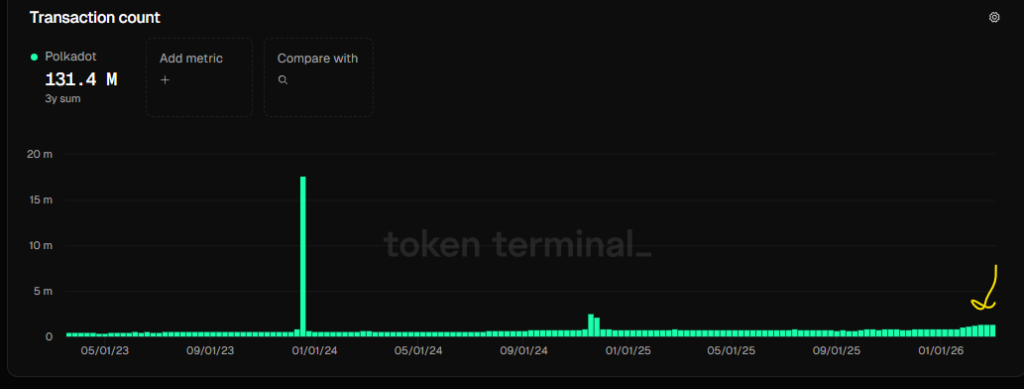
Recent on-chain data from Token Terminal reveals a significant shift in Polkadot’s financial trajectory. After years of deeply negative earnings, the network has successfully curtailed its aggressive spending to stabilize its balance sheet.
While the earnings graph is showing a clear recovery from previous lows, net figures remain slightly below the $0 threshold as the ecosystem balances its disinflationary tokenomics with ongoing operational costs.
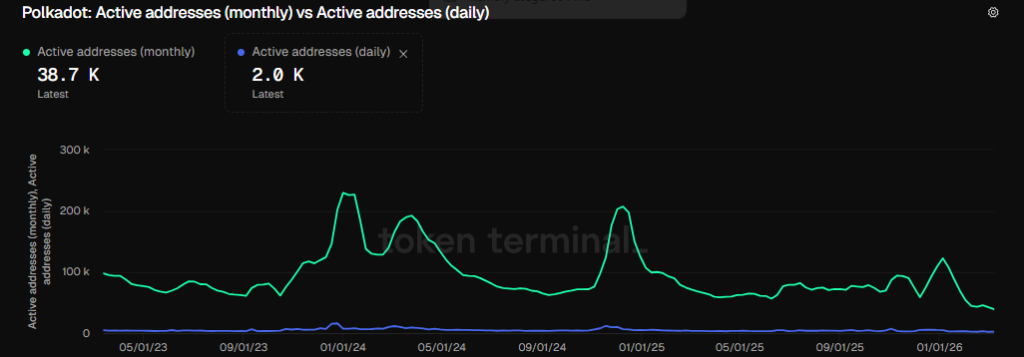
Despite this fiscal recovery, the network faces a challenge in user retention, as active addresses have continued a general downward trend. This decline in unique users suggests that Polkadot is currently struggling to regain retail momentum, leaving it susceptible to market volatility despite its improved fundamentals.
However, there is a glimmer of optimism in the latest usage metrics: transaction counts have begun to see a notable uptick in Q1 2026, indicating that while the user base may be smaller, the remaining participants are engaging more deeply with the ecosystem’s growing list of parachains.
Polkadot Crypto Price Prediction 2026 – 2030
Year
Potential Low ($)
Potential Average ($
Potential High ($)
2027
4.00
7.20
10.00
2028
6.50
8.00
15.00
2029
10.00
14.00
25.00
2030
25.00
50.00
60.00
Polkadot Crypto Price Prediction 2027
Polkadot (DOT) price range can be between $4.00 to $10.00 during the year 2027.
Polkadot Prediction 2028
In 2028, Polkadot is forecasted to potentially reach a low price of $6.50 and a high price of $15.00.
Polkadot Coin Price Prediction 2029
Thereafter, the DOT price for the year 2029 could range between $10.00 and $25.00.
Polkadot (DOT) Price Prediction 2030
Finally, in 2030, the price of Polkadot is predicted to maintain a steady and positive. It may trade between $25.00 and $60.00.
Based on the historic market sentiments and trend analysis of the largest cryptocurrency by market capitalization, here are the possible DOT price targets for the longer time frames.
Year
Potential Low ($)
Potential Average ($)
Potential High ($)
2031
50.00
60.00
80.00
2032
70.00
90.00
110.00
2033
100.00
130.00
150.00
2040
180.00
200.00
270.00
2050
250.00
320.00
400.00
DOT Price Prediction: Market Analysis
Year
2026
2027
2030
Changelly
$2.50
$3.00
$7.00
CoinCodex
$3.00
$3.50
$6.00
Digital Coin Price
$5.00
$7.00
$10.00
Never Miss a Beat in the Crypto World!
Stay ahead with breaking news, expert analysis, and real-time updates on the latest trends in Bitcoin, altcoins, DeFi, NFTs, and more.
FAQs
What is Polkadot (DOT) and why is it called a Layer-0 blockchain?
Polkadot is a Layer-0 network that connects multiple blockchains, allowing them to share security and data through parachains.
What is the Polkadot (DOT) price prediction for 2026?
Polkadot could trade between $2.50 and $5.00 in 2026, depending on market recovery, ecosystem growth, and adoption of its Polkadot 2.0 upgrades.
How much will 1 Polkadot be worth in 2030?
Price forecasts indicate 1 DOT could trade between $25 and $60 by 2030, depending on adoption of Polkadot 2.0 upgrades and broader crypto market growth.
What will Polkadot be worth in 2040?
Long-term projections suggest Polkadot could reach $180 to $270 by 2040 if the ecosystem grows steadily and blockchain interoperability becomes widely adopted.
What could Polkadot be worth in 10 years?
Over the next decade, Polkadot could trade between $60 and $150+ if cross-chain adoption expands and its interoperability model becomes a core part of Web3 infrastructure.
Is Polkadot a good long-term investment?
Polkadot is seen as a long-term infrastructure project focused on interoperability, though price performance depends on adoption, ecosystem activity, and market trends.
What factors could influence Polkadot’s price in the future?
Key factors include Polkadot 2.0 upgrades, parachain growth, tokenomics changes, institutional adoption, and overall crypto market sentiment.
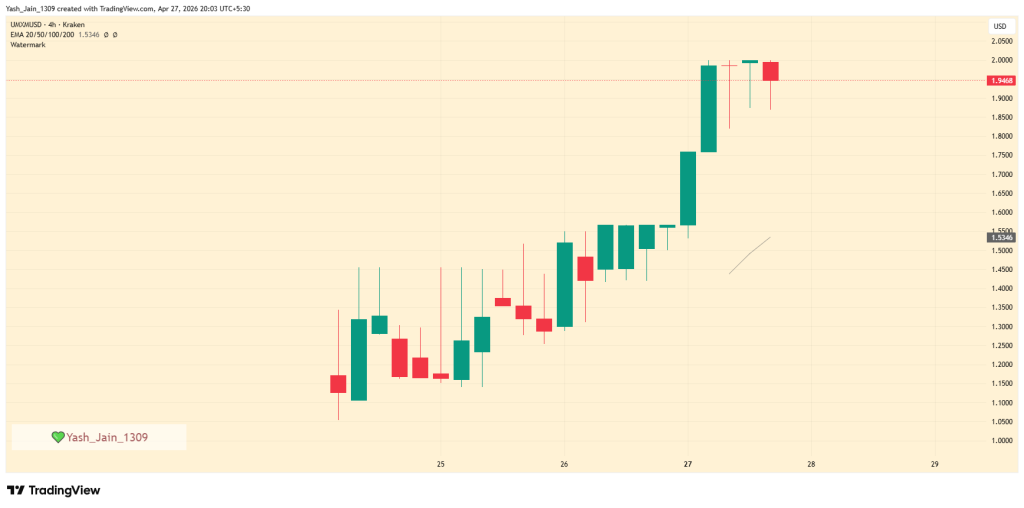
The UMXM price is sprinting today. In a market that usually needs weeks to build momentum, Manadia managed to compress that into days, pushing from roughly $1.15 to the doorstep of $2.00. That’s not organic drift. That’s aggressive demand kicking the door open.
And yeah, there’s a story behind it because there’s always a story when price moves this fast.
AI narrative meets liquidity, market bites fast
Manadia isn’t pitching itself as another forgettable Web3 token. It’s going after something bigger which is an AI infrastructure. Specifically, a data settlement and coordination layer that lets AI agents interact with both on-chain and off-chain systems through verifiable execution.
Sounds ambitious. The market seems to think it’s investable. The timing didn’t hurt either. A listing this week on Kraken on April 23, 2026 injected the kind of liquidity these moves usually need. Then came Bitget, where UMXM casually grabbed the 1st spot top gainer. That’s retail attention, plain and simple.
Throw in the “paywithmana” integration which is tying autonomous AI coordination with verifiable data settlement and suddenly the narrative has teeth. Not proven, but compelling enough for traders to pile in.
UMXM price hits psychological resistance at $2 level
Now here’s where things get interesting. The UMXM price has slammed straight into the $2.00 psychological barrier. It briefly tapped near that level before easing back to around $1.9468. That tiny red candle? That’s not weakness but it’s hesitation. Profit-taking. Reality checking hype.
But let’s not sugarcoat it. Big round numbers like $2.00 tend to act like magnets and walls at the same time. Breaking them cleanly usually requires sustained demand, not just a burst of enthusiasm. So far, the market’s knocking. Hard.
Parabolic rally leaves EMA far below price
Here’s the part bulls don’t like hearing. The rally has gone vertical, and the EMA which is sitting around $1.5346 is still lagging way behind. That gap? It’s a classic sign of overextension. Price moved too far, too fast.
Now, that doesn’t mean it crashes tomorrow. But it does mean the market is stretched.
In these setups, one of two things usually happens. Either price consolidates sideways to let the EMA catch up, or it snaps back down toward that mean. There’s no polite way markets handle imbalance.
Momentum strong, but sustainability still uncertain
So, what now? If demand keeps flowing probably fueled by the AI + Web3 narrative then the odds suggests that the UMXM price could break above $2.00 and enter a clean price discovery phase. That’s where things tend to get irrational, fast.
But let’s be real. Moves like this rarely go straight up forever. A pullback toward the $1.50 zone wouldn’t be surprising in fact it would be healthy.
Right now, the trend is bullish. No debate there. But sustainability? That’s still being negotiated in real time.
The XCN and LUNC price action are today in focus as they snapped today. Two completely different catalysts, one common outcome that’s bullish price action one saw freedom from long-dead bearish trends getting steamrolled in a matter of hours that’s XCN for you.
On the other token, you’ve got a courtroom narrative breathing life this week into Terra Classic. So, there are different stories, but same chaos. And markets love chaos when it pays.
Legal drama ignites LUNC price breakout momentum
Let’s start with LUNC, because this one’s less about charts and more about unfinished business.
The trigger? A lawsuit filed by the Terraform Labs Plan Administrator against Jane Street, alleging market manipulation tied to the infamous 2022 de-pegging event. That single move flipped sentiment from passive despair to something closer to cautious optimism that’s boosting its price this week.
Call it a “justice rally,” call it hope either way, it worked. And results are constructed on chart.
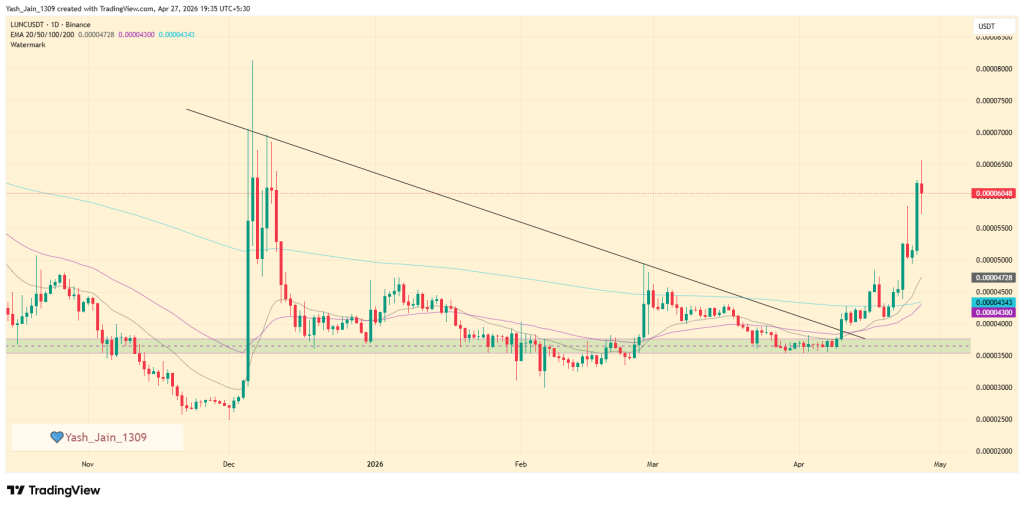
Price didn’t hesitate. LUNC price blasted through a descending trendline that had been weighing it down since late 2025. No slow grind, no hesitation just a breakout slicing through every major EMA in sight mostly got power post mid-april.
Now trading around $0.00006048, the token has done something technically significant: it turned the 200-day EMA at $0.00004728 from resistance into support. That’s not noise. That’s a shift.
Sure, the move looks overheated in the short term. It usually does after vertical candles like that. But if this legal narrative sticks around, the market’s already eyeing that $0.00008000 zone from late 2025.
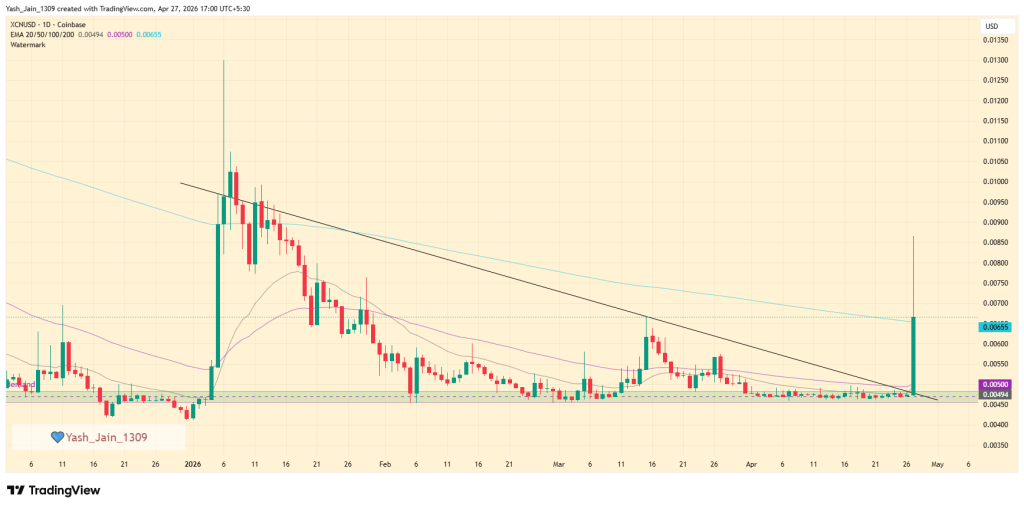
Upbit listing sends XCN price into frenzy
Now flip the script. While LUNC leans on courtroom drama, XCN went full throttle on liquidity. The Upbit listing, one of the most famous listing news that has brought results on most crypto’s that it listed in past couple of months, for instance today’s listing of XCN in KRW and USDT pairs waked up.
And when it woke up, it ran. From $0.0048 to $0.0085, the move was sharp, fast, and honestly, predictable if you’ve seen enough “Upbit pumps.” These listings don’t gently nudge price as they reset entire structures.
The XCN price reaction followed the textbook playbook: sudden breakout, heavy volume, and a complete shift in short-term sentiment.
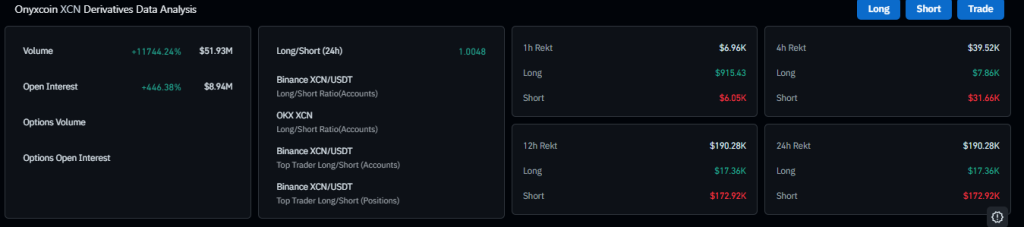
Short squeeze chaos confirms XCN structural shift
But here’s where it gets interesting. Derivatives data shows volume exploding by over 11,000%. That’s not organic growth but clearly that’s a flood. Open positions piled in, and then came the squeeze.
Roughly $172.92K in short liquidations got wiped out as price surged past the 20 and 50-day EMAs. Traders betting against the move didn’t just lose they got forced out.
Now XCN/USD is staring down its 200-day EMA around $0.0065, a level that tends to separate hype from actual trend reversal.
XCN and LUNC price shifts rewrite near-term outlook
So, what’s the takeaway? Well, not a clean one. The XCN and LUNC price moves aren’t driven by the same fundamentals, but they’re telling a similar story and that is localized catalysts are overpowering broader market direction.the
LUNC has a narrative. XCN has liquidity. Both now have momentum. Whether that momentum sticks? That’s where things usually get messy.
The live price of the TAO crypto is $ 250.14492008.
Bittensor Price could show a reversal to $500 be H1 2026.
TAO’s long-term outlook targets $1,000–$3,000 by 2030
Bittensor (TAO) has gained attention as a decentralized protocol focused on artificial intelligence. The network enables participants to build, share, and evaluate machine learning models through a blockchain-based system.
The project combines AI infrastructure with token incentives. This model positions TAO crypto within a growing segment of crypto tied to AI development. TAO price outlook depends on both technical patterns and network activity.
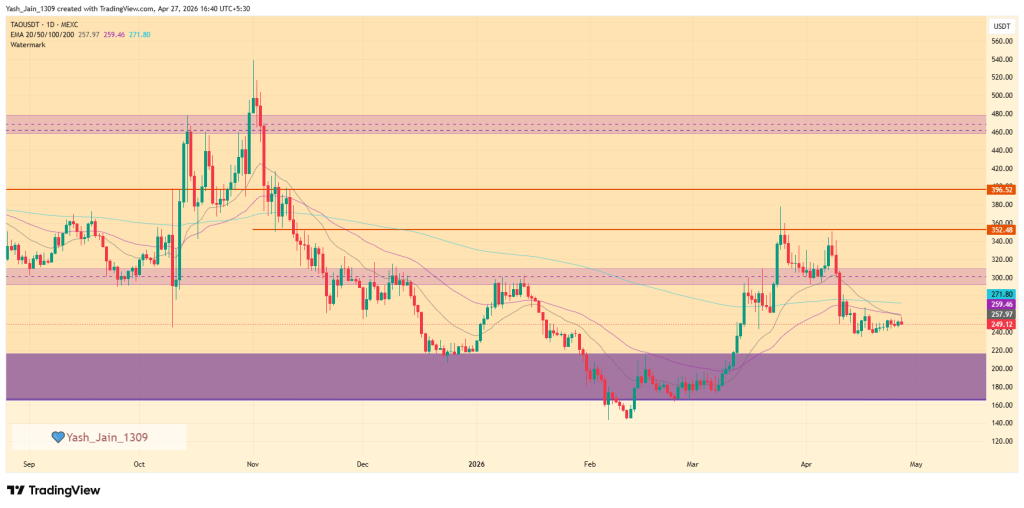
The daily chart for TAO/USDT shows that April saw a decline after March’s recovery. Currently, TAO is positioned below a “death cross” formed between the 20-day and 50-day EMA bands. The price is hovering below $260 and struggling to find the liquidity needed to trigger a reversal.
Without a significant influx of fresh demand to reclaim the 200-day EMA and subsequently challenge the psychological $300 level, the bearish grip on the market is expected to strengthen as we move into May.
Looking ahead in May, the outlook depends on whether TAO price can maintain its current local floor around $240. If it fails to spark a relief rally toward the $300 resistance zone, we may see the downtrend continue toward the primary demand block between $160 and $210.
Therefore, Investors should monitor a decisive daily close above the immediate EMA cluster, as this could signal a trend shift. Otherwise, the market appears set to test levels below $200 before a meaningful bottom is established.
On April 10th, Covenant AI a major project on TAO announced they are leaving bittensor and reportedly sold 37,000 $TAO worth over $10 million.
On March 16th, Grayscale posted about its Bittensor Trust for private placement, offering eligible accredited investors direct exposure to the TAO ecosystem. This move underscores growing institutional interest in decentralized AI, as Grayscale highlights the protocol’s role in leveraging economic incentives for open-source development.
Coinpedia’s Bittensor (TAO) Price Prediction 2026
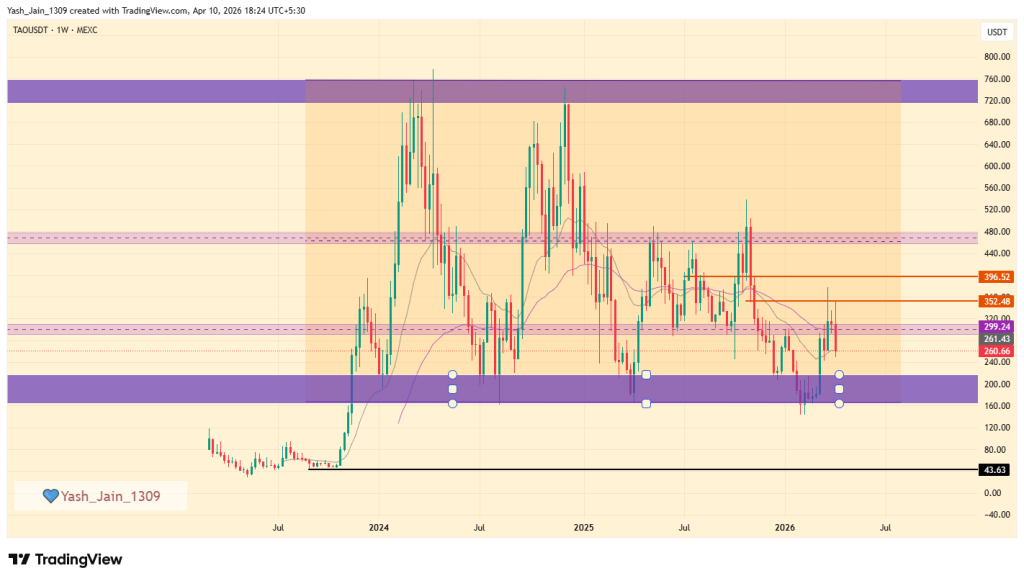
The weekly chart for Bittensor (TAO/USDT) reveals a well-defined long-term range that has governed price action since the network’s explosive growth in 2024. This structural parallel channel is anchored by a significant accumulation floor near $160–$200 and a formidable overhead supply ceiling around $720–$760.
In Early 2024 saw TAO price reached its All-Time High (ATH) of approximately $760. Despite a volatile year, the price repeatedly cycled between the channel’s borders, demonstrating high demand at the lower bounds and aggressive profit-taking at the upper extremes.
But throughout 2025, market momentum shifted into a lower-intensity regime. The price largely remained capped under the $500 psychological barrier. A brief Q4 2025 rally attempted to reclaim the upper range but was rejected at $535, leading to a sharp retracement back to the primary demand zone by early 2026.
By Q1 2026, the price has successfully defended the $160–$200 support zone for the third time in two years. This “triple-bottom” characteristic suggests strong institutional interest at these valuations, and the rally to $352 was proof of that.
But, it has faced resistance in Q2’s April and has slipped below the $300 demand area. Now, it did fall on the news, but from a price-action perspective, it looks like a short red candle after 3 months of a rally. So the chances are that it’s a healthy dip for its bullish structure to be maintained for months ahead. But if it’s a healthy dip, it needs to jump back above $ 300; if it doesn’t, it might crash lower, revisit $160-$200 support, and spend the entire Q2 there consolidating, or could seek even deeper levels.
If the TAO price can maintain above $300, then $352 and $396 during this period would be revisited before the first half of 2026 concludes, clearing the technical path for a retest of the $500 supply area. A sustained close above the mid-range would then signal long-term extension in the rally, possibly to the upper border of this parallel channel by year’s end.
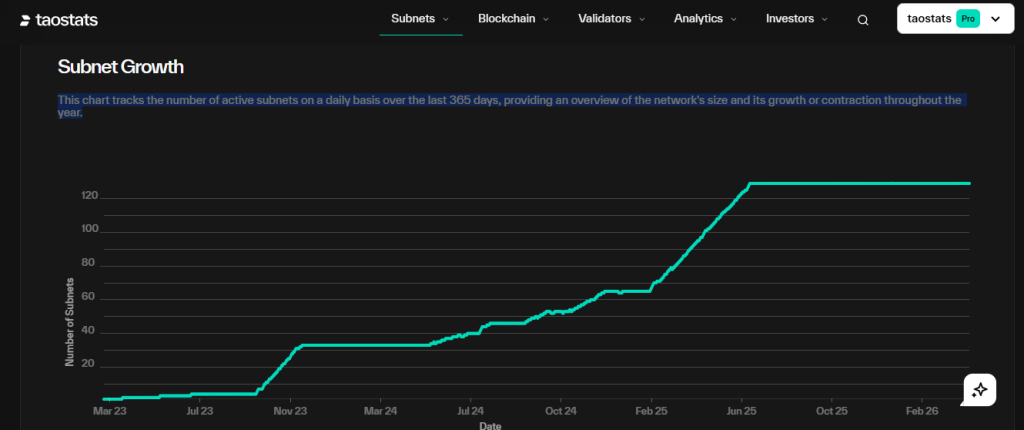
Data from Taostats, the primary ecosystem tracker for Bittensor, highlights a period of aggressive expansion in the network’s infrastructure. From March 2023 through June 2025, the number of active subnets experienced a parabolic climb, ultimately reaching a peak of 129. This growth underscores the rapid scaling of Bittensor’s decentralized AI architecture and its ability to attract diverse, specialized compute layers.
Over the last 365 days especially, the chart reveals a shift from rapid expansion to a phase of high-level stability. While the total number of subnets has plateaued at its upper limit, the network has maintained a consistent and active presence throughout the year.
This steady horizontal trend is significant, as it demonstrates a matured ecosystem where the network size remains robust and functional, providing a reliable foundation for the protocol’s ongoing operations.
Bittensor Crypto Price Prediction 2026 – 2030
Year
Potential Low ($)
Potential Average ($
Potential High ($)
2027
400
720
1000
2028
600
820
1200
2029
800
1150
2000
2030
1000
1800
3000
Bittensor (TAO) Price Prediction 2027
As per the Bittensor Price Prediction 2027, Bittensor may see a potential low price of $400. The potential high for Bittensor price in 2027 is estimated to reach $1000.
TAO Crypto Price Prediction 2028
In 2028, Bittensor price is forecasted to potentially reach a low price of $600 and a high price of $1200.
Bittensor Price Forecast 2029
Thereafter, the Bittensor (Bittensor) price for the year 2029 could range between $800 and $2000.
Bittensor (TAO) Price Prediction 2030
Finally, in 2030, the price of Bittensor is predicted to remain steadily positive. It may trade between $1000 and $3000.
The long-term projection assumes Bittensor sustains relevance in enterprise blockchain use cases, with growth moderating over time as the asset matures.
Year
Potential Low ($)
Potential Average ($)
Potential High ($)
2031
1200
1800
3000
2032
1600
2300
3300
2033
1900
3400
4000
2040
3200
5800
7800
2050
6500
8500
10000
Bittensor Crypto Price Market Analysis
Year
2026
2027
2030
Changelly
$620.00
$850
$1200
CoinCodex
$540.00
$900
$1400
WalletInvestor
$760.00
$950
$1550
Never Miss a Beat in the Crypto World!
Stay ahead with breaking news, expert analysis, and real-time updates on the latest trends in Bitcoin, altcoins, DeFi, NFTs, and more.
What Is Bittensor?
Bittensor operates as a decentralized marketplace for machine intelligence. It uses a system of subnets where contributors train and validate AI models.
The protocol runs on a mechanism known as Yuma Consensus. This system distributes rewards based on the usefulness of contributions rather than computing uptime alone.
The TAO token serves several functions:
Secures the network through staking
Provides access to AI services
Rewards contributors
The total supply is capped at 21 million tokens, similar to Bitcoin.
FAQs
What is Bittensor (TAO) and how does it work?
Bittensor is a decentralized AI network where users share and train models. TAO tokens reward valuable contributions and enable access to AI services.
What is the price prediction for Bittensor (TAO) in 2026?
TAO is expected to trade between $160 and $500 in 2026, with a potential retest of higher resistance if bullish momentum continues.
How much will Bittensor (TAO) be worth in 2030?
By 2030, TAO could trade between $1000 and $3000, supported by growing demand for decentralized AI and sustained ecosystem expansion.
What is the price prediction for TAO in 2040?
TAO may reach between $3200 and $7800 by 2040 if adoption of decentralized AI accelerates and the network maintains long-term relevance.
How high can TAO price go by 2050?
By 2050, TAO could climb as high as $10,000, assuming strong global AI demand, continued innovation, and consistent network growth.
Is Bittensor (TAO) a good long-term investment?
TAO shows long-term potential due to its AI focus and token utility, but investors should consider market risks and evolving competition.
What could drive Bittensor (TAO) price growth?
Key drivers include AI adoption, subnet expansion, institutional interest, and increased demand for decentralized computing resources.
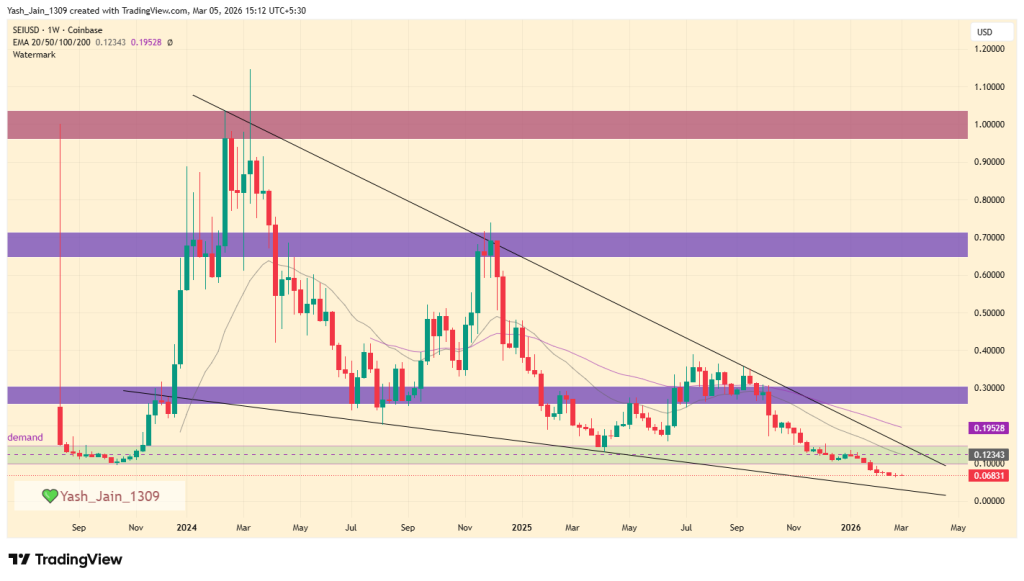
Sei (SEI) remains in a bearish trend in 2026, with price approaching the $0.020 demand zone. A strong rebound could push SEI back toward $0.10–$0.20 by year-end.
Long-term projections remain bullish for Sei, with analysts forecasting steady growth that could push SEI toward the $1.26–$1.45 range by 2032.
Originally recognized as the first sector-specific Layer 1 blockchain, Sei has evolved into a powerhouse of parallelized execution. While its initial mission focused on optimizing decentralized exchanges (DEXs), the 2024-2025 “V2” upgrade transformed Sei into the Parallelized EVM. This pivot allowed the network to combine the vast developer ecosystem of Ethereum with the blazing-fast performance typically reserved for non-EVM chains like Solana.
As we move through 2026, the network is undergoing its most ambitious technical overhaul yet: the Sei Giga upgrade. By implementing the “Autobahn” consensus and asynchronous execution, Sei aims to support over 200,000 transactions per second with sub-400ms finality. From institutional real-world asset (RWA) tokenization to high-frequency gaming and AI-agent economies.
Planning on investing in this crypto project but concerned about its prospects? Fear not and scroll down, as in this article, we have uncovered the market trends of SEI price prediction from 2026 up until 2032.
As the first quarter closed on a bearish note, investors are now looking for opportunities in the second quarter.
The first quarter has extended the downturn from 2025 into 2026, with the January-to-March period presenting ongoing challenges. Notably, the SEI price fell below the $0.100 threshold, indicating a continued bearish trend, and by March, it even reached a low of $0.050.
However, in April, signs of gradual bullish strength are emerging. If the SEI price experiences further bullish development, it could rise in May to retest the upper edge of the existing falling wedge pattern.
On the other hand, this sustained downward movement could lead to additional declines if market conditions remain unchanged, raising concerns about approaching the lower boundary of a falling wedge pattern in May.
Recent News/Updates
Coinbase has officially integrated the Sei EVM, transitioning all SEI network transactions to the new standard for enhanced compatibility and performance. This significant update, which enables native EVM support for all sends and receives on the platform, was publicly announced by the Sei Network team on April 14.
Sumvin, Inc. officially launched on February 26, 2026, utilizing Sei’s sub-second finality for AI-powered financial execution.
Coinbase Markets announced on February 27th that Sei will transition from Cosmos-based transactions to an EVM-only architecture. They will be facilitating this migration to the Sei EVM, which will take place from April 6-8, 2026.
Coinpedia Sei (SEI) Price Prediction 2026
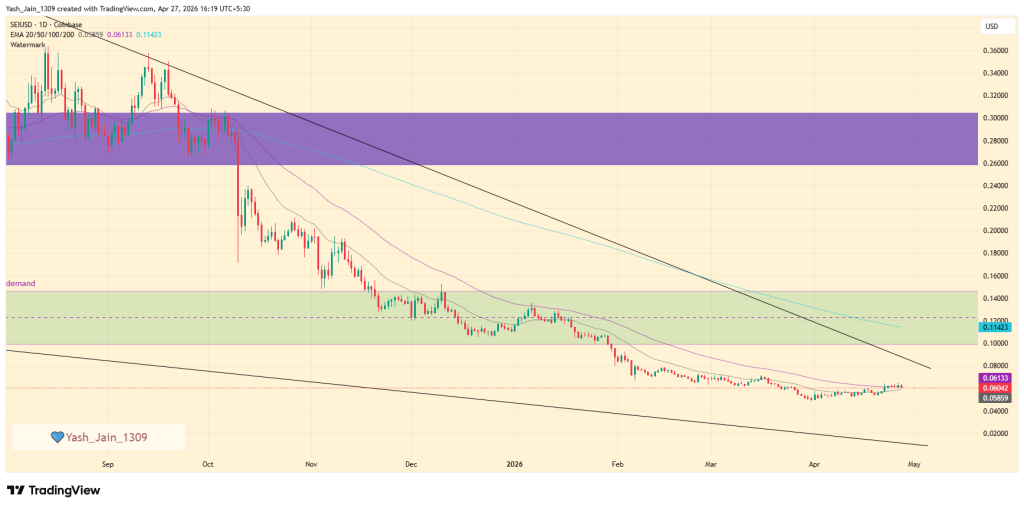
The technical outlook for Sei (SEI) in 2026 reflects a challenging macroeconomic trend defined by a persistent descending structure. Looking back at the weekly chart, 2024 was marked by two significant but ultimately capped rallies: an explosive surge to the $1.00 mark in the early months, followed by a secondary peak near $0.70 late in the year 2024. Both movements highlighted intense bearish pressure, as sellers consistently utilized these rallies to exit positions, effectively constraining the price within a tightening range.
This market structure deteriorated further in 2025 when the SEI price failed to hold the critical $0.30 demand zone. The breakdown confirmed that the SEI asset had abandoned traditional horizontal support levels and is favoring a massive falling wedge pattern.
This technical formation has been dictated by three clear resistance touches, the most recent occurring in September 2025. While analysts initially hoped the early 2023 demand floor would exhaust the selling pressure, the first quarter of 2026 saw a continuation of the slide, with the price slipping beneath the psychological $0.10 support area.
Current price action suggests that the SEI price is now gravitating toward the lower boundary of the falling wedge. This decline is expected to persist through mid-2026 until the price meets the primary demand area situated around the $0.020 mark. This level represents a deep value zone where selling exhaustion is highly probable.
If buyers successfully defend this floor, the resulting spike in demand could ignite a trend reversal, potentially driving the SEI token price back toward the $0.10 and $0.20 levels. Under a highly bullish recovery scenario, a retest of the $0.30 breakdown point remains a possibility before the year concludes.
Sei (SEI) Long-Term Price Projections: 2027 – 2032
Year
Minimum Price ($)
Maximum Price ($)
Average Price ($)
2027
0.2450
0.2940
0.2500
2028
0.3550
0.4260
0.3650
2029
0.5240
0.6190
0.5350
2030
0.7850
0.9050
0.8060
2031
0.8900
1.1000
0.9950
2032
1.2600
1.4500
1.3210
Sei (SEI) Price Prediction 2027
The SEI price forecast maintains an upward climb throughout 2027. Market analysts project the SEI token will fluctuate between $0.2450 and $0.2940, centering on an annual average SEI/USD price of $0.2500.
Sei Crypto Price Prediction 2028
Growth is expected to accelerate in 2028 as ecosystem maturity attracts deeper liquidity. SEI crypto price is projected to trade within a bullish corridor of $0.3550 to $0.4260, maintaining a robust year-round average of $0.3650.
SEI Token Price Prediction 2029
By 2029, SEI token’s price movements are anticipated to reach a significant peak of $0.6190. On the lower end, strong support is expected at $0.5240, leading to a projected average trading cost of $0.5350.
SEI Price Prediction 2030
Entering the new decade, SEI Crypto’s valuation is expected to be driven by global market recognition. Projections suggest a price range of $0.7850 to $0.9050, with an expected average price of $0.8060.
SEI/USD Prediction 2031
The bullish momentum continues into 2031, with the high target set at $1.1000. While retracements may dip toward $0.8900, the overall market equilibrium is expected to sit near $0.9950.
Sei (SEI) Price Prediction 2032
Based on current expert modeling, 2032 represents a major milestone for the token. SEI is estimated to range between $1.2600 and $1.4500, with an average valuation of $1.3210.
Never Miss a Beat in the Crypto World!
Stay ahead with breaking news, expert analysis, and real-time updates on the latest trends in Bitcoin, altcoins, DeFi, NFTs, and more.
FAQs
What is the Sei (SEI) price prediction for 2026?
SEI may drop toward $0.020 before recovering. If demand returns, it could rebound to $0.10–$0.20, with a bullish case targeting $0.30 by year-end.
How high can Sei (SEI) price go by 2030?
By 2030, SEI could reach between $0.7850 and $0.9050, with further upside possible if ecosystem growth and adoption accelerate
What is the Sei Crypto price prediction for 2040?
By 2040, SEI could exceed $2–$3 if long-term adoption, scalability, and real-world use cases expand, though such projections remain speculative.
Is Sei (SEI) a good long-term investment?
SEI shows long-term potential due to its high-speed infrastructure and upgrades, but it remains a high-risk asset dependent on adoption and market trends.
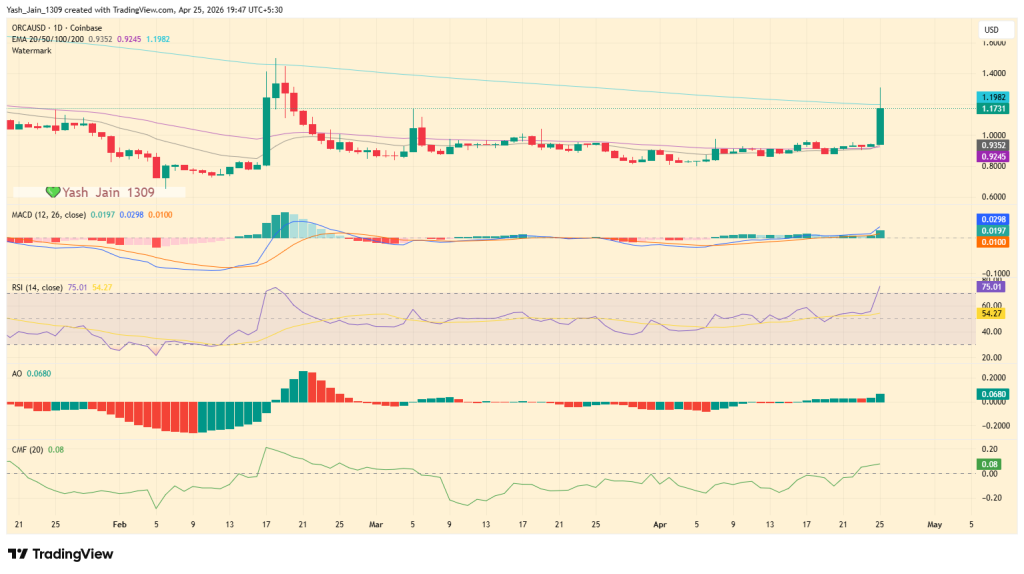
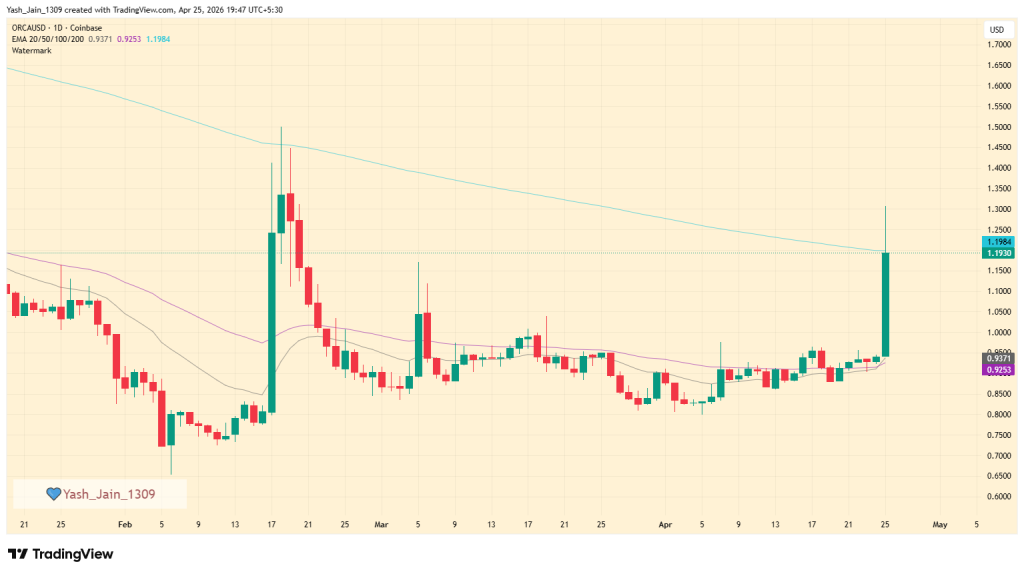
The ORCA price detonated today with a 40% intraday surge sending the token flying from a quiet base near $0.93 to a sharp peak around $1.30 before coming to $1.22, this surged wiped out March month’s boredom in a single, aggressive move. One candle. Clean break. No hesitation and this move didn’t came random but came with a reason.
ORCA was stuck. Trapped under a descending trendline, capped since mid-February, grinding sideways with no real conviction. Then came the move today a full-bodied breakout candle that sliced through resistance like it wasn’t even there.
The so-called “god candle” didn’t just clear horizontal resistance; it invalidated the broader downtrend structure entirely. Price is now trading well above the 200-day EMA near $1.2282, which, in technical terms, flips the narrative from neutral-to-bearish into something far more… optimistic.
But let’s not pretend this was purely technical. Because it wasn’t.
Interestingly, Orca price didn’t just ride market momentum but it helped create it. The project joined over 120 organizations pushing for U.S. Senate action on market structure legislation, aligning itself with groups like the Blockchain Association and Crypto Council for Innovation.
Sounds boring? But, it’s not. Basically, per observation this is the kind of move that signals a pivot from just another decentralized exchange to something aiming for institutional relevance. The message is simple: clear rules enable serious capital. And markets, as always, react fast when “institutional-grade” gets thrown into the mix.
Well, this isn’t about hype cycles. It’s about positioning ahead of regulatory clarity. That’s a different game entirely.
Market structure legislation is foundational to how onchain capital markets develop.
Orca joined 120+ organizations urging the Senate to advance this work because clear rules enable serious infrastructure to be built with confidence.
Indicators flash strength but warn of cooling ahead
Now, technically speaking, everything is screaming bullish… and slightly overheated.
The RSI is sitting at 75.01, deep in overbought territory. That’s not subtle. It reflects aggressive buying pressure, sure but also hints that a cooldown or retest might be around the corner.
MACD? Bullish crossover, expanding green histogram. Momentum is clearly accelerating. The Awesome Oscillator flipped hard into positive territory, reinforcing that shift. And the CMF at 0.08 confirms something important this isn’t just a low-volume spike. There’s actual capital flowing in.
Still, after a 40% move, expecting straight-line continuation is… optimistic at best.
New support forms as ORCA price resets structure
So, the clear focus is on the $1.17–$1.20 range, which is near the 200-day EMA band. This level has previously rejected prices but has now been reclaimed, indicating a significant structural shift. The question remains: can this level hold and sustain above the 200-day EMA band?
In the short term, consolidation seems likely if the price intends to continue moving upward. Markets don’t sprint forever. However, if we take a broader view, the situation begins to look different because a clean breakout, strong inflows, and a narrative centered on regulatory infrastructure rather than mere speculation.
This is the aspect that people might be underestimating. If this shift holds, the ORCA price is not just responding to market conditions; it is undergoing a repricing and if its not then it will be simply collapse as simple as that.
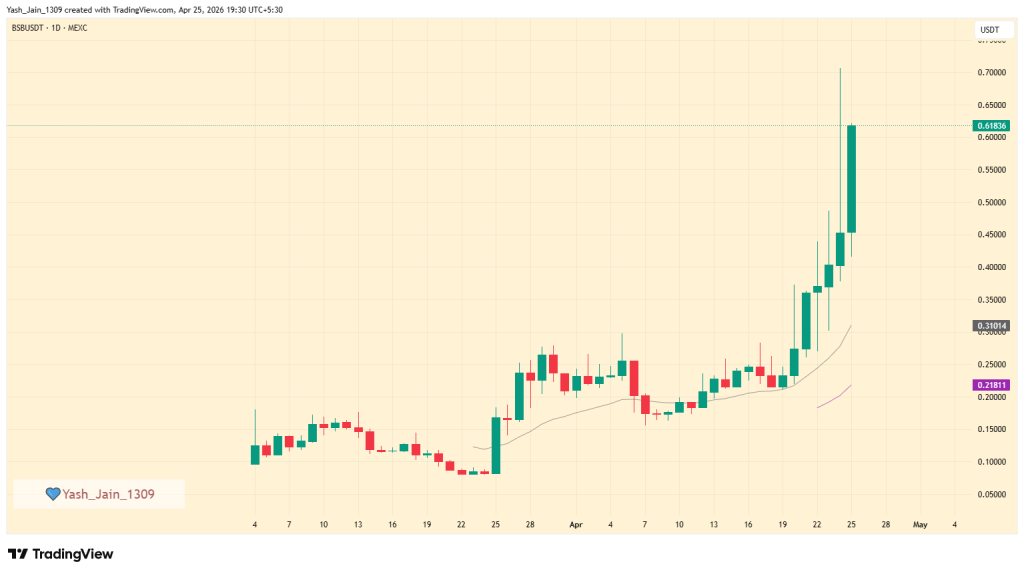
The BSB price didn’t just move but it snapped this week and recent 60% intraday surge is another impressive run. What we observed is an staggering 300% climb in just 14 days of April, from $0.156 to $0.621, this is the kind of move that forces even the most jaded market watchers to pay attention. And no, this wasn’t random. There’s a narrative brewing here and for once, it’s not just hype.
RWA Shift Becomes Structural, Not Speculative
At the Hong Kong RWI Summit, the tone wasn’t your usual buzzword bingo. It was sharper. More technical. Almost… serious. The core message? The first wave of real-world asset (RWA) adoption won’t touch obscure, illiquid junk. It’ll focus on financial assets clean, tradable, and liquid.
Tokenized equities are leading that charge which makes sense. They already have demand. They even trade frequently. But here’s the catch the liquidity is scattered across chains, issuers, and platforms. Fragmented, messy, inefficient.
That’s where the narrative pivots. Instead of issuing more assets into an already cluttered ecosystem, the focus is shifting toward controlling how those assets actually move. Distribution over creation. Execution over existence. It’s less about minting tokens and more about making them usable.
Staking Mechanics Add Fuel To BSB Rally
Now layer in staking, because of course there’s staking. Block Street rolled out its staking model with a twist since participation matters more than passive holding. Users stake BSB into a global lock, with voting power scaling up over time, reaching 4x after a year. Governance participation drives rewards, not just balance size.
And importantly, rewards aren’t inflation-driven. They come from pre-defined ecosystem allocations. No guarantees. No fixed payouts. No dividend promises. Just structured incentives tied to engagement.
Well, this kind of design subtly shifts user behavior. It nudges holders to stay, participate, and commit. And markets love commitment… at least in the short term.
BSB Price Momentum Signals Market Repricing Phase
So, what’s actually driving the BSB price? It’s not just the summit talk. It’s not just staking. It’s the combination.
A narrative shift toward execution-layer dominance in RWAs. A staking model that rewards long-term alignment. And a market that’s clearly willing to reprice fast when those two collide.
But let’s be real parabolic moves come with baggage. The recent rally shows strength, sure, but also raises the usual question: how much of this is sustainable versus reflexive momentum?
Still, one thing’s clear. The BSB price isn’t moving in isolation anymore. It’s riding a broader structural shift, one where tokenized assets stop being experiments and start behaving like actual markets.
The asset could reach a high of $6100 by the end of 2026.
The price of Ethereum could reach a high of $15,575 by 2030.
Since its launch in 2015, Ethereum has evolved from a pioneering smart-contract platform into the primary settlement layer for the global digital economy. What began as a space for experimental decentralized applications (dApps) has now transformed into a robust ecosystem attracting significant institutional interest. This shift is largely driven by Ethereum’s “Business Ready” infrastructure, which is designed to support high-assurance financial applications and large-scale tokenization initiatives.
The successful rollout of the Pectra and Fusaka upgrades has significantly improved Ethereum’s scalability and fee efficiency. These upgrades addressed long-standing network bottlenecks, making the platform more practical and cost-effective for enterprise adoption and high-volume blockchain activity.
As the ecosystem progresses through 2026, the narrative surrounding Ethereum has shifted from simple utility to institutional-grade resilience and infrastructure. With a well-defined roadmap emphasizing censorship resistance, modular scalability, and long-term sustainability, Ethereum is increasingly positioned to support the next generation of decentralized finance (DeFi) and global capital markets.
In this Ethereum price prediction for 2026–2030, we examine whether these structural improvements, combined with evolving macroeconomic conditions, could push ETH toward new valuation milestones over the coming years.
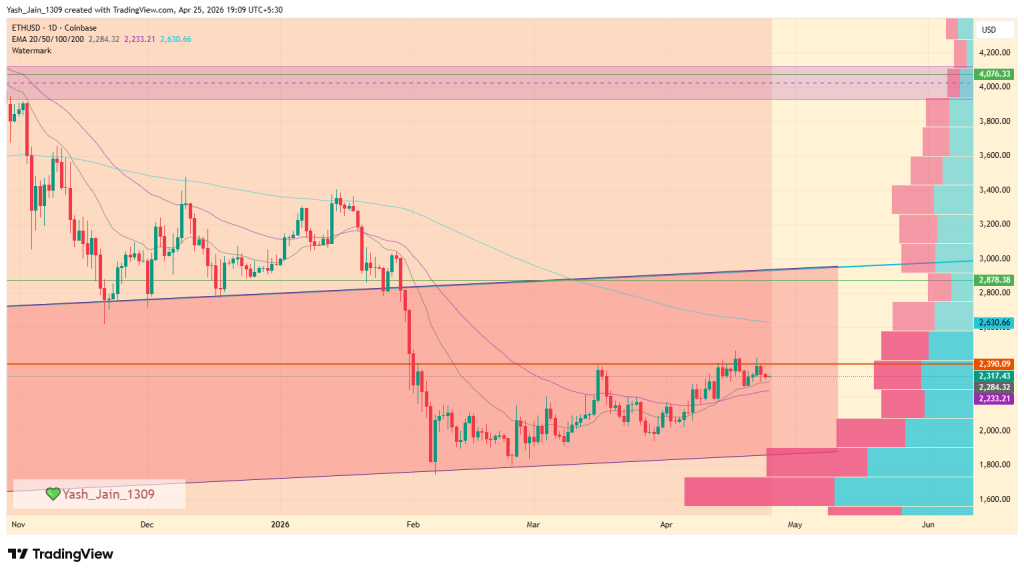
In the first quarter of the year, Ethereum’s price faced significant challenges, dropping from the $2,800 support level to a low of $1,750 in early February. But in February, there were some stabilization efforts, and by March, the price rose to $2,370. However, by late March, ETH dipped below $2,000.
Even in April, ETH attempted to retest the $2,390 level, reaching $2,460 in mid-April. Despite this increase, it failed to surpass $2,390 and fell back below it.
Currently, the ETH price is experiencing bearish pressure after taking liquidity above $2,390. It is holding at the 50-day EMA band; if it falls below this level, a return to $2,000 is likely. However, if the 50-day EMA holds, there could be a strong upward breakout above $2,390 in May.
Ethereum Price Prediction 2026
The Ethereum price currently exhibits a compelling long-term technical structure on the monthly timeframe, anchored by a multi-year 45-degree ascending trendline that has guided price action since 2020.
Historically, this trendline has served as a critical pivot point, with the market oscillating between periods of aggressive upward expansion above the line and phases of strategic consolidation below it.
Notably, when ETH trades beneath this trendline, it often forms a secondary short-term ascending channel lasting a few months. These channels act as accumulation zones, where price fluctuates until sufficient demand builds, eventually leading to a high-momentum breakout once bullish conditions are met.
In the current 2026 market environment, Ethereum appears to be following a familiar structural pattern, albeit with increased volatility and a broader trading range. The ongoing ascending channel, which began in 2025, aligns with the multi-year trendline but is significantly wider compared to previous cycles. While the price action indicates recovery potential, the market has not yet reached the specific demand threshold required to trigger a definitive vertical surge.
Overall, Ethereum’s multi-year trendline combined with the current ascending channel suggests a measured accumulation phase, setting the stage for a potential strong bullish breakout in the months ahead.
From a volume perspective, the anchored volume profile suggests that Ethereum (ETH) is finding significant support around key high-volume zones. These areas, particularly the ranges between $1,700–$1,900 and $1,200–$1,400, have historically attracted institutional interest, creating a solid floor that bears are unlikely to easily break.
If buyer demand strengthens at these levels, ETH could follow a recovery trajectory with an initial target near $2,878. A successful breach of this level would then pave the way for a retest of the $4,076 psychological resistance, signaling renewed bullish momentum.
However, a cautious approach remains warranted. If the market fails to generate sufficient demand at these support zones, the current consolidation phase below the multi-year trendline is likely to continue. In this bearish scenario, ETH would remain trading within its 2025 ascending channel, extending the accumulation period before a decisive trend emerges.
The interplay between this short-term ascending channel and the long-term trendline will ultimately determine whether Ethereum’s next move is a bullish continuation or a prolonged sideways consolidation.
ETH On-Chain Analysis
Ethereum’s price is currently stabilizing and 30-days On-chain data shows major whale transaction counts beyond $1 million has been rising in past 30-days. This is signaling “smart money” accumulation near the $2,000 support.
Moreover, the fundamentals of the network are growing. Since January 2025, the value of tokenized real-world assets (RWAs) on the blockchain has reached $20.4 billion. The Ethereum ecosystem now has 146 active Layer 2 networks, with a total value of $38.2 billion locked in these networks. Together, Ethereum’s mainnet and Layer 2 networks show that stablecoins account for over 60% of the market share, totaling about $179 billion.
This indicates a significant amount of liquidity in the ecosystem. Additionally, the number of ETH tokens on centralized exchanges is falling, meaning fewer ETH tokens are less available on CEX platforms meaning bullish pressure increasing.
Ethereum Price Prediction 2027-2030
Year
Potential Low ($)
Potential Average ($)
Potential High ($)
2027
7,071.08
14,142.16
21,213.24
2028
10,606.62
21,213.24
31,819.86
2029
15,909.93
31,819.86
47,729.79
2030
23,864.90
47,729.79
71,594.69
Ethereum (ETH) Price Prediction 2027
The Ethereum 2027 forecast expects the ETH coin price to make a new all-time high at $21,213.24. However, a correction based on market shortcomings may drive the ETH crypto to $7,071.08, with an average of $14,142.16.
ETH Price Prediction 2028
In 2028, the chances of Ethereum dominating the crypto market rise as the ETH price potentially makes a new high at $31,819.86. On the other hand, the altcoin might fall to $10,606.62, making an average of $21,213.24.
Ethereum Price Forecast 2029
Approaching its all-time high of $47,729.79 in 2029, the Ethereum price is expected to surpass the psychological barrier of $40,000. In case of a correction, $ETH may reach a low of $15,909.93, with an average price of $31,819.86.
Ethereum Price Prediction 2030
As per our Ethereum Price Prediction 2030, the ETH crypto price is projected to reach a new all-time high of $71,594.69 in 2030, with a potential low of $23,864.90 and an average price of $47,729.79.
Ethereum (ETH) Price Prediction: Market Analysis?
Year
2026
2027
2030
Changelly
$5,800
$7,500
$25,000
CoinCodex
$6,300
$7,850
$28,200
WalletInvestor
$5,940
$7,450
$21,500
Never Miss a Beat in the Crypto World!
Stay ahead with breaking news, expert analysis, and real-time updates on the latest trends in Bitcoin, altcoins, DeFi, NFTs, and more.
FAQs
What is the Ethereum price prediction for 2026?
Ethereum could reach $6,200 in 2026 if accumulation strengthens and demand at key support levels increases.
What will be the price of Ethereum in 2027?
ETH may hit around $21,200 in 2027, with potential lows near $7,071 depending on market conditions.
How much will 1 Ethereum be worth in 2030?
By 2030, 1 ETH could reach a new all-time high of $71,500 under strong adoption and network growth.
Could Ethereum reach $100,000 by 2040?
If adoption and blockchain integration continue rising, Ethereum could theoretically approach $100,000 by 2040.
How high will Ethereum go in 2050?
Long‑term, Ethereum could exceed $150,000–$200,000 by 2050 with widespread global adoption, DeFi and tokenization.
Is Ethereum a good investment?
Ethereum remains a strong long-term investment due to growing DeFi use, Layer 2 adoption, and rising institutional interest.
Expanding exchange-ecosystem demand could lift BNB price toward $2000 by the end of this year.
Long-term network usage growth may extend BNB price toward $10,000.
Binance Coin (BNB) suggests a fundamental shift in how the asset responds to broader market dynamics. In 2026, the token’s performance increasingly reflects on-chain utility and ecosystem liquidity rather than mere speculative volatility. This transition from reactive price swings to a more structured price action indicates a maturing market environment.
As the ecosystem stabilizes, the technical narrative centers on long-term accumulation and the absorption of supply within established demand zones. Sustained network activity across the Binance Smart Chain provides a foundational backdrop for this consolidation, potentially setting the stage for a period of extended price discovery. By focusing on fundamental network health and institutional integration, the outlook for the next several years leans toward organic growth and structural resilience within the global digital asset landscape.
So, what’s next for the BNB price in the rest of 2026 and beyond? What can be the future price movements? Let’s get into the Binance Coin (BNB) Price Prediction 2026–2030.
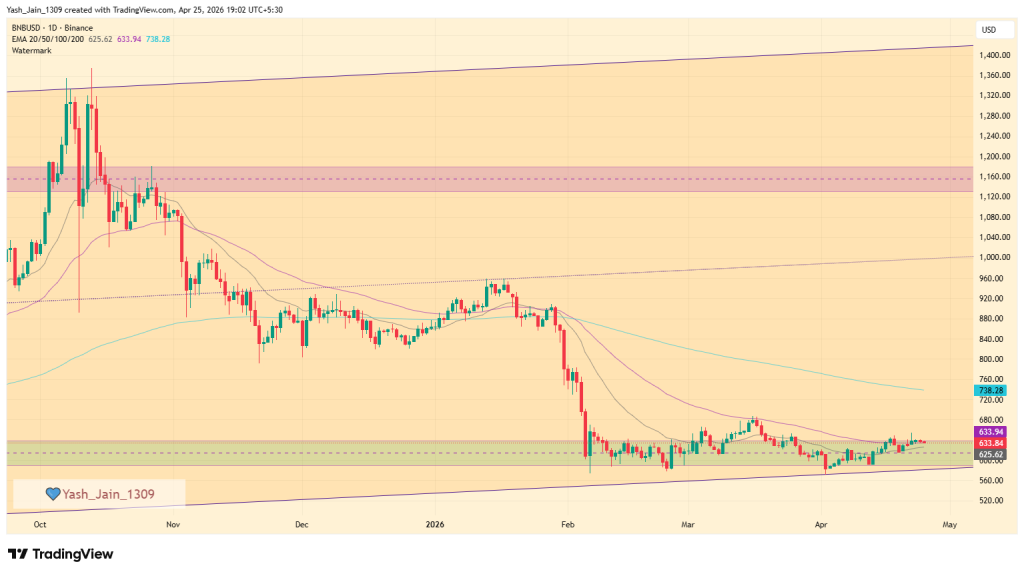
In the third quarter of 2025, we witnessed an impressive rally, soaring 125% from the $600 support level to an exhilarating $1,375. However, by the fourth quarter of 2025 and into the first quarter of 2026, the BNB price retreated back to the $600 demand zone, erasing those remarkable gains.
Since February, we have observed a steady accumulation around this vital $600 level, a trend that has continued into March, so Q1 was tough. But, as Q2 began with April and still consolidating, implied that this level appears to have solidified as a robust support point, suggesting that bullish momentum could very well resume in May month.
Despite prevailing market challenges, the BNB price has demonstrated remarkable resilience, remaining above $600 throughout Most of April. Should bullish pressure intensify in May, then we may see a potential retest of $750; otherwise, further consolidation may continue throughout the month.
Recent News/ Opinions
On April 1, 2026, Binance Earn launched new Yield Arena offers, providing limited-time opportunities to earn up to 35% APR. This weekly update spans across multiple products, including Simple Earn, ETH and SOL Staking, and Dual Investment.
On March 27, 2026, binance shared that equity and commodity perpetual futures on Binance surpassed $150 billion in cumulative trading volume. This milestone was supported by an immense processing of over 110 billion trades in one quarter, highlighting the growing crossover between traditional finance and digital markets.
A recent ruling news on March 7th came from the US federal court that it has positively dismissed all anti-terrorism claims against Binance, alleviating a significant legal burden. In the Southern District of New York, a judge concluded that the plaintiffs, comprising 535 individuals citing 64 attacks from 2017 to 2024, did not establish sufficient evidence to demonstrate that Binance had assisted or conspired with terrorist organizations. This decision marks a commendable step forward for Binance, affirming its commitment to compliance and integrity.
Binance Coin (BNB) Price Prediction 2026
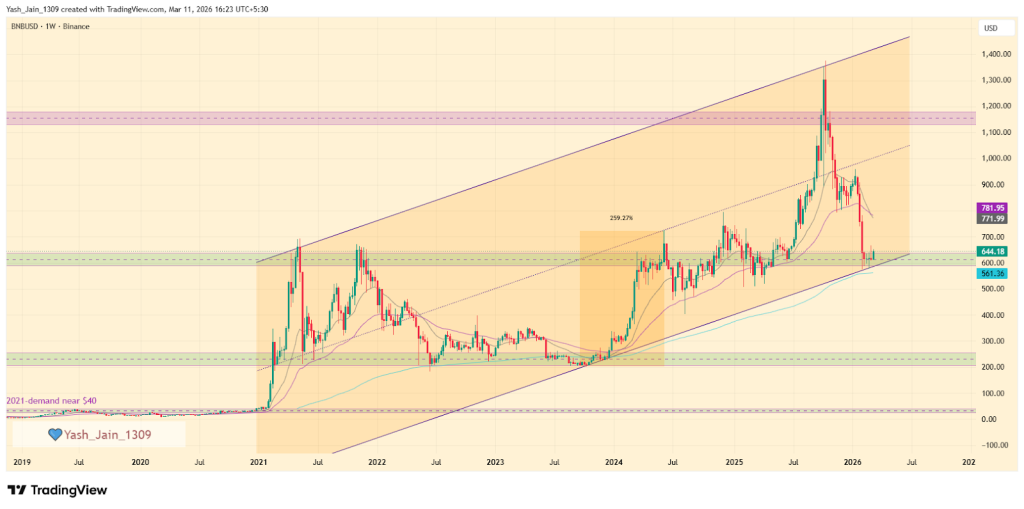
Based on the technical structure of the BNB/USD weekly chart, the price action reflects a long-term ascending channel (or wedge) that has defined the asset’s trajectory since the massive demand surge from the $40 level in early 2021. This multi-year uptrend culminated in a new all-time high of approximately $1,375 in late 2025, validating the token’s utility and its position within the Binance ecosystem. Currently, the market is witnessing a convergence of horizontal price levels with channel’s dynamic trendline support, which reinforces the technical significance of the current price zone.
As of Q1 2026, BNB price is testing a critical turning support zone around the $600 horizontal support, which aligns precisely with the lower boundary of the primary ascending channel. This area is currently serving as a consolidation floor, suggesting a period of institutional accumulation. Historical precedent highlights the importance of this trendline; a similar touchpoint in late 2023 at the $200 range served as the launchpad for a massive rally, though it took roughly 238 days to reach the channel’s median line.
Looking ahead through 2026, the primary bullish thesis anticipates a recovery toward the $1,000 psychological level. If the recovery pace mirrors previous cycles, BNB/USD could reach the channel’s middle band by Q3 2026. However, if consolidation extends further into the year, the recovery might be more gradual, stretching toward the year-end.
Conversely, a decisive break below the $600 footing would invalidate the current setup, significantly increasing the probability of a deeper correction toward the major $200 demand zone.
BNB On-Chain Analysis
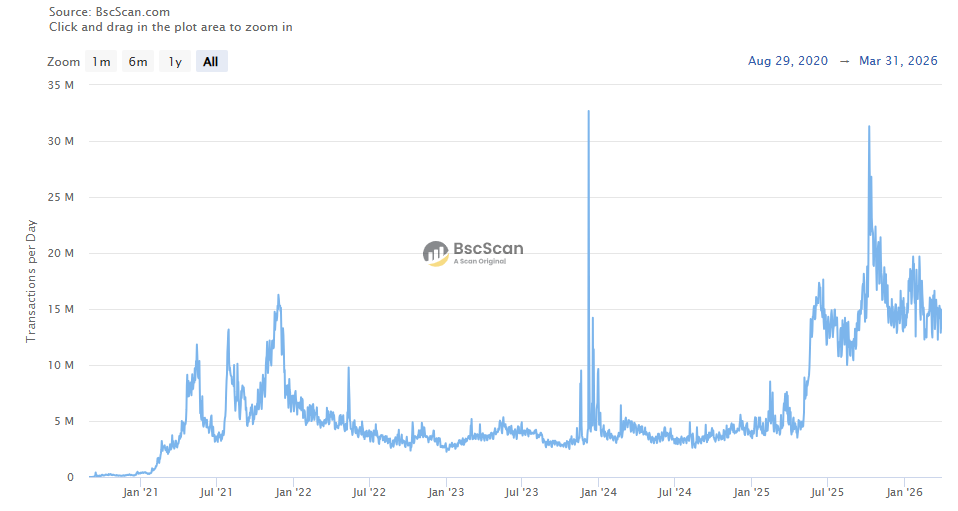
Recent on-chain data highlights the network’s resilience, with daily transactions stabilizing at 15 million in Q1 2026 despite market fluctuations. This sustained utility, paired with total unique addresses nearing the 800 million mark, signals a consistent rise in global adoption. These fundamental metrics suggest a robust foundation for long-term ecosystem growth and structural asset valuation.
Binance Coin Crypto Price Prediction 2027 – 2030
Year
Potential Low ($)
Potential Average ($
Potential High ($)
2027
1200
1420
1800
2028
1600
1950
2300
2029
2100
3250
3900
2030
2500
3800
4500
Binance Coin Price Prediction 2027
As per the Binance Coin Price Prediction 2027, Binance Coin may see a potential low price of $1200. The potential high for Binance Coin price in 2027 is estimated to reach $1800.
BNB Price Prediction 2028
In 2028, Binance Coin price is forecasted to potentially reach a low price of $1600 and a high price of $2300.
Binance Coin Price Forecast 2029
Thereafter, the Binance Coin (Binance Coin) price for the year 2029 could range between $2100 and $3900.
Binance (BNB) Coin Price Prediction 2030
Finally, in 2030, the price of Binance Coin is predicted to remain steadily positive. It may trade between $2500 and $4500.
The long-term projection assumes Binance Coin sustains relevance in enterprise blockchain use cases, with growth moderating over time as the asset matures.
Stay ahead with breaking news, expert analysis, and real-time updates on the latest trends in Bitcoin, altcoins, DeFi, NFTs, and more.
FAQs
What is the BNB price prediction for 2026?
BNB could recover toward $1,000 in 2026 if the $600 support holds and Binance ecosystem demand grows, supported by rising network usage and liquidity.
What will be the BNB price in 2030?
BNB could trade between $2,500 and $4,500 by 2030 if blockchain adoption grows and the Binance ecosystem maintains strong network activity.
How high can BNB price go by 2040?
Long-term projections suggest BNB could reach $13,000–$38,000 by 2040 if the network expands globally and maintains strong adoption across DeFi and Web3.
What factors influence Binance Coin’s price?
Price depends on exchange network usage, liquidity, adoption trends, historical support/resistance zones, and institutional participation.
Is Binance Coin (BNB) a good long-term investment?
BNB is often viewed as a strong long-term asset due to exchange utility, token burns, and ecosystem growth, though crypto investments always carry risk.


 (@orca_so)