Avalanche (AVAX) Price Prediction 2026, 2027 – 2030: Will AVAX Price Hit $100?
The post Avalanche (AVAX) Price Prediction 2026, 2027 – 2030: Will AVAX Price Hit $100? appeared first on Coinpedia Fintech News
Story Highlights
- The live price of the Avalanche is $ 9.37343385.
- Price predictions for 2026 highlight a potential range of between $20-$80.
- Long-term forecasts indicate AVAX could reach $518.50 by 2030.
Aave (AAVE) is a decentralized finance protocol built on Ethereum that facilitates permissionless lending and borrowing through smart contracts. After witnessing a strong expansion in the previous market cycle, AAVE entered a prolonged correction phase, with price gradually retracing from its earlier highs. Throughout 2025, AAVE remained in a consolidation structure, reflecting a period of market digestion rather than trend continuation. While short-term momentum has cooled, the broader technical structure suggests that AAVE may be transitioning into a new accumulation phase.
As volatility contracts and price holds above long-term demand levels, attention is now shifting toward whether 2026 can trigger the next major price discovery cycle.
Table of Contents
Avalanche Price Today
| Cryptocurrency | Avalanche |
| Token | AVAX |
| Price | $9.3734
|
| Market Cap | $ 4,047,185,917.57 |
| 24h Volume | $ 228,668,909.1381 |
| Circulating Supply | 431,771,961.1772 |
| Total Supply | 463,441,061.1772 |
| All-Time High | $ 146.2179 on 21 November 2021 |
| All-Time Low | $ 2.7888 on 31 December 2020 |
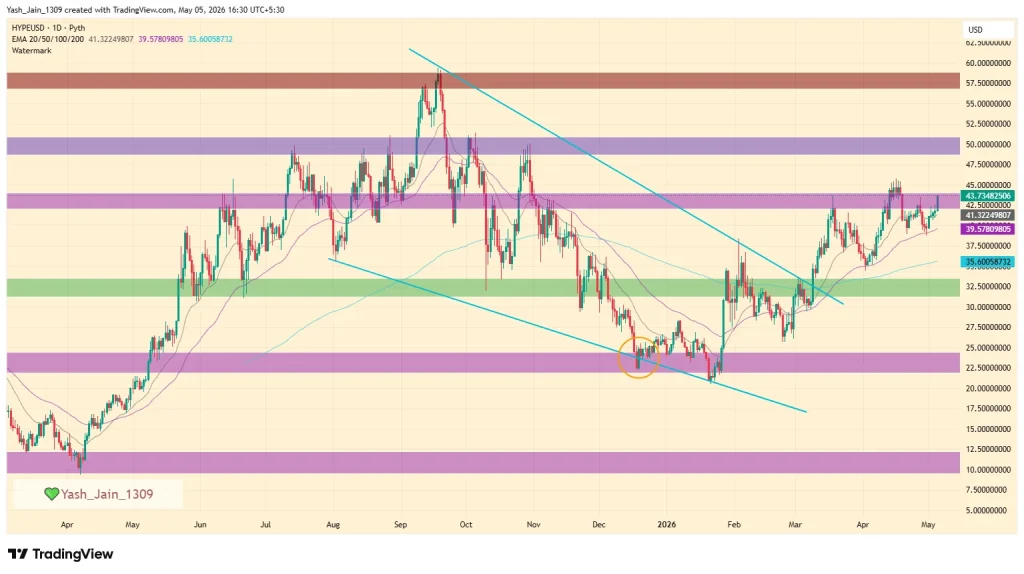
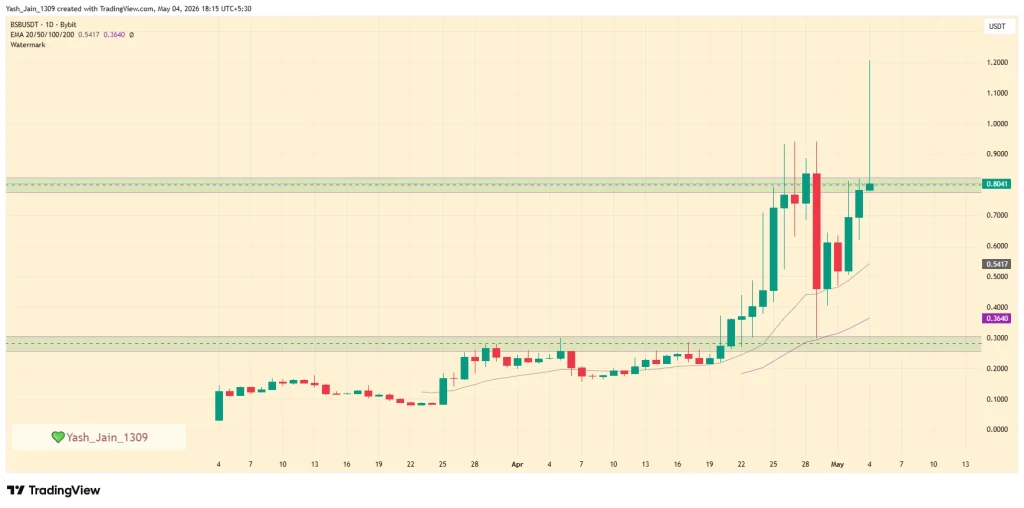
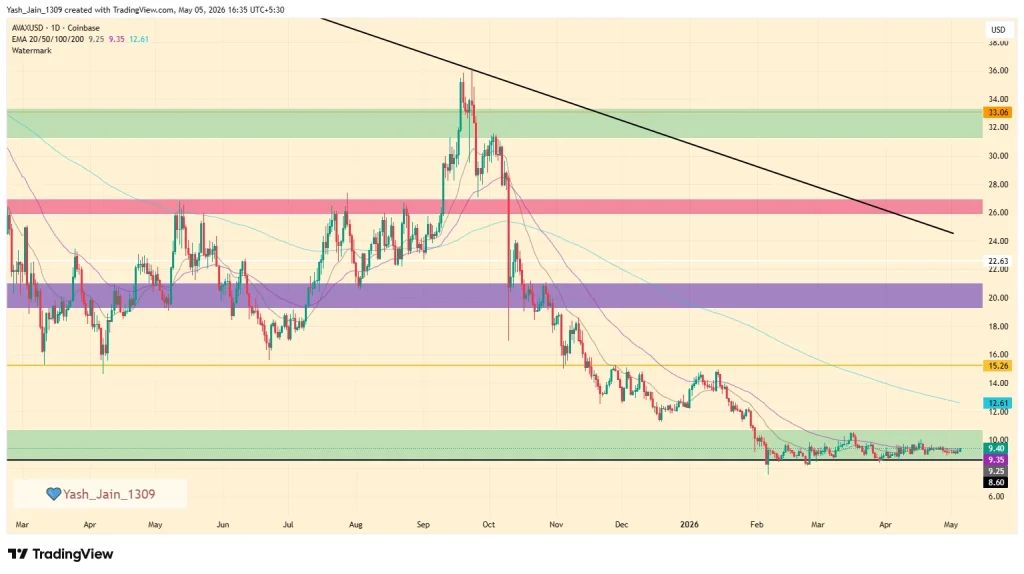
AVAX price prediction May 2026
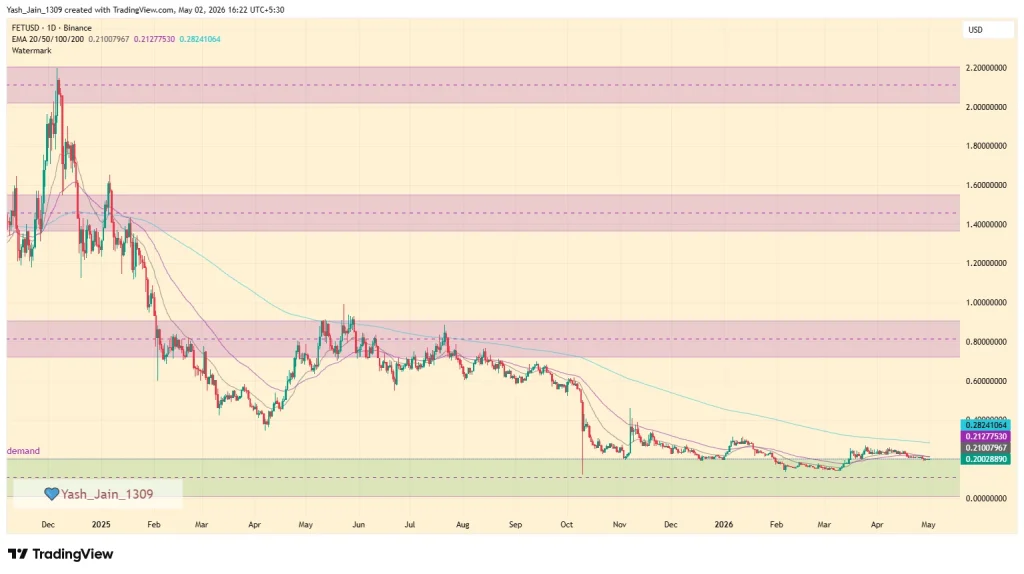
Avalanche price (AVAX) remains stuck within a long-standing rectangular consolidation range between $8.60 and $10.50 as it is in the second quarter of 2026. After experiencing rejection at the $15 resistance level in Q1’s January, the AVAX price has struggled to gain significant bullish momentum, oscillating within this tight demand zone throughout Q1 until March. While analysts initially anticipated a recovery earlier in the April, but the market has instead opted to continue to build a base at these lower levels.
As we approach May, AVAX’s price is currently hovering near the $8.60 lower boundary of this range. The immediate technical resistance for the month is at the $10.50 upper edge; a decisive breakout above this level is necessary to change the market bias and pave the way for a retest of the $15 psychological resistance.
However, given the persistently low trading volume and the current market indecision, failing to clear the $10.50 mark could result in continued sideways price action in May as the asset awaits a stronger catalyst.
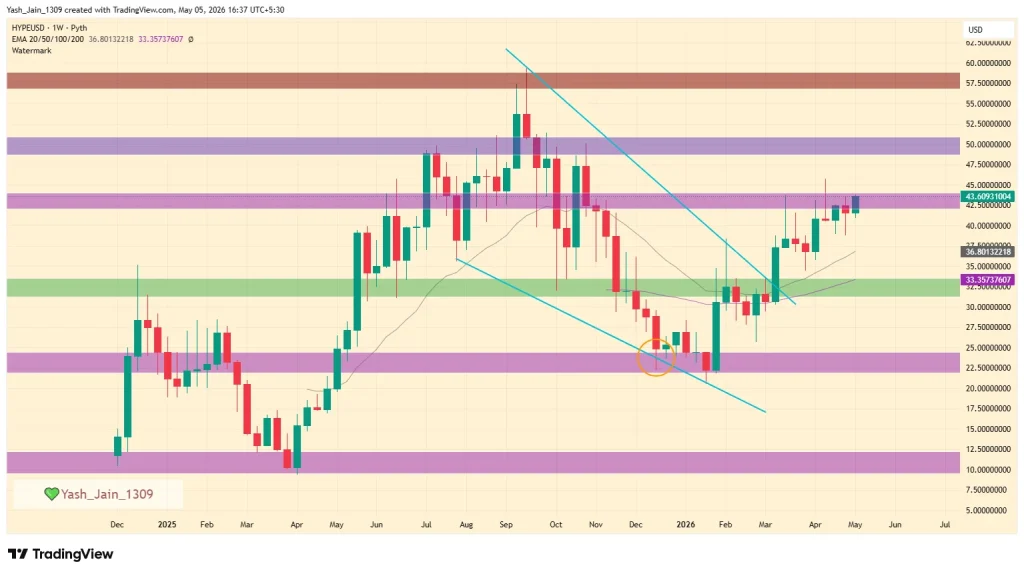
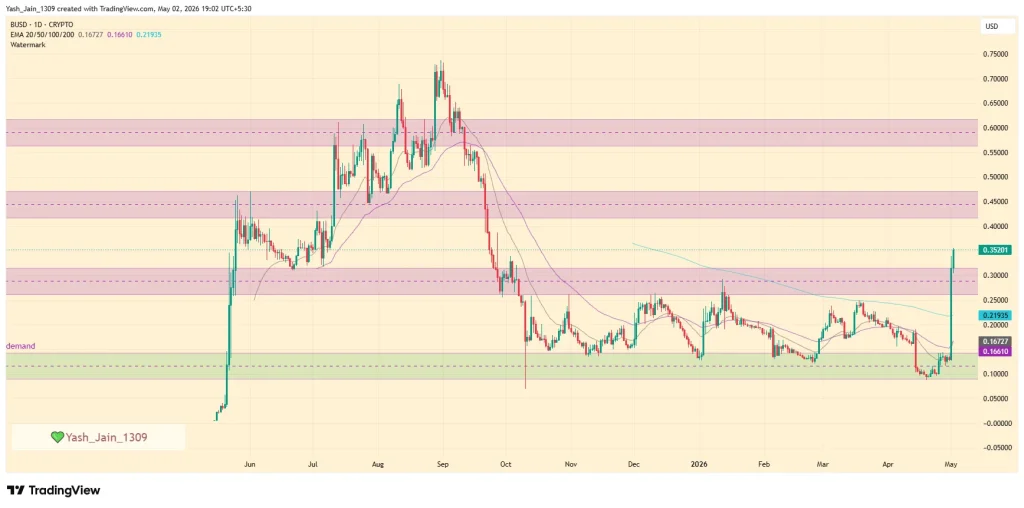
Avalanche (AVAX) Price Prediction 2026
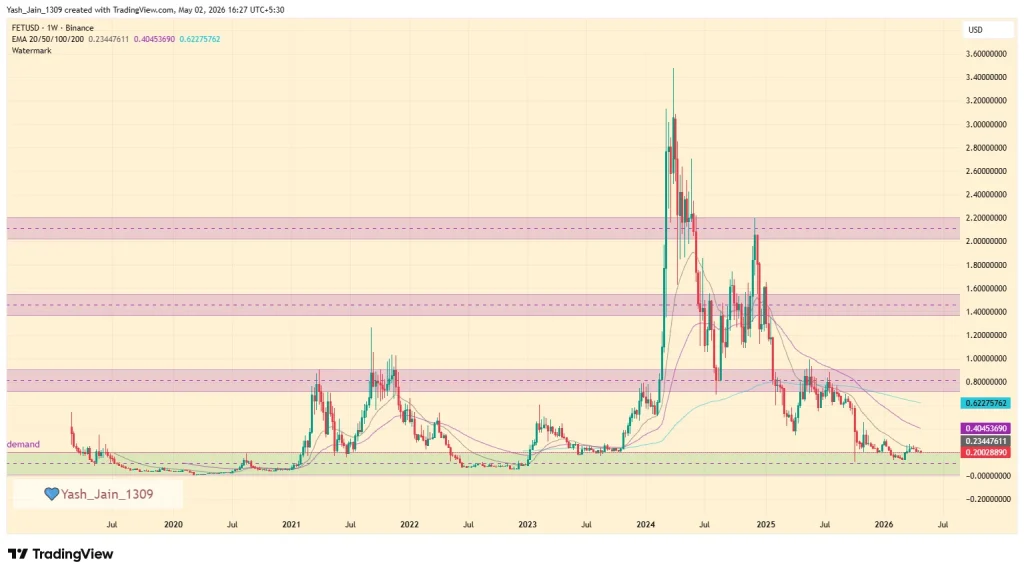
The weekly price action for Avalanche price (AVAX) has been defined by a multi-year structural decline following its Q1 2024 peak of $65. Throughout 2024 and 2025, the asset remained trapped under a descending resistance line, with bearish momentum intensifying in early 2026. This downward pressure drove AVAX price to a major horizontal support floor between $8.60 and $10.00, marking a critical “base-building” phase as Q1 concluded with a period of low-volatility consolidation.
As Q2 2026 begins, holding this demand zone is essential for any potential reversal. While the price has been stagnant for nearly two years, the prolonged accumulation at these lows suggests that a market bottom may finally be in place. If demand returns in April, the first half of the year could see a recovery rally toward $20, with an ambitious secondary target at the $28 level, which aligns with the 200-week EMA and the long-term descending trendline.
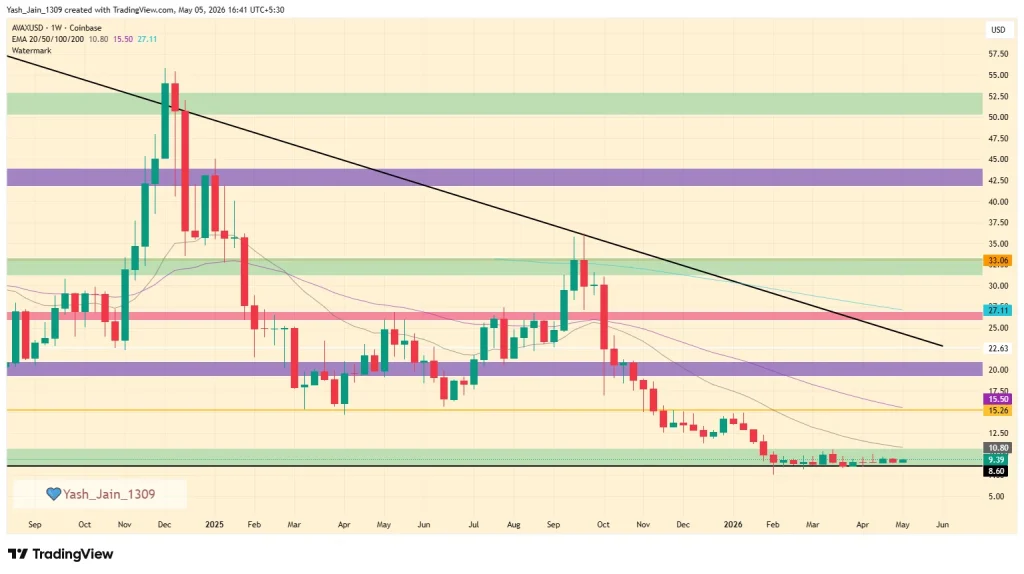
A decisive breakout above this $28 resistance would signal a major trend shift, potentially clearing the path for AVAX to reclaim $44 by the end of 2026. However, investors should remain cautious; if the $28 level repels the price, the recovery could stall, leading to extended consolidation within the lower ranges. The next few months are pivotal to determine whether AVAX/USD can finally emerge from the shadow of its multi-year bear market.
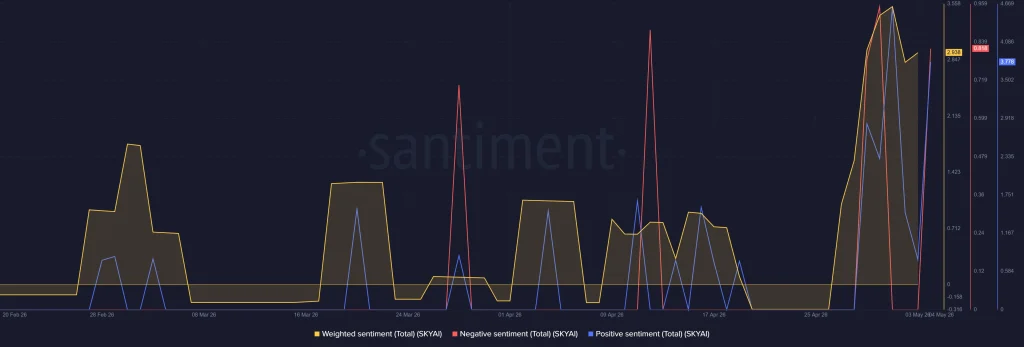
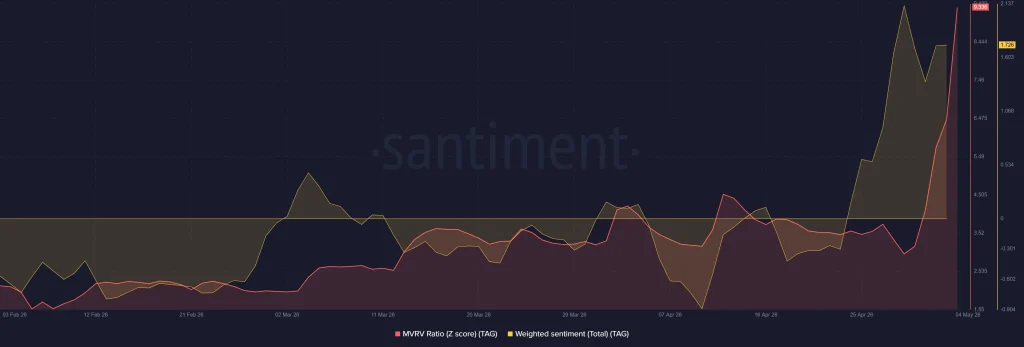
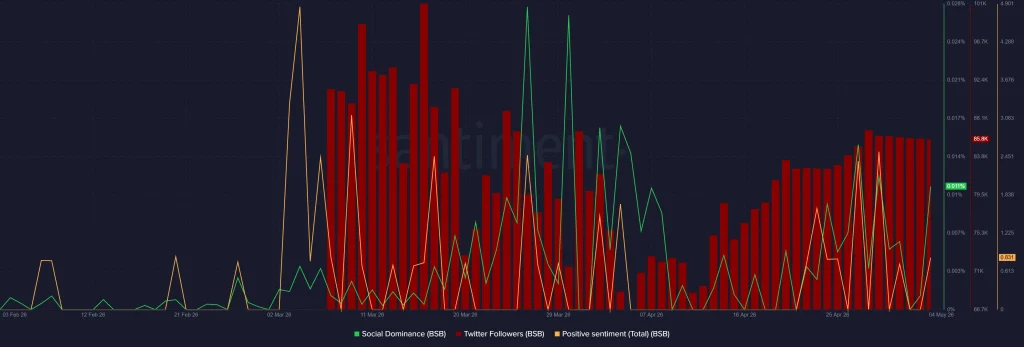
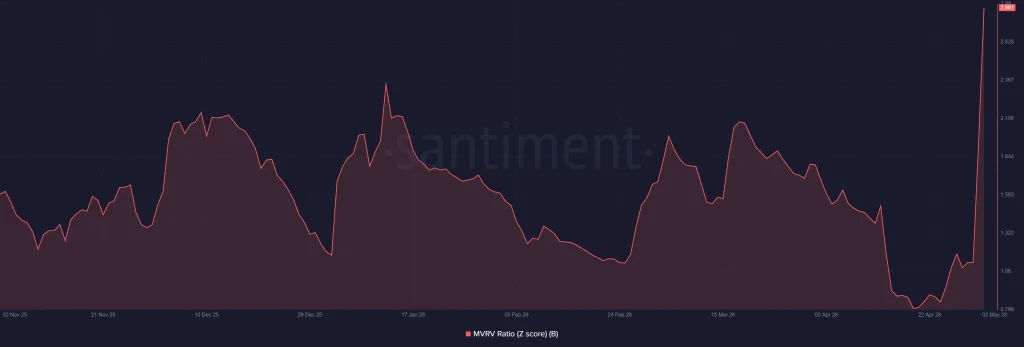
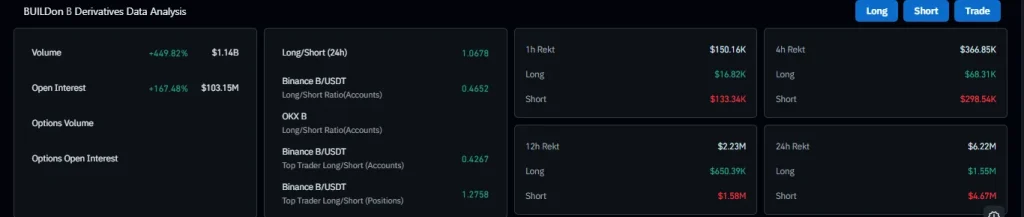
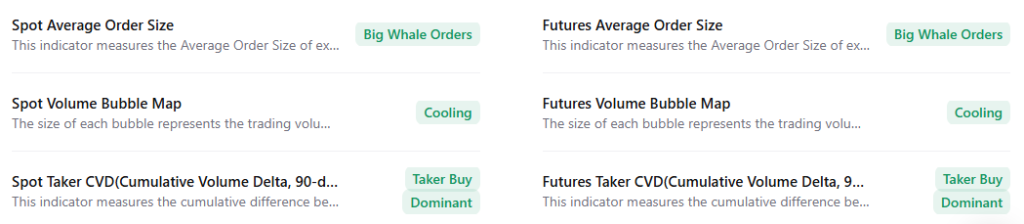
AVAX On-Chain Analysis
AVAX shows a highly bullish sentiment. Big Whale Orders in both spot and futures indicate strong institutional accumulation. With Taker Buy Dominance at 90 days, aggressive buyers are in control, while the Cooling volume bubble map suggests a healthy consolidation phase. Collectively, major metrics point to a bullish rally ahead.
Avalanche Price Prediction 2026 – 2030
| Year | Potential Low ($) | Potential Average ($ | Potential High ($) |
| 2026 | 400 | 500 | 600 |
| 2027 | 550 | 690 | 820 |
| 2028 | 650 | 830 | 980 |
| 2029 | 740 | 950 | 1100 |
| 2030 | 820 | 1000 | 1200 |
AAVE Price Forecast 2026
Looking ahead to 2026, AVAX’s potential price is anticipated to rise even further, with a projected low of $20.00 and a high of $80.00. The average price for AVAX in 2026 will likely be $50.00.
AAVE Price Prediction 2027
In 2027, the analysis suggests a continued upward trend in AVAX’s value, with the price potentially ranging between $31.50 and $126.50. Based on the calculated figures, the average price is projected to be approximately $79.00 during this period.
AAVE Prediction 2028
By 2028, AVAX’s price could potentially experience further growth, falling within the range of $50.50 and $202.50. The average price during this period, calculated from the data, is expected to be around $126.50.
AAVE Price Prediction 2029
Moving forward to 2029, AVAX’s price is predicted to ascend between $81.00 and $324.00. The average price during this period is estimated at around $202.50 based on calculated figures.
AAVE Price Prediction 2030
By 2030, AVAX’s price is forecasted to soar between $129.50 and $518.50. Further, the average price during this period, calculated from the data, could stand at $324.00.
AAVE Price Prediction 2031, 2032, 2033, 2040, 2050
Based on the historic market sentiments and trend analysis of the largest cryptocurrency by market capitalization, here are the possible AAVE price targets for the longer time frames.
| Year | Potential Low ($) | Potential Average ($) | Potential High ($) |
| 2031 | 890 | 1100 | 1350 |
| 2032 | 920 | 1200 | 1500 |
| 2033 | 1100 | 1350 | 1780 |
| 2040 | 1600 | 2200 | 3000 |
| 2050 | 2600 | 3300 | 4500 |
AAVE Price Prediction: Market Outlook?
| Year | 2026 | 2027 | 2030 |
| Changelly | $500 | $750 | $1100 |
| DigitalCoinPrice | $480 | $680 | $1000 |
| WalletInvestor | $520 | $650 | $1250 |
Never Miss a Beat in the Crypto World!
Stay ahead with breaking news, expert analysis, and real-time updates on the latest trends in Bitcoin, altcoins, DeFi, NFTs, and more.
FAQs
AAVE shows long-term growth potential if it breaks key resistance levels. However, price depends on market conditions and DeFi adoption.
Watch support near $135–$150, resistance above $250, overall market trend, and activity within the Aave protocol.
Key drivers include DeFi expansion, institutional adoption, subnet growth, and overall crypto market recovery cycles.
The AVAX price prediction for 2026 suggests a potential range between $400 and $600 if market momentum and network growth remain strong.
AVAX coin price prediction for 2030 points to a possible range of $820 to $1,200, assuming sustained adoption and favorable market conditions.
Avalanche price prediction for 2040 estimates a broad range between $1,600 and $3,000 if long-term blockchain adoption accelerates globally.