Algorand price has climbed 7% in the last 24 hours, extending its recovery as ALGO price holds firm within an accumulation range formed after its earlier downtrend break. The move signals growing buyer interest, with structure tightening beneath resistance. With ALGO price now approaching the $0.1200 breakout level, the key question is: Can this momentum trigger the next leg higher?
Derivatives Activity Rises as Market Participation Expands
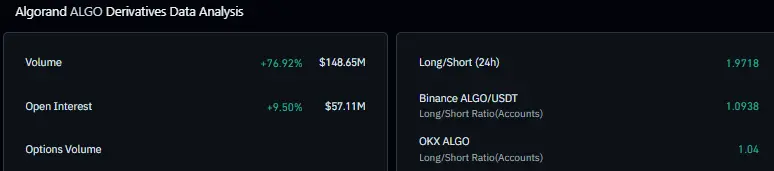
Recent derivatives data highlights a clear increase in market activity. Trading volume has surged by over 76% to around $148 million, while open interest has climbed approximately 9.5% to $57 million. This parallel rise in volume and open interest suggests new capital entering the market, rather than just short-term covering.
It reflects growing conviction among traders as ALGO stabilizes within its current range. Such conditions often precede directional moves, particularly when price compresses beneath resistance while participation expands.
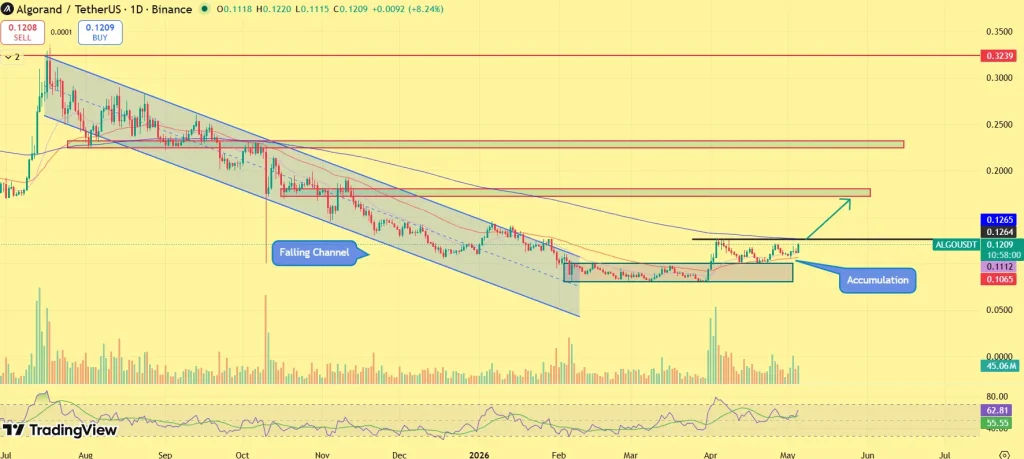
Algorand price is trading within a defined accumulation zone between $0.10 and $0.12, which has acted as a strong base following its earlier breakout from a falling channel. ALGO price action is forming higher lows, indicating that buyers are stepping in at progressively higher levels, a key signal of strengthening demand. At the same time, ALGO token is compressing just below resistance, reflecting a tightening range structure.
The immediate breakout level lies near $0.1200–$0.13, which has capped recent upside attempts. A decisive move above this zone, supported by sustained momentum, could trigger continuation toward $0.16, followed by a broader resistance zone near $0.18. On the downside, holding above $0.10 remains critical to maintain the current structure. As long as this base holds, the setup remains constructive.
Momentum Builds Within Consolidation Phase
The current structure reflects a transition from trend reversal into accumulation, where selling pressure has faded and demand is gradually strengthening. The recent 7% move, combined with rising derivatives activity, suggests that momentum is beginning to build within the range, rather than fading. This phase typically precedes expansion moves, as liquidity accumulates near key levels. With volatility compressing and participation increasing, the setup points toward a market preparing for its next directional move.
What’s Next for ALGO?
Algorand is now approaching a critical level where structure and participation are beginning to align. With ALGO price holding firmly above its accumulation base and buyers steadily stepping in, the setup appears to be building pressure beneath resistance.
The focus remains on $0.1200. A confirmed breakout above this level could unlock momentum toward $0.16–$0.18, signaling continuation of the recovery phase. Until then, ALGO may remain range-bound, but the current setup suggests that the next move is building rather than fading.
ONDO is rapidly positioning itself as a standout performer in the current crypto cycle, gaining over 23% this week while much of the altcoin market remains subdued. The move isn’t just technical, it’s being driven by a deeper structural shift as capital rotates into real-world asset (RWA) narratives.
Unlike momentum-driven rallies seen elsewhere, ONDO’s strength is emerging alongside institutional traction, growing liquidity, and expanding real-world integrations. With ONDO price now breaking out of consolidation and fundamentals aligning, the market is beginning to reprice ONDO’s long-term role, raising the key question: Is this just the start of a larger move?
Institutional Momentum Builds: ONDO Expands Beyond Crypto Native Demand
ONDO’s recent rally is closely tied to its growing relevance in bridging traditional finance with blockchain infrastructure. The protocol has secured high-profile integrations that signal real institutional confidence rather than speculative interest.
Fidelity’s involvement in tokenized fund strategies, PayPal’s linkage of its stablecoin ecosystem to ONDO’s yield layer, and Mastercard’s integration into multi-token payment rails collectively highlight a strong adoption curve.
Further backing from major asset managers like Franklin Templeton underscores ONDO’s positioning in tokenizing traditional financial instruments, a sector expected to scale significantly over the coming years. This convergence of TradFi and crypto infrastructure places ONDO at the center of a narrative that is increasingly capital-driven rather than sentiment-driven.
Fundamentals Strengthen: Real Usage Supports Market Expansion
Beyond partnerships, ONDO’s growth is backed by measurable ecosystem expansion. The protocol’s total value locked (TVL) has surged toward $3.5 billion, indicating sustained capital inflows. Revenue generation has also scaled, with multi-million dollar quarterly figures, reflecting actual usage rather than idle liquidity.
Meanwhile, ONDO is estimated to command over 60% of the tokenized equities market, solidifying its leadership in the RWA segment. This combination of dominant market share, growing TVL, and institutional-grade integrations suggests that ONDO is evolving into a core infrastructure layer, not just another altcoin narrative.
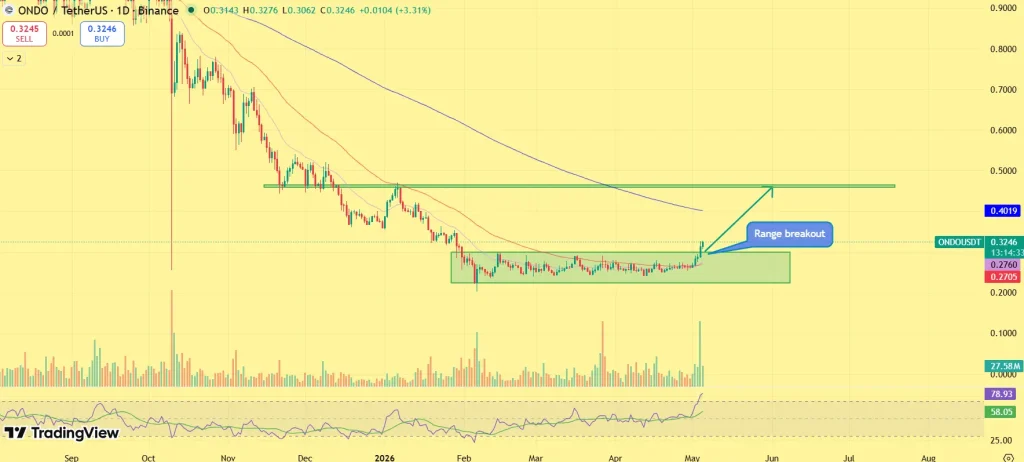
ONDO Price Analysis: Range Breakout Signals Early Expansion Phase
ONDO price has confirmed a breakout above its prolonged consolidation range between $0.27 and $0.32, marking a shift in market structure. The breakout is accompanied by rising momentum and sustained price acceptance above resistance, key indicators that the move is structural rather than short-lived. ONDO price is also holding above short-term moving averages, reinforcing bullish control.
If ONDO maintains strength above the $0.30–$0.32 zone, the next immediate resistance sits near $0.40. A successful move beyond this level could open the path toward $0.50–$0.57, aligning with higher timeframe supply zones. However, failure to hold the breakout region could lead to short-term consolidation, making support retention a critical factor in confirming continuation.
Is ONDO Entering a Sustained Growth Phase?
ONDO’s current trajectory reflects a rare alignment of price strength, institutional validation, and fundamental growth. The breakout suggests that the market is beginning to recognize its expanding role within the RWA ecosystem.
While short-term volatility remains possible after a strong weekly rally, the broader structure points toward early-stage expansion rather than exhaustion. If institutional momentum continues and key levels hold, ONDO could remain at the forefront of the next market leg, driven not by hype, but by real financial integration and scalable infrastructure.
Toncoin (TON) price has staged a sharp 22% rally, snapping out of its consolidation phase and pushing into a critical resistance zone. A deeper structural shift tied to Telegram’s expanding role within the TON ecosystem is beginning to reflect in price action, on-chain activity, and liquidity flows. As volume accelerates and key levels come into play, TON price rally signals more than short-term momentum, it points to a possible revaluation phase driven by real demand expansion.
So what’s really driving this sudden surge in Toncoin (TON), and can the momentum sustain from here?
The core driver behind TON’s rally lies in Telegram’s deepening integration into the ecosystem. Rather than acting as a passive partner, Telegram is increasingly positioning itself as a key infrastructure layer, aligning its massive user base with TON’s blockchain.
TELEGRAM TO REPLACE TON FOUNDATION AS PRIMARY NETWORK OPERATOR
Telegram is officially taking over as the primary driving force behind the $TON network, replacing the independent TON Foundation.
With 900M+ users, Telegram effectively acts as a native distribution engine for TON. Wallet functionality, mini-app ecosystems, and payment rails are being embedded directly into the platform, significantly reducing onboarding friction. This transforms TON from a traditional Layer-1 into a user-integrated network, where adoption is driven organically through existing user behavior. This shift changes demand dynamics. Instead of relying purely on external speculation, TON now benefits from embedded utility, where transactions, interactions, and applications generate consistent on-chain activity.
On-Chain Growth and Liquidity Confirm Expansion
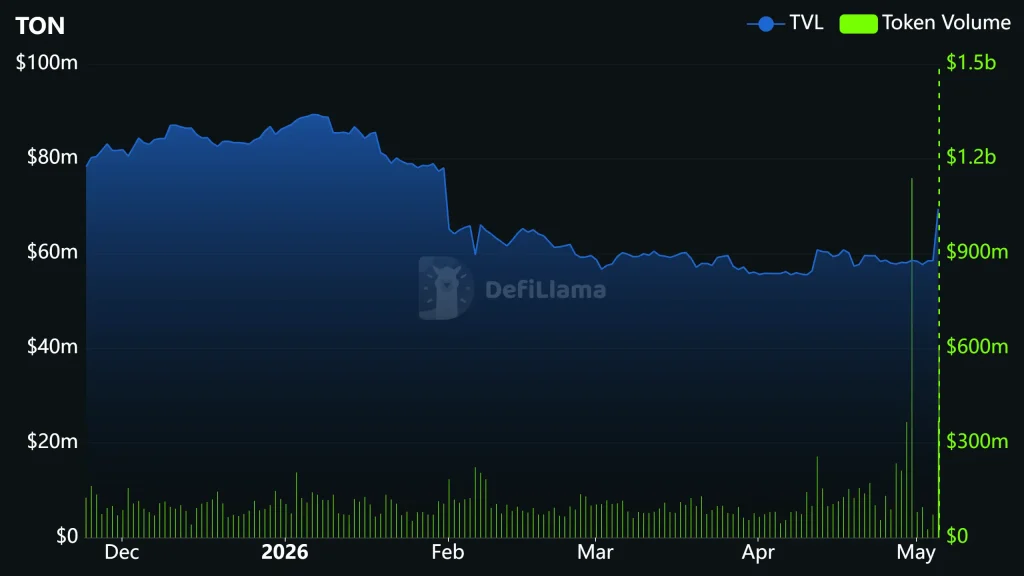
The rally is supported by clear improvements in ecosystem metrics. TON’s Total Value Locked (TVL) has climbed toward ~$69 million, signaling renewed capital inflows into its DeFi layer. At the same time, the stablecoin supply has expanded to around $750M+, strengthening liquidity depth across the network.
Network usage is also picking up pace. Daily DEX volume is holding near $15M, while application-level revenue and fees have shown steady growth, indicating real transactional activity rather than passive holding.
Notably, derivatives activity remains relatively low compared to spot, suggesting that the current rally is being driven more by organic demand than leveraged speculation, a healthier structure for continuation.
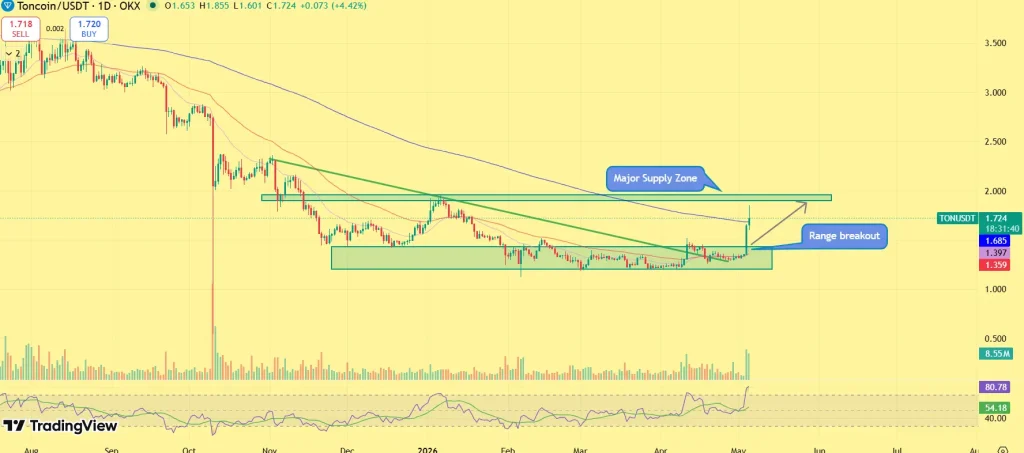
Toncoin Price Rally Enters Decision Zone as TON Price Pressures Resistance
As Toncoin’s price rally gains traction, price is now entering a decisive phase where structure meets resistance. After breaking out of a prolonged consolidation, TON is trading around $1.65–$1.70, signaling a shift from accumulation into early expansion.
The immediate focus is the $1.70–$2.00 resistance band, a prior supply zone that previously capped upside. In the current move, price is compressing just below this level with minimal pullbacks, suggesting that selling pressure is being steadily absorbed as buyers step in at higher levels. Furthermore, volume spike during the breakout reinforces this shift, indicating real participation rather than a low-liquidity spike, while momentum indicators remain supportive of continuation.
A clean break and hold above $2.00 would confirm acceptance and open the path toward $2.50–$3.00, where the next liquidity cluster sits. On the downside, the $1.40–$1.50 range now acts as structural support, keeping the broader bullish setup intact as long as it holds.
What’s Next for Toncoin (TON)?
Toncoin is approaching a decisive moment where narrative and price structure are beginning to align. The $2.00 resistance now stands as the key trigger, clearing it could shift TON from breakout attempt to full expansion, opening room toward $2.50–$3.00.
With Telegram integration steadily building real demand, the current setup suggests more than a short-term rally. However, without confirmation, consolidation remains possible. For now, TON appears to be moving from momentum into a structurally driven growth phase, where the next move will define the trend.
Tron’s price 2026 target is $1.20, if breakout structure confirms above $0.50.
TRX’s 2030 projection toward $4 is possible, under a strong ecosystem and stablecoin growth.
TRON’s position in the current market cycle is increasingly being shaped by its dominance in real transactional activity, particularly as a primary settlement layer for stablecoins like USDT. With consistent on-chain demand, strong network revenue, and expanding global usage, TRON continues to stand out as one of the few networks where utility directly supports price stability. At the same time, its price structure is beginning to reflect that strength.
After an extended period of gradual upside, TRX is now holding near the $0.32–$0.33 range, consolidating just below recent highs rather than correcting sharply. This creates a setup where fundamentals and price action are starting to align. As TRON continues to benefit from strong network activity and steady demand, the focus now shifts to whether this consolidation phase can translate into further expansion.
With the market already progressing through 2026, the focus now shifts to whether TRON can sustain its network dominance while translating usage into continued price expansion. Read on as we break down TRON’s May outlook and TRX price prediction 2026-30.
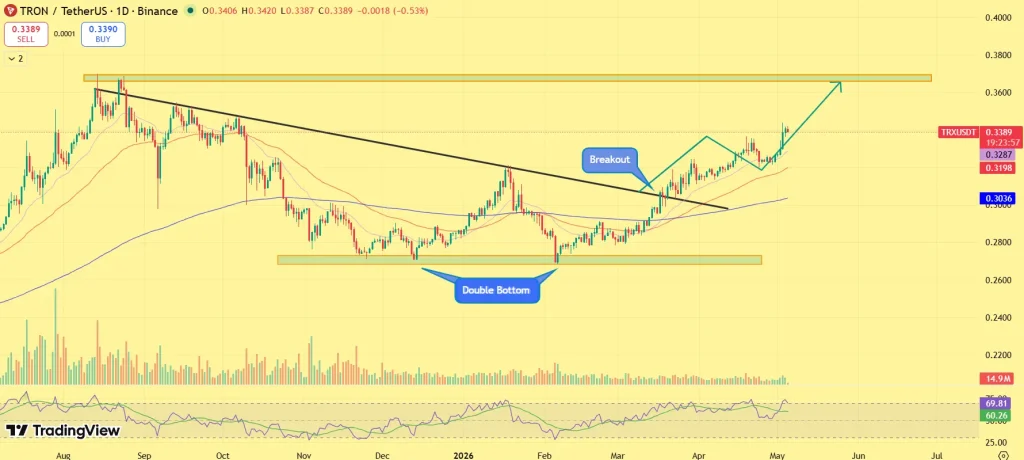
TRON is entering May holding firm near the $0.33–$0.34 region, continuing to consolidate just below key resistance after its recent upward move. The structure remains constructive, with higher lows forming and downside pressure being absorbed, signaling that buyers are still active despite repeated tests of resistance.
The focus now shifts to the $0.34–$0.36 zone, which continues to act as the immediate ceiling. TRX has tested this range multiple times, and a sustained breakout above it could mark the next leg higher. If bulls manage to push through, the path opens toward the $0.40–$0.45 range, aligning with previous reaction zones and signaling continuation of the broader uptrend. Momentum, however, will depend on whether price can maintain acceptance above resistance rather than facing another rejection.
On the downside, the structure remains stable as long as TRX holds above the $0.30–$0.31 support band. A drop below this region could lead to extended consolidation, delaying any immediate breakout. For now, TRON is holding strength near highs, with price compression just below resistance suggesting that a breakout attempt could unfold in May, provided buyers maintain control at current levels.
Coinpedia’s TRX Price Prediction 2026
TRON’s broader trajectory in 2026 is increasingly supported by a combination of sustained network activity and a price structure that continues to hold firm at higher levels. Unlike many altcoins that rely heavily on speculative cycles, TRX is being underpinned by consistent demand through stablecoin settlements, rising transaction volumes, and steady protocol revenue.
TRX price continues to consolidate near highs rather than retracing deeply, suggesting that buyers are actively defending higher levels while absorbing supply. This behavior typically precedes continuation, especially when supported by real usage rather than short-term sentiment.
The key progression now depends on how TRX expands from this base. A sustained move above the $0.35–$0.40 region would likely accelerate momentum, opening the path toward the $0.60–$0.80 range as the next phase of expansion. As higher levels begin to hold and participation increases, the structure can gradually transition into a stronger trending environment.
Under a sustained growth scenario, TRON could advance toward the $0.80–$1.20 range by the end of 2026, driven by continued network dominance, stablecoin activity, and increasing market participation.
Recent Catalysts for Tron (TRX)
TRON continues to lead in USDT transaction volume, reinforcing its role as a core settlement layer in the crypto economy.
Listing expansion and improved accessibility in regulated markets are gradually increasing institutional visibility and liquidity.
Strong on-chain revenue and rising user activity are highlighting TRON’s position as one of the few networks generating consistent real usage, not just narrative-driven demand.
TRX Long-Term Price Prediction 2026-2030
Year
Potential Low ($)
Potential Average ($
Potential High ($)
2026
0.80
1.00
1.20
2027
1.10
1.50
1.90
2028
1.80
2.30
2.80
2029
2.50
3.20
3.70
2030
3.20
3.60
4.00
TRON Coin Price Projection 2027
As per the Tron Price Prediction 2027, Tron may see a potential low price of $1.10. The potential high for Tron price in 2027 is estimated to reach $1.90.
TRON Crypto Price Forecast 2028
In 2028, the Tron price is forecasted to potentially reach a low price of $1.80 and a high price of $2.80
TRON Token Price Action 2029
Thereafter, the Tron (Tron) price for the year 2029 could range between $2.50 and $3.70.
TRON (TRX) Price Prediction 2030
Finally, in 2030, the price of Tron is predicted to maintain a steady positive. It may trade between $3.20 and $4.00.
Tron Price Prediction 2031, 2032, 2033, 2040, 2050
The long-term projection assumes Tron sustains relevance in enterprise blockchain use cases, with growth moderating over time as the asset matures.
Year
Potential Low ($)
Potential Average ($)
Potential High ($)
2031
3.50
4.30
5.20
2032
4.50
6.00
7.00
2033
9.00
11.00
15.00
2040
20.00
28.00
38.00
2050
80.00
110.00
150.00
Tron (TRX) Price Prediction: Market Analysis?
Year
2026
2027
2030
Changelly
$0.95
$1.50
$2.20
CoinCodex
$1.00
$1.80
$3.00
WalletInvestor
$1.50
$2.00
$3.50
Never Miss a Beat in the Crypto World!
Stay ahead with breaking news, expert analysis, and real-time updates on the latest trends in Bitcoin, altcoins, DeFi, NFTs, and more.
FAQs
What is the TRX price prediction for 2026?
TRX could trade between $0.80 and $1.20 in 2026 if it breaks above $0.50 and maintains strong stablecoin settlement growth.
What is the TRX Coin price prediction for 2027?
In 2027, TRX could trade between $1.10 and $1.90 if network growth continues and broader crypto market conditions remain favorable.
What is the TRX price prediction for 2028?
TRX may reach $0.94–$2.07 in 2028, with an average price of $1.50, driven by growing network usage and stablecoin dominance.
How high can TRX price go by 2030?
TRX may reach up to $4.00 by 2030 under strong ecosystem expansion, stablecoin dominance, and sustained crypto market growth.
What is the TRX price prediction for 2040?
By 2040, TRX could trade between $20 and $38 if global blockchain adoption expands and TRON remains a major settlement network.
What is the Tron price prediction for 2050?
In a strong long-term adoption scenario, Tron may range between $80 and $150 by 2050, assuming sustained utility and ecosystem growth.
Is TRX a good investment for the future?
TRX shows strong long-term potential, with projected growth through 2030, backed by real-world use in payments, stablecoins, and global adoption.
Can TRON (TRX) reach $1 in the next bull cycle?
Yes, TRX reaching $1 is possible if resistance flips to support and network activity, especially USDT transfers, keeps expanding.
DOGE price prediction for 2026 suggests potential highs of $1.25
Long term forecasts indicate DOGE could reach $3.00 by 2030.
Dogecoin continues to hold its position as one of the most widely recognized meme-driven assets in the market, supported by strong community backing, increasing integration in payment use cases, and periodic attention from high-profile endorsements. While it does not rely on deep protocol-level fundamentals like traditional Layer-1 networks, its strength lies in liquidity, accessibility, and its ability to capture retail-driven momentum during favorable market cycles.
At the same time, its 2026 price structure reflects a shift from prolonged decline toward early stabilization. After trending lower through 2025, DOGE has started forming a base near key demand zones, with price compressing within a defined range rather than continuing downward. This change in behavior suggests that selling pressure is easing, while accumulation is gradually building beneath resistance.
This sets up a familiar pattern. When Dogecoin transitions from low-volatility consolidation into expansion, the move tends to be sharp and sentiment-driven rather than gradual. The current structure indicates that the market is approaching that decision point.
In this Dogecoin price prediction 2026–2030, we will break down how this evolving structure, combined with market momentum and adoption trends, could shape DOGE’s long-term trajectory. Keep reading for more clarity.
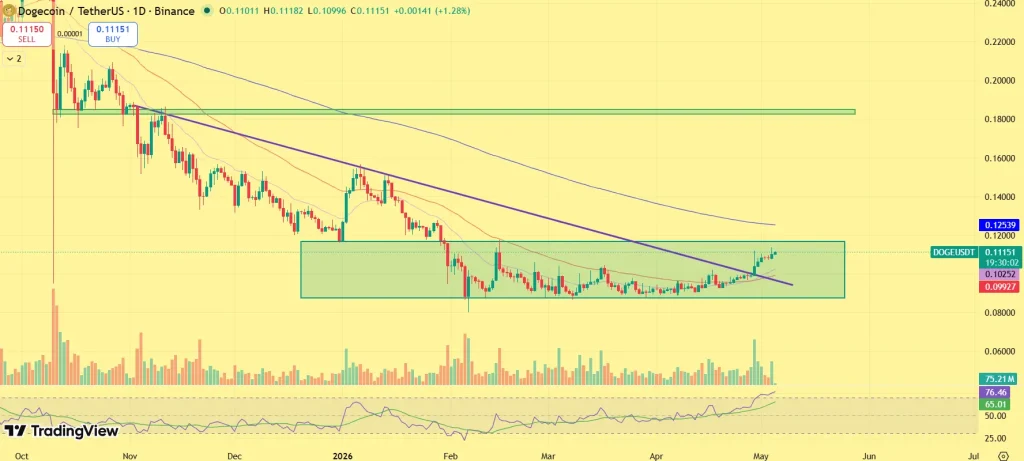
Dogecoin has kicked off May on a stronger footing, trading near $0.11–$0.112 after finally breaking out of its long-standing $0.095–$0.10 consolidation range. The move signals a shift in market behavior, with buyers stepping in more aggressively and absorbing supply that had previously capped upside.
For weeks, DOGE struggled to gain traction above resistance, but the recent push higher suggests momentum is beginning to tilt in favor of bulls. The former resistance zone around $0.105–$0.11 is now being tested as support, and holding this level will be key in determining whether the breakout can sustain.
If buyers maintain control, the next upside target sits in the $0.13–$0.15 range, where previous selling pressure has historically emerged. A clean move through this zone could accelerate gains toward $0.18, especially if broader altcoin sentiment continues to improve alongside Bitcoin’s strength.
Still, the move is not fully confirmed. A failure to hold above the breakout zone could drag DOGE back into its prior range, with $0.095 acting as the next major support. That would suggest the market needs more time before a sustained rally can unfold.
For now, Dogecoin is showing early signs of a breakout, but the focus remains on whether bulls can defend higher levels and build momentum into the rest of May.
Coinpedia’s Dogecoin (DOGE) Price Prediction 2026
Moving into the broader 2026 outlook, Dogecoin’s direction will likely be shaped by how the overall crypto cycle develops. Historically, DOGE has not required strong fundamentals to rally, it tends to respond quickly once liquidity and attention return to the market.
A move above $0.15–$0.18 would be the first sign that sentiment is shifting. From there, the next important zone lies around $0.30–$0.35, which could act as a mid-cycle barrier. If DOGE manages to maintain strength above this region, the structure begins to look more constructive, opening the door for a move toward $0.45–$0.50. Such a move would likely depend on broader market participation and renewed interest in meme-driven assets.
At the same time, if Dogecoin price struggles to hold above $0.08, the recovery timeline could extend, keeping DOGE in a longer consolidation phase. Overall, 2026 may not be about explosive moves initially, but rather about gradual rebuilding, with upside accelerating only if market conditions align.
Recent News/Catalysts for Dogecoin (DOGE)
Retail-driven momentum building again: Social sentiment around meme coins is picking up into May, with Dogecoin seeing renewed retail attention after months of muted activity, often an early signal before volatility expansion.
Whale accumulation near base: Large wallet activity has been gradually increasing around the $0.09–$0.10 zone, indicating accumulation rather than distribution, reinforcing the current support structure.
Altcoin rotation narrative strengthening: As Bitcoin stabilizes near higher levels, capital rotation toward high-beta assets like DOGE is starting to re-emerge, positioning it as a potential beneficiary if momentum expands in May.
Dogecoin Price Prediction 2026 – 2030
Year
Potential Low ($)
Potential Average ($)
Potential High ($)
2026
0.75
1.00
1.25
2027
1.15
1.35
1.50
2028
1.25
1.75
2.00
2029
1.50
2.15
2.65
2030
2.50
2.75
3.00
This table, based on historical movements, shows DOGE price to reach $3 by 2030 based on compounding market cap each year. This table provides a framework for understanding the potential DOGE price movements. Yet, the actual price will depend on a combination of market dynamics, investor behavior, and external factors influencing the cryptocurrency landscape.
Dogecoin (DOGE) Price Prediction 2026
As per Dogecoin’s Price forecast for 2026, the high price could be $1.25, the low may reach $0.75. This makes the average around $1.00.
Dogecoin Price Prediction 2027
Moving to 2027, the DOGE Price projects that it might hit a high price of $1.50 potentially. With a $1.15 low and an average of $1.35
DOGE Coin Price Prediction 2028
Moving to 2028, the Dogecoin Price Forecast predicts a high price of $2.00. On the flip side, the low may fall to $1.25, and the average is projected to be around $1.75.
DOGE Price Prediction 2029
As per Dogecoin Price Forecast 2029, DOGE’s high price is predicted to be $2.65, with a low of $1.50 and an average of $2.15.
Dogecoin (DOGE) Price Prediction 2030
Finally, as per the Dogecoin Price Forecast 2030, DOGE’s price can reach a high price of $3.00. With a low of $2.50 and an average of $2.75.
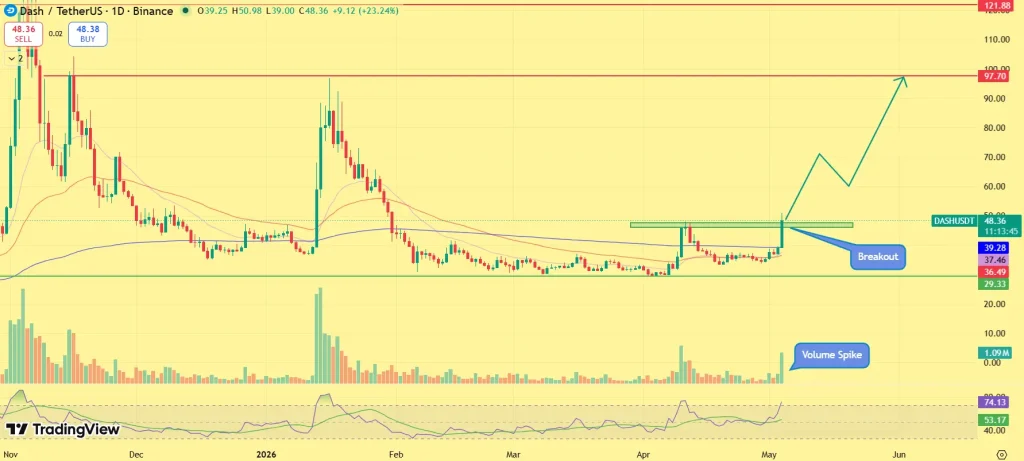
Dash has suddenly re-entered the spotlight with a sharp double-digit rally, catching traders off guard after weeks of quiet price action. The move has pushed price toward the $50 zone, accompanied by a rapid surge in market participation across trading venues. Key resistance levels have been cleared in a single move, signaling a shift in short-term structure. Such rapid expansions rarely occur without a deeper trigger forming beneath the surface. Here are the key details driving today’s Dash price surge.
What’s Fueling Dash Price Rally?
Dash’s rally is being driven by a combination of fundamental repricing and strong market participation. The Evolution upgrade has expanded Dash’s utility into smart contracts and cross-chain functionality, prompting the market to reassess its valuation. Assets typically see renewed demand when their use case broadens, and Dash is now transitioning from a niche payments narrative into a wider ecosystem play.
At the same time, the setup was technically primed. DASH spent weeks consolidating between $30 and $38, forming a strong accumulation base. The breakout from this range reflects a shift where demand has absorbed supply, triggering a fresh expansion phase. The speed of the move suggests capital rotation into an asset that had remained relatively underpriced during the broader market recovery.
Dash has delivered a clean and decisive breakout. DASH price has surged toward the $48–$50 resistance zone, a level that had previously rejected multiple upside attempts. This breakout is backed by a strong bullish candle and a visible spike in volume, confirming genuine buying pressure.
The move also aligns with a broader structural transition. After months of sideways action, Dash has shifted from a range-bound market into a trend expansion phase, where higher price discovery toward $70 becomes more likely. The reclaim of key moving averages further strengthens the bullish bias, while momentum indicators show expansion, not exhaustion. As long as price holds above the $45 support zone, the breakout remains valid, and dips are likely to be viewed as continuation opportunities rather than reversals.
Derivatives Data Signals Fresh Long Positioning
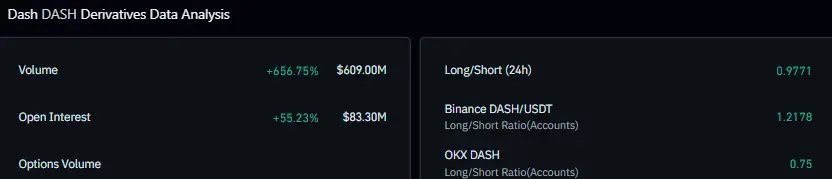
The derivatives market reinforces the strength of this move. Over the last 24 hours, futures volume has surged to around $609 million, while open interest has jumped over 55% to $83 million. This combination is critical. Rising price alongside rising open interest typically signals new capital entering the market, rather than short covering. It reflects traders actively building long exposure in anticipation of further upside.
Positioning data also shows a long bias among top traders, while funding rates remain relatively stable. This indicates that leverage is building in a controlled manner, reducing the risk of an immediate squeeze-driven pullback and supporting the case for continuation.
Will Dash Price Hit $70 in May 2026?
Dash now enters a critical continuation phase. Holding above the $45–$48 breakout zone keeps the structure intact and opens the path toward $55–$60 in the near term. A sustained move beyond this range could bring $70 into focus, aligning with higher timeframe resistance and representing a natural extension of the breakout. However, losing the breakout zone could trigger a pullback toward $38–$40. For now, with volume expansion and rising open interest supporting the move, the bias remains toward upside continuation.
Ethereum’s price action may look stable on the surface, but underneath, a powerful accumulation phase is unfolding. Over $300 million worth of ETH has been absorbed by whales in recent days, while staking queues continue to expand, tightening circulating supply at a rapid pace. Despite this, price remains compressed below a critical resistance zone, suggesting that buyers are building positions rather than chasing breakouts.
Historically, such conditions precede sharp directional moves. With ETH now pressing against a key technical ceiling, the market is watching closely, because a breakout here could quickly shift the narrative toward a $3,000 retest.
Whales Absorb $322M ETH as Smart Money Builds Positions
Ethereum’s on-chain data is sending a clear signal: large players are accumulating aggressively during consolidation. Whale wallets have added over 140,000 ETH (~$322 million) within a short time frame, coinciding with ETH holding firm above the $2,300 level after a brief dip toward $2,260.
ETH WHALES BUY $322M AS PRICE HOLDS $2,300
Onchain data shows $ETH whales accumulated roughly $322M worth of $ETH in the past 48 hours, with price holding firmly above the $2,300 zone after dipping to $2,260 mid-week.
The absence of a sharp price spike despite heavy inflows indicates controlled accumulation, where supply is being steadily absorbed without alerting the broader market. Additional flow data shows that spot order sizes are increasingly dominated by large participants, reinforcing the idea that institutions and high-net-worth players are positioning early.
Historically, such accumulation phases tend to precede volatility expansion, especially when they occur near key technical inflection zones.
Staking Demand Surges, Triggering a Structural Supply Squeeze
Beyond whale activity, Ethereum’s supply dynamics are tightening significantly. Current data shows ~3.48 million ETH queued for staking versus just ~441,000 ETH queued for exit, creating an 8:1 imbalance favoring supply lock-up.
ETH STAKING ENTRIES OUTPACE EXITS BY 8X
There is now some 3,484,960 $ETH waiting to be staked on the @Ethereum network, compared with only 441,450 waiting to be unstaked.
The 3,484,960 figure equates to roughly $8 billion worth of demand, based on current prices.
As more ETH moves into staking contracts, liquid supply across exchanges declines, reducing the available inventory for selling pressure. At the same time, OTC absorption and long-term holder positioning are reinforcing this trend. The result is a market environment where supply is quietly shrinking while demand builds in the background. This kind of imbalance often leads to sharp repricing once resistance levels are cleared, as there is less available supply to cap upside moves.
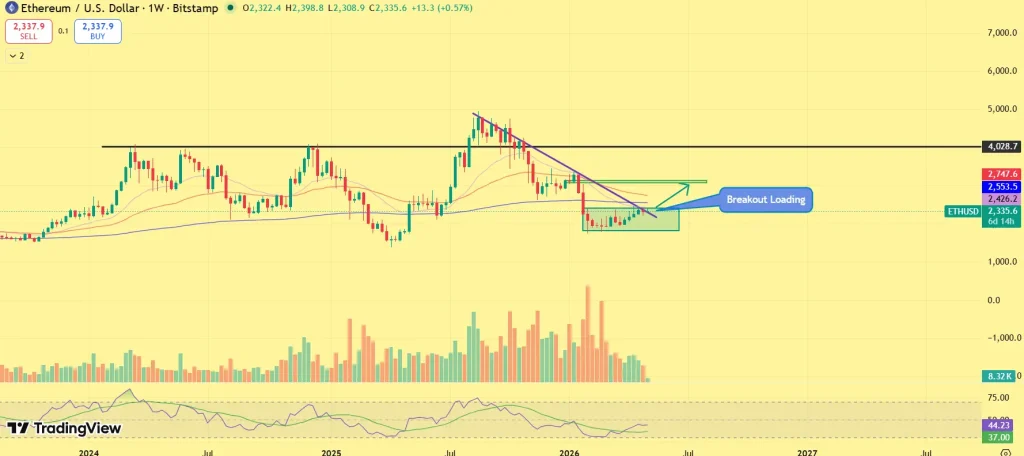
Ethereum price is trading within a well-defined accumulation range between $2,250 and $2,600, following its earlier corrective phase. Price structure within this range has shifted, higher lows are forming, indicating that buyers are gradually gaining control. The key resistance zone lies between $2,600 and $2,750, aligning with a previous breakdown region and higher-timeframe supply. ETH has tested this area multiple times, but recent price action shows tightening consolidation rather than sharp rejection, suggesting that sellers are being absorbed.
This compression beneath resistance is critical. It reflects reduced selling pressure and increasing bullish pressure, often seen before breakout moves. A confirmed daily close above $2,750 would validate a structural breakout, opening the path toward $3,000 as the next psychological and liquidity target. Beyond that, the next resistance cluster sits around $3,300–$3,400, where prior distribution occurred. On the downside, failure to break higher could trigger a pullback toward the $2,200–$2,300 demand zone, which has consistently acted as a strong support base. As long as this zone holds, the broader bullish structure remains intact.
Can Ethereum (ETH) Reach $3K?
Ethereum is approaching a decision point where structure, on-chain data, and supply dynamics are aligning. Whale accumulation, staking-driven supply reduction, and price compression collectively suggest that the market is in the late stages of accumulation. The key trigger now lies at the $2,750–$2,800 breakout zone. A sustained move above this level could accelerate momentum and push ETH toward the $3,000 mark in the near term, especially if broader market sentiment remains supportive.
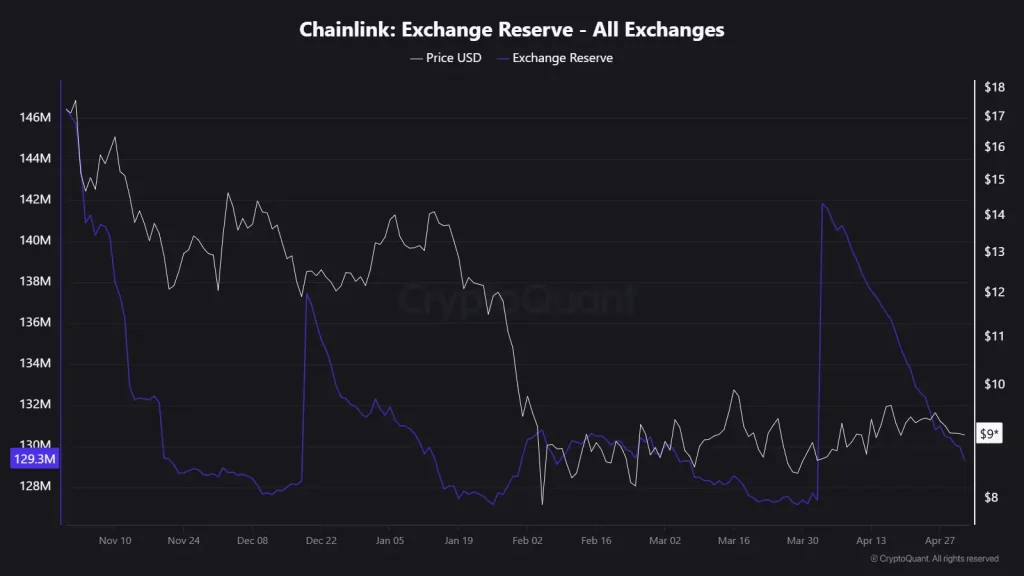
Chainlink (LINK) is flashing early accumulation signals beneath the surface as on-chain metrics begin to turn positive. Despite muted price action, whales are actively accumulating and exchange reserves are declining, pointing to a gradual reduction in sell-side pressure. Netflows have also shifted negative, indicating that more LINK is being withdrawn than deposited, often a sign of long-term positioning.
At the same time, Chainlink price continues to hold near a key demand zone, suggesting that buyers are stepping in to defend lower levels. With structure stabilizing and on-chain activity strengthening, the setup is becoming increasingly constructive: Is LINK positioning for its next breakout?
LINK On-Chain Data Signals Early Accumulation Phase
Chainlink’s on-chain data is beginning to reflect a meaningful shift in market behaviour. Exchange reserves have edged lower to approximately 129.3 million LINK, indicating fewer tokens available for immediate selling. More importantly, netflows have turned negative, with roughly 345K LINK moving off exchanges, a pattern commonly associated with accumulation phases. Investors typically withdraw assets to private wallets when anticipating higher prices, reducing circulating supply.
Network activity is also showing steady improvement, with active addresses rising modestly. This signals consistent participation rather than speculative spikes, reinforcing a healthier demand structure. Together, these metrics point toward a supply absorption phase, where selling pressure weakens while demand gradually strengthens beneath the surface.
Whale Accumulation Signals Long-Term Positioning
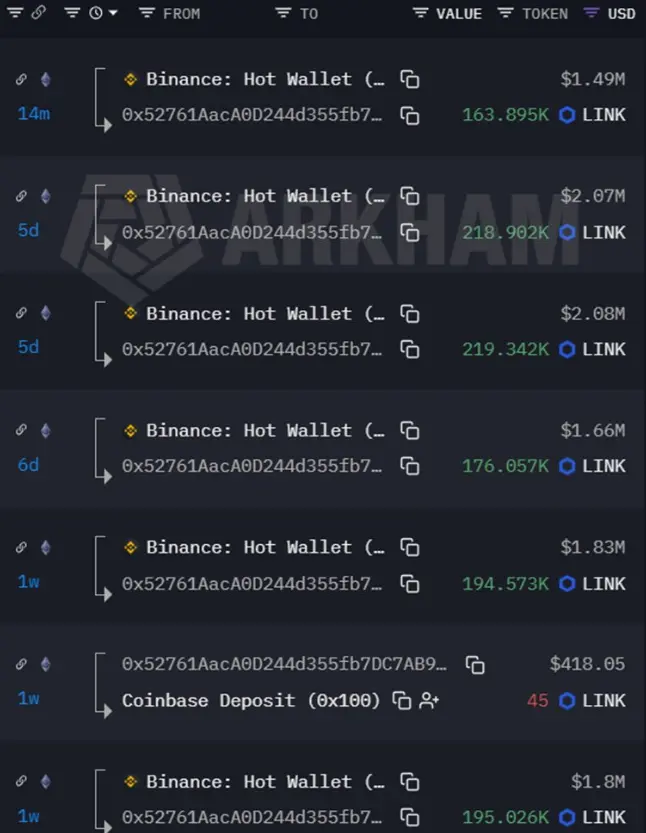
Large holders are reinforcing this trend. A notable wallet holding over $10 million in LINK has continued to withdraw tokens from exchanges, including recent movements exceeding $1.4M, with cumulative outflows surpassing $11M.
Importantly, these assets are being held rather than actively traded, indicating a long-term positioning strategy. Such behavior is often seen during accumulation phases, where smart money builds exposure ahead of broader market participation. This divergence, strong accumulation alongside muted price action, suggests that LINK may be undervalued relative to underlying demand, setting the stage for a potential revaluation.
LINK Price Outlook: $12 Emerges as Breakout Level
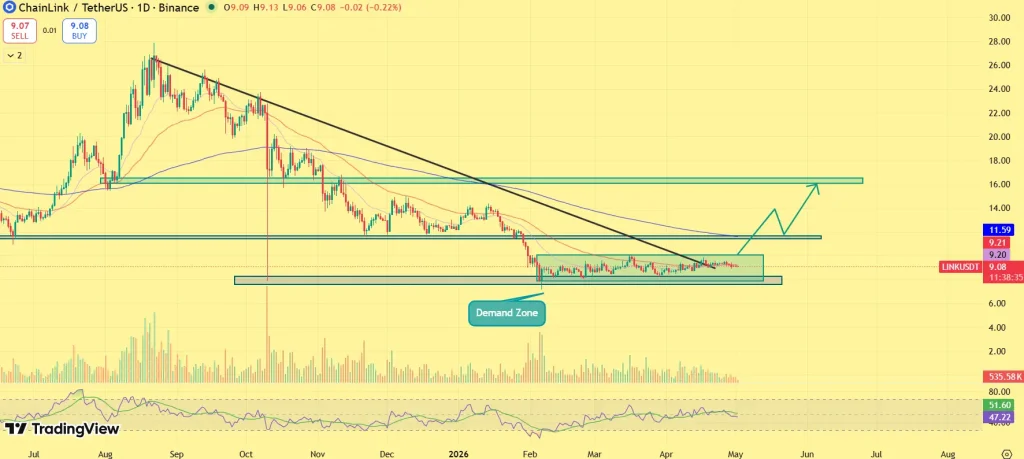
Chainlink is currently trading within a defined range between $8 and $12, with price holding firmly above the $8–$9 demand zone, which has consistently acted as support. The structure shows higher lows forming, indicating that buyers are stepping in earlier during pullbacks. At the same time, LINK remains compressed below resistance, reflecting a tightening price range.
The key breakout level sits near $11.5–$12, where horizontal resistance aligns with trendline pressure. A sustained move above this zone could trigger momentum toward $14, followed by a broader supply region near $16–$18. As long as LINK holds above its demand zone, the structure remains constructive. The current phase can be viewed as pre-breakout consolidation, where pressure builds ahead of a directional move.
Outlook: What’s Next for LINK?
Chainlink now sits at a decisive juncture, where improving on-chain metrics and stabilizing price structure are beginning to align. With supply tightening and buyers defending the $8–$9 zone, the market appears to be building a base rather than weakening.
The next move hinges on $12, a confirmed breakout could unlock momentum toward higher levels, while failure may keep LINK range-bound. For now, accumulation signals remain strong, suggesting the next directional move is likely approaching rather than fading.