Reading view

Binance Coin (BNB) Price Prediction 2026, 2027 – 2030: Will BNB Price Hit $2000?

Binance Coin (BNB) Price Prediction

The post Binance Coin (BNB) Price Prediction 2026, 2027 – 2030: Will BNB Price Hit $2000? appeared first on Coinpedia Fintech News

Story Highlights

  • Binance Coin Price Today is  $ 654.01846591.
  • Expanding exchange-ecosystem demand could lift BNB price toward $2000 by the end of this year.
  • Long-term network usage growth may extend BNB price toward $10,000.

Binance Coin (BNB) suggests a fundamental shift in how the asset responds to broader market dynamics. In 2026, the token’s performance increasingly reflects on-chain utility and ecosystem liquidity rather than mere speculative volatility. This transition from reactive price swings to a more structured price action indicates a maturing market environment.

As the ecosystem stabilizes, the technical narrative centers on long-term accumulation and the absorption of supply within established demand zones. Sustained network activity across the Binance Smart Chain provides a foundational backdrop for this consolidation, potentially setting the stage for a period of extended price discovery. By focusing on fundamental network health and institutional integration, the outlook for the next several years leans toward organic growth and structural resilience within the global digital asset landscape.

So, what’s next for the BNB price in the rest of 2026 and beyond? What can be the future price movements? Let’s get into the Binance Coin (BNB) Price Prediction 2026–2030.

BNB Price Today

Cryptocurrency BNB
Token BNB
Price $654.0185 up 0.58%
Market Cap$ 88,152,295,596.90
24h Volume$ 1,635,216,855.6075
Circulating Supply134,785,637.09
Total Supply134,785,637.09
All-Time High$ 1,370.5460 on 13 October 2025
All-Time Low$ 0.0961 on 01 August 2017

Binance Coin (BNB) Price Prediction May 2026

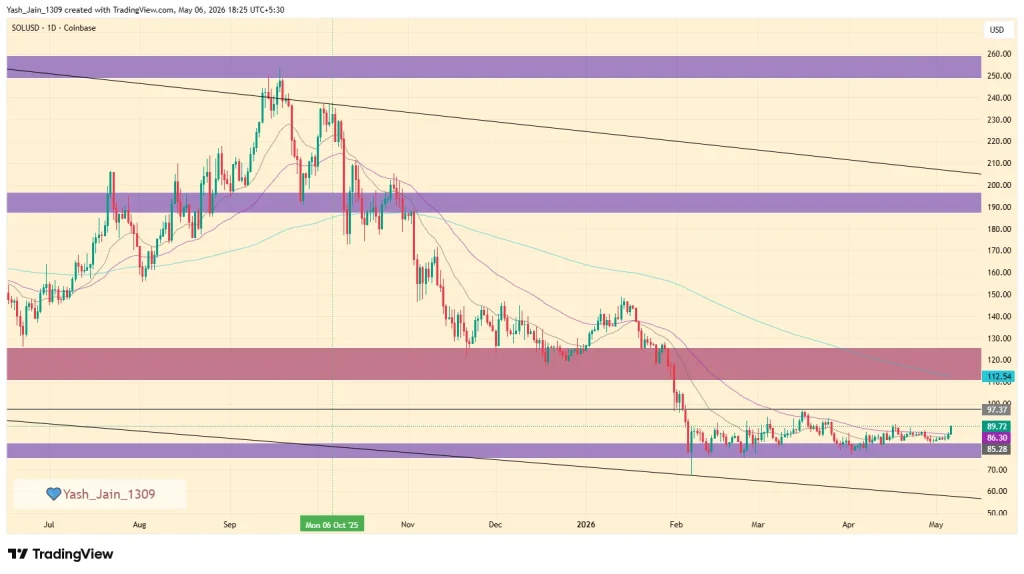
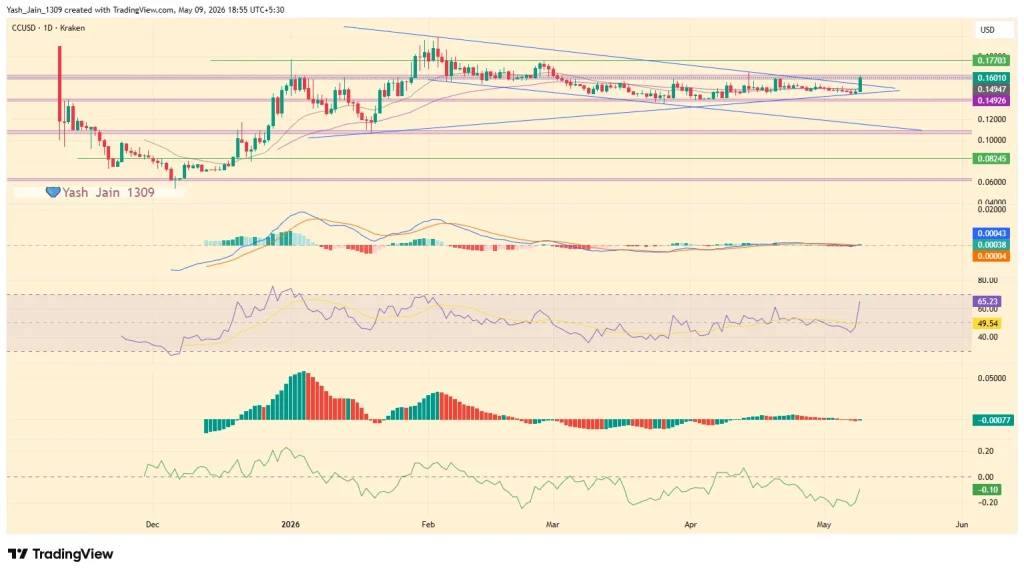
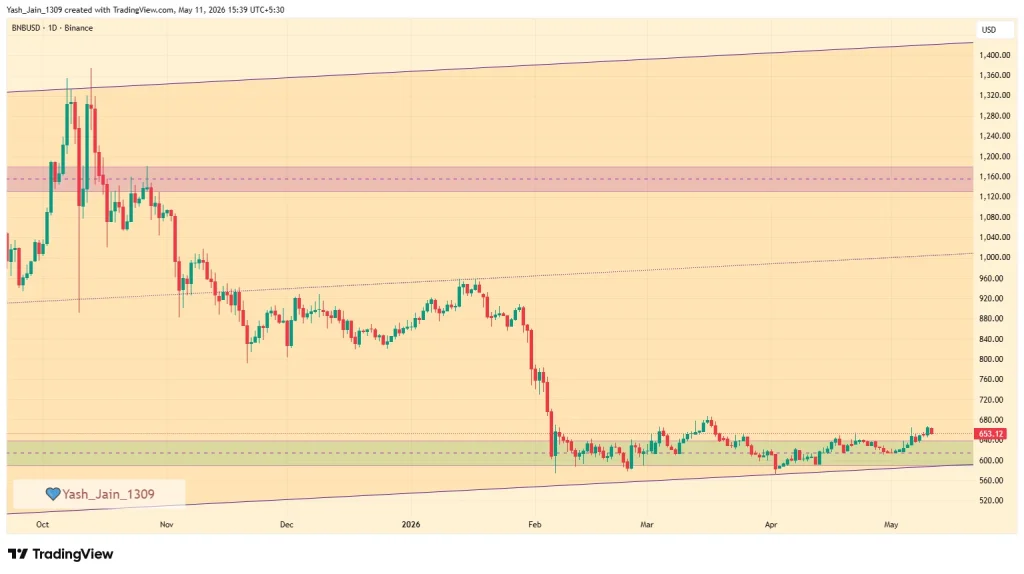
Looking from the third quarter of 2025, we observed an impressive rally, with prices soaring 125% from the $600 support level to an exhilarating $1,375. However, by the fourth quarter of 2025 and into the first quarter of 2026, the BNB price retreated back to the $600 demand zone, erasing those remarkable gains.

Since February, there has been a steady accumulation around this critical $600 level, a trend that has continued into March. Therefore, Q1 was challenging. However, as Q2 began, April showed signs of consolidation, which implies that this level has solidified as a robust support point. This suggests that bullish momentum could potentially resume in May. Early May has also begun to indicate this, especially as it aims to approach the 200-day EMA currently present at $726.

Despite the prevailing market challenges, the BNB price has demonstrated remarkable resilience, remaining above $600 for most of April. If bullish pressure increases in May, we may see a potential retest of $850. However, the 200-day EMA remains a crucial area for this to happen; otherwise, further consolidation may continue throughout the month.

vBinance Coin (BNB) Price Prediction May 2026

Recent News/ Opinions

  • On April 1, 2026, Binance Earn launched new Yield Arena offers, providing limited-time opportunities to earn up to 35% APR. This weekly update spans across multiple products, including Simple Earn, ETH and SOL Staking, and Dual Investment.
  • On March 27, 2026, binance shared that equity and commodity perpetual futures on Binance surpassed $150 billion in cumulative trading volume. This milestone was supported by an immense processing of over 110 billion trades in one quarter, highlighting the growing crossover between traditional finance and digital markets.
  • A recent ruling news on March 7th came from the US federal court that it has positively dismissed all anti-terrorism claims against Binance, alleviating a significant legal burden. In the Southern District of New York, a judge concluded that the plaintiffs, comprising 535 individuals citing 64 attacks from 2017 to 2024, did not establish sufficient evidence to demonstrate that Binance had assisted or conspired with terrorist organizations. This decision marks a commendable step forward for Binance, affirming its commitment to compliance and integrity.

Binance Coin (BNB) Price Prediction 2026

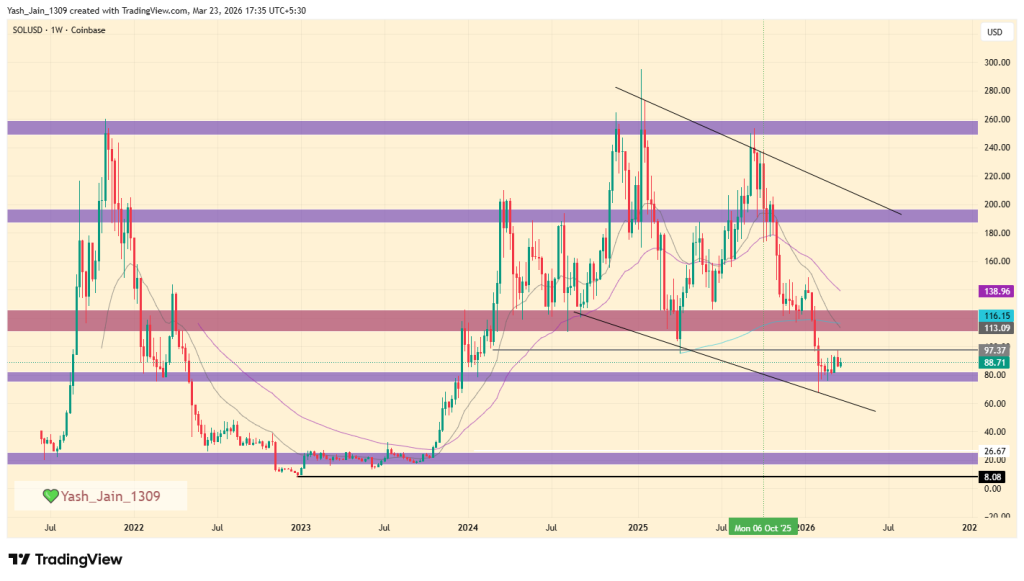
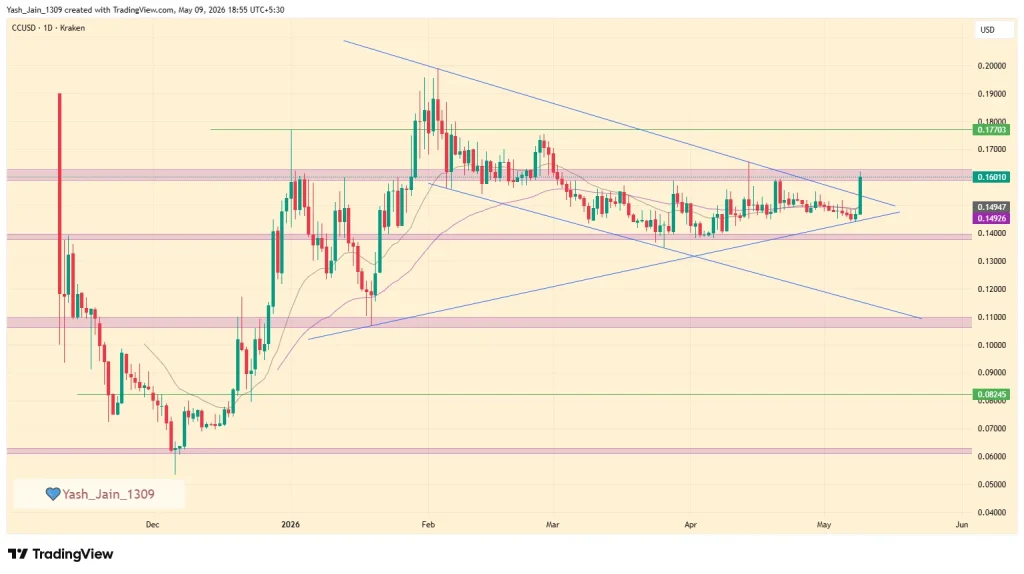
Based on the technical structure of the BNB/USD weekly chart, the price action reflects a long-term ascending channel (or wedge) that has defined the asset’s trajectory since the massive demand surge from the $40 level in early 2021. This multi-year uptrend culminated in a new all-time high of approximately $1,375 in late 2025, validating the token’s utility and its position within the Binance ecosystem. Currently, the market is witnessing a convergence of horizontal price levels with channel’s dynamic trendline support, which reinforces the technical significance of the current price zone.

As of Q1 2026, BNB price is testing a critical turning support zone around the $600 horizontal support, which aligns precisely with the lower boundary of the primary ascending channel. This area is currently serving as a consolidation floor, suggesting a period of institutional accumulation. Historical precedent highlights the importance of this trendline; a similar touchpoint in late 2023 at the $200 range served as the launchpad for a massive rally, though it took roughly 238 days to reach the channel’s median line.

Binance Coin (BNB) Price Prediction 2026

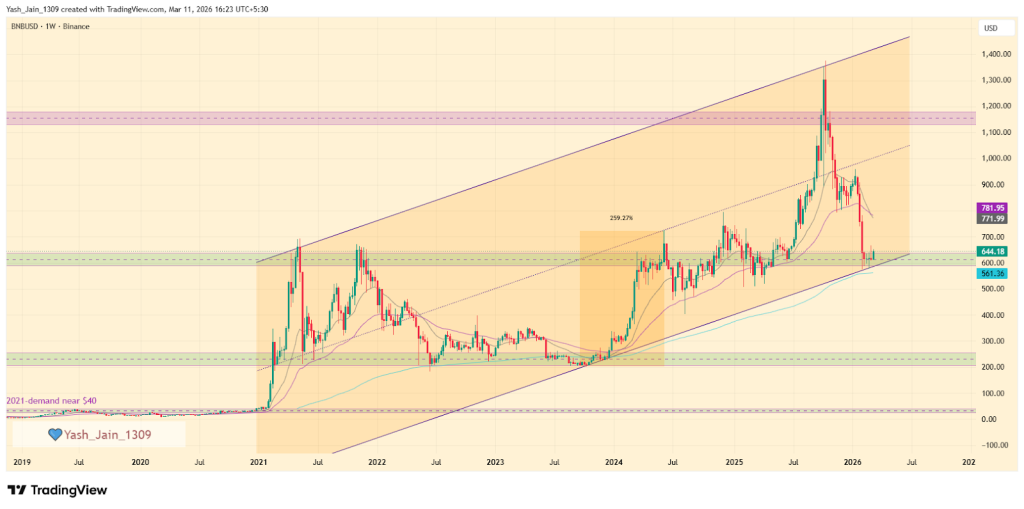
Looking ahead through 2026, the primary bullish thesis anticipates a recovery toward the $1,000 psychological level. If the recovery pace mirrors previous cycles, BNB/USD could reach the channel’s middle band by Q3 2026. However, if consolidation extends further into the year, the recovery might be more gradual, stretching toward the year-end. 

Conversely, a decisive break below the $600 footing would invalidate the current setup, significantly increasing the probability of a deeper correction toward the major $200 demand zone.

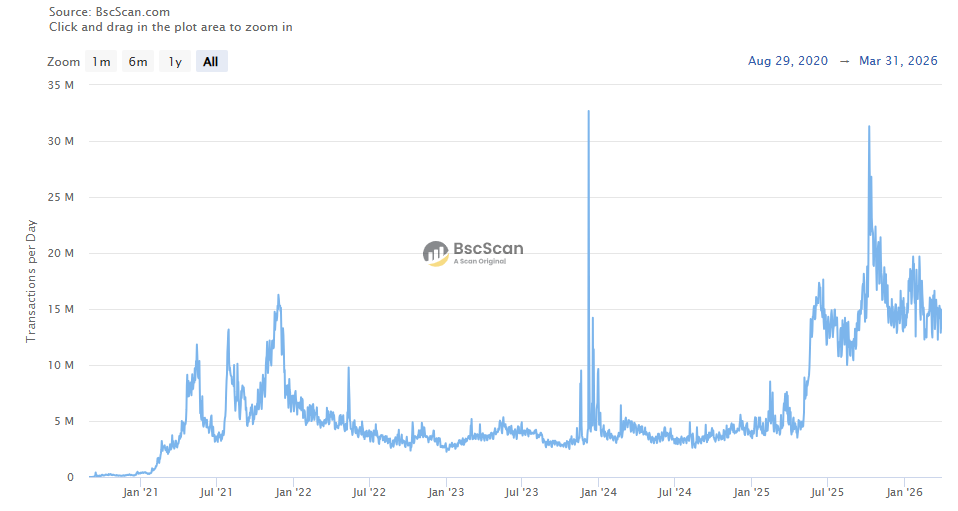
BNB On-Chain Analysis

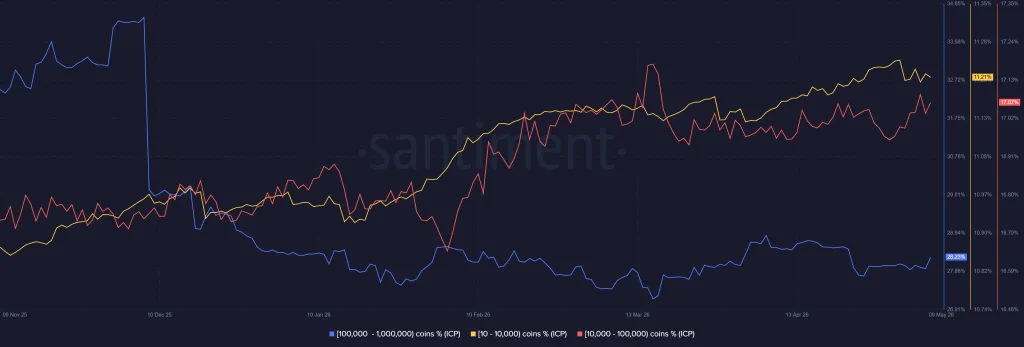
Recent on-chain data highlights the network’s resilience, with daily transactions stabilizing at 15 million in Q1 2026 despite market fluctuations. This sustained utility, paired with total unique addresses nearing the 800 million mark, signals a consistent rise in global adoption. These fundamental metrics suggest a robust foundation for long-term ecosystem growth and structural asset valuation.

BscScan

Binance Coin Crypto Price Prediction 2027 – 2030

YearPotential Low ($)Potential Average ($Potential High ($)
2027120014201800
2028160019502300
2029210032503900
2030250038004500

Binance Coin Price Prediction 2027

As per the Binance Coin Price Prediction 2027, Binance Coin may see a potential low price of $1200. The potential high for Binance Coin price in 2027 is estimated to reach $1800.

BNB Price Prediction 2028

In 2028, Binance Coin price is forecasted to potentially reach a low price of $1600 and a high price of $2300.

Binance Coin Price Forecast 2029

Thereafter, the Binance Coin  (Binance Coin) price for the year 2029 could range between $2100 and $3900.

Binance (BNB) Coin Price Prediction 2030

Finally, in 2030, the price of Binance Coin is predicted to remain steadily positive. It may trade between $2500 and $4500.

Binance Coin Price Prediction 2031, 2032, 2033, 2040, 2050

The long-term projection assumes Binance Coin sustains relevance in enterprise blockchain use cases, with growth moderating over time as the asset matures.

YearPotential Low ($)Potential Average ($)Potential High ($)
20316000980012000
203280001030015000
2033109001240018000
2040132002580038800
2050220003500050000

Binance Coin (BNB) Price Prediction: Market Analysis?

Year202620272030
Changelly$1600.00$2200$5200
CoinCodex$1800.00$2900$6400
WalletInvestor$2260.00$2500$5550
Never Miss a Beat in the Crypto World!

Stay ahead with breaking news, expert analysis, and real-time updates on the latest trends in Bitcoin, altcoins, DeFi, NFTs, and more.

FAQs

What is the BNB price prediction for 2026?

BNB could recover toward $1,000 in 2026 if the $600 support holds and Binance ecosystem demand grows, supported by rising network usage and liquidity.

What will be the BNB price in 2030?

BNB could trade between $2,500 and $4,500 by 2030 if blockchain adoption grows and the Binance ecosystem maintains strong network activity.

How high can BNB price go by 2040?

Long-term projections suggest BNB could reach $13,000–$38,000 by 2040 if the network expands globally and maintains strong adoption across DeFi and Web3.

What factors influence Binance Coin’s price?

Price depends on exchange network usage, liquidity, adoption trends, historical support/resistance zones, and institutional participation.

Is Binance Coin (BNB) a good long-term investment?

BNB is often viewed as a strong long-term asset due to exchange utility, token burns, and ecosystem growth, though crypto investments always carry risk.

Solana (SOL) Price Prediction 2026, 2027-2030: Technical Outlook and Long-Term Forecast

sol webp

The post Solana (SOL) Price Prediction 2026, 2027-2030: Technical Outlook and Long-Term Forecast appeared first on Coinpedia Fintech News

Story Highlights

  • Solana Price Today is  $ 95.49550043.
  • SOL stabilized bullish momentum may assist in reclaiming $200 by 2026.
  • Solana (SOL) could open a path toward $1,400 by 2030.

Solana is a high-performance blockchain platform designed to host decentralized applications and power global internet capital markets. It distinguishes itself through a unique architecture that combines Proof of Stake with a “Proof of History” mechanism, allowing the network to process thousands of transactions per second with near-instant finality and minimal fees. This scalability makes it a preferred choice for developers building everything from decentralized finance (DeFi) protocols to massive consumer applications and stablecoin payment systems.

The native SOL token is the lifeblood of this ecosystem, used to pay for transaction fees, deploy smart contracts, and secure the network through staking. As adoption grows among major financial institutions, many enthusiasts are left wondering about the future value of the asset. 

Questions regarding whether SOL price can realistically reach $1,000, or how it will maintain stability in longterm, remain central to the community’s curiosity. In this deep dive, we explore these burning questions and more.

Solana Price Today

Cryptocurrency Solana
Token SOL
Price $95.4955 up 1.83%
Market Cap$ 55,174,284,043.58
24h Volume$ 5,323,921,047.9111
Circulating Supply577,768,416.2418
Total Supply626,093,998.6682
All-Time High$ 294.3349 on 19 January 2025
All-Time Low$ 0.5052 on 11 May 2020

Solana (SOL) Price Prediction May 2026

Solana (SOL) Price Prediction May 2026

The SOL price action throughout Q1 2026 has been characterized by significant pressure, a trend that has unfortunately bled into even Q2. Despite this “tough situation,” the asset is currently maintaining a steady consolidation within a defined horizontal range. 

While this sideways movement could signal a period of accumulation, a definitive market bottom remains unconfirmed. The lack of a clear liquidity grab suggests that the current resilience might be a precursor to a final flush.

Technically, a breakdown below the $80 support level could trigger a sharper decline toward the $60 mark. Conversely, if May ithas retested $97 if SOL can manage a breakout above $97 then its likely requiring a tailwind from broader market improvements then the price could see a recovery toward the $110–$120 resistance zone in May. For now, the market remains in a state of high-stakes equilibrium, waiting for a decisive breach of these key levels.

Recent News & Opinions

  • Announced on April 14, 2026, AlphaFC has officially renamed Alfreton Town FC’s home to “Solana Stadium”, establishing it as a blockchain-powered hub for fan-driven ownership in English football. The initiative coincides with an upcoming token sale on April 21, leveraging a partnership with Phantom, Raydium, and Bonk to launch the first professional English club ownership token on the Solana network.
  • On April 1, 2026, Symbiosis launched full support for Solana, enabling any-to-any token swaps with on-chain routing powered by Raydium. This integration allows users to move assets from any source chain to native Solana tokens in a single transaction.
  • Also on April 1, 2026, Interactive Brokers expanded its offerings by launching Solana trading for eligible European investors. Through this single integrated platform, SOL is now traded alongside traditional stocks, options, and bonds via a partnership with Zero Hash.

Solana (SOL) Price Prediction 2026

The weekly chart for Solana price (SOL) reveals a historical pattern of significant price surges followed by prolonged corrective phases. After a major spike in late 2021, the asset entered a multi-month downtrend that eventually found a bottom near the $8 mark. 

A similar narrative played out in early 2025 as the price surged toward new highs, only to enter the current broader downtrend. This recent decline has been characterized by a falling wedge pattern, where the price action has consistently respected the converging trendlines, signaling a period of heavy consolidation.

Throughout early 2026, this downward trajectory extended until it tested the lower boundary of the wedge in January. However, a short-term recovery has since materialized, successfully reclaiming the $80 support level. 

For a sustained bullish reversal, the price must first overcome the immediate resistance at $97, which would open the door for a move toward $116. If these levels are flipped into support, the next primary target lies within the $180 to $200 range, aligning with the upper border of the falling wedge.

Solana (SOL) Price Prediction 2026

Solana’s Onchain Analysis

Solana’s on-chain data confirms a remarkably resilient ecosystem. Despite a dip in late 2025, the network maintained a steady success rate above 80%.

By Q1 2026, Solana demonstrated its strength as TPS climbed back above 3,000. This recovery, paired with high success rates, highlights a robust infrastructure capable of sustaining high-speed performance even under pressure.

Moreover, The Solana ecosystem continues to see intense activity, with protocol rankings over the last 30 days highlighting the dominant fee-generating platforms. Leading the charge is Pump.fun, which recorded a staggering $70 million in fees, underscoring its massive role in the current market cycle.

This surge in fee generation is followed closely by Jupiter and Meteora, both of which remain cornerstone protocols for liquidity and trading on the network. Together, these three platforms represent the primary engines of on-chain value capture within the Solana ecosystem.

Additionally, Solana’s role as a primary hub for liquidity is further evidenced by its growing share of the stablecoin market. Tether (USDT) on the network currently accounts for 1.59% of the total $184.192 billion circulating supply.

This upward trend marks a significant expansion from the 1.15% dominance recorded in January 2026. For a Layer 1 platform, this increasing stablecoin concentration is a vital health indicator, signaling deepening liquidity and a more robust foundation for decentralized finance activities.

Solana ETF Analysis

By the end of Q1 2026, the U.S. spot Solana ETF market has around eight sponsoring firms, with the Bitwise BSOL product on the NYSE emerging as the largest holder. These ETFs are distributed across major exchanges, including some on the NYSE, NASDAQ, and CBOE. Currently, these sponsors hold a combined $812.25 million in net assets, representing approximately 1.68% of Solana’s total market capitalization.

While cumulative net inflows since listing have reached a significant $974.68 million. The last major inflow was recorded on April 10th, amounting to $11.5 million after a series of outflows.

Solana Crypto Price Prediction 2027 – 2030

YearPotential Low ($)Potential Average ($Potential High ($)
2027180320600
2028300420720
20295007501000
203088012001400

Solana Price Prediction 2027

As per the Solana Price Prediction 2027, Solana may see a potential low price of $180. The potential high for Solana price in 2027 is estimated to reach $600.

Solana Price Forecast 2028

In 2028, Solana price is forecasted to potentially reach a low price of $300 and a high price of $720.

SOL Price Prediction 2029

Thereafter, the Solana  (Solana) price for the year 2029 could range between $500 and $1000.

Solana (SOL) Price Prediction 2030

Finally, in 2030, the price of Solana  is predicted to maintain a steady positive. It may trade between $880 and $1400.

Solana Price Prediction 2031, 2032, 2033, 2040, 2050

The long-term projection assumes Solana sustains relevance in enterprise blockchain use cases, with growth moderating over time as the asset matures.

YearPotential Low ($)Potential Average ($)Potential High ($)
2031120015001800
2032160020002300
2033190024003000
2040320048005000
20505500750010000

Solana (SOL) Price Prediction: Market Analysis?

Year202620272030
Changelly$220.00$350$500
CoinCodex$350.00$400$600
WalletInvestor$300.00$450$550
Never Miss a Beat in the Crypto World!

Stay ahead with breaking news, expert analysis, and real-time updates on the latest trends in Bitcoin, altcoins, DeFi, NFTs, and more.

FAQs

What is the Solana price prediction for 2026?

SOL could trade between $75 and $200 in 2026, depending on adoption, market trends, and broader crypto infrastructure growth.

How much will 1 Solana be worth in 2030?

By 2030, SOL could trade between $880 and $1,400, with an average around $1,170 if adoption and market growth continue.

How much will Solana cost in 2040?

Solana may reach $2,000–$4,800 by 2040, depending on blockchain adoption, network upgrades, and macroeconomic factors.

How much will Solana be in 2050?

By 2050, SOL could range from $5,500 to $10,000 if long-term enterprise use and Web3 adoption remain strong.

What factors influence Solana’s future price?

SOL price is shaped by blockchain adoption, DeFi activity, network upgrades, investor confidence, and overall crypto market trends.

GTAO Gains Ground: Grayscale Reopens Private Placements as Bittensor Hits Solana

Top 10 Bittensor Subnets to Watch as TAO Surges 90%

The post GTAO Gains Ground: Grayscale Reopens Private Placements as Bittensor Hits Solana appeared first on Coinpedia Fintech News

Wall Street’s appetite for AI-linked crypto products clearly isn’t cooling off yet. Grayscale just announced that its Grayscale Bittensor Trust, trading under the GTAO ticker, is now open for private placement to eligible accredited investors. And honestly, the timing isn’t random. The Bittensor ecosystem suddenly got a lot louder this week.

Bittensor Expansion Pushes GTAO Back Higher

Canonical TAO officially went live on Solana through Wormhole’s Sunrise integration, opening native trading support on Jupiter Exchange and Meteora while also landing wallet support from Phantom and Solflare.

That’s a pretty massive surface-area expansion for a token that spent months quietly grinding upward since February.

GTAO Gains Ground: Grayscale Reopens Private Placements as Bittensor Hits Solana

Meanwhile, GTAO’s numbers are starting to reflect that shift. The trust’s market price now sits at $9.06 while NAV per share stands at $5.97. Back when TAO’s recovery rally first started accelerating earlier this year, GTAO market price hovered near $6.08 and NAV per share sat around $4.39.

Grayscale GTAO Assets Continue Growing Steadily

The Grayscale Bittensor Trust launched publicly on December 12, 2025, and now manages roughly $13.06 million in assets under management with 2.1 million shares outstanding. Of course, investors are still paying Grayscale-style fees, with the trust carrying a 2.50% total expense ratio.

But let’s be real, institutional investors rarely chase convenience for free. The bigger story here is access.

Institutional Demand For TAO Keeps Building

GTAO remains one of the few investment vehicles offering exposure to Bittensor’s TAO token through a traditional security structure without requiring direct custody or storage of crypto assets.

Now, with Solana integrations expanding liquidity and Grayscale reopening private placement access, the market is starting to treat TAO less like an obscure AI token and more like a serious institutional crypto narrative. For now, Grayscale GTAO appears to be riding that wave.

Is CC Price Starting A Bigger Breakout If Jumps $0.16?

canton cc

The post Is CC Price Starting A Bigger Breakout If Jumps $0.16? appeared first on Coinpedia Fintech News

CC price just woke up from months of sideways boredom, and traders finally have something besides chop to stare at. After a fresh batch of Canton Network updates hit the market, the token posted a 10% intraday surge and broke out from a tightening symmetrical triangle pattern that had been squeezing price action for weeks. 

Canton Network Updates Spark Fresh Momentum

The move started after Canton Network stated that the gap between institutional blockchain strategy and real production deployment is still an implementation problem, adding that Kresus is building on Canton to help close it.

Then came another catalyst. Canton later announced that Featured App rewards now reflect actual network activity through CIP-0104, tying the ecosystem’s economic model directly to the value applications generate for the network. In plain English? Projects actually have to contribute instead of just existing for token emissions.

CC Price Breakout Faces Major Resistance Test

But the truth moving forward is that this rally still has work to do. The key resistance now sits around the $0.16000 zone. If bulls manage to break and hold above that level, the next upside targets stand near $0.17000 and eventually $0.20000.

Is CC Price Starting A Bigger Breakout If Jumps $0.16?

Fail there, though, and things could get ugly fast. A rejection from $0.16000 may drag CC price back toward $0.14000 support, while a deeper retrace could revisit the $0.11000 region.

Technical Indicators Still Favor Higher Prices

Most interestingly, despite the intraday rally today, the Chaikin Money Flow indicator still remains negative, suggesting inflows haven’t fully turned positive yet. That leaves room for additional upside if momentum continues building.

Is CC Price Starting A Bigger Breakout If Jumps $0.16?

Meanwhile, RSI sits near 65, signaling strong momentum without entering extreme overheated territory. Add in a fresh MACD bullish crossover, and the setup increasingly looks like a market preparing for another leg higher.

For now, Canton Network has traders watching whether CC price can finally force a clean breakout above $0.16000.

Can ICP Price Rally Continue Toward $7, as Whales Have Turned On?

A silver DFINITY (ICP) infinity symbol coin displayed on a smartphone screen against a background of rising green and red candlestick trading charts.

The post Can ICP Price Rally Continue Toward $7, as Whales Have Turned On? appeared first on Coinpedia Fintech News

The Internet Computer crowd finally has something to celebrate besides survival. ICP price just ripped nearly 35% higher to touch $4.0 before cooling near $3.70, and for once, this wasn’t some random candle fueled by some kind of meme-level delusion. The breakout actually came with a proper narrative to which traders could sink their teeth into.

More importantly, ICP/USD today has managed to break above the 200-day EMA band, flipping a long-standing resistance zone into dynamic support. In crypto terms, that’s basically the chart screaming, “maybe the pain trade is over.”

WordPress Move Ignites Internet Computer Demand

Well, the rally in ICP token price really started on May 5 after Dfinity announced on X that WordPress now runs entirely on the Internet Computer through the Wasp Technology team.

And no, not partially. The deployment reportedly includes the frontend, WP-admin, database, and caching system running fully on-chain without external databases, off-chain caches, proxy layers, or TEE VPS infrastructure, per their x post. That development helped ICP price bounce from the $2.30 support region and climb roughly 70% in total over the ongoing rally.

Whale Wallets Quietly Accumulate ICP Tokens

That said, the run in ICP/USD was real, and more to that the reality is that retail traders alone don’t usually sustain moves like this. On-chain supply distribution data paints a more interesting picture here.

As metric chart shows that the Wallets holding between 10 and 10,000 ICP tokens have reportedly been reducing exposure in early May. Meanwhile, holders controlling 10,000 to 100,000 ICP  and even wallets holding 100,000 to 1 million ICP  have started accumulating. This makes it clear that buying demand is back.

Can ICP Price Rally Continue Toward $7, as Whales Have Turned On?

ICP Price Eyes Bigger Resistance Breakout Ahead

So, moving forward what’s next? The immediate hurdle now sits around the $4.50 resistance area. If ICP price breaks above that level and converts it into support, the probability of a move toward $7.00 before H1 2026 closes starts looking a lot less ridiculous.

Can ICP Price Rally Continue Toward $7, as Whales Have Turned On?

For now, the Internet Computer rally finally has both technical momentum and a narrative powerful enough to keep traders watching.

Sui Crypto (SUI) Price Prediction 2026, 2027-2030: Is This the Best Time to Buy SUI?

sui

The post Sui Crypto (SUI) Price Prediction 2026, 2027-2030: Is This the Best Time to Buy SUI? appeared first on Coinpedia Fintech News

Story Highlights

  • The live price of SUI crypto is  $ 1.05216622.
  • SUI shows strong bullish momentum in early 2026, backed by rising TVL, ecosystem growth, and renewed investor confidence.
  • If key resistance breaks, SUI could target $3–$5 in 2026, with long-term potential extending toward $15–$18 by 2030.

As a next-generation Layer 1 blockchain, Sui is redefining the architecture of the decentralized web by introducing an object-centric model where assets, data, and permissions are natively ownable and programmable. Built to handle the demands of modern commerce, the Sui Stack provides a modular toolkit that allows developers to scale on resilient infrastructure while delivering high-performance experiences without typical blockchain trade-offs.

From powering institutional capital markets and DeFi to even revolutionizing the gaming sector, the network has already secured a significant foothold with a Total Value Locked (TVL) of $583 million, per the official website. 

By prioritizing verifiable security and composable scaling, Sui ensures that value created within its ecosystem is shared rather than extracted. In this comprehensive SUI price prediction 2026–2030, we analyze how this business-ready infrastructure and growing industry adoption will impact SUI’s token and market valuation in the years to come.

Sui Price Today

Cryptocurrency Sui
Token SUI
Price $1.0522 up 4.28%
Market Cap$ 4,214,365,913.42
24h Volume$ 940,790,868.4115
Circulating Supply4,005,418,369.5667
Total Supply10,000,000,000.00
All-Time High$ 5.3519 on 06 January 2025
All-Time Low$ 0.3643 on 19 October 2023

Sui (SUI) Price Prediction May 2026

Sui (SUI) Price Prediction May 2026

Based on the technical analysis of the SUI/USD daily chart, the asset remains in a prolonged period of consolidation following a significant downtrend. After facing intense selling pressure at the $2.00 psychological barrier in early 2026, which is a continuation of the bearish momentum from late 2025, as the price plummeted toward the $0.80 mark by February. Since that decline, SUI/USD has spent the months of March and April oscillating within a narrow range, consistently struggling to reclaim the crucial $1.00 level, which has transitioned from a support zone into a stubborn resistance.

As May is running, that makes SUI sits at a definitive crossroads, despite a rise to $1.10, it still struggles at $1.05 resistance. From a bullish perspective, a decisive break and daily close above the $1.05 resistance could signal that a local bottom has finally been established. Such a move would likely trigger a relief rally toward the $1.60 zone, where the 200-day EMA currently looms as a secondary hurdle. If momentum sustains, there is a possibility for the price to retest the major $2.00 threshold, effectively challenging the upper boundary of the long-term descending channel.

However, the outlook remains fragile if the consolidation phase fails to produce an upside breakout. Should SUI token price continue to face rejection at the $1.00 mark, the risk of a breakdown increases significantly. Investors should closely monitor the $0.80 support floor; if this level is breached on high volume, it could open the door for a deeper correction toward the $0.50 – $0.60 range. This lower demand zone represents the final line of defense before the asset enters a new stage of price discovery to the downside.

Sui (SUI) Crypto Price Prediction 2026

The weekly price action for SUI/USD reveals a market in a major corrective phase after its late-2024 peak, currently in Q1 2026, searching for a definitive long-term bottom. 

What we witnessed is that after the 2024’s explosive rally that topped out near $5.36, the asset entered a persistent downtrend, characterized by a series of “lower highs” capped by a prominent descending resistance line. This primary trendline has remained unbroken throughout 2025, consistently forcing the price toward deeper support levels as the initial hype cycle cooled.

Currently, the SUI price is testing $0.80 support after losing $1.05 support in Q1 2026. The odds suggest a chance of reaching the $0.50 support zone if it fails to hold $0.80, because the $0.50 area is of immense technical importance, as it represents the original “genesis” accumulation level from early 2024. 

The price has dipped a lot, and now it’s showing signs of stabilization as sellers are about to reach exhaustion once it hits $0.50. Real consolidation could begin, and a true reversal to fruit has better odds. This area serves as the “line in the sand” for bulls; maintaining this floor is essential to prevent a complete technical breakdown and to begin building a new base for the next market cycle.

Looking ahead, the chart identifies several key resistance levels that SUI must reclaim to shift its bearish structure. The immediate hurdle lies at the $1.05, $1.60, and $2.00 horizontal zones. A successful bounce from the current demand floor would likely target these levels first. 

However, a true trend reversal will only be confirmed if SUI breaks and closes above the long-term descending trendline, currently near $3.50. Until that breakout occurs, the asset remains in a “buy the dip” accumulation phase for long-term investors.

SUI Price Prediction 2026

SUI Crypto Price Prediction 2026 – 2030

YearPotential Low ($)Potential Average ($)Potential High ($)
2027$4$6$8
2028$8$10$12
2029$10$13$16
2030$12$15$18

Sui (SUI) Price Prediction 2027

Subsequently, the SUI price range can be between $4 to $8 during the year 2027. 

SUI Prediction 2028

Beyond the previous ATH,SUI bullish momentum may gain pace and will see another bullish spark in 2028. Specifically, as per our SUI Price Prediction, the potential SUI price range in 2028 is $8 to $12. 

SUI Price Forecast 2029

Thereafter, the SUI price for the year 2029 could range between $10 and $16

Sui (SUI) Price Prediction 2030

Finally, in 2030, the price of SUI is predicted to maintain a steady and positive. It can trade between $12 and $18.

SUI Price Prediction 2031, 2032, 2033, 2040, 2050

Based on the historic market sentiments and trend analysis of the largest cryptocurrency by market capitalization, here are the possible SUI price targets for the longer time frames.

YearPotential Low ($)Potential Average ($)Potential High ($)
2031$8$10$15
2032$10$13$18
2033$12$15$22
2040$20$32$40
2050$30$70$150+
Never Miss a Beat in the Crypto World!

Stay ahead with breaking news, expert analysis, and real-time updates on the latest trends in Bitcoin, altcoins, DeFi, NFTs, and more.

FAQs

What is the Sui Crypto (SUI) price prediction for 2026?

SUI could trade between $0.50 and $5 in 2026. If it breaks key resistance near $3.50, momentum may push the token toward the $3–$5 range.

How high can Sui Crypto go by 2030?

If adoption continues and the ecosystem expands, SUI could reach $12–$18 by 2030, driven by DeFi growth and network demand.

What is the Sui price prediction for 2040?

Long-term projections suggest SUI may trade between $20 and $40 by 2040, assuming strong blockchain adoption and sustained ecosystem growth.

What is the Sui Coin price prediction for 2050?

By 2050, SUI could potentially reach $30–$150+ if the network becomes widely used across finance, gaming, and Web3 infrastructure.

Where to buy Sui Crypto (SUI)?

You can buy SUI on major crypto exchanges like Binance, Coinbase, KuCoin, and OKX. Simply create an account, deposit funds, and trade for SUI.

Can SUI reach its all-time high again?

Yes, if SUI breaks above key resistance near $3 and market conditions stay favorable, a retest of its $5.35 ATH is possible.

Is SUI a good long-term investment?

SUI shows long-term potential due to its scalable Layer-1 design, growing DeFi adoption, and increasing developer and institutional interest.

What factors are driving SUI’s price growth?

Key drivers include rising TVL above $1B, strong on-chain activity, ecosystem expansion, and SUI’s reputation as a fast, scalable network.

Ordinals (ORDI) Price Prediction 2026, 2027-2030: Can ORDI Surge 100x Again?

Ordinals (ORDI) Price Prediction

The post Ordinals (ORDI) Price Prediction 2026, 2027-2030: Can ORDI Surge 100x Again? appeared first on Coinpedia Fintech News

Story Highlights

  • The live price of the Ordi token is  $ 5.57055877.
  • ORDI price is consolidating in the $1–$5 demand zone after a 95% drop from $95. A breakout above $5 could trigger a rally toward $10 and possibly $30 if market sentiment turns bullish.
  • Ordinals (ORDI) may be forming a bottom in 2026. If bulls reclaim $5 resistance, the token could target $8–$10 short term, with long-term forecasts reaching $60+ by 2030.

Ordinals allow users to engrave data onto Satoshis. These inscriptions act like NFTs, but without smart contracts. It’s working to be more precise; the ORDI tokens are the wallet’s native BRC-20 token inscribed onto satoshis, which users can securely store, transfer, or trade in the wallet’s built-in marketplace. Using this method offers a new form of digital value on Bitcoin.

ORDI isn’t just a token; it’s a milestone. The Ordinals protocol’s structure keeps it close to Bitcoin’s core while opening new use cases. All this happens on a non-custodial Ordinals wallet. As a result, it had a strong response in Q1 2024, spiking to around $95, but in Q1 2026, it’s over 95% down in a two-year span, showing complete consumption of its gains.

What’s coming next for the token? How high will ORDI price go? Can ORDI surge 100x? What will the price of ORDI be in 2030? Let’s explore the ORDI price prediction from 2026 to 2032.

ORDI Price Today

Cryptocurrency ORDI
Token ORDI
Price $5.5706 up 3.76%
Market Cap$ 116,981,734.12
24h Volume$ 78,277,209.2123
Circulating Supply21,000,000.00
Total Supply21,000,000.00
All-Time High$ 96.1744 on 05 March 2024
All-Time Low$ 1.4088 on 10 October 2025

Ordinals (ORDI) Price Prediction May 2026

The daily chart of ORDI price indicates a notable decline in buyer interest, marked by a significant downward trend that intensified in early 2025 following a substantial sell-off. This situation has created a strong supply zone between $24.00 and $28.00.

Throughout late 2025, the technical landscape remained weak, as both the $18.00 and $8.00 support levels proved ineffective. The critical breach of the $8.00 level in October led to continued selling pressure, with prices struggling to overcome resistance.

As Q1 2026 closed with lackluster momentum, attention shifted to Q2. April has begun to live up to expectations, with a recent spike that surpassed $7.60 and briefly hit $10.20, surprising many investors. But sadly, the move was suppressed by bears, and ORDI reentered the demand area by the end of April.

Currently, in May, it’s testing the 200-day EMA band as support if it surges again, then the nearest resistance aimed is $12, only if $7.60 is flipped. Beyond $12 it will target $18 next.
However, if the price does not gain momentum between $7.60 and $8.00, consolidation will only extend until demand again spills into the bucket.

Ordinals (ORDI) Price Prediction May 2026

Ordinals (ORDI) Price Prediction 2026

The weekly chart for Ordinals (ORDI) indicates a crucial technical juncture. After an extended period of bearish dominance, the price has returned to the foundation of its historical market structure.

Is this the 2026 Bottoming Pattern? ORDI is currently reacting to a significant demand zone. This accumulation range is critically important; it served as the launchpad for the legendary late-2023 rally, where the asset surged from a low of $2.75 to a staggering peak of $95.00, yielding gains exceeding 3,300%.

Following that historic high, the past two years have seen a consistent downtrend. However, the return to this primary demand area in Q1 2026 suggests that the “selling exhaustion” phase may be nearing completion.

As April 2026 progresses, ORDI attempted a spike in mid-April by retesting the $7.60 resistance level but it couldn’t clear. But, if it sees resurgence in demand ahead and it manages to clear this level, further upward movement could occur in ORDI, which is essential for a short-term trend reversal.

Macro Target: If broader market sentiment shifts to “risk-on,” the explosive potential of the Ordinals protocol could drive the recovery target for 2026 to $30.00, indicating significant potential for recovery from current accumulation levels. However, if this doesn’t materialize, consolidation in this demand area may continue for an extended period.

Ordinals (ORDI) Price Prediction May 2026

Ordinals (ORDI) price prediction 2027-2032

YearMinimum Price ($)Maximum Price ($)Average Price ($)
20276.4027.6016.50
202819.1040.9029.50
202923.0055.7533.50
203038.5062.5049.00
203147.0072.0057.90
203257.5085.9068.50

Ordinals (ORDI) Price Prediction 2027

The outlook for 2027 suggests a substantial expansion in market valuation. ORDI is expected to trade within a wide range of $6.40 to $27.60, maintaining a healthy average price of $16.50 as it consolidates its position in the Bitcoin ecosystem.

Ordinals Crypto Price Prediction 2028

Building on the momentum of the previous year, 2028 could see ORDI breaking into new territory. Projections indicate a minimum price of $19.10 and a potential peak of $40.90, with an anticipated average trading cost of $29.50.

ORDI Price Prediction 2029

By 2029, the maturation of BRC-20 utility is expected to drive prices further. The token is projected to range between $23.00 and $55.75, resulting in a yearly average of approximately $33.50.

Ordinals Price Prediction 2030

Entering the new decade, Ordinals is forecast to show significant strength. Analysis suggests a price floor of $38.50 and a maximum surge toward $62.50, with investors looking at an average price of $49.00.

ORDI Coin Price Prediction 2031

The upward trajectory is expected to intensify in 2031. The highest projected price for the year reaches $72.00, while the minimum is expected to hold firm at $47.00, averaging out to $57.90.

Ordinals (ORDI) Price Prediction 2032

Looking toward 2032, the Ordinals protocol estimates a continued bullish trend. ORDI is expected to fluctuate between $57.50 and $85.90, with an average market price of $68.50.

Never Miss a Beat in the Crypto World!

Stay ahead with breaking news, expert analysis, and real-time updates on the latest trends in Bitcoin, altcoins, DeFi, NFTs, and more.

FAQs

What is Ordinals (ORDI) in crypto?

Ordinals (ORDI) is the first BRC-20 token built on Bitcoin using the Ordinals protocol, allowing data to be inscribed on satoshis and traded like digital assets.

What is the ORDI price prediction for 2026?

ORDI could trade between $1 and $30 in 2026. A breakout above the key $5 resistance may trigger recovery momentum toward the $8–$10 range.

How much will ORDI coin be worth in 2030?

By 2030, ORDI could trade between $38 and $62, with an estimated average near $49, if adoption of Bitcoin Ordinals and BRC-20 tokens continues to grow.

What factors could drive ORDI price growth?

ORDI growth may depend on Bitcoin ecosystem adoption, BRC-20 token usage, NFT demand on Bitcoin, and overall crypto market sentiment.

Can ORDI reach $100 again?

Reaching $100 would require strong adoption of Bitcoin Ordinals and a major market cycle. While possible long-term, it depends on demand and ecosystem growth.

❌