The U.S. Commodity Futures Trading Commission has officially launched its Innovation Advisory Committee, appointing a broad group of leaders from both crypto and traditional finance. The initiative comes under Chairman Mike Selig as the agency positions itself to take on a greater role in overseeing digital asset and derivatives markets.
Among the most prominent appointees are Coinbase CEO Brian Armstrong and Ripple CEO Brad Garlinghouse. Their inclusion signals a direct line between major U.S.-based crypto firms and federal regulators at a time when policy clarity remains a top industry priority.
Selig described the committee as a critical resource for modernizing regulatory frameworks to keep pace with financial and technological innovation.
A Wider Role in Crypto Regulation
The 35-member committee will advise the CFTC on innovation-driven developments in financial markets. Its creation reflects the agency’s growing influence in crypto oversight, particularly as it works more closely with the Securities and Exchange Commission on digital asset initiatives.
The CFTC is increasingly viewed as a primary regulator for crypto derivatives and potentially broader digital commodity markets. By expanding the advisory body beyond its previous CEO-level council and nearly tripling its size, the agency is signaling a more structured engagement with industry stakeholders.
Notably, the panel brings together crypto-native leaders and established financial institutions, including executives from Nasdaq, CME Group, Cboe Global Markets, the Futures Industry Association, and the International Swaps and Derivatives Association. The presence of traditional market infrastructure firms underscores how digital assets are becoming integrated into mainstream finance.
Beyond Armstrong and Garlinghouse, the committee includes Uniswap Labs CEO Hayden Adams, Gemini CEO Tyler Winklevoss, Kraken Co-CEO Arjun Sethi, Solana Labs CEO Anatoly Yakovenko, Chainlink Labs co-founder Sergey Nazarov, and Grayscale CEO Peter Mintzberg.
Venture capital representation comes from Chris Dixon of a16z Crypto and Alana Palmedo of Paradigm. The diversity of participants, from decentralized protocol founders to centralized exchange executives, reflects the CFTC’s attempt to gather broad market insight.
Industry Reaction and Market Implications
The move has drawn positive reactions within the crypto community. Crypto analyst Michael Petricone described it as an example of serious U.S. fintech leadership, arguing that bringing builders into the policy process ensures digital finance develops under American rules and values.
Crypto user Diana called Garlinghouse’s appointment a major win for Ripple and XRP holders. She framed it as giving XRP a seat at the U.S. regulatory table, fueling optimism about Ripple’s long-term regulatory positioning.
While the committee is advisory, its influence could shape derivatives rules, exchange compliance standards, and token classifications. For the crypto sector, the development marks a shift from enforcement-driven headlines toward collaborative rulemaking, a sign that regulatory integration may be entering a new phase.
Never Miss a Beat in the Crypto World!
Stay ahead with breaking news, expert analysis, and real-time updates on the latest trends in Bitcoin, altcoins, DeFi, NFTs, and more.
In just a few hours, nearly $90 billion evaporated from the crypto market.
Bitcoin dropped sharply below $66,000. Ethereum slid toward $1,900. Altcoins fell 4%–7%. The Fear & Greed Index plunged into “Extreme Fear.”
This wasn’t just volatility. It was a reminder.
In high-risk cycles, assets without structure bleed the fastest.
And that’s exactly why capital is shifting toward structured participation models like SolStaking.
Volatility Isn’t the Problem. Passive Exposure Is.
When markets crash:
Leverage accelerates liquidations
Fear drives irrational exits
Capital becomes reactive instead of strategic
Simply holding assets without a yield structure means your portfolio depends entirely on price recovery.
That’s speculation.
Structured staking participation is a strategy.
What Is SolStaking?
SolStaking is a structured digital asset platform designed to help crypto holders maintain capital efficiency during volatile cycles.
Instead of relying purely on price appreciation, SolStaking allows users to participate in automated staking and cloud mining models supported by both blockchain infrastructure and diversified real-world asset operations (RWA).
The goal is simple:
Keep assets working — even when markets aren’t.
Security & Compliance Infrastructure
In times of instability, security matters more than yield.
SolStaking operates with a clearly defined compliance and risk framework:
U.S.-registered operating entity: Sol Investments, LLC
Asset segregation: User staking assets are kept strictly separate from platform operating funds
Independent audits: Periodic audits conducted by PwC
Custody insurance: Coverage provided by Lloyd’s of London
Enterprise-grade security: Multi-layer encryption, system isolation, and 24/7 risk monitoring
This structure is designed for long-term operational stability — not short-term hype.
These assets operate off-chain, generating structured revenue streams that are reflected through automated on-chain contract execution.
The result?
Even during heavy market corrections, the operational structure continues functioning.
Contract Participation
SolStaking offers various staking and cloud mining contract models tailored to different asset types and time horizons.
Users can participate using assets such as BTC, ETH, SOL, USDT, and others. Contracts are executed automatically by the system, with daily settlement mechanisms and transparent tracking.
For full details regarding available contract plans, participation terms, and performance structures, users are encouraged to visit the official website for the most up-to-date information:
Why This Matters in a Bear Market
Bear markets don’t destroy capital overnight.
They drain it slowly — through inactivity, poor structure, and emotional decision-making.
The difference isn’t who predicts the bottom.
It’s who builds a structure that continues operating through volatility.
When others are waiting for price recovery, structured participants are maintaining capital efficiency.
Final Thought
Crypto will always be volatile.
But how you position your assets during volatility is a choice.
You can wait for the next rally.
Or you can structure your assets to operate through the storm.
The Bitcoin price is yet again facing significant upward pressure as the token has plunged below $66,000 from an intraday high of over $68,400. Observing the current trade dynamics, it appears that the star crypto is entering a high-tension phase as traders are now expecting the price to plunge. The short bets are increasing notably and have reached a level that usually results in sharp volatility. This suggests the BTC price may get exposed to more sell pressure or a sudden short squeeze may catch bears off-guard.
With Bitcoin hovering near key technical levels, the imbalance between rising short interest and cooling spot momentum is creating a fragile setup. The question now is whether this wave of bearish bets will push BTC lower or fuel the next breakout.
Bitcoin Short Positioning Hits Extreme Levels
Recent derivatives data from Santiment show a clear spike in short exposure, with funding rates slipping deeply into negative territory. Negative funding means short traders are paying longs to keep their positions open, a sign that bearish sentiment has become crowded.
When funding stays mildly negative, it often reflects healthy hedging. But when it turns sharply negative, it suggests positioning is becoming one-sided. Markets tend to punish extreme consensus. If too many traders lean in the same direction, even a small upward move can trigger forced liquidations, accelerating the price higher in a short squeeze.
At the same time, open interest remains elevated, indicating that leverage is still active in the system. High open interest combined with negative funding creates a volatility setup, price does not stay compressed for long under these conditions.
The key now is whether spot demand can absorb selling pressure. If buyers defend support levels, the imbalance in shorts could fuel a rapid breakout. If support breaks, however, the crowded short trade may continue to build, reinforcing downside momentum.
Key Levels That Could Trigger the Next Move
Bitcoin is compressing between clear technical boundaries, and with funding deeply negative, these levels now carry even more weight.
Immediate Resistance: $70,000–$72,000
This zone has capped recent recovery attempts. A strong daily close above $72,000 with expanding spot volume could trigger a short squeeze. If that happens, liquidation clusters sit near $75,500, followed by $78,000. A squeeze extension could target the $82,000–$85,000 liquidity pocket, where prior distribution occurred.
Immediate Support: $59,000 – $60,000
This is the current pivot zone. A decisive breakdown below $59,000 on rising volume would invalidate squeeze expectations in the short term. In that case, downside targets sit at $54,000, followed by the major demand block around $50,000–$52,000.
Open interest remains elevated, meaning leverage is still active. If price breaks either boundary with conviction, volatility could expand quickly. For traders, the setup is clear: above $72K favors squeeze dynamics; below $59K shifts the structure toward a deeper correction.
What’s Next for Bitcoin Price as Shorts Crowd the Market?
Bitcoin price is sitting at a leverage-heavy turning point. Deeply negative funding shows that traders are leaning aggressively short, but extreme positioning alone does not guarantee a squeeze. It simply increases the probability of volatility.
If the BTC price reclaims $72,000 with strong spot demand, the imbalance in shorts could fuel a move toward $75,500 and potentially $78,000. However, without real buying pressure, rallies may continue to fade. On the downside, losing $59,000 would confirm that sellers remain in control, opening the door to $54,000 and possibly the $50,000–$52,000 demand zone.
After months of correction, Bitcoin is attempting to stabilize, but technical analysts say the market has yet to confirm a decisive bottom, leaving the possibility of another dip before a stronger recovery begins.
Early Rebound Signals Stabilization
Bitcoin recently rebounded roughly 20% from its February lows, recovering into a broad support range between about $55,500 and $67,000. While the bounce suggests improving short-term sentiment, analysts describe the move as corrective rather than the start of a full bullish breakout.
A sustained upward trend would typically require stronger buying momentum and a clearer multi-stage upward pattern. Until such signals emerge, the recovery remains tentative.
Resistance Levels Holding Back Breakout
In the near term, analysts are watching a resistance band between $68,000 and $70,800, an area where selling pressure has repeatedly slowed advances. A decisive move above this range could reduce the risk of further downside and improve the outlook for a broader rally.
Conversely, failure to break above resistance may keep markets locked in a consolidation phase. Analysts say a drop below $62,600 support could increase the likelihood of another decline, potentially pushing prices back toward the mid-$50,000 range.
Market Still Searching for a Bottom
Technical indicators currently show a market moving sideways rather than trending strongly in either direction, with short-term price action fluctuating between support and resistance zones. Analysts warn that such conditions often precede either a renewed sell-off or the beginning of a stronger upward move, depending on which levels break first.
Despite near-term uncertainty, some analysts remain cautiously optimistic, arguing that the broader risk-reward balance increasingly favors long-term buyers as prices consolidate after the extended correction. Still, they stress that confirmation of a durable bottom will likely require stronger upward momentum and sustained trading above key resistance levels.
The altcoin market is approaching a critical technical moment. Excluding Bitcoin and Ethereum, the total crypto market capitalization is testing a long-standing ascending trendline that has supported prices since late 2023. At the same time, a large head-and-shoulders pattern is forming on the higher timeframe—a structure often associated with trend reversals. If confirmed, this breakdown could drag the altcoin market cap toward the $500 billion mark in the coming weeks.
With volatility rising and liquidity tightening across the broader crypto market, traders are now watching closely to see whether this is just another pullback or the start of a deeper correction.
The chart below shows a clear three-peak structure, a left shoulder formed after an early rally, a higher head marking the cycle peak and a right shoulder printing a lower high, which is a key sign that buying strength is fading. This pattern becomes active once the price breaks below the neckline, which in this case aligns closely with the rising green macro trendline.
The projected move from a head & shoulder pattern breakdown is measured from the top of the head to the neckline. Applying this projection to the current chart structure, it points towards a downside target between $500 billion and $520 billion in total altcoin market capitalisation. Currently, the levels are hovering around $690 billion, which implies a potential 25% to 30% decline if selling pressure accelerates.
This move could increase Bitcoin dominance, trigger sharper corrections in mid- and small-cap altcoins and postpone any immediate altseason narrative.
What’s Next for the Altcoins?
Bearish scenario: If the breakdown holds and the trendline fails to recover, the technical structure favors a deeper correction toward $580B and potentially $500B. This would mark a broad market reset and likely extend underperformance across the altcoin sector.
Bullish scenario: If buyers step in aggressively and reclaim the broken support, pushing market cap back above $750B–$820B, the breakdown would turn into a false move. In that case, altcoins could stabilize and resume upside momentum.
For now, the structure and sentiments remain cautious, and the upcoming weekly close will determine whether altcoins will face a deeper correction or rebound, transforming this into a small shakeout.
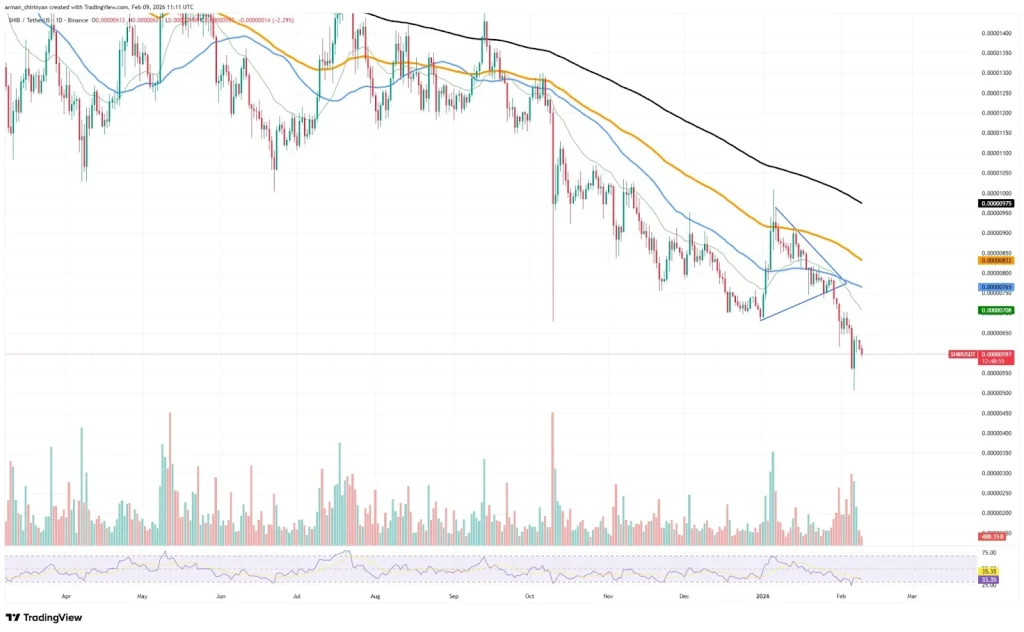
The Ethereum price keeps falling, despite supply on Binance keeps shrinking. Normally, declining exchange reserves are bullish and many immediately speculate for a rally. Coins leave exchanges, sell pressure drops, price rises. That’s the textbook theory.
But markets don’t care about textbooks, it works in a more twisted way and ordinary textbook theories don’t always work and ETH not going up is clear evidence of this.
Right now, the Ethereum price sits near $1908 with fading momentum, moving averages weakening after a bearish crossover on both long-term and shortterm spans, and downside pressure refusing to let up. So what’s overpowering the shrinking exchange supply narrative?
Shrinking Binance Reserves Explained
Binance’s ETH exchange reserve is trending downward again. That means ETH is being withdrawn. Under normal spot-driven conditions, that’s constructive theoretically.
As, less ETH on exchange typically means fewer coins readily available for sale.
Well, here’s the catch: spot dynamics don’t dominate short-term price action anymore. Infact, Derivatives do as they have strong leverage support from exchanges that covers up spot activity in short term.
And that is what changes everything. Since, exchange reserve data reflects spot supply. But the Ethereum price chart is currently reacting more to futures positioning than to on-chain withdrawals.
If open interest is elevated, funding rates has turned negative, and traders are leaning heavily short, aggressive derivatives selling can drag Ethereum/USD lower. That’s why even if spot supply is shrinking. In that scenario, futures pressure simply overwhelms spot optimism. And that appears to be what’s happening.
Withdrawals Don’t Always Mean Holding
But, still knowing what futures activities are capable of, then let’s be real. This clearly implies that withdrawals aren’t automatically bullish accumulation anymore and theories like these are not certain indicators anymore.
Also, withdrawals also implies that ETH can leave Binance for DeFi collateral use, staking, Layer-2 activity, OTC transactions, or even transfers to other exchanges. A decline in Binance reserves doesn’t guarantee coins are locked away long term. That’s a very practical and logical thing to assume at this point about exchange reserve metrics. As Global sell pressure can still persist elsewhere.
So, shrinking supply on one exchange doesn’t necessarily mean shrinking supply everywhere.
Weak Demand and Macro Drag
Here’s another inconvenient truth, as a reduced exchange supply isn’t enough without demand presence.
In the crypto sector this demand comes from stablecoins inflows. If these are weak, then risk appetite is low, or broader market sentiment is negative, as a result ETH price won’t respond positively. In this mix, if we add macro correlation into the mix then it complicates the outlook even more bleak.
Like, if broader crypto is soft or risk markets are under pressure, then reserve signals can be completely overridden.
There’s also the possibility that large players are playing both sides: withdrawing spot ETH while opening short positions in derivatives. Strategic hedging Or positioning for lower levels.
So What’s Next For Ethereum price?
If derivatives pressure continues and liquidity gets cleared to the downside, Ethereum price prediction models increasingly point toward a deeper support retest, potentially in the $1,700 region. That doesn’t invalidate long-term structure but it does suggest pain could come first.
For now, the Ethereum price remains under pressure despite falling Binance reserves, proving once again that in this market, supply signals alone don’t move charts but positioning does.
Today, the MYX price didn’t just dip; it showed a brutal long squeeze that triggered around 50% collapse, wiping out overheated positioning in a short amount of time and sending liquidation data flashing red across derivatives dashboards.
According to Coinglass, total liquidations rekt over the past 24 hours reached $615.96K. Longs took the real hit $527.13K flushed, while shorts accounted for just $88.83K. That imbalance tells a clear story of a token dump. This wasn’t a balanced deleveraging; it seemed like a strategic one-sided unwind to extract most of the profits.
Liquidations Tell the Story in MYX Price
When long liquidations outweigh shorts nearly five to one, it usually means traders were leaning too hard in one direction.
The onchain data confirms that they truly were leaning too much on the bullish side. Per Santiment’s data, the MYX price had previously pushed the MVRV Z-Score to 4.731, which seemed to be in a danger zone, as this metric had been rising and hadn’t risen much beyond 4.731 which showed that was the limit of previous bullish rise.
That reading suggests market value had detached sharply from holders’ cost basis. In simpler terms, there were too many paper profits and markets covered that gap by this dump. As there was too much heat.
As a reason, the Z-score collapsed to 2.309 alongside a 50% price drawdown and surging volume. That’s not random volatility, in fact, the data points out that’s a violent shift from speculative euphoria to something closer to fair value. Massive unrealized gains got flushed out. Weak hands exited under pressure. Supply changed hands.
Well, here’s the kicker: that kind of washout can either mark the end for crypto or the reset before a base forms. Based on what the MYX price chart displays, it seems it is more interested in developing a base around $2.50-$3.00, aligning with an ascending trendline that’s been present for months.
MVRV Reset in Motion
A drop from 4.731 to 2.309 doesn’t scream bullish continuation, but it doesn’t scream structural death either. Historically, extreme Z-scores leave little room for sustainability. Pullbacks are common.
Now the market sits in a more neutral-bullish range, at least statistically speaking.
And that spike in volume during the drawdown? Classic capitulation behavior. It often accompanies panic-driven exits. But let’s be real, it also signals the market has aggressively repriced risk.
$3 Support Under Pressure
Technically, the MYX price chart shows the collapse reaching an ascending trendline support near $2.50-$3.0. That level matters. So far, it’s holding at CMP at $2.65, when writing.
But, If $3.0 breaks decisively, downside toward $1.0 becomes a realistic extension of the bearish outlook. No sugarcoating that. However, if consolidation builds around current levels and demand gradually returns, the foundation for recovery could form.
The MYX price prediction now hinges on whether this support becomes accumulation or surrender.
Utility Concerns Emerge
And then there’s the uncomfortable detail. Lower daily exchange activity appears to have played a role too in a recent dump. Because, MYX’s utility is driven by trading activity on its platform. Recent dashboard data shows declining open interest across key pairs like BTC/USDT and ETH/USDT.
Less activity. Less utility demand. Investors noticed and they basically dumped.
So while the long squeeze triggered the collapse, slowing exchange momentum may have lit the fuse. Whether that trend stabilizes could determine what happens next for MYX price.
Vitalik Buterin, co-founder of Ethereum, has weighed in on a growing debate within the crypto industry over whether projects must financially reward users to achieve adoption, arguing that incentives can help — but only when used carefully.
His comments came in response to an online discussion claiming that crypto applications cannot attract meaningful usage without airdrops, token rewards or other financial incentives. While Buterin acknowledged that the argument reflects the current realities of the industry, he said the issue is more nuanced than simply “reward users or fail.”
Incentives Can Work — If Used Correctly
Buterin explained that some forms of incentives are economically healthy, particularly when they compensate early adopters for risks associated with using new or experimental platforms. For example, liquidity rewards in decentralized finance (DeFi) can offset the higher technical and security risks that typically exist in early-stage protocols.
In such cases, he said, incentives function as part of a sustainable economic loop rather than a marketing expense.
However, he warned that paying users purely to generate activity, such as incentivizing promotional posts or rewarding users who would not otherwise engage with a mature product, can attract low-quality participation and disappear once payments stop.
Quantity vs. Quality of Users
Buterin warned that aggressive reward campaigns can sometimes create the illusion of adoption while failing to build a committed long-term community. Even if user numbers rise during incentive programs, the overall value of the ecosystem may weaken if participation is driven solely by short-term profit opportunities.
He said that the challenge is particularly important for social or community-driven platforms, where the quality of contributors matters more than the raw number of accounts interacting with the application.
Focus Returning to Real Product Value
According to Buterin, the crypto sector is gradually moving toward a model where long-term success depends less on incentive-driven growth and more on building applications that people genuinely want to use. The most effective incentives, he argued, are those that temporarily compensate for the early disadvantages of a young platform and naturally fade as the product matures.
“The bulk of the effort should be on making an actually useful app,” he wrote, suggesting that the next phase of crypto adoption will favor projects that combine practical utility with carefully designed, targeted incentives rather than relying on broad reward campaigns to attract users.
Comments from David Schwartz, chief technology officer at Ripple, have reignited debate over whether Bitcoin will need a major technical overhaul in the future to remain secure as quantum computing advances.
In a recent online discussion, Schwartz argued that bitcoin’s long-term success has so far depended more on its established reputation and market trust than on continuous technological upgrades at the blockchain level. However, he noted that one technological shift may ultimately be unavoidable: adapting the network to withstand potential quantum-computing threats.
Schwartz said bitcoin would likely “need a fork to be quantum proof,” warning that such a change could become necessary if advances in quantum computing eventually weaken today’s cryptographic protections. Without that type of upgrade, he suggested, the network could face serious long-term risks.
Technology vs. Market Dominance
The Ripple executive also said that bitcoin’s appeal does not rely heavily on adding new blockchain features. In his view, the network’s primary role is to ensure that users can reliably hold and transfer the asset over time — a function already achievable with widely available blockchain technologies. As a result, incremental technical innovation alone may not significantly influence bitcoin’s long-term adoption or price performance.
“For 99% of what makes bitcoin interesting, all the blockchain needs to be able to do is allow people to rely on being able to hold and transfer bitcoin in the future. That doesn’t require any technology that isn’t available in every public blockchain out there,” he said.
A Renewed Debate Over Bitcoin’s Future
Schwartz’s remarks come at a time when researchers and blockchain developers are increasingly discussing “post-quantum” cryptography — security systems designed to resist attacks from future quantum computers. While such threats are still considered distant, the discussion shows a broader industry question: whether bitcoin’s traditionally cautious approach to upgrades could eventually require coordinated global changes to maintain network security.
For now, the comments serve less as an immediate warning and more as a reminder that even the most established digital assets may one day face technological turning points driven by advances outside the crypto industry.
Institutional capital flows in the cryptocurrency market are beginning to show signs of diversification beyond bitcoin, with some analysts highlighting growing attention toward XRP as investors reposition portfolios. Market speculation has intensified around the possibility that global asset manager BlackRock could eventually pursue an XRP exchange-traded fund (ETF), a development analysts believe could significantly influence prices.
Institutional Flows Begin to Shift
Discussing recent market movements, analyst Zach Rector said that the current environment represents a major change compared with previous crypto cycles.
“We would have never seen this headline in the past seven years that I’ve been in crypto.”
He added that recent market data shows clear contrasts between outflows from some bitcoin and ether investment products and inflows into alternative crypto vehicles, including XRP-focused investment instruments.
ETF Filing Seen as Potential Turning Point
Market participants say the biggest catalyst for XRP could be a formal ETF filing from a major asset manager. Rector argued that such a step would mark a structural shift in institutional participation. “And we’ll see XRP double when that happens.”
Analysts say an ETF backed by a large global fund manager could expand institutional access, potentially bringing significant new liquidity into the asset.
Short-Term Pullbacks Still Possible
Despite the optimistic long-term outlook, short-term volatility may continue as the broader market searches for a bottom. Rector said that investors may still see additional dips before a sustained rally begins, while stressing that longer-term positioning strategies remain focused on accumulation.
Regulatory clarity, institutional product launches and continued inflows into alternative crypto investment vehicles could determine whether XRP becomes one of the primary beneficiaries of the next institutional allocation cycle.
As the crypto market churns toward its next big breakout, investors are scanning for the best crypto to buy before retail FOMO ignites and prices erupt. Beyond the familiar buzz of Dogecoin (DOGE) and Cardano (ADA), Mutuum Finance (MUTM) is stealing the spotlight with DeFi utility, presale momentum, and strong growth mechanics. While DOGE and ADA remain attractive, MUTM leads as the top crypto pick to buy before the crowd catches on.
Dogecoin (DOGE): Testing Key Levels
Dogecoin (DOGE) is consolidating near $0.09275 after a steady decline, with the short-term trend still bearish. Support sits at $0.090–$0.091, while $0.098 remains firm resistance. A move above $0.095 could spark a brief relief rally, but failure to clear resistance may push price back toward support, with a break below $0.089 confirming further downside. Overall, sentiment is cautious, with sellers still in control as traders look for stronger opportunities elsewhere in the market.
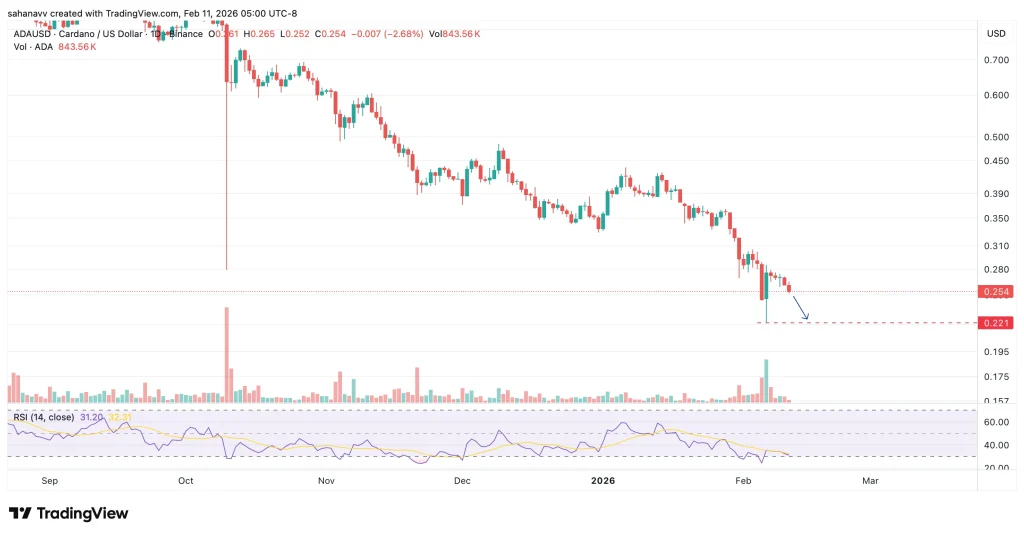
Cardano (ADA): Awaiting Clear Direction
Cardano (ADA) remains in a cautious phase, with uncertainty over whether last week’s low ended its year-long correction. A sustained move above $0.305 would be the first sign that selling pressure is easing. Until then, ADA holds a steady but unconfirmed position as investors search for the next big crypto and the best crypto to buy now.
Mutuum Finance V1 Protocol Goes Live
Mutuum Finance has taken a major step forward with the launch of its V1 Protocol, transitioning from concept to live testing. Deployed on the Sepolia testnet, the protocol allows users to explore lending, borrowing, and liquidity features in a controlled environment. This phase is crucial for the team to fine-tune performance, optimize functionalities, and gather insights before the full mainnet launch.
Among Mutuum Finance’s key features is mtTokens, which are issued to liquidity providers and accumulate interest as borrowers repay their loans. For example, a user who deposits $15,000 in USDC at a 5% annual yield would earn $750 over a year. As lending activity expands and the platform sees broader adoption, these returns could potentially double, offering consistent passive income.
Multichain Expansion: Amplifying MUTM’s Reach and Utility
To enhance accessibility and growth, Mutuum Finance is pursuing a multichain expansion, extending its lending and borrowing protocol across multiple blockchain networks. This strategy not only attracts new liquidity providers and borrowers but also increases overall network activity, boosting the utility and demand for the MUTM token. For instance, an early investor holding 30,000 MUTM at $0.04, investing $1,200, could see their position rise to $2,100 if adoption on Ethereum drives the price to $0.07.
With the protocol deployed on additional chains, increased demand could propel the price even further, potentially reaching $0.90, turning the same 30,000 MUTM into $27,000. By connecting multiple networks, Mutuum Finance creates a growth multiplier effect that benefits both the ecosystem and its investors, reinforcing why some see it as a top crypto for early DeFi exposure.
Early-Stage Opportunity: Capturing Growth with MUTM
For those looking to engage with early-stage DeFi projects, Mutuum Finance presents a strong opportunity. Currently in Phase 7 of its presale, MUTM is priced at $0.04, offering investors the chance to secure early positions ahead of wider market exposure. Analysts anticipate that with the upcoming mainnet launch, active presale momentum, and integrated passive income mechanisms, the token could reach $0.50 shortly after listing on exchanges. This represents a potential 12.5x growth for early participants. The presale has already drawn nearly 19,000 investors, raising over $20.48 million, reflecting strong market confidence and signaling significant interest in the platform’s long-term prospects.
Before retail FOMO takes hold, smart investors are positioning in a mix of established momentum, steady fundamentals, and explosive early‑stage utility. While Dogecoin and Cardano offer meme‑driven rallies and research‑backed stability, Mutuum Finance (MUTM) stands out as the best crypto to buy for asymmetric growth. Priced at just $0.04, MUTM delivers a live DeFi lending platform, multichain scalability, and a presale that has already raised over $20.48 million, combining tangible utility with the kind of pre‑breakout momentum that defines the top crypto ahead of the next market surge.
For more information about Mutuum Finance (MUTM) visit the links below:
Bitcoin price has entered a decisive phase after losing upside momentum and slipping back into a historically sensitive price region. What initially looked like a routine pullback from the 2025 highs is now evolving into a broader consolidation structure, with price compressing between major supply and demand zones.
The key question for traders is no longer whether volatility will return but from which direction the breakout will come. And if the breakout heads north, will the BTC price rise above $70,000?
Bitcoin Is Entering a Bearish Range as Momentum Fades
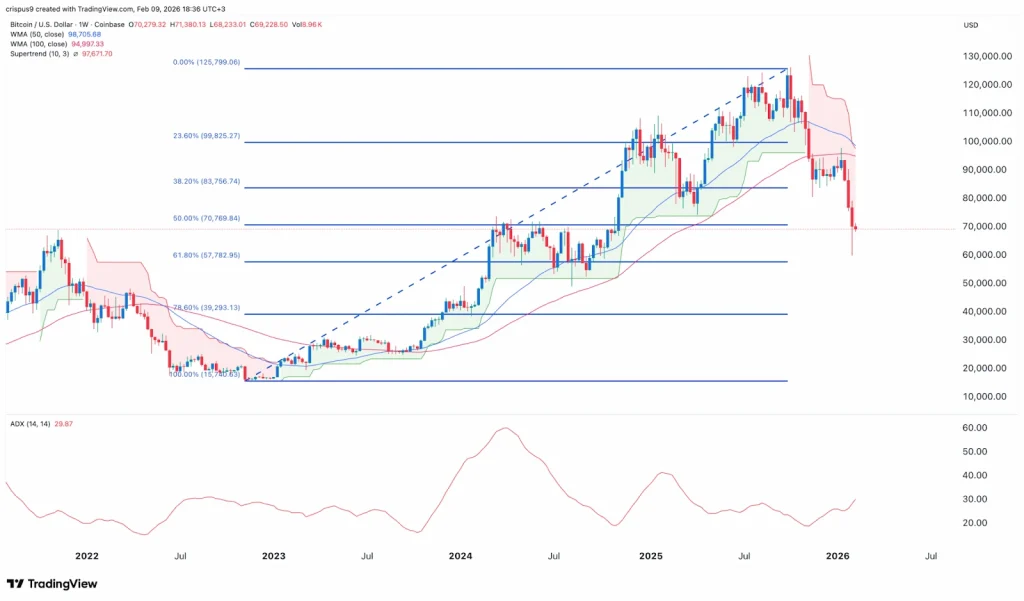
On the weekly timeframe, Bitcoin has broken back below the $70,000 psychological level, which previously acted as a strong acceptance zone during the 2024–2025 markup phase. The rejection from the $110,000–$120,000 region formed a classic distribution top, followed by a series of lower highs—an early signal that market structure was weakening.
The chart highlights a multi-month consolidation that originally acted as a launchpad for the late-2024 rally. Bitcoin has now returned to that same region, but instead of bouncing impulsively, the price is showing hesitation and thinner buying interest.
Bitcoin’s structure now reflects a clear shift in behaviour, with the former $70,000 support zone now acting as firm resistance. Instead of sharp, confident moves higher, candles have become choppier and more overlapping, a sign of consolidation. Momentum is also cooling, as the weekly RSI has slipped into the low 40s and CMF remains negative, pointing to steady capital outflows. Together, this suggests Bitcoin is going through a reset phase rather than attracting aggressive buying.
Price is now rotating between two clearly defined macro levels:
Primary Resistance: $69,000 – $72,000
Major Support/Demand Zone: $50,000–$54,000
Mid-Level Liquidity Pivot: ~$59,600 (currently being tested)
This structure resembles a range re-accumulation failure turning into redistribution, where former support flips into resistance—a pattern commonly seen during mid-cycle corrections.
Will the Bitcoin (BTC) Price Rise Above $70,000?
Bitcoin is no longer trending—it is trading between $50K and $70K after an overheated rally. The next major move will likely come from a volatility expansion out of this range. A weekly close above $72,000, supported by stronger volume and improving momentum, would signal that buyers are regaining control. In that bullish case, Bitcoin could target $78,000 first, followed by a move toward $88,000–$95,000 later in the month.
However, failure to hold the mid-range support near $59,000 would shift focus lower, opening the door for a retest of $54,000 and possibly the $50,000 demand zone. For now, BTC remains in a reset phase, and only a decisive breakout will determine whether $70,000 turns back into support or remains a ceiling.
Tether CEO Paolo Ardoino shared a demo of QVAC, the company’s new AI assistant designed to run entirely on users’ own devices, not in the cloud. QVAC utilizes the Model Context Protocol (MCP) to support multiple skills and can complete tasks such as creating assignments in apps, all through local inference and reasoning, even on a modest laptop GPU. The design emphasizes privacy by keeping data on the device, and Tether plans to release QVAC as an open-source project for developers soon.
“Tap to Earn” Mobile mining Pi Network has announced a major Mainnet upgrade, and this time the focus is on its Node system. The Core Team has shared a detailed update, asking all Mainnet node operators to complete the first upgrade step before February 15 to stay connected to the network.
Meanwhile, Nodes that fail to upgrade may lose connection to the network.
Pi Network Mainnet Node Upgrade
According to the Pi core team, Pi Nodes play a key role in the ecosystem. They are described as the “fourth role” in the Pi community, alongside miners, contributors, and ambassadors.
Nodes are responsible for validating transactions and supporting decentralization across the Mainnet.
Unlike Bitcoin or Ethereum, which use proof-of-work systems that require heavy computing power, Pi uses a different method called the Stellar Consensus Protocol (SCP).
The updated node version includes two parts, the Node interface and the desktop Pi App interface. Users can run a node by installing a desktop application, making the process more accessible for everyday participants without advanced technical knowledge.
Pi Node Operators Face Deadline Of February 15
The Pi Core Team also highlighted that more than 16 million users have successfully migrated to the Mainnet, showing strong community participation.
In a recent tweet post, the team stated that all Mainnet node operators must complete the first phase of the upgrade before February 15 to stay connected to the network.
Important reminder for Nodes: The Pi Mainnet blockchain protocol is currently undergoing a series of upgrades. The deadline for the first upgrade step is February 15. All Mainnet nodes must complete this step to remain connected to the network. More information is available here…
The update is part of a broader effort to strengthen the network’s infrastructure and improve long-term stability.
Pi Coin Price Analysis
As of now Pi network native coin is currently trading around $0.134, showing a 2% rise in the past 24 hours.
On the Pi/USDT daily chart, the price is moving near the lower edge of a falling channel. This area, around $0.135, may act as short-term support. If the price falls below this range, it could lead to new lows.
On the upside, the first resistance level is near $0.156. A stronger resistance zone is seen between $0.18 and $0.20. For the trend to change, Pi needs a daily close above $0.20 with strong buying support.
Milana Valmont, Co-founder of Valmont Group, a digital asset and market structure advisory firm, argued in a recent post that Ethereum’s biggest shift happened while most of crypto was busy watching its price fall.
According to Valmont, while traders spent years comparing ETH to faster chains and calling it dead, Ethereum moved in a different direction. Away from speculation and toward infrastructure.
Why Private Blockchains Failed and Ethereum Won
Valmont noted that institutions first tried building on private and permissioned blockchains. She compared this to how enterprises built intranets before the public internet took over. The result was the same every time.
“Liquidity fragmented. Standards diverged. Network effects never fully materialized,” she wrote.
Public blockchains fixed these issues. But institutions needed more than speed. They needed security, neutrality, and a track record under real stress with real money on the line. According to Valmont, Ethereum is the only programmable blockchain that has proven all three across a full market cycle.
ETF Approvals Changed the Math
Valmont said the approval of Ethereum ETFs and the resolution of proof-of-stake investigations removed a major barrier for institutional money.
“Capital does not move until uncertainty is reduced to an acceptable level,” she stated.
Once that cleared, tokenization on public blockchains went from experimental to competitive.
Ethereum as “Financial Middleware”
Valmont described Ethereum not as a standalone asset but as “financial middleware.” A neutral base layer where different institutions, protocols, and products can operate without one entity running the system.
She laid out the progression: stablecoins proved the model. Tokenized treasuries confirmed it. Funds are now connecting traditional asset management with blockchain-based settlement.
The Data Backs It Up
Ethereum currently holds around 68% of all DeFi total value locked. And just yesterday, BlackRock listed its $2.2 billion BUIDL tokenized Treasury fund on Uniswap and bought UNI tokens. That marks the world’s largest asset manager stepping directly into DeFi infrastructure built on Ethereum.
As Valmont put it, “Infrastructure shifts rarely announce themselves loudly. They tend to happen quietly and then all at once.”
Trump-backed World Liberty Financial (WLFI) has announced plans to launch a new forex trading platform called World Swap, expanding its presence in the global foreign exchange market.
The new platform will be built around its dollar-pegged stablecoin, USD1, as the company continues to grow its digital finance ecosystem.
WLFI Announced World Swap Forex Platform
Speaking at Consensus Hong Kong, WLFI co-founder Zak Folkman confirmed that the company will launch a foreign exchange platform called World Swap. The service is designed to make cross-border money movement simpler and cheaper using stablecoin rails.
World Swap will use WLFI’s dollar-pegged stablecoin, USD1, as its main settlement asset.
By combining traditional forex trading with blockchain infrastructure, the company aims to enable faster and more efficient currency transactions compared to traditional banking systems.
JUST IN: Trump-backed World Liberty Financial to launch "World Swap," a new crypto-based foreign exchange and remittance platform pic.twitter.com/qAxGMVMi7l
With this move, foreign exchange services become part of WLFI’s growing lineup of crypto-based financial products built around USD1.
Simple Cross-Border Transfers With Lower Fees
The launch of World Swap comes as demand for the USD1 stablecoin continues to rise. Folkman said the goal is to make international transfers simple by removing the technical steps often linked to crypto wallets.
Users should be able to send and receive digital dollars as easily as using a regular payment app.
World Swap is also being promoted as a cheaper option compared to traditional remittance and forex services, where fees can range from 2% to 10% per transaction.
By using blockchain and stablecoins, WLFI aims to lower costs and make transfers faster.
More Announcements Expected at Mar-a-Lago Event
More updates are expected at an upcoming company event scheduled later this month. While specific details have not yet been disclosed, the company has hinted at additional developments within its ecosystem.
As of now, WLFI is trading at around $0.107, reflecting a rise of 7.53% in the last 24 hours, with a market cap hitting $2.86 billon.
Thailand just opened the door for Bitcoin in its regulated derivatives market. The Thai Cabinet approved changes to the country’s Derivatives Act that allow digital assets like Bitcoin to be used as underlying assets for futures and options contracts.
The country’s crypto market is already valued at $3.19 billion, with an average daily trading volume of $95 million. That existing liquidity gives the derivatives push a solid base to build on.
Now, the real work begins.
What the SEC Will Do Next
Following the Cabinet’s approval, the Securities and Exchange Commission (SEC) will amend the Derivatives Act B.E. 2546 and begin drafting new licensing and oversight rules. The regulator is also working with the Thailand Futures Exchange (TFEX) to set contract specifications for crypto-linked derivatives.
SEC Secretary-General Pornanong Budsaratragoon said the expansion “will strengthen the recognition of crypto as an asset class, promote market inclusiveness, enhance portfolio diversification, and improve risk management for investors.”
The SEC is also reviewing licensing frameworks for derivatives brokers, exchanges, and clearinghouses.
Bitcoin Futures and Crypto ETFs on the Radar
The SEC’s 2026 capital markets plan includes Bitcoin futures and crypto exchange-traded funds.
Deputy Secretary-General Jomkwan Kongsakul said last month that crypto ETFs could launch early this year, subject to legal amendments.
Nirun Fuwattananukul, CEO of Binance Thailand, called the move a “watershed moment” for the country’s capital markets.
“It sends a strong signal that Thailand is positioning itself as a forward-looking leader in Southeast Asia’s digital economy,” he said.
He added that digital assets are now seen as assets that can reshape capital markets.
Crypto Payments Still Banned
Worth noting: while Thailand is welcoming institutional crypto activity, the central bank still bans crypto payments. The government also launched an anti-money laundering campaign in January targeting crypto-linked “gray money.”
The next steps to watch are the SEC’s rule drafting timeline, TFEX product launches, and whether this puts pressure on Singapore and Hong Kong to keep pace.
Never Miss a Beat in the Crypto World!
Stay ahead with breaking news, expert analysis, and real-time updates on the latest trends in Bitcoin, altcoins, DeFi, NFTs, and more.
FAQs
Can retail investors trade Bitcoin futures in Thailand?
Access will likely depend on investor classification and suitability rules set by the SEC and TFEX. Retail participation may be allowed, but with leverage limits, disclosure requirements, and risk warnings to reduce speculative harm.
How could a pause in U.S. crypto bank charters affect customers?
A delay may slow the rollout of federally supervised crypto banking services, including custody and payments. Customers could face fewer regulated options and continued reliance on state-chartered or offshore entities.
Could Thailand’s move influence other Asian financial hubs?
Yes. Regulatory competition is common in capital markets, and expanded crypto derivatives in Thailand may prompt policymakers in Singapore or Hong Kong to reassess their own product timelines and frameworks.
What risks do regulators weigh before approving crypto-linked derivatives?
Authorities typically assess market manipulation, custody safeguards, clearinghouse stability, and investor protection standards. Stress testing and margin rules are often used to limit systemic spillover if prices swing sharply.
Coinbase CEO Brian Armstrong has sold more than $550 million worth of company shares over the past year, according to publicly available data.
Figures highlighted by VanEck’s Head of Digital Assets Research, Matthew Sigel, show Armstrong sold over 1.5 million Coinbase (COIN) shares between April 2025 and January 2026.
Key Share Sales Details
Total shares sold: 1.5 million+
Total value: Around $550 million
Largest sale: June 25, 2025 – 336,265 shares at about $355 per share
Most recent sale: January 5, 2026 – 40,000 shares at about $249 per share
Total transactions: 88 separate sales
Shares purchased during this period: None
Despite the sales, Armstrong still holds an estimated $14 billion worth of Coinbase stock, keeping him one of the company’s largest shareholders.
Why Is Brian Armstrong Selling Coinbase Stock?
The sales were made under a Rule 10b5-1 trading plan. This is a legal framework that allows company executives to schedule stock sales in advance. The purpose of this plan is to reduce insider trading concerns by setting up automatic transactions ahead of time.
Armstrong adopted the trading plan in August 2025. Because the sales were pre-arranged, they were not necessarily based on short-term market movements. However, large insider sales can still create negative sentiment, especially when they happen during periods of stock price weakness.
Coinbase Stock Under Pressure
Armstrong’s stock sales come at a time when Coinbase shares have pulled back from earlier highs. On February 12, major banks, including JPMorgan and Citi, lowered their price targets on COIN ahead of the company’s earnings report. Analysts pointed to softer crypto trading volumes and cautious revenue expectations.
The decline in Coinbase stock has also affected Armstrong’s personal net worth, reportedly pushing him off Bloomberg’s list of the world’s 500 richest individuals.
Never Miss a Beat in the Crypto World!
Stay ahead with breaking news, expert analysis, and real-time updates on the latest trends in Bitcoin, altcoins, DeFi, NFTs, and more.
FAQs
Do insider stock sales always signal a lack of confidence in the company?
Not necessarily. Executives often sell shares for diversification, tax planning, or liquidity reasons. When trades are made under pre-arranged plans, they are typically structured to avoid reacting to short-term market developments.
Could these sales affect how institutional investors view Coinbase?
Institutional investors usually examine broader fundamentals such as revenue trends, trading volumes, and regulatory outlook. However, sizable insider sales can influence short-term sentiment, particularly during periods of market uncertainty.
What should investors watch next regarding Coinbase?
Market participants will likely focus on upcoming earnings results, forward guidance, and crypto trading activity trends. Analyst revisions and macroeconomic conditions could also shape near-term stock performance.
The American Bankers Association (ABA), the largest banking lobby in the United States, has asked the OCC to immediately pause national bank charter reviews for crypto firms. Ripple, Coinbase, Circle, and several others are directly affected.
In a letter to the Office of the Comptroller of the Currency, the ABA said the process should be put on hold until Congress finishes writing the rules these companies will operate under.
“We urge the OCC to be patient, not measure its application decisioning progress against traditional timelines, and allow each charter applicant’s regulatory responsibilities to come fully into view before moving a charter application forward,” ABA said.
Why Is the ABA Pushing Back?
The GENIUS Act, the federal stablecoin law, requires five agencies to complete their own rulemaking before it’s fully implemented. That includes the OCC, Treasury, Federal Reserve, FDIC, and state regulators.
The ABA says that process is likely still years away, making it too early to approve charters based on compliance with a law that isn’t finished yet.
The association also raised concerns about insolvency risk. If a crypto firm with an OCC charter goes under, the OCC would be responsible for handling the fallout.
“Entities engaged in activities substantially similar to those in which some recent OCC charter applicants presumably intend to engage have failed suddenly and for reasons that have resulted in meaningful losses – not only for the broader financial services industry but consumers, too.”
They pointed to FTX, which misused roughly $8 billion in client funds, and Celsius, which had a $1.2 billion deficit on its balance sheet, as reasons the current system may not be ready.
Which Crypto Firms Could Be Affected?
Ripple is at the top of the list. The OCC granted the XRP issuer conditional approval last month, which drew immediate opposition from the ABA. World Liberty Financial also filed to become a federally chartered national trust bank, a move that led Senator Warren to call for a halt.
Other firms waiting in the queue include Circle, BitGo, Paxos, Coinbase, and Nomura’s Laser Digital.
What Comes Next?
The ABA also pushed for a naming rule change. They want crypto firms that only handle trust or fiduciary activities to be barred from using “bank” in their name, arguing it could mislead consumers and damage public confidence in the banking system if one of these entities fails.
With the regulatory framework still incomplete and traditional banks pressing the OCC to slow down, the path to a national crypto bank charter just got a lot harder for these firms.
Never Miss a Beat in the Crypto World!
Stay ahead with breaking news, expert analysis, and real-time updates on the latest trends in Bitcoin, altcoins, DeFi, NFTs, and more.
FAQs
What would a delay in OCC charter approvals mean for crypto companies?
A pause could slow expansion plans, limit access to certain federal banking privileges, and delay partnerships with traditional financial institutions. Firms may need to continue operating under state licenses or alternative structures while waiting for clarity.
How could this debate affect consumers using crypto-linked financial services?
Regulatory uncertainty may delay the rollout of new banking-style products tied to digital assets. At the same time, a slower approval process could lead to stricter oversight, potentially offering stronger consumer protections in the long term.
Why does the use of the word “bank” matter in charter discussions?
In the U.S., the term “bank” carries legal and consumer trust implications tied to deposit insurance and federal supervision. Restricting its use could reduce confusion about what protections customers actually have if a firm faces financial trouble.
What factors will influence the OCC’s next move?
The agency will likely weigh input from industry groups, lawmakers, and other regulators while monitoring progress on federal rulemaking. Political pressure, financial stability concerns, and interagency coordination could all shape the final decision.
Binance confirmed that RLUSD deposits are now live, while withdrawals will be enabled soon.
Binance Enables RLUSD on XRP Ledger
Ripple’s senior executive, Reece Merrick, said the exchange has finalized the technical integration of Ripple USD (RLUSD) on the XRP Ledger network.
This integration makes RLUSD easier to transfer on the XRP Ledger, which is known for fast and low-cost transactions. This helps traders and institutions that need quick payments and stable value.
Binance also offers trading pairs such as RLUSD/USDT, RLUSD/U, and XRP/RLUSD, helping to boost liquidity and usage within its ecosystem. The exchange even introduced zero trading fees for selected RLUSD pairs.
Following the RLUSD Integration, users can now generate deposit addresses and transfer RLUSD directly through the XRP Ledger. Meanwhile, withdrawals will be enabled once there is enough liquidity on the network.
Even before Binance, RLUSD was already listed on major exchanges like Bitstamp, Kraken, Gemini, and Bitget.
In total, it is now available on more than 16 exchanges worldwide, helping increase adoption among both retail and institutional users.
RLUSD sees Growth and Stability
Ripple’s stablecoin RLUSD has grown steadily since its launch in December 2024. Its market cap is now above $1.52 billion, while the price continues to stay close to $1, moving in a tight range.
Meanwhile, RLUSD is backed 1:1 by U.S. dollar deposits, Treasury bills, and other liquid assets under a New York Department of Financial Services (NYDFS) trust charter.
Reports show its reserves are over 103% of its total supply, which adds strong trust and credibility.
Never Miss a Beat in the Crypto World!
Stay ahead with breaking news, expert analysis, and real-time updates on the latest trends in Bitcoin, altcoins, DeFi, NFTs, and more.
FAQs
What does Binance’s RLUSD integration on XRP Ledger mean for users?
It allows users to deposit RLUSD via XRP Ledger, trade new pairs, and access fast, low-cost transfers with improved liquidity on Binance.
Is RLUSD fully backed and regulated?
Yes. RLUSD is backed 1:1 by U.S. dollars, Treasury bills, and liquid assets under a NYDFS trust charter, with reserves exceeding supply.
When will RLUSD withdrawals be available on Binance?
Withdrawals will be enabled once sufficient on-chain liquidity is established to ensure smooth and reliable transfers for users.
How can users earn yield on RLUSD on Binance?
RLUSD is supported in Binance Simple Earn, offering flexible yield options with no fixed lock-up period for added convenience.
Bitcoin sentiment has weakened as the market continues its correction after reaching nearly $120,000. Since that peak, BTC price has struggled to regain strength, and many analysts believe the decline may not be over.
Unlike previous bull markets that ended with sharp spikes and sudden crashes, this cycle has been different. Instead of a dramatic fall, Bitcoin has been slowly trending lower. This steady drop has frustrated many investors and created what some describe as a slow and exhausting bear market.
Now, several market experts believe Bitcoin could revisit much lower levels before finding a strong bottom.
Could Bitcoin Price Drop to $40,000?
Crypto analyst Benjamin Cowen recently said that Bitcoin is still in a bear phase and may fall toward $40,000 if past patterns repeat.
According to Cowen, Bitcoin’s latest peak came around day 1,062 of its market cycle. This timing is similar to previous cycle tops, which suggests the broader four-year Bitcoin cycle may still be playing out.
When Could Bitcoin Bottom?
Cowen believes there is a 60% to 70% chance that Bitcoin will form its final bottom around October 2026. He sees May 2026 as the second most likely time for the market to reach its lowest point.
In past cycles, Bitcoin often reached its lowest point during April or May before starting a new recovery phase.
He also compared the current situation to 2019. At that time, Bitcoin peaked shortly before monetary policy tightened. Even after liquidity conditions improved, the price failed to recover immediately.
Is the Four-Year Bitcoin Cycle Still Valid?
In past cycles, Bitcoin has fallen heavily before recovering. In its early years, it dropped about 94%. In the last bear market, it fell around 77%. If Bitcoin declines 70% from its $120,000 high, the price would be near $40,000.
Current data also shows important levels in this range. The average buying price of holders is around $55,000, and another key support level is close to $40,000.
In earlier cycles, Bitcoin traded below these levels before forming a long-term bottom.
Another key indicator, which tracks how much Bitcoin supply is in profit versus loss, has not yet reached the level that historically signals full capitulation. That shift would likely happen if BTC trades in the $45,000 to $50,000 range.
Zacks Investment Research Chief Equity Strategist John Blank also told CNBC that Bitcoin bear markets usually last 12 to 18 months, and a move toward $40,000 remains technically possible.
Major firms such as Grayscale and Bernstein believe Bitcoin could reach a new all-time high in 2026. Some analysts suggest the market may now follow a five-year cycle instead of the traditional four-year pattern, which could delay the next major peak.
Bitcoin could remain under pressure through 2025 and 2026. Based on past cycles, $40,000 may act as a strong support level. While short-term weakness is possible, the long-term outlook still points to recovery. Investors may need patience before the next sustained bull run begins.
Never Miss a Beat in the Crypto World!
Stay ahead with breaking news, expert analysis, and real-time updates on the latest trends in Bitcoin, altcoins, DeFi, NFTs, and more.
FAQs
Could Bitcoin hit a new all-time high after this correction?
Historically, Bitcoin has reached new highs after major drawdowns. Long-term projections still expect another ATH post-bottom.
How low can Bitcoin realistically go this cycle?
Key technical zones sit between $40,000 and $50,000, where long-term holder cost bases and prior support levels converge.
Is Bitcoin expected to recover quickly after the bottom?
Past cycles show recoveries take time. Consolidation often follows the bottom before sustained bullish momentum returns.
What is Bitcoin price prediction for February 2026?
In February 2026, Bitcoin may trade between $50,000 and $75,000, with upside toward $80,000 if recovery momentum strengthens.
Price predictions for 2026 range from $15.00 to $15.00.
Arweave (AR) could extend toward $80.00 by 2030, if bullish structure is maintained.
Arweave (AR) has entered 2026 in a technically compressed structure, where price action reflects patience rather than momentum, yet beneath the surface, both structural positioning and long-term narrative strength suggest that the consolidation phase could be laying the groundwork for a broader expansion cycle. As a decentralized permanent storage protocol, Arweave continues to anchor itself within Web3 infrastructure conversations, and historically, infrastructure-layer tokens tend to move aggressively once liquidity rotates back into high-conviction assets.
Technically, AR has been trading inside a well-defined descending channel on the higher timeframe, forming consistent lower highs while defending macro support zones, which typically indicates controlled distribution transitioning toward accumulation. With one month of 2026 already completed, the market is now evaluating whether this compression resolves into a breakout phase capable of pushing AR toward the projected $15 mark by year-end.
As February 2026 progresses, Arweave AR continues to trade within the lower half of its descending channel structure, hovering around the $1.20–$2.00 range, where short-term moving averages are flattening and volatility has gradually contracted. The broader structure suggests that the $1.00 psychological level remains a critical defensive zone, and as long as weekly closes hold above this threshold, the probability of a structural rebound remains intact. Momentum indicators are neutral rather than bearish, which implies that sellers are losing dominance but buyers have yet to commit significant volume expansion.
If AR sustains above $1.80 and reclaims $2.20 with strong participation, the immediate upside extension could test the mid-channel resistance around $3.50–$6.00. However, failure to defend $1.00 would expose AR to a deeper retest toward $0.50 before any sustainable recovery attempt emerges. February, therefore, is less about explosive upside and more about confirming structural stability ahead of a potential breakout phase later in the year.
Arweave (AR) Price Prediction 2026
The 2026 outlook for Arweave is fundamentally tied to whether the descending channel resolves upward with expansion volume, as multi-month compression patterns often precede impulsive structural moves. If AR successfully breaks above the upper boundary of the channel near the $6.50–$7.00 region, a trend reversal confirmation could trigger accelerated upside momentum.
From a broader cycle perspective, AR reclaiming the $8.00–$10.00 zone would represent a structural shift from consolidation to expansion. Once that zone flips into support, liquidity inflows could drive price discovery toward the projected $15 target by late 2026, particularly if the broader altcoin market enters a rotational strength phase. However, the path will likely involve volatility and intermediate pullbacks. In a conservative scenario where resistance zones repeatedly reject price, AR may consolidate between $4.00 and $9.00 for several months before attempting a decisive breakout. The bullish thesis toward $15 remains valid as long as AR avoids a sustained breakdown below $1.50 on weekly timeframes.
Arweave Crypto Price Prediction 2026 – 2030
Year
Potential Low ($)
Potential Average ($
Potential High ($)
2026
4.00
9.50
15.00
2027
10.50
18.00
26.00
2028
18.00
32.00
45.00
2029
30.00
55.00
65.00
2030
40.00
60.00
80.00
Arweave (AR) Price Prediction 2026
In 2026, the Arweave price could project a low price of $1.00, an average price of $4.00, and a high of $15.00.
Arweave Price Prediction 2027
As per the Arweave Price Prediction 2027, Arweave may see a potential low price of $10.50. The potential high for Arweave price in 2027 is estimated to reach $26.00.
AR Price Prediction 2028
In 2028, Arweave price is forecasted to potentially reach a low price of $18.00 and a high price of $45.00.
Arweave (AR) Price Forecast 2029
Thereafter, the Arweave (Arweave) price for the year 2029 could range between $30.00 and $65.00.
Arweave (AR) Price Prediction 2030
Finally, in 2030, the price of Arweave is predicted to remain steadily positive. It may trade between $40.00 and $80.00.
The long-term projection assumes Arweave sustains relevance in enterprise blockchain use cases, with growth moderating over time as the asset matures.
Year
Potential Low ($)
Potential Average ($)
Potential High ($)
2031
55.00
85.00
110.00
2032
75.00
110.00
140.00
2033
90.00
130.00
165.00
2040
390.00
560.00
650.00
2050
1900.00
2500.00
2700.00
Arweave (AR) Price Prediction: Market Analysis?
Year
2026
2027
2030
Changelly
$13.20
$25
$78
CoinCodex
$12.00
$22
$70
WalletInvestor
$15.00
$28
$80
CoinPedia’s Arweave Price Prediction
Coinpedia’s price prediction for Arweave’s (AR) implies that AR price could reach a maximum of $15 by the end of 2026, provided breakout confirmation occurs above the $6.50–$7.00 region. If broader market momentum accelerates and AR successfully establishes a sustained bullish trend, the token could extend toward $80 by 2030. However, if AR fails to defend macro support near $2.50–$3.00 and broader liquidity conditions weaken, consolidation may extend longer than anticipated before a breakout attempt materializes.
Year
Potential Low ($)
Potential Average ($)
Potential High ($)
2026
4.00
8.00
15.00
Never Miss a Beat in the Crypto World!
Stay ahead with breaking news, expert analysis, and real-time updates on the latest trends in Bitcoin, altcoins, DeFi, NFTs, and more.
FAQs
What is Arweave (AR) price prediction for 2026?
Arweave could trade between $4 and $15 in 2026 if it breaks $7 resistance with strong volume and holds key support above $1.50 weekly.
What is the Arweave price prediction for 2027?
Arweave could trade between $10.50 and $26 in 2027 if bullish momentum continues and key resistance levels flip into support.
What is the AWR price prediction for 2030?
By 2030, AR (often searched as AWR) may range between $40 and $80, driven by Web3 growth and sustained market expansion.
How High Can Arweave Price Go In 2040?
If adoption accelerates and enterprise use expands, Arweave could potentially reach $650 by 2040 in a strong macro cycle.
Is Arweave a good long-term investment?
Arweave has long-term potential due to permanent storage utility, but price depends on adoption, liquidity, and market cycles.
Digital Currency Group CEO Barry Silbert believes a noticeable shift could be coming inside the crypto market. Speaking at Bitcoin Investor Week in New York, Silbert said that 5% to 10% of Bitcoin’s capital may eventually move into privacy-focused cryptocurrencies such as Zcash.
He remains bullish on Bitcoin and still sees it as a core portfolio holding. But he made it clear that Bitcoin’s size limits its explosive upside. According to Silbert, Bitcoin is unlikely to deliver 500x returns unless there is a complete collapse of the U.S. dollar. Smaller projects with focused use cases, like Zcash and even AI-driven network Bittensor, offer much higher return potential because they are earlier in their growth cycles.
Why Privacy Is Gaining Attention
Silbert’s argument revolves around financial privacy. He acknowledged that Bitcoin’s old narrative as anonymous digital cash no longer holds up. With blockchain analytics firms such as Chainalysis and Elliptic tracking transactions, Bitcoin is now highly transparent.
As more institutional capital enters crypto, regulatory oversight and compliance standards are increasing. That shift is creating a new dynamic. The more regulated and monitored the space becomes, the more valuable privacy technology may appear.
Silbert does not believe Bitcoin will meaningfully integrate strong privacy features. Because of that, he expects capital to flow toward networks that are designed with privacy at their core, especially those using zero-knowledge technology to protect transaction data.
Silbert’s comments carry weight because of DCG’s history in crypto. Grayscale, a DCG subsidiary, launched the first institutional Bitcoin investment vehicle in 2013. That product later became one of the most actively traded spot Bitcoin ETFs.
Grayscale also runs the Grayscale Zcash Trust, launched in 2017, and is working toward an ETF conversion. DCG has previously backed other privacy-focused projects as well. Silbert even suggested that Zcash could act as a long-term hedge against potential quantum computing risks to Bitcoin, though he does not see that threat as immediate.
Privacy Chain or Privacy Layer
Not everyone agrees that standalone privacy coins will dominate. Crypto user neural_gin argued that privacy is becoming a premium feature as regulations tighten, but questioned whether it needs its own blockchain.
He suggested that zero-knowledge proofs integrated into major networks like Ethereum or Solana could compete directly with projects like Zcash. In his view, privacy should be a feature users can switch on when needed rather than something tied to a separate token.
If even a small portion of Bitcoin capital rotates, the privacy sector could see renewed momentum. The real debate now is where that value ultimately lands.
Never Miss a Beat in the Crypto World!
Stay ahead with breaking news, expert analysis, and real-time updates on the latest trends in Bitcoin, altcoins, DeFi, NFTs, and more.
FAQs
Is Bitcoin still anonymous?
No, Bitcoin is no longer anonymous. Blockchain analytics tools like Chainalysis now make Bitcoin transactions highly transparent and traceable.
What are privacy-focused cryptocurrencies?
Privacy coins like Zcash use zero-knowledge technology to shield transaction data, keeping sender, receiver, and amount confidential.
Could tighter regulation make privacy coins harder to access?
Yes. Some exchanges may limit or delist privacy-focused tokens if compliance requirements increase. That could reduce liquidity in certain regions, even if global demand remains strong.
Who stands to benefit most if privacy demand rises?
Developers building compliance-friendly privacy tools, custodians offering secure storage, and funds creating regulated investment products could see increased activity. Exchanges may also adapt to balance user privacy with reporting rules.
Price predictions for 2026 range from up to $4.18.
Long-term forecasts suggest potential highs of $35.60 by 2030.
WLD price was almost $12 ATH but went crashing to $0.50 in the last remaining days of 2025. This has raised concerns among investors and traders about WLD’s future, and as a result, the Worldcoin price prediction 2026 has become a topic of significant discussion, with many being intrigued about its prospects in the coming year.
Its prolonged period of downtrend has left many wondering if the project’s initial buzz was fading. But, behind the scenes, Worldcoin is still quietly building its platform. Now, experts view Q1 2026 as a potential turning point where renewed momentum could be observed.
So many are now asking a crucial question: is this the start of a new chapter for Worldcoin? Will the project’s focus on decentralized identity and its connection to the AI sector be enough to fuel a powerful comeback and reclaim its spot in the market spotlight?
Let’s delve into the anticipated Worldcoin price predictions 2026 to 2030 and the years to come.
Entering 2026, in a bleeding state, wasn’t so sympathetic, as investors didn’t buy back at discounts; as a result, January and even February fell, slipping to $0.27 in February.
However, if the critical support at $0.31 fails to hold, the price may undergo further sideways stagnation or a retest of its floor near $0.24.
Worldcoin Price Prediction 2026
As 2026 dawned, the market found itself in a precarious position, struggling to regain its footing. Investor sentiment remained lackluster, with many refraining from seizing opportunities even as prices dipped to massive discounts. Consequently, the downward trend persisted into January and even February, with the price plummeting to a low of $0.27 by mid-February.
The situation remains precarious; should the crucial support level at $0.31 fail to withstand selling pressure, the price may not only linger in a phase of stagnation but could also reattempt a dip towards its critical floor around $0.24.
WLD On-Chain Analysis
The WLD Spot Average Order Size chart reveals persistent green clusters into January 2026, indicating sustained “Big Whale” participation. This heavy institutional accumulation suggests that smart money is aggressively building positions, viewing the current price range as a high-conviction entry point.
Similarly, development activity on Worldcoin is surging to new local highs in January 2026, showcasing intense builder commitment. This spike in innovation, combined with whale interest, creates a powerful fundamental divergence that historically precedes a massive price reversal.
WLD Price Forecast 2026 – 2030
Year
Potential Low ($)
Average Price ($)
Potential High ($)
2026
2.50
6.00
9.50
2027
7.00
11.25
15.70
2028
10.75
15.95
21.15
2029
15.65
21.60
27.50
2030
19.75
27.75
35.60
This table, based on historical movements, shows Worldcoin price to reach $35.60 by 2030 based on compounding market cap each year. This table provides a framework for understanding the potential Worldcoin price movements. Yet, the actual price will depend on a combination of market dynamics, investor behavior, and external factors influencing the cryptocurrency landscape.
Worldcoin Price Forecast 2026
Worldcoin’s price for 2026 is projected to range between $2.50 and $9.50, with an average price of approximately $6.00.
WLD Price Prediction 2027
Worldcoin’s price for 2027 is expected to fluctuate between $7.00 and $15.70, with an average price of around $11.25.
Worldcoin Price Forecast 2028
Worldcoin’s price for 2028 is anticipated to be between $10.75 and $21.15, with an average price of about $15.95.
WLD Token Ai Price Forecast 2029
Worldcoin’s price for 2029 is projected to vary from $15.60 to $27.50, with an average price of roughly $21.60.
Worldcoin AI Token Price Prediction 2030
Worldcoin’s price for 2030 is expected to fluctuate between $19.75 to $35.60, with an average price of approximately $27.75.
Market Analysis
Firm Name
2026
2030
Swapspace
$1.30
$2.07
coincodex
$2.40
$4.30
DigitalCoinPrice
$3.02
$4.06
*The targets mentioned above are the average targets set by the respective firms.
Never Miss a Beat in the Crypto World!
Stay ahead with breaking news, expert analysis, and real-time updates on the latest trends in Bitcoin, altcoins, DeFi, NFTs, and more.
FAQs
What is Worldcoin?
Worldcoin is a cryptocurrency project aiming to distribute digital assets to a global audience through a unique identity-verification system.
What is the current price of 1 Worldcoin?
At the time of writing, the price of one WLD token was $ 0.00349731.
What is the Worldcoin price prediction for 2026?
WLD price forecasts for 2026 suggest a potential range between $2.50 and $9.50, depending on market recovery and technical breakouts.
What is the Worldcoin price prediction for 2030?
Long-term models suggest WLD could trade from about $19.75 to $35.60 by 2030 under bullish conditions.
What is the Worldcoin price prediction for 2040?
While speculative, extended growth forecasts envision potential for WLD beyond 2040 based on adoption and tech use cases.
Is Worldcoin a good long-term investment?
Worldcoin offers long-term potential due to its focus on decentralized identity and AI, but it remains volatile and requires risk awareness.
What factors influence WLD price the most?
WLD price is driven by AI narrative strength, user adoption, token supply dynamics, market sentiment, and overall crypto market trends.
Strategy Inc., the largest corporate holder of Bitcoin, is preparing to issue more perpetual preferred shares to attract investors who want Bitcoin exposure without sharp stock price swings.
Meanwhile, the move comes as its stock swings sharply with Bitcoin, and the company looks for safer, yield-based funding options tied to its digital asset treasury strategy.
Strategy Introduces 11.25% Yield Preferred Shares
In a recent interview, Phong Le said that Strategy plans to issue new perpetual preferred shares to address investor concerns about sharp price swings in its common stock. The company’s shares often move more aggressively than Bitcoin itself, both up and down, because its business model is closely tied to the cryptocurrency.
To reduce this volatility risk, the company is introducing a new preferred share product called “Stretch.”
JUST IN: STRATEGY’S $STRC PREFERRED STOCK IS NOW BACK TRADING ABOVE $100
Unlike common shares that fluctuate heavily with Bitcoin’s price, this product is designed as a more stable, yield-focused option for investors. The preferred shares offer a monthly reset dividend rate of approximately 11.25% and are structured to trade at a $100 face value.
The new preferred share push comes as Strategy’s common stock (MSTR) has fallen nearly 20% over the past month, recently trading near $125.
By using more preferred shares instead of common stock, the company can raise funds with less dilution. Recently, Strategy raised about $370 million through common shares and only around $7 million through preferred shares for Bitcoin purchases.
This approach may help protect Bitcoin per share value and avoid selling common stock at discounted prices.
Strategy Holding Bitcoin With 12% Unrealized Loss
Despite all, Strategy holds 714,644 BTC on its books, valued at around $48 billion at recent prices. The firm’s average purchase cost is $76,052 per BTC.
With Bitcoin trading near $67,000, the holdings currently show an estimated unrealised loss near 12%, equal to roughly $5 billion on paper.
Perhaps, executives have said this drawdown does not change their long-term accumulation plan.
Never Miss a Beat in the Crypto World!
Stay ahead with breaking news, expert analysis, and real-time updates on the latest trends in Bitcoin, altcoins, DeFi, NFTs, and more.
FAQs
What is Strategy’s new Stretch preferred share?
It’s a perpetual preferred share with an 11.25% monthly reset dividend and $100 face value, designed for stable Bitcoin-linked income with less volatility than common stock.
How much Bitcoin does Strategy hold?
Strategy holds 714,644 BTC, purchased at an average of $76,052 per coin, currently valued near $48 billion with an unrealized loss of about 12%.
What is the dividend on Strategy’s new preferred shares?
The Stretch preferred shares offer a monthly reset dividend rate of approximately 11.25%, paid to investors seeking yield over capital gains.
Why is Strategy issuing more preferred shares now?
To reduce stock dilution, raise stable funding, and offer investors a less volatile way to gain Bitcoin exposure without the sharp swings of common shares.
The live price of the MANA crypto token is $ 0.10038550.
Price predictions for 2026 range from $0.247 – $0.40.
By 2030, the MANA price could surge toward $4.90 due to growing trader activity.
Decentraland (MANA) is one of the earliest and most recognizable names in the metaverse sector. Built on Ethereum, Decentraland allows users to own virtual land, create experiences, and participate in a digital space using its native token, MANA.
While the overall metaverse narrative has cooled since its 2021 peak, Decentraland continues to maintain an active ecosystem focused on virtual events, social experiences, and creator-led development.
If you’re curious about Decentraland’s future and wondering whether MANA is a good investment, this MANA price prediction 2026–2030 will walk you through its potential growth and long-term outlook.
MANA cryptocurrency has experienced a 98% decline since the FTX crash in 2021. However, it is showing remarkable resilience. The critical support level established in early 2021 is essential. If MANA can rise and close above $0.35 in the first quarter of 2026, it could set the stage for an impressive 1,000% increase, making a $1.00 target price for the year not just possible, but highly attainable.
Decentraland (MANA) Price Prediction 2026
MANA crypto’s multi-year performance chart reflects a dramatic 98% decline since the FTX crash in 2021, leading many enthusiasts and investors to speculate about the project’s potential end.
This sharp price depreciation has instilled fear among investors, who have witnessed continuous negative price action for years. However, it is essential to consider the historical support level that has been in place since early 2021, which warrants attention despite the recent stagnation in price movement.
Although the project has experienced considerable setbacks over the past half-decade, there still remain arguments for a potential revival. The primary argument is the avoidance of delisting from several exchanges, indicating that MANA/USD continues to pursue efforts aimed at market recovery and still retains decent liquidity in a project with an over $250 million market cap.
Thus, the current retest of this support level is particularly noteworthy. A reversal at this juncture could result in substantial upward momentum. Conversely, if this support range is breached, it would likely reinforce perceptions of MANA crypto as a failing venture.
That said, it is crucial to closely monitor the $0.35 level. Should MANA successfully breach this level and maintain above it with a weekly close, this would signify a significant “Change of Character” for the price dynamic. Under such circumstances, a conservative target of $1.00 for the year may be warranted.
Price Prediction
Potential Low ($)
Average Price ($)
Potential High ($)
2026
0.95
1.45
1.95
MANA On-chain Analysis
MANA’s exchange reserves have plummeted from 606M to 312M tokens, a massive 48% supply drain signaling aggressive accumulation. This consistent liquidity exit creates a powerful supply-crunch, drastically reducing sell-side pressure and preparing the asset for a significant parabolic breakout as market demand grows.
Furthermore, a bullish transfer of wealth is underway. While retail holders dump their positions, institutional whales holding 10M–1B tokens are absorbing the supply. This shift from weak to strong hands confirms deep conviction among major players, providing a solid floor for MANA’s future growth.
Decentraland MANA Price Prediction 2026 – 2030
Price Prediction Years
Potential Low ($)
Average Price ($)
Potential High ($)
Decentraland (MANA) Price Forecast 2026
0.95
1.45
1.95
MANA Token Price Forecast 2027
1.55
2.15
2.85
Decentraland Price Analysis 2028
2.45
3.05
3.65
Decentraland Price Prediction 2029
3.55
3.95
4.35
MANA Price Prediction 2030
4.15
4.65
5.15
Decentraland (MANA) Price Forecast 2026
According to forecast prices and technical analysis, Decentraland’s price is projected to reach a minimum of $0.95 in 2026. The maximum price could hit $1.95, with an average trading price of around $1.45.
MANA Token Price Forecast 2027
Looking forward to 2027, MANA’s price is expected to reach a low of $1.55, with a high of $2.85 and an average forecast price of $2.15.
Decentraland Price Analysis 2028
In 2028, the price of a single Decentraland is anticipated to reach a minimum of $2.45, with a maximum of $3.65 and an average price of $3.05.
Decentraland Price Prediction 2029
By 2029, Decentraland’s price is predicted to reach a minimum of $3.55, with the potential to hit a maximum of $4.35 and an average of $3.95.
Decentraland (MANA) Price Prediction 2029
In 2030, the MANA coin price is predicted to touch its lowest price at $4.15, hitting a high of $5.15 and an average price of $4.65.
What Does The Market Say?
Year
2026
2027
2030
CoinCodex
$0.26
$0.39
$0.67
Tokenmetrics
$0.78
$1.41
$2.11
DigitalCoinPrice
$0.33
$0.61
$3.32
Never Miss a Beat in the Crypto World!
Stay ahead with breaking news, expert analysis, and real-time updates on the latest trends in Bitcoin, altcoins, DeFi, NFTs, and more.
FAQs
What is Decentraland (MANA) and how does it work?
Decentraland is a virtual world on Ethereum where users buy land, create experiences, and trade using the MANA token.
What is the predicted price of MANA in 2026?
MANA could trade between $0.247 and $0.40 in 2026, with potential upside if it maintains key support and adoption grows.
What is Decentraland’s price prediction for 2030?
By 2030, MANA could reach a high of $4.92, a low of $4.15, and an average price of $4.65, reflecting adoption and growing metaverse use.
How high could MANA price go in 2040?
Over the long term, MANA may see substantial growth if adoption and virtual land demand expand, potentially reaching a high of $12–$15 by 2040.
What drives the price of MANA?
MANA’s price is influenced by virtual land demand, user growth, creator tools, and on-chain activity in Decentraland.
Can Decentraland compete with other metaverse projects?
Yes, if Decentraland expands events, gaming, and creator tools, it could attract more users and remain a top metaverse platform.
Price predictions suggest that ALGO has the potential to hit $0.65 to $1.35 by the end of 2026.
Long-term forecasts indicate potential highs of $5.65 by 2030.
Algorand’s strong push for scalability, security, and decentralization is paying off. With the launch of AlgoKit 3.0 in Q1 2025 and growing developer interest, ALGO adoption has improved and is now on the rise. The rising adoption is beneficial for an asset, as it is directly proportional to a token’s price.
But the big question for intrigued market participants still remains: Can ALGO Price hit $1 this cycle? Read our in-depth Algorand Price Prediction 2025 and long-term outlook through 2030 to find out.
Algorand (ALGO) has been trading sideways since 2022, a stark contrast to its 2021 growth. If demand increases, it could target $0.60 or $0.80 by mid-2026. But, a weekly close at $0.80 may lead to further gains, potentially reaching $2.0 or even $3.0, yielding over 2200% returns.
Algorand February Price Prediction 2026
In January, it lost the $0.1125 support level and fell to $0.0806 by February. Despite a multi-year demand area, the impact has been muted, and February appears likely to trade within this range for an extended period. Based on its price action, if $0.1050 is breached, it could aim for $0.1300 by the end of February. However, if the decline continues, it might slide back to $0.0806 or even lower.
ALGO Price Analysis 2026
Looking ahead through 2026, the secondary indicator chart suggests a cautious recovery rather than an immediate vertical moonshot. Technical indicators like the RSI are hovering in neutral territory (35−45), indicating that while the “extreme fear” has subsided, the momentum is not yet in a full-blown bull regime.
Most analyst models and indicator trends project ALGO to fluctuate between $0.12 and $0.19 for the first half of the year as it tests overhead resistance. If the network’s push into real-world asset tokenization gains traction, a successful breakout above the 200-day SMA could open the door for a year-end target near $0.25 – $0.30.
However, failure to hold the $0.10 support would likely result in further consolidation near the $0.08 all-time low.
AVAX Onchain Outlook
The on-chain outlook for Algorand (ALGO) is flashing bullish signals that suggest a transition from retail-led speculation to institutional-grade accumulation. A notable increase in average order sizes indicates that “whale” investors are actively participating, effectively absorbing supply during consolidation phases to reduce downside risk.
Simultaneously, the 90-day Cumulative Volume Delta (CVD) has entered a “Taker Buy Dominant” phase, which historically correlates with upward price movement as aggressive buyers consistently outpace sellers in the open market. These metrics, paired with a “cooling” spot and futures volume bubble map, suggest the market is moving through a healthy period of stabilization and building the necessary liquidity for a potential breakout.
Algorand Price Targets 2026 – 2030
Year
Potential Low ($)
Potential Average ($)
Potential High ($)
2026
0.65
1.0
1.35
2027
0.90
1.50
2.00
2028
1.40
2.10
2.90
2029
1.75
2.95
4.15
2030
2.50
4.05
5.65
Algorand (ALGO) Price Forecast 2026
Moving forward to 2026, the ALGO price may record a maximum price of $1.35. With a potential low of $0.65, the average price could settle at around $1.0.
ALGO Coin Price Projection 2027
Looking ahead to 2027, the Algorand crypto token may range between $0.90 and $2.0. With this, the average trading price could settle at around $1.50 for the year.
Algorand Crypto Price Action 2028
In 2028, the ALGO coin with a potential surge could reach a high of $2.90, a low of $1.40, and an average of $2.10.
ALGO Token Price Analysis 2029
Moving into 2029, the Algorand coin could range between $1.75 and $4.15. Considering the buying and selling pressure, the average price could settle at around $2.95.
ALGO Price Prediction 2030
By 2030, the value of a single Algorand token could reach a high of $5.65, a low of $2.50, and an average of $4.05.
Market Analysis
Firm Name
2025
2026
2030
Currencyanalytics
$0.67
$0.97
$4.06
Priceprediction.net
$0.18
$0.258
$1.10
DigitalCoinPrice
$0.82
$1.28
$2.60
Never Miss a Beat in the Crypto World!
Stay ahead with breaking news, expert analysis, and real-time updates on the latest trends in Bitcoin, altcoins, DeFi, NFTs, and more.
FAQs
What is the Algorand price prediction for 2026?
Algorand’s price in 2026 is forecasted between about $0.65 and $1.35, with an average near $1 if momentum and adoption improve.
What is the ALGO price prediction for 2027?
In 2027, ALGO may range from $0.90 to $2.00, with an average price around $1.50, depending on market demand and adoption.
How much will Algorand (ALGO) be worth in 2030?
By 2030, ALGO could reach a high of $5.65, a low of $2.50, and an average price of $4.05, reflecting growing adoption.
How much will Algorand be worth in 10 years?
Over the next 10 years, ALGO could reach $5.65 at its peak, driven by network growth, adoption, and real-world asset tokenization.
What factors influence Algorand’s price growth?
Network adoption, scalability, institutional participation, and real-world asset tokenization are key factors driving ALGO’s price potential.
The live price of the Polygon coin is $ 0.21819891.
POL price predictions for 2026 suggest potential highs of $0.7548.
Long-term forecasts indicate POL could reach $4.94 by 2030.
Polygon (POL) has a mind-blowing Layer-2 scaling solution project for Ethereum, which is primarily designed to address slow speeds and the network’s high transaction fees.
As a result, Polygon is seen as a revolutionary framework for developers and users, as it attracts by offering a more efficient Ethereum experience, which is the reason contributing to POL’s price value, too.
Through, POL, which is its native token (formerly MATIC), is utilized for transaction fees and network governance, in the framework of interconnected Ethereum-compatible blockchain networks.
Its use case makes it an attractive altcoin, and even its token POL price is attracting attention. The coin is expected to show a surge in the coming sessions, but it would require a technical eye to understand.
Therefore, if you are curious about whether the POL price can rebound to $1. Will Polygon go up? And is Polygon a good investment? We bring our Polygon Price Prediction for 2025 – 2030 to explore the POL price prediction.
In 2025 and 2026, prices fell, reaching $0.0850 within a narrowing wedge. A breakout above this level could lead to $0.19, $0.30, and $0.42. Without improving sentiment, declines in the POL price may continue.
Polygon Price Prediction 2026
In 2025, we saw notably pessimistic price action, a trend that continued into 2026, with prices following the same downward trajectory.
The price has been moving within a narrowing falling wedge, and by February, it reached $0.0850, which coincides with the lower edge of the channel. This level is crucial for the POL/USD pair because if demand returns, the narrowing range could be broken, potentially allowing a retest of $0.19. A decisive breach above this level would signal a breakout from the falling wedge pattern, opening the way for higher price levels, such as $0.30 and $0.42.
However, if sentiment does not improve as expected, the falling wedge may continue to narrow until it encounters demand. Given the current market drawdown, the likelihood of the POL price continuing to decline remains high.
Year
Potential Low ($)
Potential Average ($)
Potential High ($)
Polygon Price Action 2026 (conservative)
$0.10
$0.26
$0.53
POL On-Chain Analysis
The on-chain landscape for POL is flashing a major recovery signal as the 30-day moving average of Daily Active Addresses (DAA) shows a clear and sustained upward trend in early 2026.
This metric serves as the vital heartbeat of the ecosystem, indicating that organic utility and user engagement are returning to the network at a steady, reliable pace. Unlike temporary spikes that often signal speculative noise, a rising 30-day average suggests a strengthening network effect and a growing demand for blockspace.
For investors, this return of on-chain activity is a fundamental precursor to price appreciation, as it confirms that the ecosystem is not only retaining its base but actively expanding its reach.
Complementing this surge in network activity is a powerful development in supply distribution, specifically within the “whale” and institutional cohorts. Addresses holding between 100,000 and 10 million POL have seen significant growth, signaling a phase of high-conviction accumulation by “smart money.”
This specific bracket often represents mid-to-large-scale investors who lead market cycles by absorbing supply during consolidation phases. This strategic positioning by larger entities reduces sell-side pressure and creates a robust fundamental floor for the asset.
When rising active addresses align with such aggressive whale accumulation, it speaks a definitively bullish language for the POL trajectory, suggesting that the most influential market participants are preparing for a major expansion in value.
Polygon Price Prediction 2026 – 2030
Year
Potential Low ($)
Potential Average ($)
Potential High ($)
Polygon Price Action 2026
$0.18870
$0.47179
$0.75488
POL Price Prediction 2027
$0.30194
$0.75488
$1.20782
Polygon Crypto Price Forecast 2028
$0.48311
$1.20782
$1.93252
POL Coin Price Projection 2029
$0.77297
$1.93252
$3.09205
Polygon Price Prediction 2030
$1.23676
$3.09205
$4.94729
This table, based on historical movements, shows POL price to reach $4.94 by 2030 based on compounding market cap each year. This table provides a framework for understanding the potential POL price movements. Yet, the actual price will depend on a combination of market dynamics, investor behavior, and external factors influencing the cryptocurrency landscape.
Polygon Price Action 2026
Anticipating further expansion, MATIC’s potential high for 2026 is projected to be $0.75488, while the potential low is estimated at $0.18870, resulting in an average price of $0.47179.
POL Price Prediction 2027
MATIC crypto can make a potential high of $1.20782 in 2027, with a potential low of $0.30194, leading to an average price of $0.75488.
Polygon Crypto Price Forecast 2028
As the POL price progresses, the potential high price for 2028 is projected to be $1.93252, with a potential low of $0.48311, resulting in an average price of $1.20782.
MATIC Coin Price Projection 2029
Polygon coin price potential high for 2029 could be $3.09205, while a potential low of $0.77297, with an average price of $1.93252.
Polygon Price Prediction 2030
With an established position in the market, POL’s potential high for 2030 is projected to be $4.94729. On the flip side, a potential low of $1.23676 will result in an average price of $3.09205.
Market Analysis
Firm Name
2025
2026
2030
CoinCodex
$ 0.71
$ 0.50
$ 0.90
Binance
$0.24
$0.26
$0.31
Flitpay
$6.25
$4
$10.4
Never Miss a Beat in the Crypto World!
Stay ahead with breaking news, expert analysis, and real-time updates on the latest trends in Bitcoin, altcoins, DeFi, NFTs, and more.
FAQs
Is Polygon (POL) a good long-term investment?
Polygon is considered a strong long-term project due to its Ethereum scaling role, active development, and growing ecosystem, but it still carries market risk.
What is the Polygon price prediction for 2026?
For 2026, POL price forecasts suggest a potential range between $0.10 and $0.75, depending on market recovery and technical breakout patterns.
Can Polygon reach $5 by 2030?
Some long-term projections indicate POL could approach $4–$5 by 2030 if adoption accelerates and the crypto market enters a sustained growth cycle.
What factors affect Polygon (POL) price the most?
POL price is influenced by Ethereum demand, network usage, market liquidity, macroeconomic trends, and overall investor sentiment in crypto markets.
The live price of The Graph crypto is $ 0.02696719.
Price predictions for 2026 range from $0.05 to $1.75.
In 2030, GRT may hit a high of $3.55, reflecting long-term growth.
AI may be taking center stage in today’s tech revolution, but behind every smart application lies the challenge of accessing and organizing reliable data. That’s where The Graph (GRT) steps in—an innovative indexing protocol transforming how blockchain data is queried.
As interest in The Graph surges, especially after its major 2025 upgrades and the launch of substreams-powered subgraphs, the question on everyone’s mind is: Can GRT price reach $1? In this article, we break down its technical potential, rising developer adoption, and market sentiment in our detailed The Graph Price Prediction 2026–2030.
In 2026, it fell below historical lows, reaching a new all-time low (ATL) of $0.0228, shaking investor confidence. It now has the potential to drop further, possibly forming a new ATL of $0.0100. However, if demand increases, $0.0400 could be revisited.
Why On-Chain Hints Flourishing Network and Ecosystem Growth In “The Graph”?
The Graph Network, has recently improved its fundamental growth, yet this strength is sharply diverging from its prolonged bearish GRT price action.
The network, is majorly used by developers and data consumers who pay to query data, is flourishing, per onchain. yet, the GRT remains significantly suppressed, presenting a notable contrast that is at the heart of its current analysis.
As per the data onchain, the performance of The Graph Network can be directly assessed by the growing “volume of queries” and the “accrual of query fees”.
In this context, the data reveals that over the last six months, its query volume has impressively reached 11.6 billion, which displays a clear sign of robust developer adoption that has been particularly fast since the network’s migration to Arbitrum.
Similarly, the query fees generated by data consumers on Arbitrum have also reached an all-time high of $8.11 million in August.
This success is supported by a large community of over 167,000 delegators and 7,204 active curators, all contributing to the network’s health.
In addition, the growing ecosystem is also in the spotlight by recent integrations with major brands like Tron, pointing to a strengthening on a fundamental level.
GRT Price Prediction 2026
For 2026, breaking below its historical lows was not what many investors were expecting, as assets, in particular, tend to show bullish momentum at historical lows based on a horizontal level.
But by February, it’s already breached this zone and marked a new STL of $0.0228, which has shaken investors’ trust massively. As this crypto shows no signs of improvement in its price action, in the worst-case scenario, it could even fall beneath the current ATL and mark a new one around $0.0100.
GRT On-Chain Analysis
Since the catastrophic decline from $2.15 in 2021, the total number of holders has continued to increase despite the significant price drop. This indicates that, over time, while the price has faced substantial setbacks, the community of believers in the project has been steadily growing.
Analyzing the supply on exchanges provides insight into the 2021 downturn, which can be attributed to the FTX crash and a remarkable influx of assets onto exchanges. In late 2020, exchange supply was below 250 million; however, by May 2023, it surged to 1.36 billion. This influx of supply exerted downward pressure on GRT’s price.
In contrast, the latter half of 2023 onwards has seen a consistent decline in exchange supply. By January 2026, this figure had fallen to 757.21 million almost half of the peak supply recorded on exchanges. This trend aligns with the sustained growth in total holders of GRT, clearly indicating accumulation.
GRT Coin Price Prediction 2026-2030
Year
Potential Low ($)
Potential Average ($)
Potential High ($)
2026
1.05
1.20
1.75
2027
1.55
1.70
2.15
2028
2.15
2.20
2.65
2029
2.25
2.70
3.25
2030
3.15
3.20
3.55
The Graph Price Targets 2026
By 2026, with continued adoption and network improvements, GRT could trade between $1.05 and $1.75, with an average price of approximately $1.20.
GRT Coin Price Prediction 2027
In 2027, GRT might range between $1.55 and $2.15, averaging around $1.70 as the network potentially sees increased usage and partnerships.
The Graph Token Price Prediction 2028
For 2028, GRT could trade between $2.15 and $2.65, with an average price of approximately $2.20, assuming continued growth in the blockchain indexing sector.
GRT Crypto Price Projection 2029
By 2029, GRT might range between $2.25 and $3.25, with an average trading price of $2.70, as the project matures and potentially captures a larger market share.
The Graph Price Prediction 2030
By 2030, GRT could potentially reach a high of $3.55, with a low of $3.15 and an average price of approximately $3.20, reflecting a decade of development and adoption.
What Does The Market Say?
Firm Name
2026
2030
Changelly
$0.320
$1.89
priceprediction.net
$0.493
$2.26
DigitalCoinPrice
$0.27
$0.58
Never Miss a Beat in the Crypto World!
Stay ahead with breaking news, expert analysis, and real-time updates on the latest trends in Bitcoin, altcoins, DeFi, NFTs, and more.
FAQs
What is the price of 1 GRT Token?
At the time of writing, the price of 1 The Graph Token was $ 0.02696719
What is the price prediction for GRT in 2026?
GRT price in 2026 may range from $0.05 in weak demand to $1.75 in strong demand, with an average target near $1.20.
What could The Graph (GRT) be worth in 2030?
By 2030, GRT could trade between $3.15 and $3.55 if adoption continues and the protocol becomes a core data layer for Web3.
Is The Graph (GRT) a good long-term investment?
GRT has strong fundamentals, growing developer adoption, and real utility, making it a promising long-term project, though price volatility remains high.
Can GRT reach $1?
Yes, based on network growth and adoption, some projections suggest GRT could reach between $1.05 and $1.75 by 2026, though market conditions will ultimately determine its price path.
In a decisive move signaling institutional confidence, a Solana whale swam into the Patos Meme Coin presale late Tuesday, executing a high-volume accumulation strategy that has rippled through the on-chain analytics community. Around 9:00 PM EST, smart money wallets tracked a massive inflow of capital into the Patos treasury, resulting in the purchase of nearly 8.1 Million $PATOS tokens across a series of three rapid-fire transactions. The most significant of these was a single buy order for 8.06 million tokens, effectively sweeping a large portion of the remaining daily liquidity (Transaction hash). This accumulation event arrives precisely as the project cements its status as the top crypto presale of February 2026, bolstered by record-breaking exchange confirmations.
The Smart Money Signal: Why Whales Are Buying Now
This specific Solana whale is not a novice speculator but a savvy crypto trader with a history of early entries into high-utility SPL tokens. This marks the third recognized crypto whale to buy into Patos Meme Coin over the past month, suggesting that FOMO (Fear Of Missing Out) is beginning to permeate the upper echelons of the DeFi community.
In the lifecycle of a top crypto presale, there is a distinct pattern: “Smart money” typically buys first during the initial rounds, securing the lowest cost basis (in this case, $0.000139999993). They recognize that the asymmetry of risk and reward is most favorable before the masses arrive. Novice buyers, conversely, tend to come in on the back-end—often after the token has listed on exchanges—allowing their potential profits to decay with the delay. However, the unique structure of the Patos presale suggests that even retail (common) investors who dollar cost average into the project at $10 to $30 per day are positioning themselves for substantial gains, riding the wake of the whales.
The Biconomy Catalyst: A Tier 2 Titan Enters the Chat
The whale’s aggressive entry appears to be a direct response to a major fundamental catalyst. On Tuesday morning at 11:11 AM (EST)—a timestamp aligning with the project’s “111” branding—Biconomy Crypto Exchangeofficially announced that Patos Meme Coin will be listed for spot trading immediately following the presale’s conclusion on June 26, 2026.
This announcement was expected to trigger more buying, and the market responded instantly. Biconomy is a heavyweight partner for a meme coin at this stage. It is currently ranked as the 27th biggest crypto exchange in the world by trading volume per CoinMarketCap. While categorized as a Tier 2 crypto exchange, its metrics indicate it is steadily moving towards becoming Tier 1.
Biconomy by the Numbers:
Daily Volume: Handles over $3.5 billion US dollars in spot trading daily.
Peak Volume: In the last 90 days, it hit a peak of nearly $14 billion in a single 24-hour period.
Reach: Reports serving over 10 million crypto traders and hosting over 4.5 million smart contracts.
The impact of the Biconomy listing on Patos Meme Coin during its debut week in Q3 2026 will be immense. The token will be paired with USDT, making access to the meme coin frictionless for Biconomy’s millions of global users. This significantly lowers the barrier to entry, increasing FOMO and spreading the Solana meme coin brand to markets that decentralized exchanges (DEXs) cannot reach.
Presale Velocity: Breaking Down the 822 Million
The on-chain data reflects a project in hyper-growth. Per the official tracker at PatosMemeCoin.com, the currently active token presale has sold over 822,000,000 tokens as of Day 52 of the event.
The financial commitment from the community is tangible. Investors have invested $115,149 accumulatively at the time of this report.This milestone cements Biconomy as the 8th centralized crypto exchange to confirm a listing, continuing Patos’ dominance over the entire crypto presale market. The project is effectively executing a “blitzscaling” strategy, en route to a record-breaking 111 crypto exchange debut.
The appetite for the token is undeniable. Over 74% of the initial round offering has been sold to investors, with at least three verified whales among them. Consequently, less than 26% of the initial allocation remains.
Breaking down the math reveals the intensity of the accumulation:
Total Raised: ~$115,149
Timeframe: 52 Days
Average Daily Investment: ~$2,214 USD
Using the Round 1 token price of $0.000139999993, we can see the token velocity:
Daily Token Sales (Avg): ~15.8 Million Tokens
However, following the Biconomy news and the whale entry, daily averages are appearing to grow past 25 million daily this week.
Forecast: The Compounding Curve
Based on the current acceleration, analysts have modeled the projected sales velocity. This creates a tangible “Fear Of Missing Out” for investors waiting on the sidelines.
It is vital for potential investors to compare the “time of start” of the Patos Presale to others in the market to truly understand its dominance and aggressive growth.
The Patos Meme Coin token presale launched on December 18th of 2024. It has achieved these milestones in under two months.In contrast, other token presales that boast similar raw numbers often hide a dirty secret: they have been “live” for 6 months, 9 months, or even a year. These projects are stagnant. The difference is critical because it demonstrates that Patos Meme Coin is using investor funding properly to secure tangible growth points. It stands as one of the presales with virtually no chance of a rug pull, as funds are visibly being channeled to proper destinations—liquidity providers and exchange compliance fees—rather than sitting idle in a creator’s wallet like other “zombie” coins.
The Flight from Legacy Memes
This surge in Patos occurs against a backdrop of struggle for the old guard. Shiba Inu (SHIB), Pepe (PEPE), and Bonk Inu (BONK) have dipped to all-time lows since Q4 of 2025.
This may be the primary reason why Patos Meme Coin is spiking. Investors are rational actors; they are looking for somewhere to park their funds that offers major growth potential. In a volatile bear cycle, a saturated asset cannot offer a 50x return. Investors are rotating capital out of these stagnant legacy coins and into the high-velocity Patos presale.
Table 2: Predicted Growth of $1,000 Investment (Now to June 2026)
Asset
Bearish Market (Value)
Normal Market (Value)
Bullish Market (Value)
Shiba Inu (SHIB)
$850 (-15%)
$1,100 (+10%)
$2,000 (+100%)
Pepe (PEPE)
$700 (-30%)
$1,200 (+20%)
$2,500 (+150%)
Bonk Inu (BONK)
$800 (-20%)
$1,300 (+30%)
$3,000 (+200%)
Patos ($PATOS)
$2,500 (+150%)
$8,500 (+750%)
$45,000 (+4,400%)
The “Magnificent 8” and the Moon Shot
Beyond breaching the 822 million tokens milestone, Patos Meme Coin is creating a structural moat. It is leading all Solana token presales with the most crypto exchange listing confirmations.
It now has 8 centralized exchanges committed to the debut: Biconomy, Azbit, BiFinance, Dex-Trade, BitStorage, Trapix, BitsPay, and CETOEX. This growing list solidifies the narrative that the entire crypto exchange ecosystem is moving closer towards Patos. This consensus is building speculative forecasts of a “crypto moon shot”—or perhaps even a “crypto Mars shot”—upon launch.
The Closing Window: Round 1 Supply Critical
It is imperative to restate that Patos Meme Coin is currently in Round 1. The token price is $0.000139999993.
Market strategists are funneling readers to PatosMemeCoin.com to buy now to avoid losing 8% of the future ROI. The price is slated to go up 8% in the second round of the presale. With only 26% of the Round 1 supply remaining and millions of tokens being sold daily, the window is closing.
The “Patos Flock” Phenomenon
Behind the financials is the “Patos Flock.” This hardcore subculture is actively raiding social media platforms from Reddit to X, creating a viral feedback loop. They repost, share, and meme the project into relevance, compounding brand value. This decentralized marketing army ensures that when Biconomy lists the token, there will be an army of thousands ready to trade, stake, and hold.
In closing, the Biconomy listing stands as the biggest crypto exchange listing confirmation for Patos Meme Coin thus far per CoinMarketCap rankings. Coupled with 3 other Top 50 exchanges, the validation from CEXs continues to increase.
The opportunity to buy Patos Meme Coin at the current Round 1 rate is coming to a close—possibly as soon as this week. With at least 3 Solana whales already investing in the project, it could close the first round as early as Monday, February 16th based on current compounding presales averages. The smart money has already made its move; the clock is now ticking for the rest of the market.
Charles Hoskinson has confirmed that LayerZero will be integrated into the Cardano blockchain, marking a major step in Cardano’s institutional expansion strategy. The announcement came during his keynote at Consensus Hong Kong 2026, where the Input Output CEO revealed that the institutional-focused protocol will be ported over to Cardano.
LayerZero has been positioning itself as infrastructure for institutional-grade financial markets and recently secured backing from Citadel Securities. Its arrival on Cardano signals a stronger push toward cross-chain interoperability and high-performance financial applications, areas increasingly critical for attracting large-scale capital.
USDCx Launch and Stablecoin Expansion
A key highlight of the partnership is the upcoming launch of USDCx on Cardano, with broad wallet and exchange support already planned. Hoskinson described the rollout as a milestone moment, bringing compliant and institution-ready stablecoin infrastructure to the network.
He emphasized that the integration will enable privacy-enhanced and immutable stablecoin functionality powered by zero-knowledge technology. The move aligns with Cardano’s long-term strategy of combining regulatory clarity with technical innovation. The announcement also coincided with the rollout of Midnight’s mainnet, strengthening Cardano’s privacy-focused ecosystem and expanding its utility stack.
Bear Market Sentiment, Bullish Long-Term Vision
Hoskinson directly addressed the ongoing market downturn during his speech, calling sentiment “at an all-time low.” In a lighthearted but symbolic gesture, he appeared wearing a McDonald’s uniform, referencing a popular crypto meme about bear markets.
Despite the short-term weakness, he maintained that the broader macro outlook for crypto remains bullish. According to Hoskinson, partnerships like LayerZero demonstrate that institutional development continues regardless of price action. Infrastructure building, he suggested, does not stop during downturns; it accelerates.
Market Signals and Related Activity
The timing of the integration is notable. Just days after LayerZero revealed plans to launch its own Layer 1 blockchain, Zero, a bankruptcy-linked Alameda Research wallet swapped approximately $24 million worth of Stargate (STG) tokens for LayerZero’s ZRO token. Arkham data shows 129.04 million STG, valued at $24.49 million, was exchanged for 11.14 million ZRO worth about $24.29 million.
While the move is tied to bankruptcy proceedings, it highlights growing market attention around LayerZero’s ecosystem.
Overall, Cardano’s LayerZero integration strengthens its position in the competitive Layer 1 race, expands its institutional toolkit, and signals that long-term ecosystem building continues even in challenging market conditions.
Never Miss a Beat in the Crypto World!
Stay ahead with breaking news, expert analysis, and real-time updates on the latest trends in Bitcoin, altcoins, DeFi, NFTs, and more.
FAQs
What is LayerZero integration on Cardano?
LayerZero integration brings institutional-grade cross-chain and financial infrastructure to Cardano, enabling high-performance apps and interoperability.
Why is LayerZero important for Cardano’s growth?
LayerZero adds institutional tools, cross-chain capabilities, and high-performance infrastructure, boosting Cardano’s adoption by large investors.
Does the LayerZero integration mean Cardano is preparing for a price recovery?
Not directly—it’s about long-term infrastructure. But such partnerships often signal growing utility and confidence, which historically support stronger market fundamentals over time.
Tether could soon become one of the top 10 buyers of U.S. Treasury bills, according to Bo Hines, CEO of Tether’s U.S. arm. The shift is being driven by explosive demand for USDT, the world’s largest stablecoin, and the launch of USAT, its new U.S.-compliant counterpart. Speaking at Bitcoin Investor Week, Hines signaled that as stablecoin issuance grows, so too will Tether’s appetite for short-term government debt.
USDT now has roughly $185 billion in circulation and serves an estimated 530 million users, adding about 30 million new users each quarter. To back this supply, Tether holds more than $122 billion in U.S. Treasury bills, accounting for over 83% of its reserves. At current levels, that places Tether among the top 20 global holders of U.S. government debt, between major sovereign nations like Germany and Saudi Arabia.
When Stablecoins Became a Profit Engine
The turning point for Tether’s influence came as interest rates surged globally. With higher Treasury yields, stablecoin reserves became significantly more profitable. According to The Kobeissi Letter, Tether reported $10 billion in profit in just the first nine months of 2025, supported by $137 billion in Treasury holdings, ranking it as the 17th-largest holder of U.S. debt at the time.
The model is simple but powerful: users mint USDT and receive a dollar-pegged digital token that pays no interest. Tether invests the underlying reserves into short-term Treasurys and captures the yield spread. In effect, stablecoin users provide zero-cost capital, while Tether earns interest on highly liquid government securities.
What Makes Tether the Top Choice?
Tether’s dominance stems from liquidity, global accessibility, and trust in redemption stability. USDT remains deeply integrated across exchanges, DeFi platforms, and emerging markets, making it the primary on-chain dollar substitute. The introduction of USAT, issued through Anchorage Bank and structured under the U.S. GENIUS Act, further strengthens its regulatory positioning. USAT is designed to meet strict 1:1 high-quality asset backing requirements, signaling alignment with U.S. compliance standards.
This dual-token approach, global USDT and compliant USAT, reinforces Tether’s reach across both offshore and regulated markets.
Crypto and Market Impact
Tether’s growing Treasury footprint links crypto liquidity directly to U.S. debt markets. As stablecoin supply expands, so does demand for Treasurys, effectively turning crypto adoption into a driver of sovereign debt buying.
However, rising scrutiny is emerging around whether stablecoin issuers should share yield with users. Competitors like Jupiter’s $JUPUSD aim to redistribute Treasury returns on-chain. If that model gains traction, it could reshape the stablecoin landscape and challenge Tether’s high-margin dominance.
The cryptocurrency market is experiencing sharp volatility today, wiping out billions of dollars in value within hours as both global stocks and digital assets move lower together.
The total crypto market has lost nearly $90 billion, pushing many major coins to their daily lows. At the same time, U.S. stock indices also slipped, showing that investors are becoming more careful across financial markets.
Major cryptocurrencies fall quickly
Bitcoin dropped below $66,000, falling nearly $3,000 in about one hour, which triggered roughly $70 million in long-position liquidations. Ethereum also declined, touching around $1,900, while several altcoins posted losses between 4% and 7%.
BREAKING: Bitcoin dumped $3,000 in just 60 minutes and liquidated $70 million in longs.
Market sentiment has turned extremely weak, with the Fear and Greed Index falling into “extreme fear” territory, a signal that traders are becoming more defensive and risk-averse.
Why the market is falling
Analysts say several factors are driving today’s crypto decline:
1. Stock market weakness Major U.S. indices such as the S&P 500, Nasdaq, and Russell 2000 moved lower, and crypto markets often follow the same direction, especially during uncertain economic periods.
2. Liquidations accelerating the drop As prices started falling, leveraged traders were forced to close positions, causing additional selling pressure and faster price declines.
3. Bitcoin behaving like tech stocks A recent report from Grayscale Investments said that Bitcoin is currently moving more like high-growth technology stocks rather than a traditional safe-haven asset such as gold. This means that when technology stocks face pressure, crypto prices often fall as well.
Oversold signals appear
Despite the sharp drop, some technical indicators show that the market is approaching oversold levels, which sometimes leads to short-term rebounds. However, analysts warn that volatility may continue until investors regain confidence and buying demand returns.
The Uniswap price chart just printed a sharp 15% intraday rise, and this time it’s not just retail noise. Infact, Whale transaction counts have spiked aggressively and the timing is hard to ignore. UNI recently tapped $2.35, a level closely aligned with late-2020 support zones. Now, heavy capital is stepping in post BlackRock news.
Is the rise from UNI’s lowest point in years a Coincidence? Maybe or Maybe not. let’s look closer for a much clearer perspective.
Why Whales Are Moving & Buying in Sync in Uniswap crypto
Over the past 24 hours, based on Santiment onchain data, 10 addresses have executed transactions exceeding $1 million. At the same time, more than 175 addresses moved over $100K each, both are classified as whale transactions. That’s not random liquidity shuffling, infact that’s concentrated involvement.
Meanwhile, whale cohorts holding between 1,000 and 1 million UNI have increased their balances. In plain terms, larger players aren’t just trading the bounce they’re mass accumulating.
On the Uniswap price chart, this activity coincides with price stabilizing near long-term structural support. And while broader market sentiment remains fragile, this sort of synchronized whale behavior tends to precede volatility one way or another.
Network Activity Rebound Supports Bullish View For Uniswap price
Now here’s where it gets interesting. Daily active addresses jumped to 1,853 from around 1,150 in prior days. That’s a material uptick in on-chain participation. Interest in Uniswap crypto isn’t just speculative but real users are interacting again and that’s the most positive thing happened.
At the same time, the 30-day MVRV ratio has improved. That metric essentially tracks whether recent buyers are underwater. With it recovering, traders from the past month are beginning to regain position strength. If momentum continues, short-term recovery pressure could build.
Still, let’s be real. A bounce doesn’t automatically mean a trend shift.
BlackRock Catalyst
So why the sudden spark in what was otherwise a bearish atmosphere?
Uniswap Labs and Securitize announced a partnership with BlackRock to enhance DeFi liquidity for institutional investors via the USD Institutional Digital Liquidity Fund (BUIDL). The collaboration enables on-chain trading of BUIDL shares through UniswapX, an auction-driven protocol.
That headline alone was enough to jolt the UNI/USD pair higher.
Institutional bridges tend to shift perception fast. And perception, especially in crypto, often drives short-term price action harder than fundamentals.
UNI/USD Key Deciding Resistance Looms
Now comes the harder part, as the intraday spike loved by all and bullish speculation already jumped. But, the worries has not over yet, as immediate resistance range sits between $5.50 and $7.00.
Clearing that band would suggest the Uniswap price is re-entering a broader bullish range. Failure to build above current momentum, however, could send UNUSD back into consolidation most likely under $4.00 again, until macro sentiment improves.
So, what’s next? For now, the Uniswap price analysis suggests that it is responding to whale accumulation, improving on-chain metrics, and an institutional headline. Whether this develops into a sustained move depends less on today’s spike and more on whether the broader market narrative decides to cooperate.
At the opening of XRP Community Day 2026, Brad Garlinghouse, CEO of Ripple, delivered a strong message to the global community, describing XRP as the “north star” and “heartbeat” of Ripple’s long-term strategy.
A celebration of the XRP community
Garlinghouse began his speech by welcoming XRP holders, developers, and partners from around the world, calling the event a celebration of the people building and supporting the ecosystem. He said the growth of XRP has been driven not only by technology but also by the strength of its global community.
XRP remains central to Ripple’s institutional strategy
According to Garlinghouse, XRP continues to guide Ripple’s institutional expansion. He explained that Ripple is focused on:
Expanding liquidity around XRP
Increasing real-world financial use cases
Strengthening enterprise adoption of the XRP Ledger
Building more on-chain financial infrastructure
He emphasized that institutions are increasingly looking for fast, low-cost cross-border payment solutions, and XRP remains a key part of that effort.
Ripple’s long-term vision toward 2030
Looking ahead, Garlinghouse said Ripple aims to grow into a global financial platform company by 2030, offering a wider range of infrastructure services while continuing to build trust across its ecosystem. He noted that utility, liquidity, and real-world adoption of XRP will remain at the center of the company’s mission.
The takeaway
Garlinghouse’s remarks reinforced Ripple’s commitment to XRP as a core part of its future, signaling that upcoming initiatives will focus heavily on expanding institutional usage and strengthening the real-world role of the XRP Ledger in global finance.
The LayerZero price doesn’t usually move quietly. This time, it detonated. A 38% intraday spike and over 75% in seven days. And suddenly, ZRO is the token everyone’s pretending they were watching all along.
What lit the match? Institutional gravity. An announcement confirming a Ark Invest CEO Cathie Wood’s advisory board addition hit the tape, reinforcing a clear narrative: finance is shifting on-chain, and LayerZero intends to be part of that infrastructure layer. Add to that a strategic investment from Tether tied to interoperability tech used by USDt0, and the story writes itself, as this shows credibility, capital, and long-term positioning.
But let’s be real. The market doesn’t move on vision alone. It moves on positioning.
LayerZero Price Surged WIth Institutional Boost
The news cycle delivered exactly what speculative markets crave for. Institutional attention, Reduced perceived project risk, Signals of long-term relevance and most importantly the fresh capital that’s looking for exposure.
That cocktail pushed the LayerZero price sharply higher and flipped sentiment fast. On the LayerZero price chart, the vertical structure is hard to ignore. ZRO/USD didn’t grind up. It sprinted.
And whenever a chart starts sprinting, traders start sweating.
Big Resistance Lies Ahead In ZRO/USD
Here’s the technical friction point. On the daily timeframe, ZRO/USD is facing resistance in the $2.45–$2.50 range. That’s the immediate ceiling. Price pushing beyond it won’t be easy, and the current hesitation suggests the rally may be running hot.
Now, the nearest round number support sits near $2.00, where possibly other major players are having eye at. If momentum cools and since overheated metrics suggest it might then that’s the level traders are quietly circling.
The broader LayerZero price prediction now hinges on one simple condition: a sustained daily close above $2.45–$2.50. Without that confirmation, upside targets near $2.90 and even $3.30 remain conditional, not promised.
Why A Dip is Likely, Because of Overheating OnChain Signals
And here’s the uncomfortable part. CryptoQuant metrics flag the asset as overheated. Futures retail activity over the past 24 hours has surged, suggesting too many late entrants are piling in at once. Historically, when retail crowds futures positioning, larger players tend to reassess risk.
Volume bubble maps across both futures and spot markets echo that heating pattern. Translation? The move may be extended in the short term.
Now, could the LayerZero crypto rally ignore these warning signs and continue higher? Absolutely. Markets love squeezing doubters. But confirmation matters.
So what’s next in LayerZero price?
If buyers defend $2.00 and build structure, the narrative holds. If price reclaims and closes firmly above the resistance band, momentum traders will chase toward higher targets.
Until then, the LayerZero price sits at a crossroads charged with institutional narrative fuel, but flashing technical exhaustion lights at the same time.
Rayhaneh Sharif-Askary, Head of Product & Research at Grayscale Investments, said XRP stands out as a highly global digital asset, highlighting its widespread international usage and cross-border relevance as key factors supporting its long-term institutional appeal.
February 11, 2026 16:38:46 UTC
Grayscale Executive Says ETF Listings Marked Key Turning Point for XRP Adoption
Live blog content goes here…
Rayhaneh Sharif-Askary, Head of Product & Research at Grayscale Investments, said last year’s approval of generic ETF listings was a significant milestone, paving the way for the launch of XRP-related and other crypto ETFs. She said that the development has played a meaningful role in expanding institutional access to digital assets.
Matt Hougan Says Current Crypto “Winter” Likely to Be Shorter
Matt Hougan said the market is experiencing a classic crypto-cycle downturn, with some investors selling ahead of the traditional four-year cycle contributing to the recent pullback. He added that improving macroeconomic conditions and the potential shift toward a rate-cut environment could make the current crypto “winter” shorter than previous downturns.
February 11, 2026 16:20:15 UTC
Reforge’s Alexander Lin: RLUSD Positioned to Reduce Market Friction Through Compliance
Alexander Lin, Co-Founder and General Partner at Reforge, said the growth of RLUSD will depend on real-world usage rather than simply adding another stablecoin to the market. He noted that Ripple’s compliance-focused approach could reduce regulatory friction for developers, adding that the combined use of XRP and RLUSD may help accelerate both institutional adoption and broader ecosystem development.
February 11, 2026 16:10:47 UTC
Dragonfly’s Rob Hadick Says RLUSD Could Challenge Stablecoin Duopoly
Rob Hadick, General Partner at Dragonfly Capital, said the launch of RLUSD is focused on “bootstrapping” adoption as the market has long been dominated by major issuers such as Circle and Tether. He added that recent developments, including Ripple’s strategic acquisitions and ongoing technology improvements, could create a “snowball effect” as traditional financial institutions begin exploring real-world usage.
February 11, 2026 15:29:21 UTC
Garlinghouse Says “Clarity Act” Has Strong Chances of Passing This Year
Brad Garlinghouse said recent constructive discussions with policymakers have increased the likelihood that the proposed crypto market structure legislation, often referred to as the “Clarity Act,” will move forward this year. He said that Ripple has been closely engaged in policy conversations, adding that he believes there is roughly a 75% chance the bill advances toward becoming law.
February 11, 2026 15:29:21 UTC
Garlinghouse: Ripple’s 2030 Vision Centers on Platform Growth and XRP Utility
Brad Garlinghouse said he expects Ripple to continue evolving as a global platform company by 2030, focused on expanding financial infrastructure services while strengthening trust across its ecosystem. He emphasized that driving utility, liquidity, and real-world adoption of XRP will remain central to Ripple’s long-term mission.
February 11, 2026 15:23:07 UTC
Garlinghouse Says ETF Growth Key to Institutionalizing Crypto Markets
Brad Garlinghouse said the expansion of crypto ETFs will play a major role in accelerating institutional participation across the sector, pointing to strong investor demand in public markets. He said that XRP-linked investment products were among the fastest to reach $1 billion in assets and now stand near $1.5 billion, signaling rising institutional appetite alongside the success of Bitcoin ETF offerings.
February 11, 2026 15:23:07 UTC
Garlinghouse Praises XRP Community, Signals Focus on Lending Activity Growth
Brad Garlinghouse praised the resilience of the XRP community, saying he is “in awe” of supporters who have stayed with the ecosystem through both strong and challenging market cycles. He added that boosting activity around lending protocols on the XRP Ledger is a key priority for Ripple as it works to expand community-driven utility and on-chain engagement.
February 11, 2026 15:17:25 UTC
Garlinghouse: OCC Banking Charter Strengthens RLUSD Compliance and Protection
Brad Garlinghouse said the Office of the Comptroller of the Currency (OCC) banking charter provides a stronger regulatory foundation for RLUSD, enabling more robust compliance standards and added bankruptcy protections. He said that Ripple’s strategy prioritizes becoming one of the most regulated and compliance-focused players in the sector, positioning RLUSD as a leader under the emerging regulatory framework.
February 11, 2026 15:17:25 UTC
Garlinghouse Says XRP Remains “North Star” of Ripple’s Institutional Strategy
At XRP Community Day, Brad Garlinghouse said XRP remains the “north star” guiding Ripple’s approach to institutional adoption. He said that the company’s institutional strategy is centered on expanding liquidity and real-world utility around XRP and the XRP Ledger, with ongoing initiatives designed to strengthen enterprise use cases and on-chain financial infrastructure.
February 11, 2026 15:02:48 UTC
Ripple Shifts to “Offense” Strategy for 2026, Garlinghouse Highlights Acquisitions
Brad Garlinghouse said Ripple is entering 2026 with a more aggressive growth strategy after spending the past two and a half years largely “playing defense.” He said that the company is now focused on expanding its global presence, making up for lost time through major acquisitions and new strategic initiatives aimed at accelerating ecosystem growth.
February 11, 2026 15:02:48 UTC
Garlinghouse Calls Recent Crypto Sell-Off a “Bloodbath,” Says XRP Remains a Top Performer
Speaking at XRP Community Day, Brad Garlinghouse described the recent market downturn as a “bloodbath,” noting that the sell-off extended beyond crypto, with assets such as gold and silver also declining. He said the current drawdown is comparable to the 2022 bear cycle but said that XRP remains one of the best-performing major cryptocurrencies this year, second only to Bitcoin, while Bitcoin itself has remained largely flat since the U.S. election period.
February 11, 2026 15:02:48 UTC
Brad Garlinghouse Opens XRP Community Day, Calls Event a Celebration of the Community
Brad Garlinghouse officially kicked off XRP Community Day by welcoming XRP holders, supporters, and builders from around the world, emphasizing that the event is dedicated to the strength and growth of the XRP community. He said that the day is designed to celebrate the people driving the ecosystem forward and to highlight the community’s role in shaping XRP’s future.
February 11, 2026 14:52:06 UTC
XRP Supporters Rally as Global Community Event Draws Massive Participation
Excitement is building around XRP Community Day as supporters point to the scale of the two-day global event, which is drawing tens of thousands of participants across multiple sessions worldwide. Many community members say the turnout underscores the strong backing behind the XRP ecosystem and growing enthusiasm surrounding Ripple and its expanding global initiatives.
February 11, 2026 14:43:28 UTC
Ripple Partners With Aviva Investors to Tokenize Traditional Funds on XRPL
Ripple has announced a new partnership with Aviva Investors to tokenize traditional investment funds on the XRP Ledger. More details about the initiative will be shared during XRP Community Day, featuring discussions with Markus Infanger and Alastair Sewell on the future of tokenized finance.
February 11, 2026 14:33:10 UTC
XRP Slips Ahead of Community Day as Broader Crypto Market Weakens
XRP fell 2.91% to $1.37 over the past 24 hours, slightly underperforming the broader crypto market as risk-off sentiment intensified. The decline comes as Bitcoin dropped about 2.1%, with extreme fear across the market driving synchronized selling among major digital assets.
February 11, 2026 14:23:46 UTC
XRP Community Day Returns with Global Focus on ETFs, DeFi, and On-Chain Growth
Building on its inaugural year, XRP Community Day returns with a strong focus on how XRP is being used today and where it is headed next. Sessions across EMEA, the Americas, and APAC will cover regulated investment products, potential ETFs, wrapped XRP, expanding DeFi applications, and the continued evolution of on-chain infrastructure expected through 2026.
February 11, 2026 14:23:46 UTC
XRP Community Day Set to Kick Off Soon
XRP Community Day is set to begin shortly, with Brad Garlinghouse expected to open the event by outlining XRP’s expanding role in global financial infrastructure and capital markets.
Bitcoin dropped to about $60,000 on February 5, falling more than 50% from its October highs. A new market commentary from Grayscale suggests the crash wasn’t caused by anything specific to crypto. Instead, it followed the same pattern as a broader sell-off in high-growth tech stocks.
Grayscale’s data shows Bitcoin has been closely tracking U.S. software stocks with high valuations for at least 12 months.
The two moved almost identically during the latest downturn, which points to investors pulling back from risk assets across the board.
Is Bitcoin a Store of Value or a Growth Asset?
Grayscale’s take is direct: “We believe it’s both.”
The firm acknowledged that Bitcoin shares key traits with gold, including supply scarcity and independence from governments. But gold has been used as money for thousands of years. Bitcoin is 17 years old.
If Bitcoin succeeds long-term as a monetary asset, Grayscale expects its price to “eventually look more like gold than growth stocks, with lower volatility, a lower correlation to equity markets, and lower expected returns.”
Who Led the Sell Off?
The selling pressure came from American investors. Bitcoin on Coinbase traded well below the price on Binance around the recent lows, a sign that U.S.-based traders were offloading. Spot Bitcoin ETPs also saw around $318 million in net outflows since early February.
Long-term holders told a different story. Grayscale found no new liquidations from Bitcoin “OG Whales” based on on-chain data.
Bitcoin’s drawdown looked mild compared to altcoins. AI-related crypto tokens dropped 71% month to date. Utilities and services fell 69%. Consumer and culture tokens lost 66%. Smart contract platforms came down 58%.
What’s Next?
Looking ahead, Grayscale pointed to three areas gaining traction: privacy, perpetual futures, and prediction markets. The firm named ETH, SOL, and LINK as likely beneficiaries of growing stablecoin and tokenized asset adoption. ZEC was highlighted for privacy, and HYPE for its expansion into prediction markets.
The near-term factor to watch is the CLARITY Act. Delays in the Senate have weighed on crypto valuations, and the White House recently convened a second meeting with industry leaders to push the bill forward.
The global XRP community is coming together today for XRP Community Day 2026, a virtual event where developers, investors, institutions, and leaders from the Ripple ecosystem will discuss the growing role of XRP in real-world finance. Many traders are now asking a key question: Can this event trigger the next major XRP rally?
What to expect from the event
The event will open with a keynote from Ripple CEO Brad Garlinghouse, who is expected to highlight:
Increasing institutional adoption of XRP
Expanding use cases in cross-border payments and capital markets
The impact of regulatory clarity on long-term growth
XRP’s role in global financial infrastructure
Such announcements often improve investor sentiment, which sometimes leads to short-term price momentum.
XRP price before the event
Ahead of the event, XRP is trading around $1.39, down about 3% in the past 24 hours, largely in line with weakness across the broader crypto market. Analysts say the current price movement is mostly sideways consolidation, not a clear uptrend or downtrend.
Key technical levels traders are watching
Support zone: $1.31 – $1.43 XRP is currently holding above this important support range, which suggests buyers are still active.
First resistance: $1.54 XRP must move above this recent high to show early bullish strength.
Major breakout level: $1.63 – $1.64 A strong break above this range could open the door for a larger rally.
Lower support if weakness continues: $1.20 – $1.21 If the market drops below $1.31, this could become the next key demand zone.
Can XRP move toward $2?
For XRP to move toward $2, two conditions may be needed:
Positive announcements or strong adoption signals from Community Day
A technical breakout above the $1.63–$1.64 resistance area
Until then, analysts expect sideways movement with occasional short-term spikes, as traders wait for stronger confirmation of a sustained trend.
XRP Community Day could improve market sentiment and bring attention back to the XRP ecosystem, but price momentum will ultimately depend on whether XRP can break key resistance levels. For now, the market remains in a consolidation phase, with investors watching closely for the next decisive move.
Major asset manager Grayscale has stated that 2026 will be “the dawn of the institutional era” for digital assets like Bitcoin, Ethereum, and others.
Roughly 30% of Americans now own crypto, while approximately 165 public companies hold Bitcoin on their balance sheets or in their treasuries. Moreover, Bitcoin ETFs alone have over $116 billion in AUM. Further regulatory clarity is likely to accelerate crypto adoption to levels beyond imagination.
Pro-crypto frameworks like the GENIUS Act are setting the stage for increased legal protection for crypto investors. As a result, it is no secret that global capital is moving towards blockchain-based scarce assets.
Meanwhile, the race is on to make the perfect financial instrument or product for institutional investors. The whole situation is now unrecognizable from around 18 months ago, with additions like confidential smart contracts, AI-native payment rails, and tokenized treasury products.
Here are five breakthrough products that are changing how big capital is entering the crypto markets:
1. Gems Trade Baskets
Portfolio management is one of the hardest tasks in crypto and can get cumbersome with time. Investors have to research dozens of promising tokens, manage access between centralized and decentralized crypto exchanges, and track derivative positions across multiple wallets. A professional, dedicated trading infrastructure is the need of the hour, as market dynamics become increasingly complex.
In December 2025, Gems Trade, a European MiCA-compliant digital asset exchange, launched its Basket feature, combining entire trading flows into a single transaction. It allows investors to buy curated collections, like Layer-1s, memecoin indices, Web3 infrastructure, decentralized finance, and Layer-2s, in a single click by bundling the trading flow into one transaction.
This isn’t just price exposure, as users actually own the assets in their Gems Trade wallet. Each asset is stored using institutional-grade custody through an integration between Fireblocks and Chainanalysis.
Omri Hanover, head of Project at Gems Trade, shared: “Baskets eliminate the operational friction while preserving actual asset ownership. Traders shouldn’t need to become full-time researchers and portfolio managers just to gain sector exposure.”
2. JPMorgan’s Kinexys
While some banks have entered the highly competitive crypto ETF and treasury markets, JPMorgan has taken a more exclusive approach through its Kinexys brand. The system aims to save hours lost due to manual processes and wire transfers, enabling real-time tri-party settlement in the private equity and private credit markets.
Through the Kinexys brand, JPMorgan aims to attract institutional investors with its blockchain-based platform that enables 24/7 settlement of private instruments. Access is restricted, with eligible participants using a tokenized investor register that supports real-time visibility and automated workflows.
3. Solana & x402
AI agents face challenges when they’re forced to use traditional payment rails that charge $0.30 per 1-cent API call. To combat this, Coinbase developed the x402 protocol, which runs on Solana as the primary layer-1 network. It enables AI agents to access and purchase data without relying on traditional payment rails or subscription models.
Coinbase’s x402 is an open, chain-agnostic standard that uses HTTP 402 “Payment Required” responses as a signal to pay, allowing an app or AI agent to pay instantly and continue the request. If Sloana’s upcoming Apenglow upgrade delivers faster finality, these payments could settle even faster. The result is machine-speed transactions without manual steps or traditional payment rails.
4. Fidelity’s On-Chain Treasury Bills
Fidelity entered tokenization treasures with the Fidelity Treasury Digital Fund (FYOXX), launched in September 2025. The fund holds only U.S. Treasury instruments and cash, with an on-chain share class (FDIT) issued on Ethereum and custody handled by Bank of New York Mellon.
As of late January 2026, FYOXX reported a 3.5% 7-day yield, with over $200 million in net assets, making it an appealing option for DeFi firms seeking reliable, low-risk collateral. Fidelity’s move demonstrates how tokenizing traditional assets, such as treasuries and bonds, can accelerate growth in the digital asset economy.
5. XTrends’ Tokenized Social Momentum
Crypto markets have always been driven by attention, but tokens built mainly on celebrities, memes, or viral buzz typically crash once interest fades. The problem is launch-time extraction, as snipers and bots drain liquidity immediately, killing projects within minutes and damaging creators’ reputations.
XTrends aims to turn social momentum into investable assets. Trends, often born on social platforms like X, can be registered and minted as NFTs, allowing users to speculate on where attention is heading without chasing bot-stripped token launches. XTrends is built to curb bot-driven extraction, with launch mechanics that discourage non-human ‘sniping’ and spread early activity more evenly.
Through XTrends, creators primarily earn revenue from a 1% trading fee, aligning incentives with sustained engagement. In a 2025 pilot, the team reports that 28 launches generated $140M in volume with no marketing spend. As influencer and celebrity crypto evolves, XTrends is positioning itself to monetize attention without the pitfalls that have made early social tokens short-lived.
Blockchain Solutions: One Problem at a Time
These five products address real constraints that have built up over time. As institutions become more involved in the digital financial market, they need tools that closely align with their workflows and risk requirements. Tokenized cash and credit, one-click diversified basets, privacy-preserving on-chain execution, and tokenized treasuries are some of the building blocks that can help move DeFi into its next phase.
Selecting the best crypto to invest in requires careful analysis of utility, momentum, and future potential. While many assets fluctuate with market sentiment, a few stand out for specific reasons. Bitcoin faces renewed macroeconomic pressures, and Shiba Inu struggles with technical weakness. In contrast, Mutuum Finance (MUTM) presents a functional decentralized finance protocol with a final presale phase offering direct value. This makes MUTM a distinct candidate for capital allocation in 2026.
Bitcoin Confronts Significant Downside Pressure
Bitcoin’s price action shows considerable strain, trading well below its all-time high. Analysts at Goldman Sachs warn of potential selling pressure in traditional markets, which often correlates with DeFi crypto market declines. Technical indicators suggest Bitcoin could test the $60,000 support level.
This environment creates substantial risk for new capital. The coin’s primary narrative as a digital store of value offers little short-term yield or utility, making it a speculative hold during uncertain times. For an investor with $500, parking funds here now may lead to stagnant or diminishing value while waiting for a broad market recovery.
Shiba Inu’s Bearish Pattern Problem
Shiba Inu is painting a troubling technical picture. It recently broke down from a consolidation structure, signaling continued bearish momentum. Unlike projects with underlying platforms, SHIB’s value is heavily reliant on community sentiment and meme culture, which are waning.
The token lacks the inherent utility, revenue-sharing models, or staking yields that define more robust ecosystems. This makes it a highly volatile and speculative asset. Investing $500 here is a gamble on unpredictable social trends rather than on tangible technological progress or financial mechanics.
Mutuum Finance: A Functional DeFi Entry Point
Mutuum Finance separates itself with a live, testable protocol on the Sepolia testnet during its presale. The project has raised over $20,400,000 and attracted 18,980 holders. Currently in Phase 7, the MUTM token is priced at $0.04. This price has increased 300% from its Phase 1 price of $0.01. Phase 7 is selling out fast, nearly closing the window to acquire tokens before Phase 8 introduces a near 20% price increase to $0.045.
The confirmed launch price is $0.06, positioning current buyers for an even bigger gain before launch. Furthermore, analysts project that the recent launch of the V1 protocol on the Sepolia testnet is a critical confidence builder, demonstrating that the lending and borrowing mechanics work. This technical milestone, combined with the project’s growing holder base of over 19,000 wallets, creates a foundation for future adoption, with potential for the price to reach the $1 range as adoption grows.
Profiting from the Presale Structure
The presale structure itself is a primary feature benefiting investors. With a fixed total supply of 4 billion tokens and 45.5% allocated to the presale, early participation secures tokens before exchange listings. Over 850 million tokens have already been sold. This diminishing supply against growing demand is a key value driver.
For example, an investment of $500 at $0.04 acquires 12,500 MUTM tokens. At the $0.06 launch price, this holding is worth $750. If post-launch momentum pushes the price to $1, that same stake balloons to $12,500. This clear growth trajectory is unavailable with most tokens already on public markets.
Earning Through Protocol Participation
Beyond token appreciation, MUTM provides passive income avenues. The live lending protocol allows users to supply assets like ETH or USDT to earn yield, projected between 10-15% APY. For instance, supplying $1,000 in assets could generate approximately $100-$150 in annual yield.
Additionally, the protocol employs a buy-and-distribute model, using a portion of fees to purchase MUTM tokens and distribute them to users who stake their mtTokens. This creates a dividend-like reward system for them, directly linking platform success to investor returns.
Incentives and Security Enhance Value
Immediate investor incentives increase the attractiveness. A 24-hour leaderboard awards a $500 MUTM bonus daily to the top contributor. A separate $100,000 giveaway is ongoing, set to distribute $10,000 to each of ten winners. These programs add potential windfalls.
Crucially, the underlying smart contracts have been through a thorough audit by Halborn Security, mitigating a major risk that plagues new projects. This combination of incentives, security, and utility builds a strong case for sustainable growth.
A Compelling Case for Early Investment
Mutuum Finance presents a multifaceted opportunity centered on a working product. The presale phase offers a discounted entry before exchange listings. The protocol’s utility promises ongoing yield, and its tokenomics are designed to reward early participants. For an investor considering where to deploy $500, MUTM offers a structured path for growth based on execution, not just speculation. This stands in contrast to the broader market’s uncertainty, making MUTM the best crypto to invest in.
For more information about Mutuum Finance (MUTM) visit the links below:
The Cardano price slipped 4.21% in the last 24 hours, falling to around $0.253 and underperforming a broadly weak crypto market. The decline came just a day after ADA futures officially launched on the CME — a development many viewed as bullish.
Instead of rallying, ADA sold off. The reaction points to a classic “sell the news” move, unfolding at a time when broader market sentiment remains fragile. So What’s next for the ADA price?
CME Futures Launch Triggers “Sell the News” Move
The launch of ADA futures on CME marked an important institutional milestone. However, instead of attracting sustained spot demand, the event sparked a surge in speculative derivatives activity.
When leveraged volume rises without strong spot buying, the price often struggles to hold gains. In weak markets, positive developments can become liquidity events where traders take profits or open short-term positions.
Key Cardano Price Levels to Watch
Cardano’s price has been maintaining a steep bearish trend since October 2025, losing over 70% since then. The bears have held a strong dominance over the rally, which has strengthened the bearish trend. As the selling pressure intensified, the token lost the local support at $0.277 that pushed the price to $0.25. With the volume and volatility squeezing, the focus has again shifted to $0.22 support as technicals flash a bearish flag.
Technically, ADA is approaching oversold territory, with the RSI near 32. The price is also testing important retracement levels, suggesting the market is at a decision point.
Key levels to monitor:
Support: $0.226
Breakdown risk: $0.20
Resistance on a bounce: $0.28–$0.31
If Cardano holds above $0.226, a short-term relief bounce remains possible. However, a daily close below this level could invite further downside toward the $0.20 psychological zone.
Volume will be important. Any recovery needs strong participation to signal real buying interest.
The Bottom Line: Market Outlook Remains Cautious
Cardano’s drop does not appear to be isolated. The entire crypto market has been under pressure, with total market capitalization down more than 3% and Bitcoin sliding alongside it.
There is also a noticeable rotation of capital into AI-focused equities, limiting upside across digital assets. At the same time, continued outflows from U.S. spot Bitcoin ETFs have added structural selling pressure.
In this environment, altcoins like ADA tend to suffer more during risk-off phases. The current move reflects broader market weakness rather than a Cardano-specific breakdown.
For now, the trend remains under pressure. Cardano’s decline reflects a mix of macro headwinds and a lack of sustained spot demand following the CME futures launch.
Oversold conditions could support a tactical bounce, but the structure remains fragile. The key question is whether ADA can defend $0.226 and attract real buyers—or whether broader weakness will continue to weigh on the price.


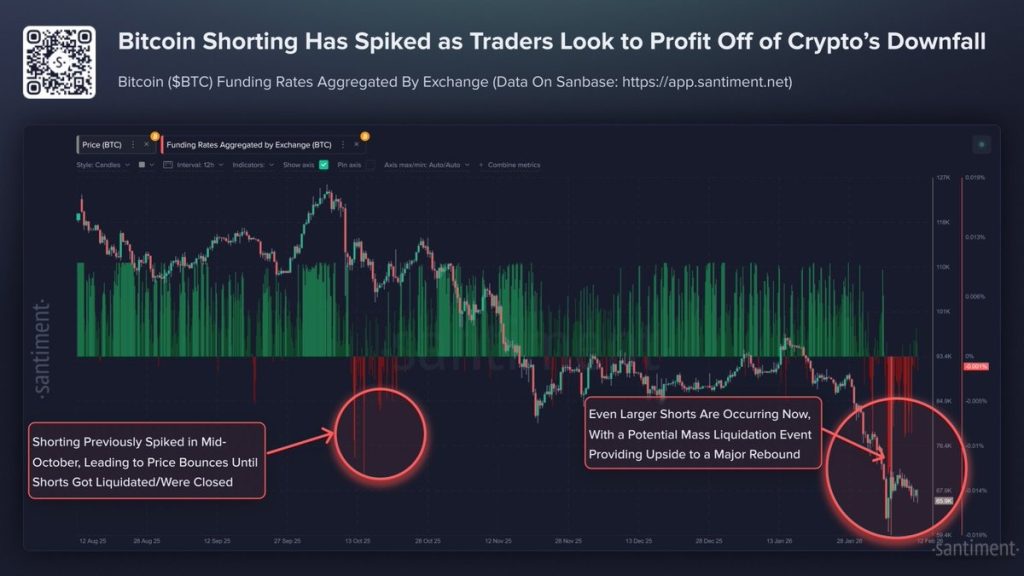


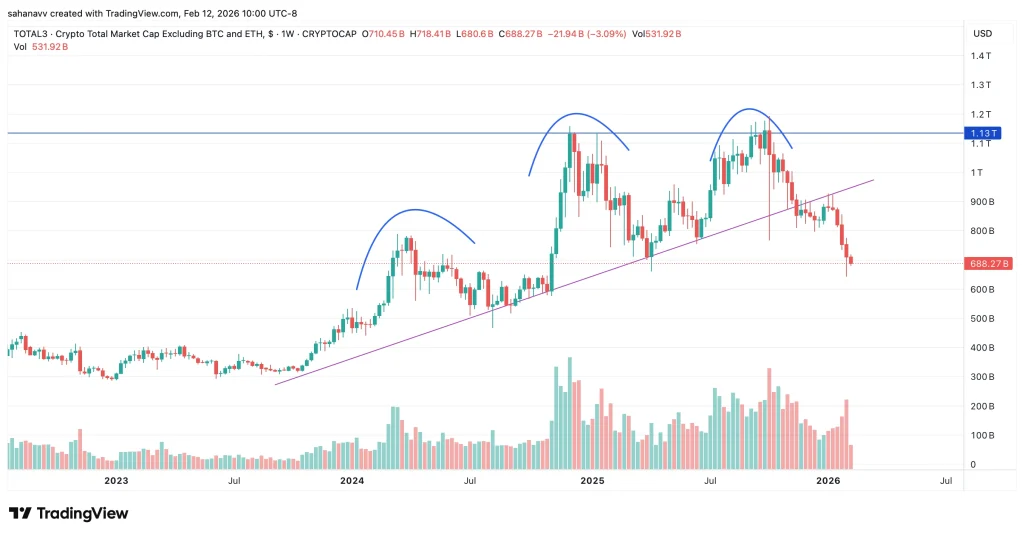
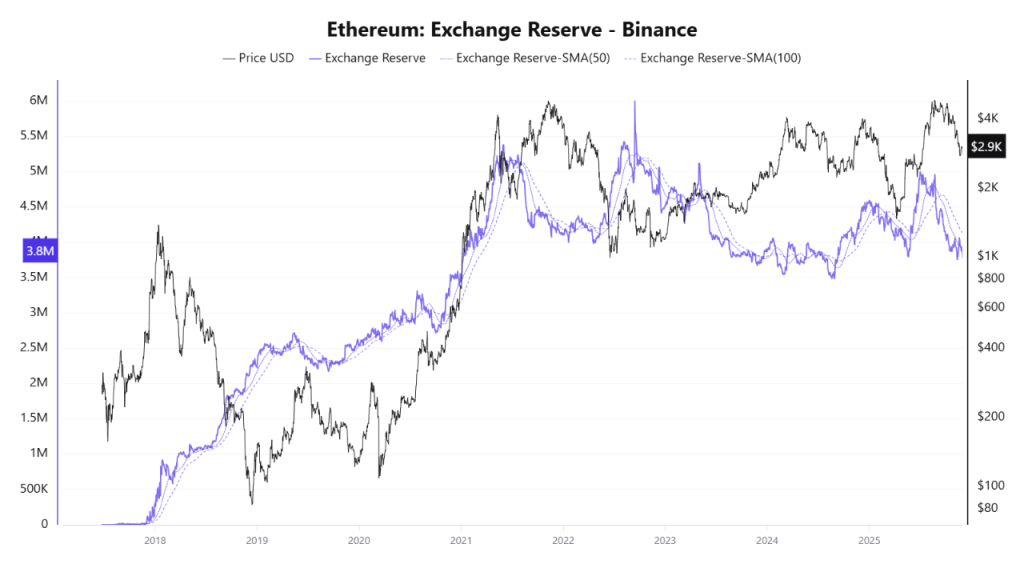
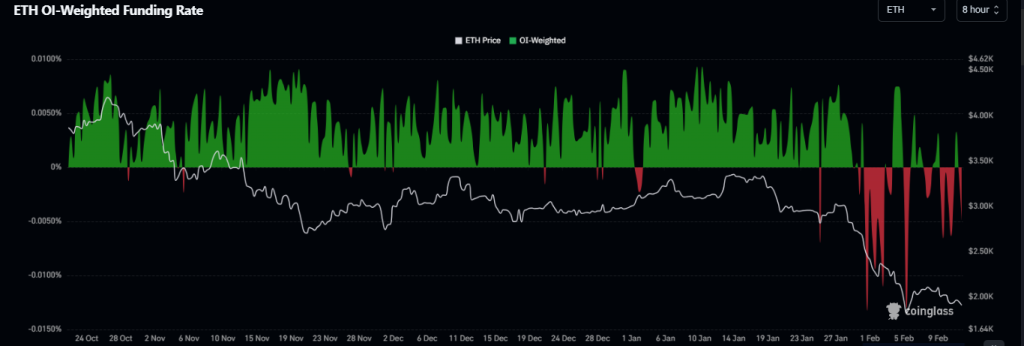
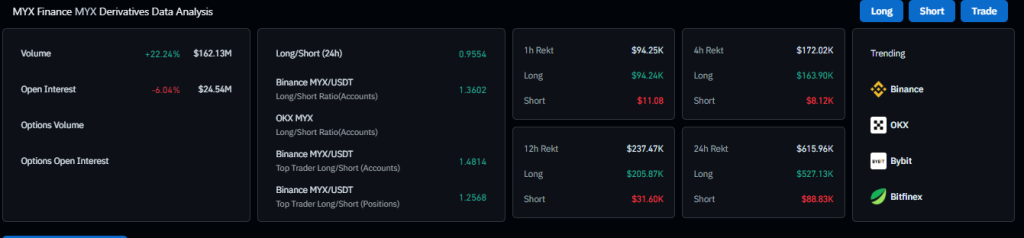
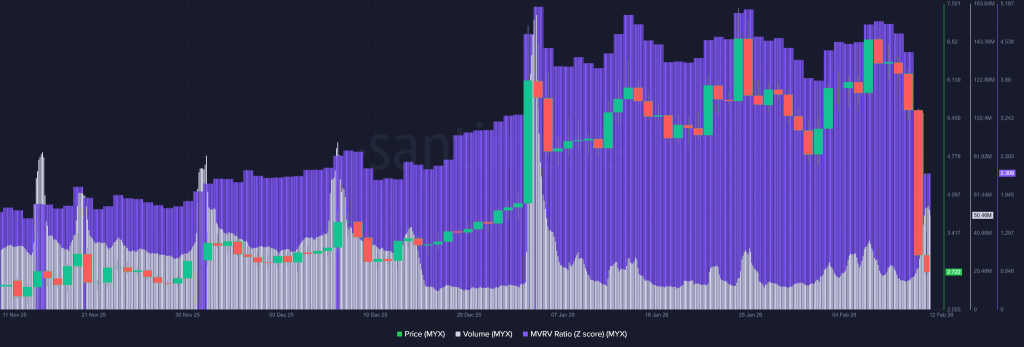
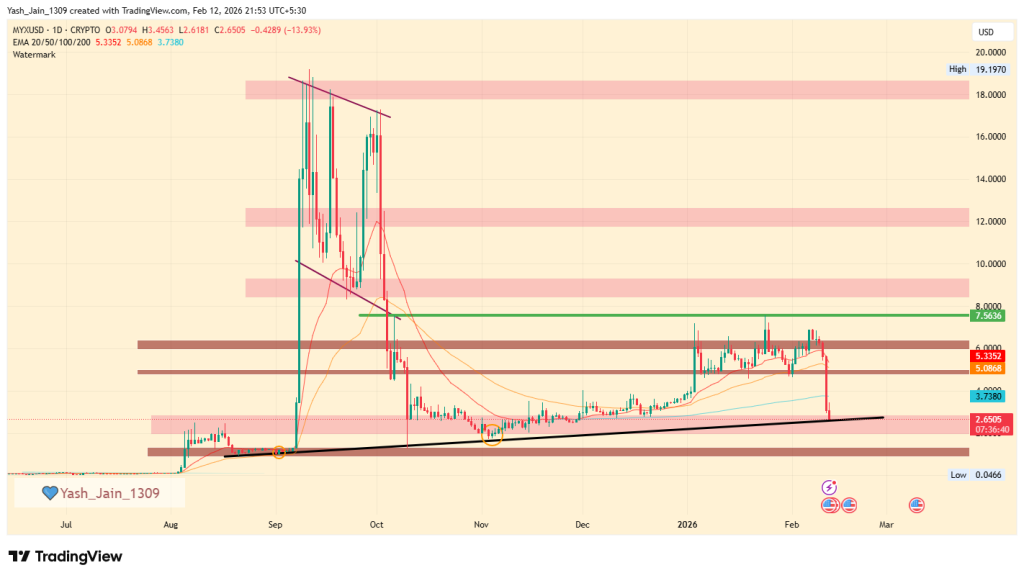
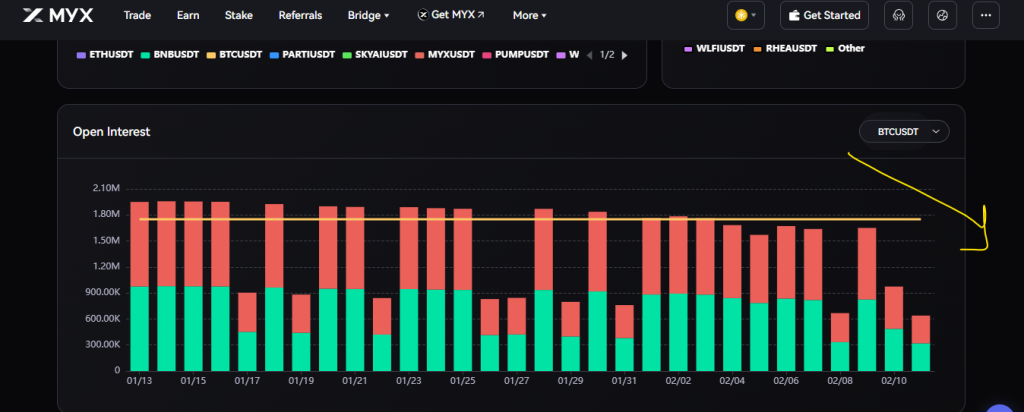
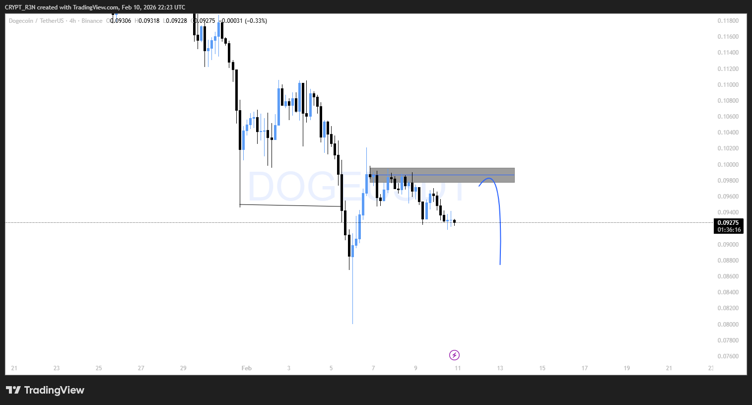
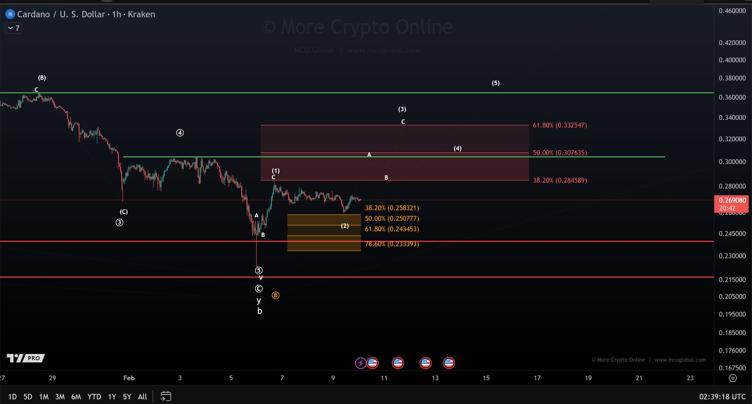

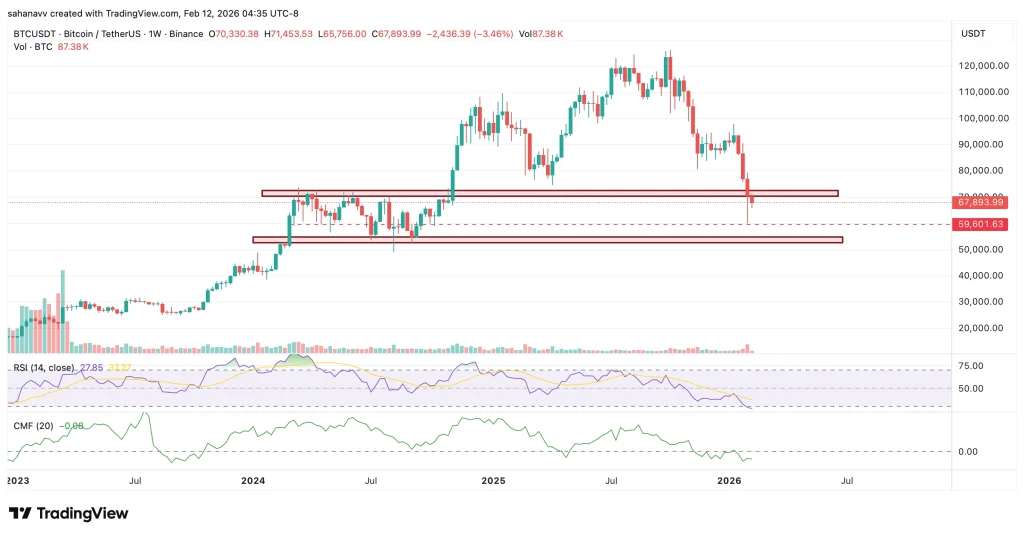
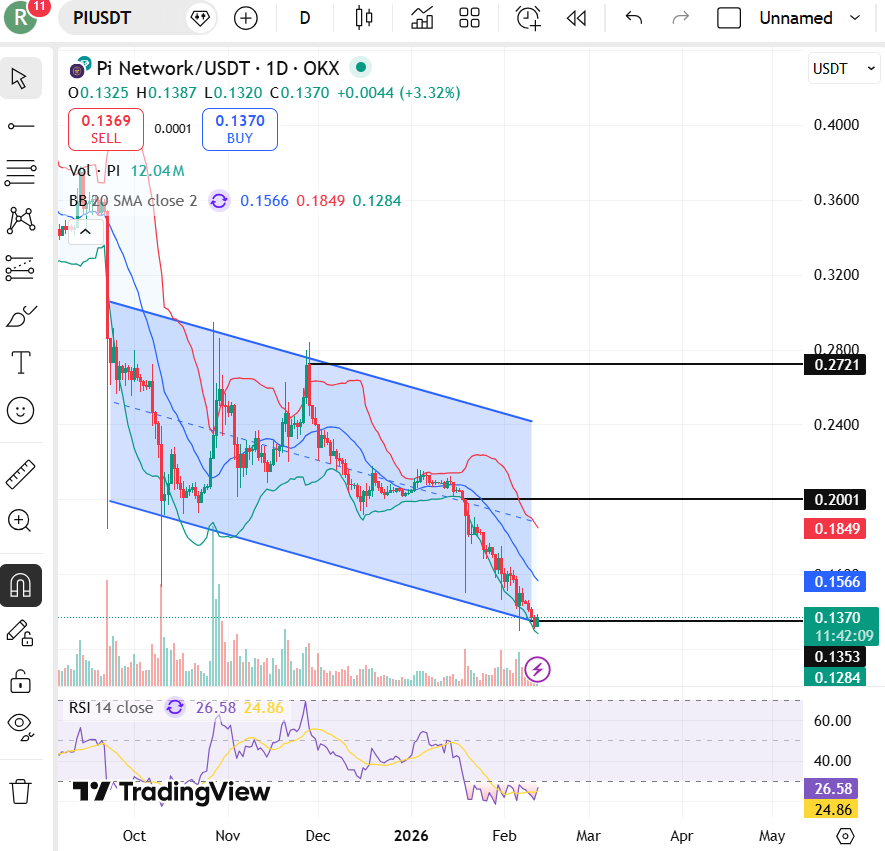


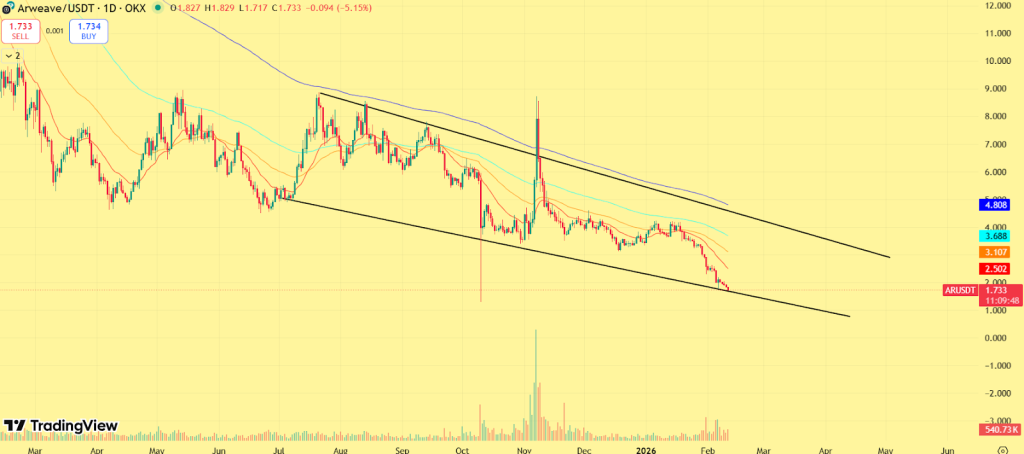
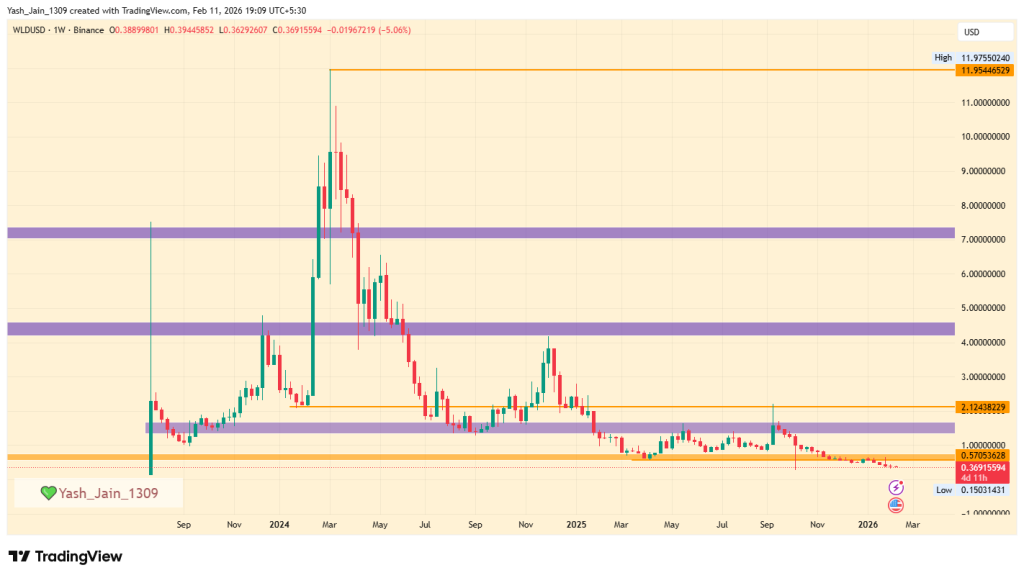
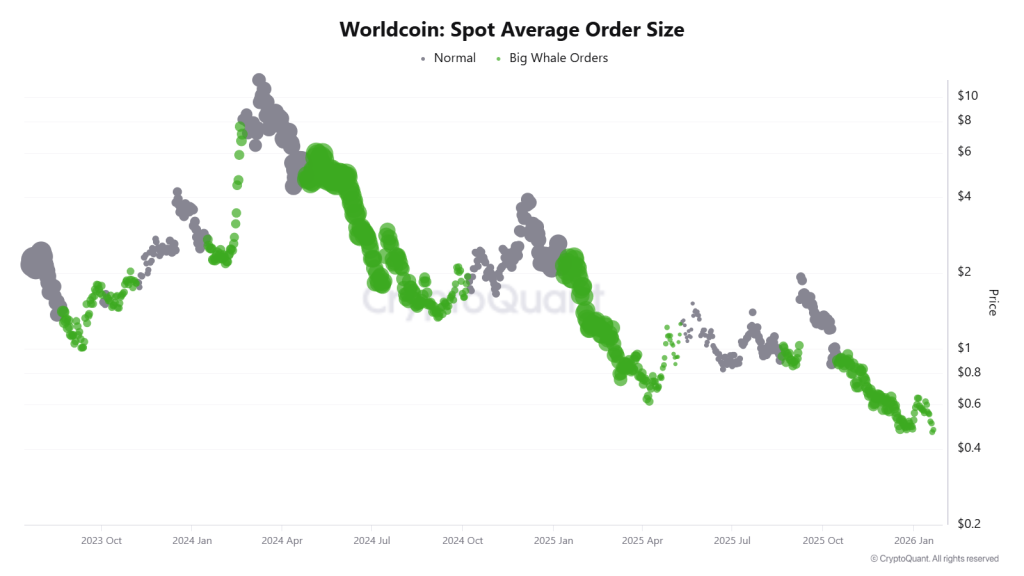
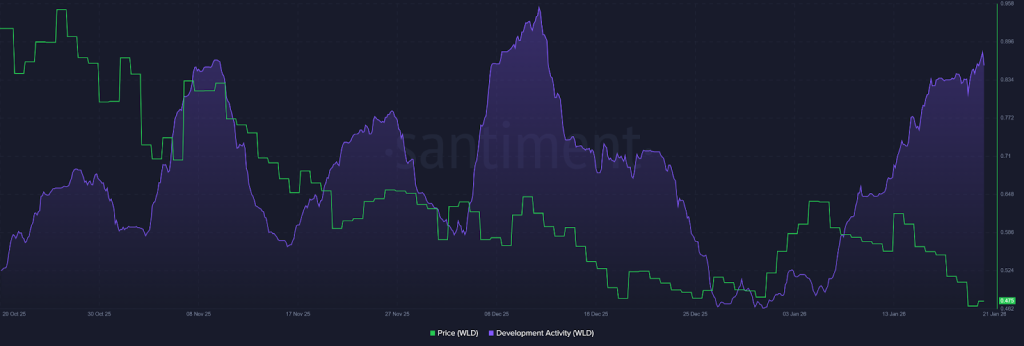


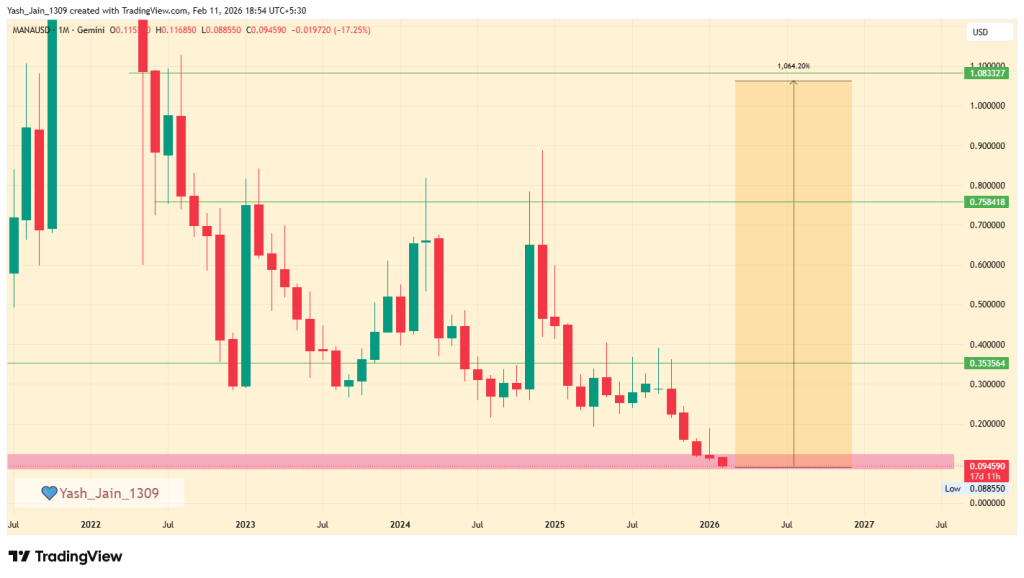
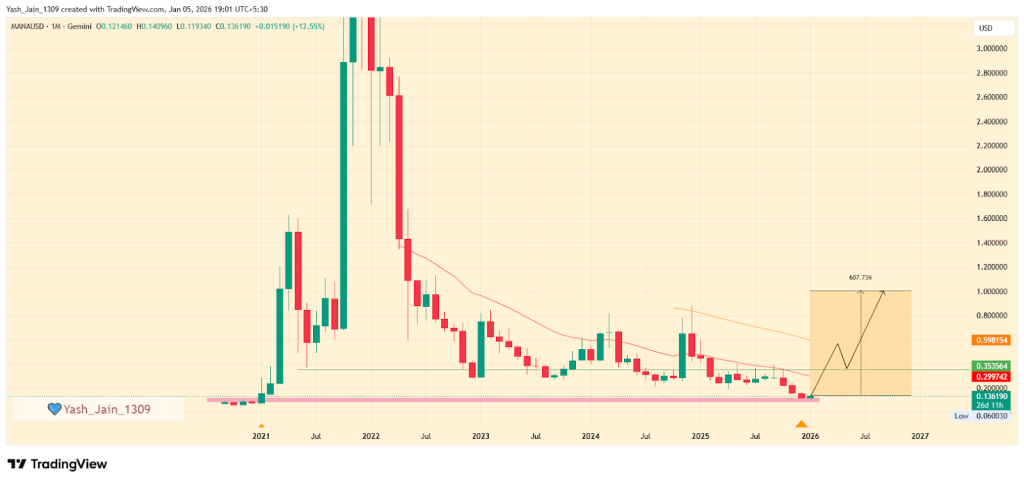
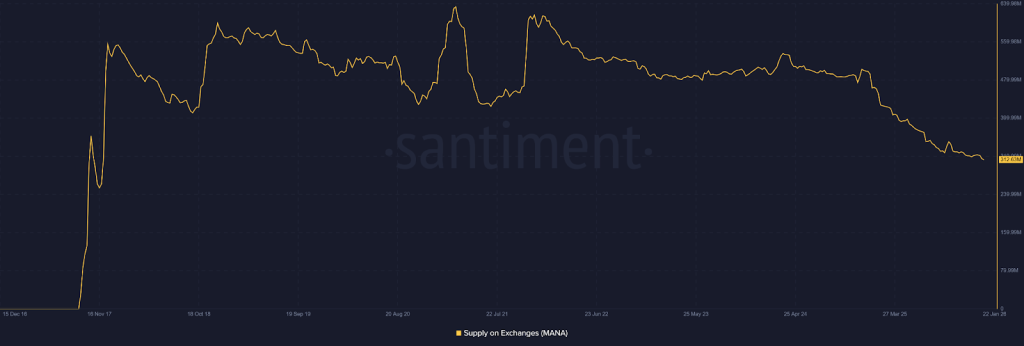
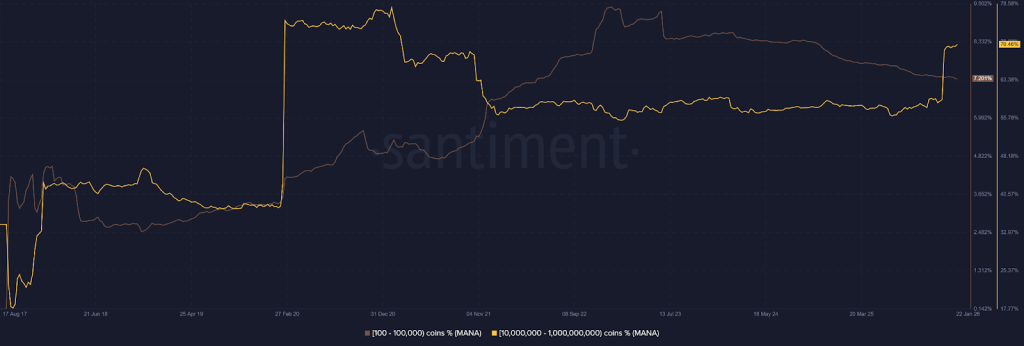
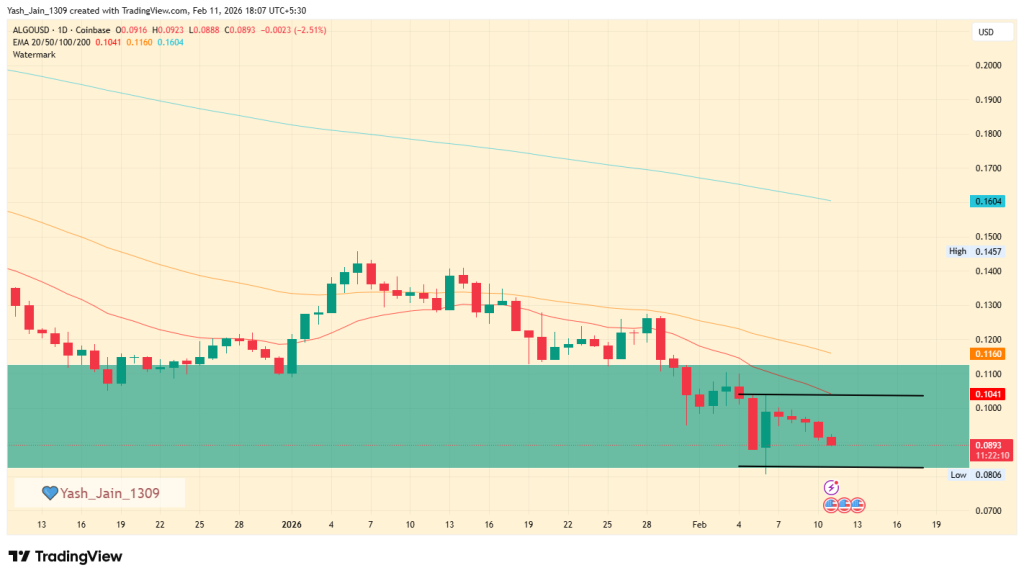
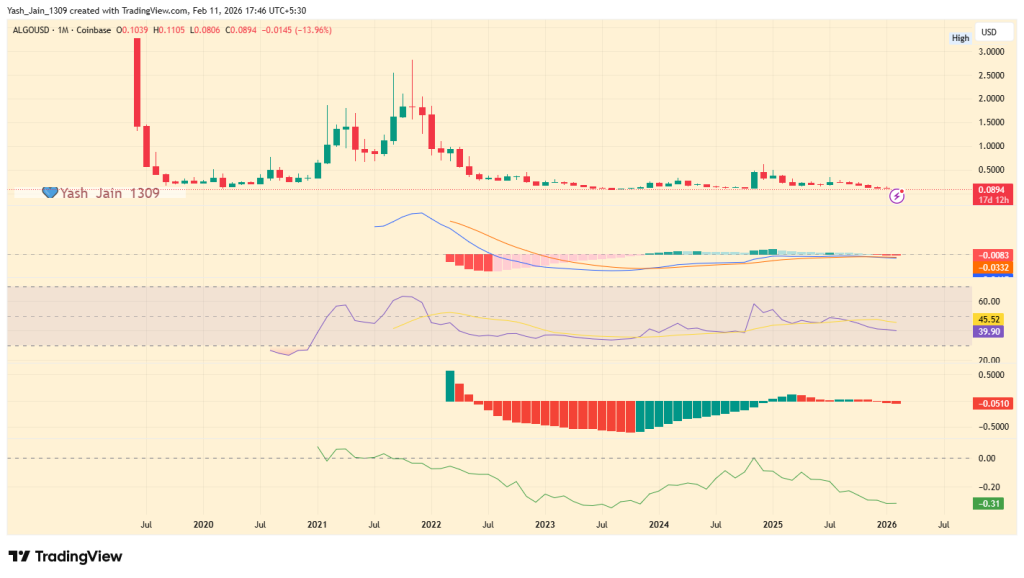
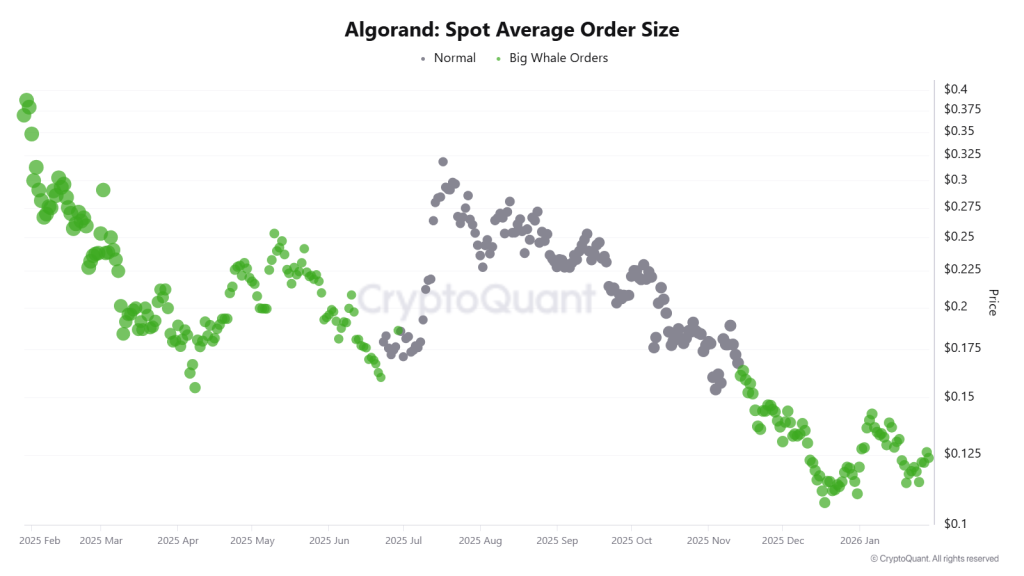
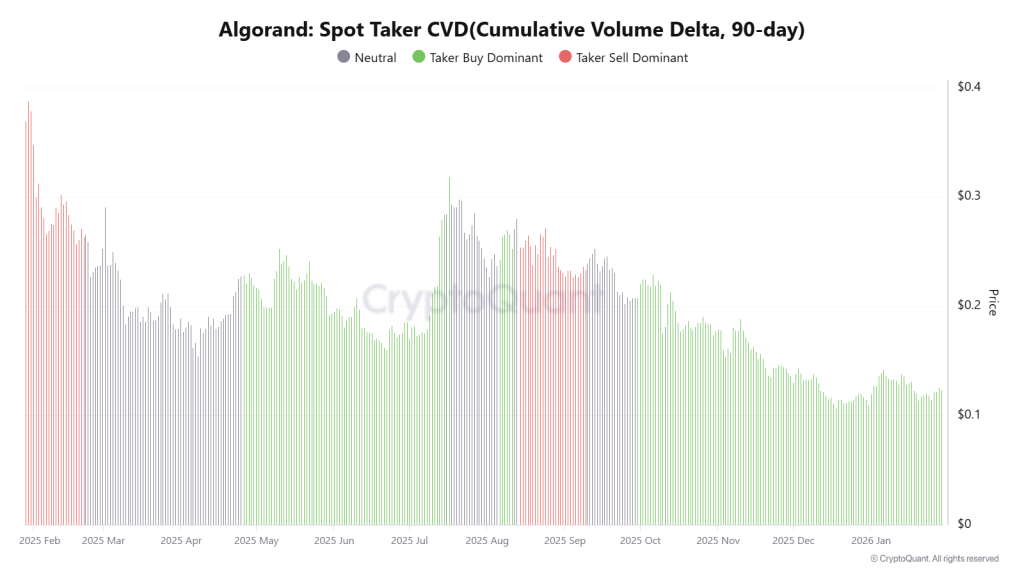
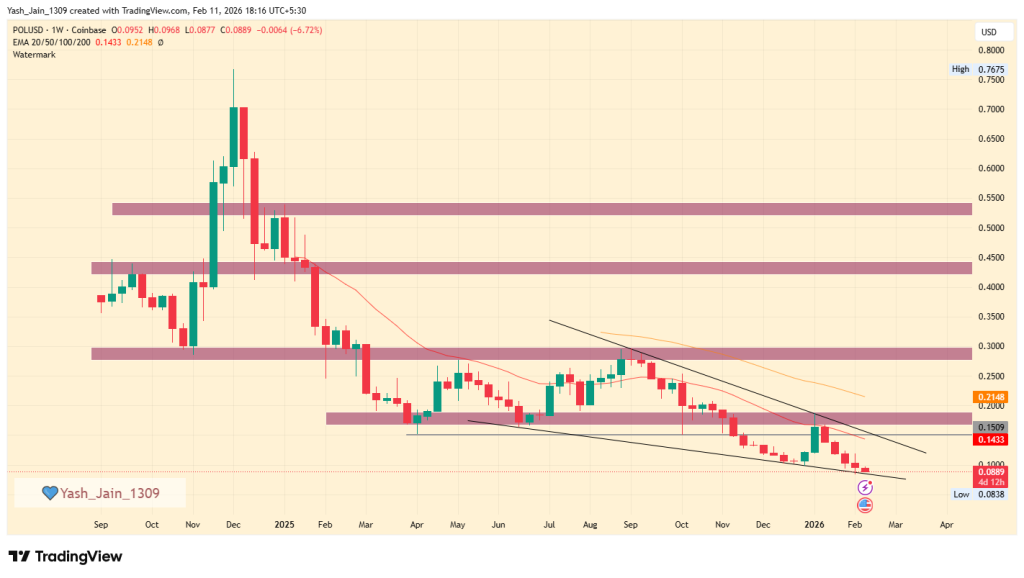
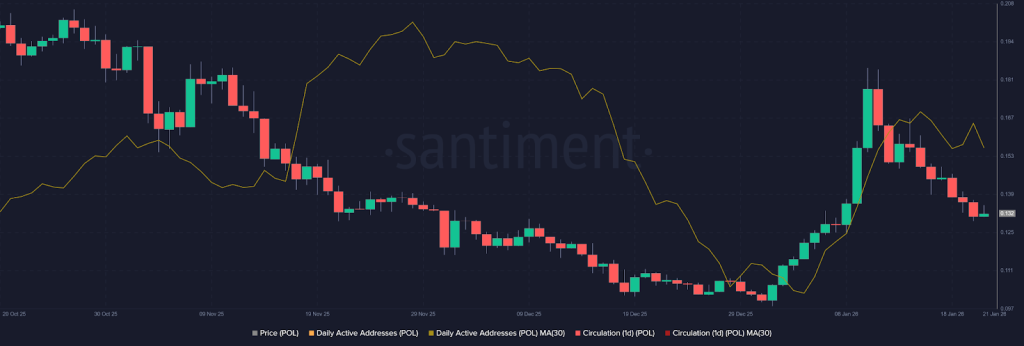
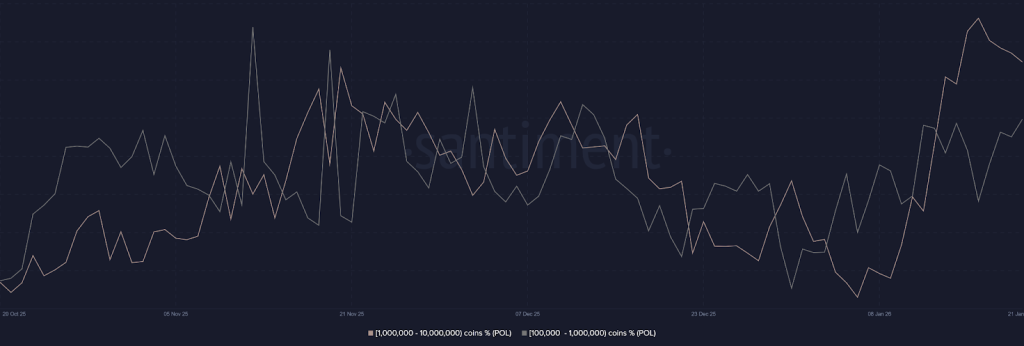
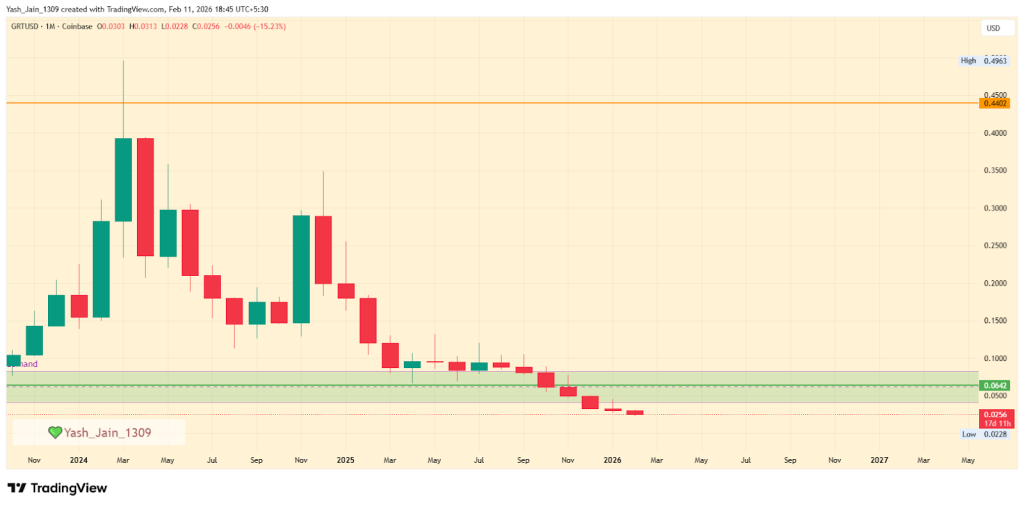
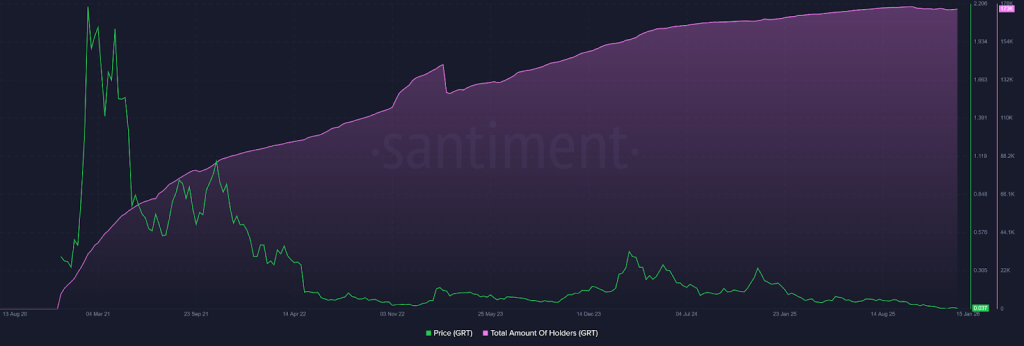
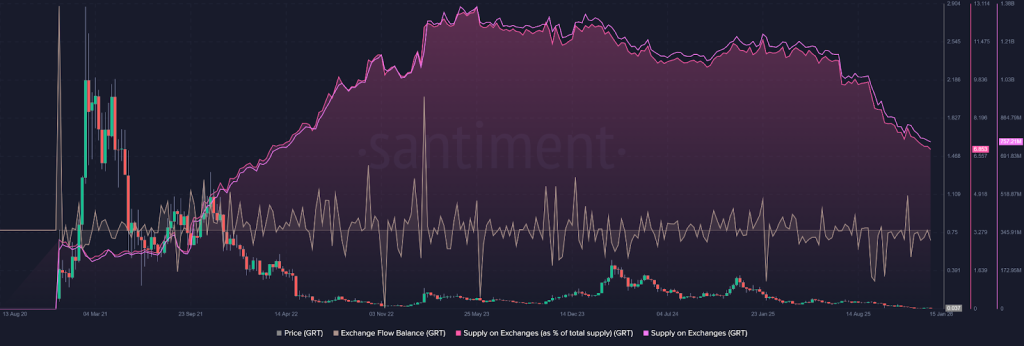


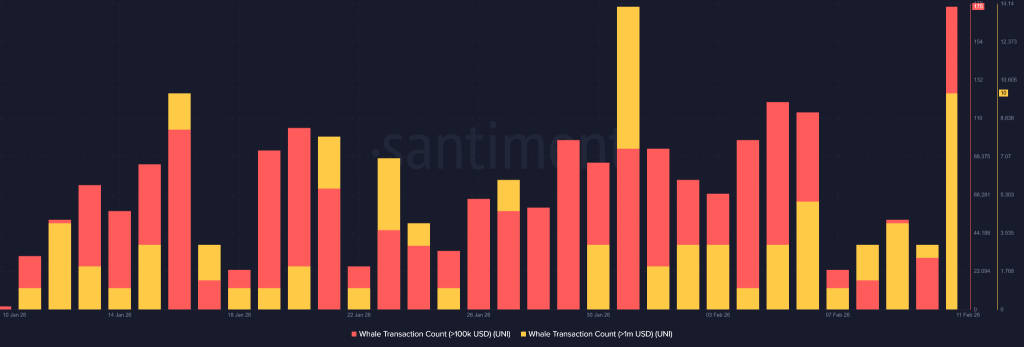
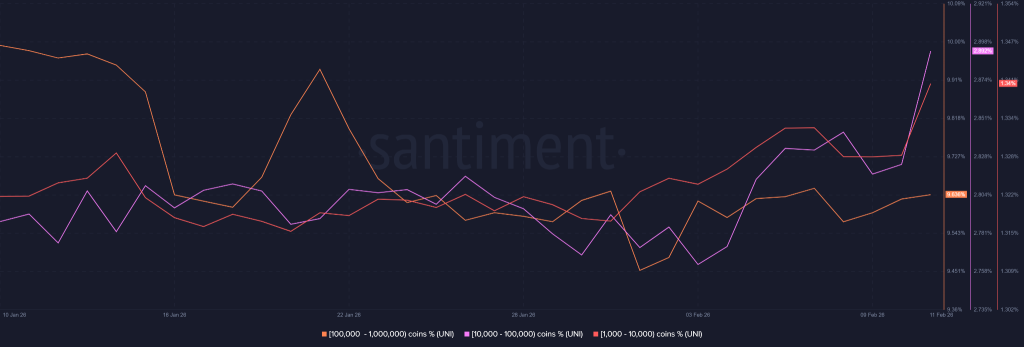
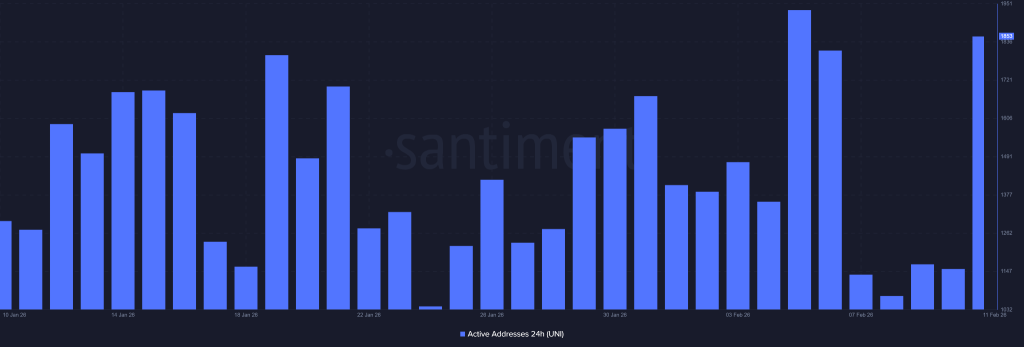
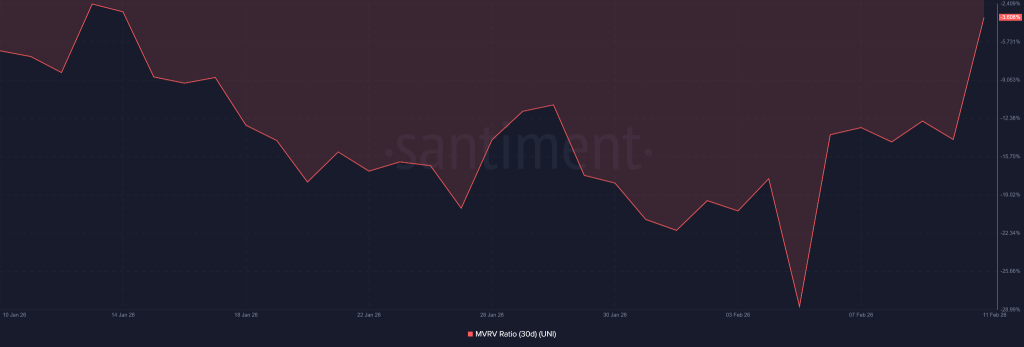
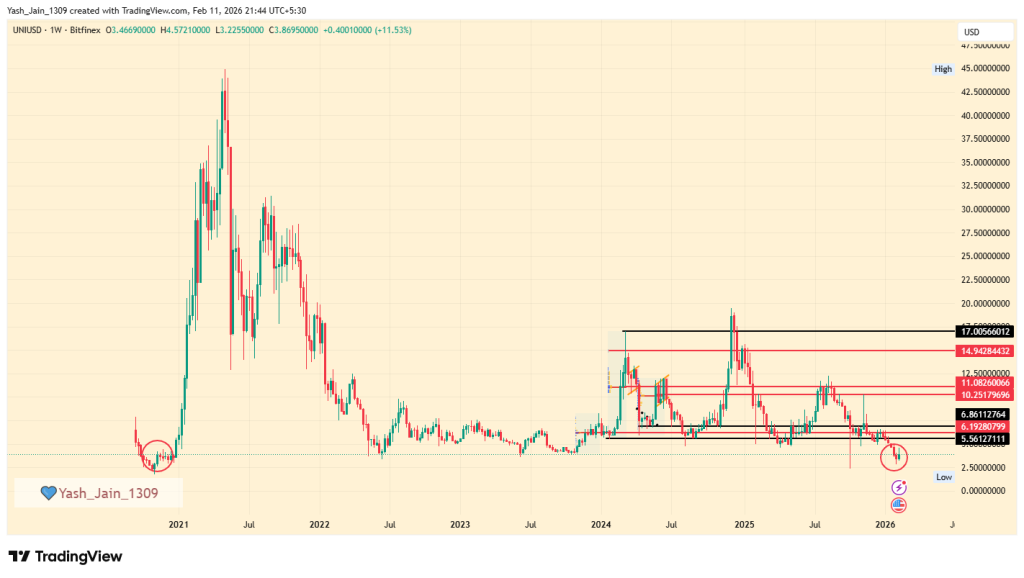
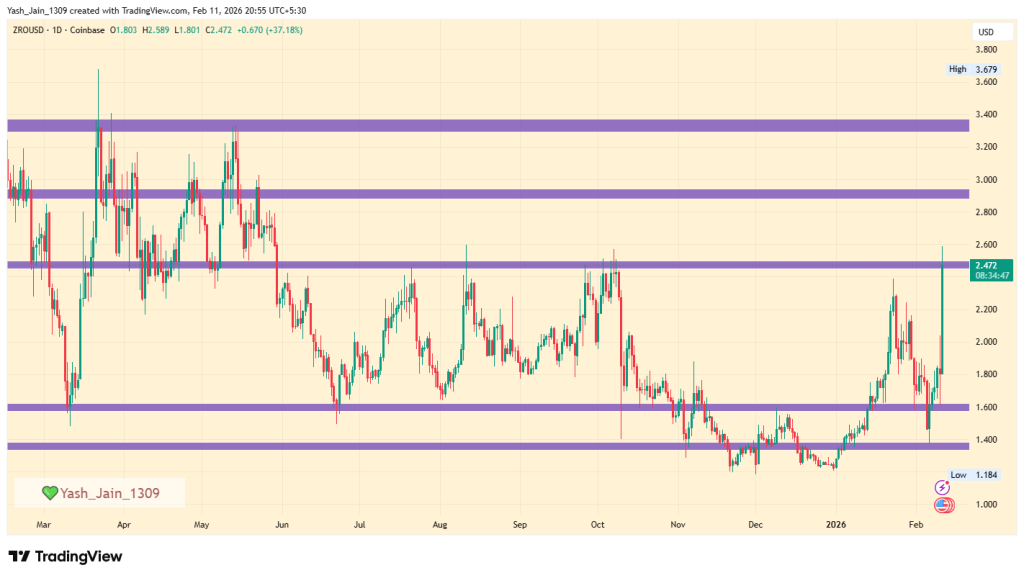
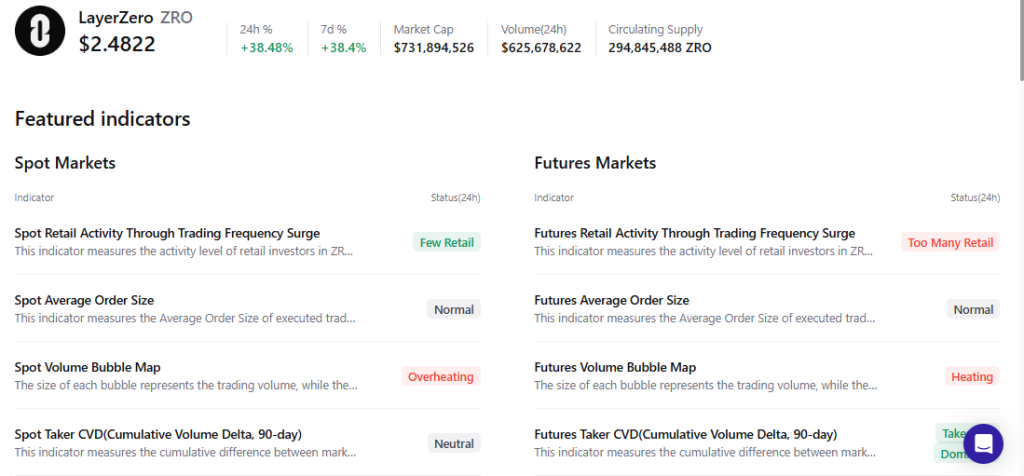
![XRP Community Day [Live] Updates](https://image.coinpedia.org/wp-content/uploads/2026/02/05161327/XRP-Price-Drops-10-as-Leverage-Dries-Up-and-Whale-Activity-Remains-Absent-1024x536.webp)