Reading view

Indiana Mandates Crypto Inclusion in State-Managed Retirement and Savings Plans

Indiana’s New Crypto Bill Bitcoin ETFs for Pension Funds

The post Indiana Mandates Crypto Inclusion in State-Managed Retirement and Savings Plans appeared first on Coinpedia Fintech News

Indiana has become the first state in the US to legalize the inclusion of Bitcoin and other cryptocurrencies into state-managed retirement and savings plans.

On March 3, Indiana Governor Mike Braun signed this into law under House Bill 1042, titled “Regulation and Investment of Cryptocurrency.”

Henceforth, state-managed retirement and savings plans should provide at least one cryptocurrency as an investment option in a user’s self-directed brokerage account. This kind of account will allow users to operate nodes and engage in peer-to-peer transactions.

Exchange-traded funds (ETFs) can be included in these plans, but not stablecoin-related funds due to the current lack of clarity regarding stablecoin yields. 

Pension providers now have until July 1, 2027, to have fully integrated digital asset provisions into their systems.

Indiana Bill to include crypto investments for pensioners

The Indiana bill levels the playing field for digital and traditional finance, banning any taxes that bring discrepancies between the two.

Also part of the bill was the prohibition of unreasonable restrictions on crypto mining zones.

Crypto included in pension fund portfolio in Indiana

Source: X

Other US states that have integrated crypto-related options for pensioners are Wisconsin ($321 million in Bitcoin ETFs) and Michigan ($45 million in BTC and ETH ETFs). Florida and New Jersey are in the process of doing the same.

Internationally, countries that have implemented or are exploring the incorporation of digital assets into pension funds include Canada, Japan, Australia, and Germany.

Providing these at the workplace are Fidelity Investments, 401(k) providers, and self-directed IRA (Individual Retirement Account) custodians.

Community Reaction

The new Indiana legislation has received mixed community reactions following its enactment. Supporters cite the bill’s alignment with the US Strategic Bitcoin Reserve, its progressive nature, and the provision of pensioners’ autonomy.

On the other hand, critics cite financial risk from dabbling in highly volatile financial instruments, in addition to the state’s distancing itself from direct digital asset investments. The bill also raised controversy regarding Indiana’s specific stance when it comes to cryptocurrencies amid the recent scam-related ban of crypto ATMs.

Iranians Increase Self-Custody Bitcoin Reserves Amid Iran-Israel War

Bitcoin Price Prediction by Wikipedia Co-Founder $10,000 or Lower for BTC

The post Iranians Increase Self-Custody Bitcoin Reserves Amid Iran-Israel War appeared first on Coinpedia Fintech News

Citizens of Iran are heavily purchasing Bitcoin (BTC) and directing it to self-custody wallets. 

A 2026 report from blockchain analytics firm Chainalysis showed an uptick in Iran’s crypto system valuation from $7.4 billion in 2024 to $7.8 billion in 2025. 

The report also highlighted that users withdrew roughly $10.3 million worth of cryptocurrencies from major Iranian exchanges to crypto wallets in the 48hours following the US-Israel’s preemptive strike on Iran. Within minutes of the hit, the country’s largest exchange, Nobitex, saw a staggering 700% spike in outflows.

This coincided with a steady uptrend in Bitcoin outflows before and after the January 8 government-imposed internet blackout.

Bitcoin outflows from exchanges in Iran

Source: Chainalysis

Bitcoin becomes the financial lifeboat for Iranian citizens

Bitcoin has primarily become a financial haven for Iranians since its long-term value acts as an inflationary hedge. Iran’s native currency, the Rial, has declined 90% in value since 2018. Inflation in the country has also escalated to 40-50%, the highest recorded since World War II.

Additionally, Bitcoin in self-custodial wallets is immune to state/exchange restrictions and security vulnerabilities. In mid-2025, Nobitex suffered a $90 million hack, while Tether continues to blacklist addresses and freeze USDT funds for alleged Iranian conspirators. 

Meanwhile, the nation’s central bank (CBI) has suspended rial-crypto conversions several times to prevent further devaluation of the rial. The bank has recently become more accommodating of cryptocurrencies, but on the condition of real-time user surveillance.

Another reason for the migration is the January government-imposed internet blackout, which rendered cryptocurrencies on exchanges useless. Additionally, cryptocurrencies’ digital nature makes them highly portable for those anticipating fleeing the country. 

Most importantly, cryptocurrencies allow cross-border remittances despite sanctions such as the SWIFT bank line of disconnects.

Researchers now estimate that 15 million Iranians (20% of the population) are involved with or using Bitcoin, among other cryptocurrencies.

Iran joins sanctioned countries in Bitcoin adoption

Iran, Russia, Venezuela, and North Korea are sanctioned countries that are increasingly pivoting towards cryptocurrencies to bypass international trade restrictions.

Crypto firms Binance and, ironically, the Trump-backed World Liberty Financial (WLFI) are now facing Senate probes related to Iran-linked flows.

Cardano Price Weakens as Buying Pressure Fades—Is a 10% Correction Ahead?

Cardano (ADA) Reclaims a Key Resistance—Is a Major Rally About to Begin

The post Cardano Price Weakens as Buying Pressure Fades—Is a 10% Correction Ahead? appeared first on Coinpedia Fintech News

Cardano (ADA) price is once again struggling near the $0.30 region, and the latest daily structure doesn’t inspire much confidence for the bulls. After a brief recovery attempt in February, the price has started to stall, suggesting that buying pressure is losing strength.

After breaking down from the $0.33–$0.37 range earlier this year, ADA price has struggled to regain structural strength. The recent bounce appears corrective rather than impulsive, raising the possibility of another leg lower.

ADA Faces Strong Overhead Resistance

On the chart, the $0.30–$0.31 zone continues to act as firm resistance. Every push into this area has been met with selling, preventing ADA from building any meaningful upside momentum. Instead of forming higher highs, the price has drifted sideways to lower, a sign that the recent bounce may have been more of a relief move than the start of a new uptrend.

ada price

At the same time, ADA is hovering just above a rising trendline near $0.25–$0.26. This level has quietly supported the price over the past few weeks. But the support is getting tested more frequently, and that usually weakens it. If this trendline gives way, a move toward $0.24 becomes increasingly likely, roughly a 10% drop from current levels.

Momentum indicators are also leaning cautiously. The MACD is flattening after a short-lived recovery, and the RSI remains below the 50 mark. That typically signals that bulls haven’t fully regained control. Volume hasn’t expanded meaningfully during recent upside attempts either, which makes the rebound look hesitant rather than convincing.

Key Levels to Watch

  • Immediate Resistance: $0.30–$0.31
  • Major Resistance: $0.33
  • Trendline Support: $0.25–$0.26
  • Downside Target: $0.24

A decisive break below $0.25 could accelerate downside momentum toward the $0.24 region. Conversely, ADA would need a strong daily close above $0.31 to invalidate the near-term bearish outlook.

Conclusion

Cardano’s daily structure suggests that bullish momentum is weakening as the price remains capped below key resistance. While support has not yet broken, the fading strength in indicators increases the risk of a 10% pullback if the current trendline fails.

Unless ADA price reclaims the $0.30–$0.31 zone with conviction, the path of least resistance appears tilted to the downside.

XRP Price Volatility Explodes as Open Interest Collapses 70%

XRP exchange supply ratio analysis

The post XRP Price Volatility Explodes as Open Interest Collapses 70% appeared first on Coinpedia Fintech News

The XRP price is flashing signals that traders can’t afford to ignore. Thirty-day realized volatility has just spiked to levels not seen since March 2025. Historically, when that happens, a massive XRP price move follows. Volatility doesn’t just wake up one morning and stretch like this for no reason. Something is building.

But let’s be real, while volatility expands, price hasn’t been kind. XRP has fallen from $3 to $1.35. That’s not a minor pullback. That’s a structural unwind.

XRP Price Volatility Sends Warning

A spike in 30D realized volatility usually means one thing: compression is over. Every previous time this metric reached similar levels, XRP didn’t drift sideways in fact it moved. Hard.

So what does the current XRP price chart suggest? It shows tension. A coiled spring. Traders tracking XRP price prediction narratives know volatility expansions tend to resolve decisively. The direction, though, is where the debate begins.

XRP Price Volatility Explodes as Open Interest Collapses 70%

Open Interest Wiped Out

According to analyst Amr Taha, Across major derivatives exchanges, XRP open interest has cratered. On October 6, 2025, total OI peaked at $660 million. As of March 3, 2026, that number sits at $203 million. That’s a $457 million wipeout in five months.

Binance leads the drop. Meanwhile, Bitfinex and Bitmex OI levels have shrunk to $4.3 million and $3 million respectively tiny compared to prior figures.

And here’s a historical nugget: the last time Binance XRP OI fell to similar levels was April 2025, when it hovered around $270 million. Back then, XRP formed a major bottom near $1.80 before rallying. Different price zone now, sure. But the pattern rhymes.

XRP Price Volatility Explodes as Open Interest Collapses 70%

XRP/USD Leverage Flush

Falling open interest combined with a falling XRP price usually signals one thing that positions are getting closed. Either traders are voluntarily cutting exposure, or liquidations are forcing their hands.

When excessive futures positioning gets cleared, markets reset. Historically, those reset phases have aligned with local bottoms. 

So what’s next? With XRP/USD volatility surging and leverage largely washed out, the setup is cleaner than it’s been in months. The XRP price now sits at a crossroads where history suggests big moves follow extreme volatility spikes.

Solana Price Coils at $84: Is Solana Price Ready to Breakout?

Solana Tops Blockchain Revenue Charts as SOL Price Nears $200—Can the Rally Continue?

The post Solana Price Coils at $84: Is Solana Price Ready to Breakout? appeared first on Coinpedia Fintech News

The Solana price is hovering at $84.83, and the market can’t quite decide whether to yawn or brace for impact. Daily volume is pushing past $5 billion. Down 2.18% in the last 24 hours, sure but still up 8.94% on the week. That’s not exactly panic. With 570 million SOL in circulation, the market cap sits at $47.8 billion. In other words, there’s real money parked here, and it’s not flinching.

Solana Price Holds Channel Support

Zoom out to the weekly Solana price chart and things get interesting. Price action continues to respect a long-term ascending channel. The lower boundary, around $80–$85, has historically acted like a trampoline whenever price touches it, then springs higher toward the midpoint.

Right now, SOL is pressing against that same zone again.

Key resistance levels sit at $240, then the bigger psychological hurdles at $500 and $1,000. Stretch the imagination further and the channel’s upper region sits near $3,500 this cycle assuming liquidity shows up and adoption keeps pace. That’s a big “if,” but technically, the structure hasn’t broken.

Solana Price Coils at $84: Is Solana Price Ready to Breakout?

SOL/USD Faces the $90 Test

Short term, the SOL/USD pair is trapped in a narrowing range. Repeated rejections at $90 scream overhead supply. At the same time, every dip toward $70 finds buyers waiting.That’s textbook compression.

So, what’s next? A daily close above $90 could open the door to $105–$120 and validate the breakout narrative many traders are eyeing in their Solana price prediction thories. But lose the $80 mid-range support, and $70 gets revisited fast. Markets don’t hesitate when ranges break.

Solana Price Coils at $84: Is Solana Price Ready to Breakout?

Whales Accumulate While Retail Hesitates

The internal price data suggests bigger players are leaning bullish. The Whale vs. Retail Delta on Binance Perps just printed a strong 1.140 green spike. Translation? Large participants are quietly buying this consolidation zone near $84.62.

Solana Price Coils at $84: Is Solana Price Ready to Breakout?

Volume tells a similar story. Daily buy volume stands at 7.732M versus 6.237M in sell volume roughly 24% more aggressive buying pressure during a sideways grind. That’s not retail FOMO. That’s calculated accumulation.

Meanwhile, Chaikin Money Flow sits at 0.02, signaling steady capital inflows. RSI at 44.74? Neutral. Not overbought, not exhausted. Plenty of room to expand if momentum flips.

The daily chart’s tight consolidation box says volatility is loading. EMA bands are flattening. Price holds above $80.

The Solana price isn’t surging yet, but it’s consolidating, indicating a forthcoming direction.

MARA Updates Bitcoin Strategy, May Sell Some Reserves

MARA Updates Bitcoin Strategy, May Sell Some Reserves

The post MARA Updates Bitcoin Strategy, May Sell Some Reserves appeared first on Coinpedia Fintech News

MARA Holdings revised its treasury strategy to allow the potential sale of Bitcoin holdings that were previously held long term, according to its latest SEC filing. As of December 31, 2025, the company held 53,822 BTC, with about 9,377 BTC loaned out and 5,938 BTC pledged as collateral against debt. The policy change gives MARA greater flexibility to manage liquidity and balance sheet needs, signaling a shift from its earlier strict long‑term holding approach toward a more active digital asset strategy.

SoFi and Mastercard Launch Bank-Backed Stablecoin

SoFi and Mastercard Launch Bank-Backed Stablecoin

The post SoFi and Mastercard Launch Bank-Backed Stablecoin appeared first on Coinpedia Fintech News

SoFi, the first U.S. nationally chartered and FDIC-insured bank to issue a stablecoin on a public blockchain, has partnered with Mastercard to use SoFiUSD for global payment settlements. Launched in December 2025 and fully backed by cash reserves, SoFiUSD enables instant 24/7 transactions for businesses, cross-border remittances, and B2B payments. SoFi CEO Anthony Noto called it a key step toward faster, cheaper, and safer money movement, while Mastercard highlighted how it combines regulated digital currency with its trusted scale amid $30 billion in daily stablecoin volume.

Bitcoin Whale Targets $72K—Can BTC Price Rise as Selling Pressure Fades?

Will Bitcoin Hit $75K, As Institutions See A Dip Opportunity

The post Bitcoin Whale Targets $72K—Can BTC Price Rise as Selling Pressure Fades? appeared first on Coinpedia Fintech News

Bitcoin price is hovering between $66,000 and $68,000, struggling to reclaim the $70,000 level that has capped upside for more than a month. Despite repeated rejections, the broader structure remains intact, with bulls quietly defending support while selling pressure appears to be easing.

On-chain data now shows a noticeable slowdown in long-term holder distribution, suggesting that aggressive selling has cooled. This shift has strengthened expectations among larger market participants that Bitcoin could attempt a move toward the $72,000 region if resistance finally gives way.

The key question, however, remains unresolved: will fading distribution provide enough fuel for a breakout, or will leveraged bets and overhead supply continue to keep BTC trapped below $70,000?

Long-Term Holders Are No Longer Selling Aggressively

According to Glassnode’s Long-Term Holder Net Position Change metric, months of distribution appear to be slowing. The chart shows an extended red phase throughout late 2025, indicating long-term holders were reducing exposure during previous rallies.

However, recent data suggests this trend is stabilizing. The shift toward neutral and slightly positive net positioning implies that large, long-term participants are no longer aggressively selling into strength.

btc price

Historically, when long-term holder distribution fades, Bitcoin often enters a consolidation phase before attempting a renewed upside move. While accumulation has not yet turned aggressive, the decline in net selling suggests that supply pressure may be thinning.

This structural shift matters because long-term holders typically represent stronger hands within the market cycle.

$40 Million 40x Short Position Raises Volatility Risk

At the same time, derivatives data reveal a significant leveraged position in play. A trader has opened a $40.1 million short position on Bitcoin using 40x leverage, with an entry near $67,018. The liquidation level for this position sits around $72,322. In simple terms, if Bitcoin rises roughly 7–8% from here, that position gets wiped out.

btc price
Source: X

This creates an important technical setup where, if a break above $70,000 is coupled with an increase in the bullish momentum, it may bring the short positions into danger. At 40x leverage, even a relatively modest upside move can trigger forced liquidation. If that happens, automated buying pressure could push BTC rapidly toward or beyond $72,000. However, as long as Bitcoin remains below $70,000, the short position remains structurally intact.

What Happens Next?

There are two realistic paths.

If buyers absorb supply and push BTC price above $70,000, the fading long-term selling pressure combined with a vulnerable short position could create a squeeze toward $72,000 or higher. But if resistance holds again, Bitcoin may continue consolidating below $70,000 while leverage slowly unwinds.

The market isn’t euphoric. It isn’t panicking either, but coiled. And the next breakout attempt could determine whether $72,000 becomes the next milestone for the Bitcoin (BTC) price rally or remains just out of reach.

Why Is Silver Falling? Jane Street’s $1.3B SLV Bet Sparks Manipulation Debate

Gold, Silver Hit New All-Time Highs, Bitcoin Fell To $92K, Here’s Why

The post Why Is Silver Falling? Jane Street’s $1.3B SLV Bet Sparks Manipulation Debate appeared first on Coinpedia Fintech News

The firm accused of crashing Bitcoin daily and front-running the $40 billion Terra collapse is also the largest holder of the world’s biggest silver ETF.

Jane Street added a record 20.6 million shares of BlackRock’s iShares Silver Trust (SLV) in Q4 2025, per its latest 13F filing. That is a jump from roughly 41,000 shares the prior quarter. A 500x increase in one filing.

The position is worth approximately $1.3 billion. It places Jane Street above BlackRock itself, which added zero new shares, and Morgan Stanley, which sold 3.7 million.

87% Options, One Big Question

Over 87% of Jane Street’s $662 billion portfolio sits in options, according to filings cited by Bull Theory on X. The firm profits by creating and trading volatility with massive leverage.

When a firm with that kind of options exposure also controls the largest chunk of a physical silver ETF, the structure raises questions.

Same Firm, Three Markets, Three Accusations

Jane Street now faces allegations across three asset classes.

Terraform Labs’ bankruptcy administrator sued the firm for alleged insider trading during the 2022 Terra collapse. The lawsuit claims a Jane Street-linked wallet pulled 85 million UST from Curve3pool within minutes of Terraform’s unannounced $150 million withdrawal.

In India, SEBI accused the firm of manipulating the Bank Nifty index across 18 derivatives expiry days and ordered it to deposit roughly $566 million. The appeal hearing was adjourned February 25.

In crypto, traders accused Jane Street of running a daily “10 AM dump” on Bitcoin. That pattern allegedly broke after the Terraform lawsuit surfaced.

Jane Street has denied all claims, calling the Terraform suit “desperate” and “baseless.”

JPMorgan, the custodian of SLV’s physical silver, paid $920 million in 2020 to settle CFTC charges for spoofing precious metals over eight years.

What Silver Traders Should Watch

Silver has fallen over 30% from its January high near $121, dropping another 6.6% on March 3 to around $83. This is partly driven by broader market stress from the U.S.-Israel military strikes on Iran.

But the structural concern runs deeper. When the same firm faces manipulation accusations in equities, crypto, and stablecoins, then builds the largest position in the world’s biggest silver ETF backed by an options-heavy portfolio, traders are paying attention.

No regulator has opened a formal silver investigation yet.

Bank of Japan Launches Blockchain Settlement Sandbox, XRP Ledger be Chosen?

Bank of Japan Launches Blockchain Settlement Sandbox, XRP Ledger be Chosen

The post Bank of Japan Launches Blockchain Settlement Sandbox, XRP Ledger be Chosen? appeared first on Coinpedia Fintech News

Japan has always been quick to adopt blockchain. Today, the Bank of Japan has launched a new blockchain settlement sandbox to test moving central bank reserve money on-chain. While no network has been officially chosen, Japan’s deep ties with Ripple and the XRP Ledger (XRPL) are drawing attention across global financial markets.

BOJ Tests On-Chain Settlement for Reserve Deposits

Governor of the BOJ, Kazuo Ueda, announced that the Bank of Japan will launch a sandbox program to test using blockchain for central bank money. The goal is to let banks move their reserve money on-chain using instant transfers and smart contracts.

This is not about retail crypto or public token trading. It involves real central bank money that commercial banks hold at the BOJ.

The sandbox program will reportedly test atomic transactions (instant and final settlement), smart contract functionality, artificial intelligence integration, and compatibility with BOJ-NET, Japan’s core interbank settlement system. 

If successful, this could modernize how large financial transfers are processed in the country.

Japan has already been researching a digital yen under its central bank digital currency (CBDC) experiments. However, this new sandbox appears focused more on infrastructure efficiency rather than issuing a retail CBDC.

Ripple Already Active in Japan’s Blockchain Ecosystem

The development becomes more interesting when viewed alongside SBI Holdings’ long-standing relationship with Ripple. SBI, one of Japan’s largest financial groups, has owned roughly 9% of Ripple since 2016.

Over the years, SBI and Ripple have already been running cross-border payment services using the XRP Ledger (XRPL). 

Meanwhile, SBI recently launched a ¥10 billion digital bond with XRP-linked incentives and signed an agreement to help distribute Ripple’s RLUSD stablecoin in Japan.

Bank of Japan Might Choose XPR Ledger

The Bank of Japan’s blockchain settlement testing does not confirm any specific ledger choice.

Perhaps, some market participants believe that if the Bank of Japan chooses a blockchain system in the future, it could be XRPL, since it is already connected to parts of Japan’s financial system.

Ripple CEO Brad Garlinghouse has previously praised Japanese policymaker Taira Masaaki for supporting blockchain growth. 

He stated that Japan’s leaders are committed to advancing crypto and blockchain technology through clear regulatory frameworks.

Pi Price is Surging Today—How High Can PI Go Next?

Pi Price is Surging Today—How High Can PI Go Next

The post Pi Price is Surging Today—How High Can PI Go Next? appeared first on Coinpedia Fintech News

Pi Network price has rebounded from recent lows near $0.14 and is now trading around $0.17 on the daily timeframe. The recovery comes as momentum indicators improve and the price approaches a crucial range, signaling short-term stabilization after an extended decline. However, the move is unfolding just below a critical resistance zone close to $0.2, where previous breakdown pressure emerged. 

At the same time, recent on-chain wallet transfers linked to the core team have introduced potential supply-side uncertainty into the setup. This raises the concern over the upcoming price action, whether the PI price will break above $0.2 to reach $0.22 or slip back into the bearish range. 

Pi Price Analysis: Supply Pressure Meets Key Resistance

Pi Network is currently trading near $0.170 after rebounding from recent lows around $0.14. On the daily timeframe, price has recovered toward the mid-Bollinger Band, signaling short-term stabilization following a prolonged downtrend.

However, the broader structure remains cautious. The $0.19–$0.20 zone continues to act as a key resistance area, previously serving as breakdown support. Unless this level is reclaimed decisively, the current move appears to be a relief bounce rather than a confirmed trend reversal.

pi price

The RSI has climbed back above 50, indicating improving momentum, but it has not entered bullish expansion territory. This suggests buyers are regaining control gradually, not aggressively.

Adding to the technical setup, recent on-chain data shows wallets linked to the Pi Core Team transferring significant amounts of PI tokens to exchange-associated addresses. While such transfers do not confirm immediate selling, they increase the potential for supply to enter the market. This creates short-term uncertainty, particularly as the price approaches resistance. If additional tokens are distributed near the $0.19–$0.20 supply zone, upside momentum could remain capped.

How High Can Pi Price Go?

The current price action reflects a recovery attempt rather than a confirmed trend reversal. Technically, PI must reclaim the $0.19–$0.20 resistance zone with strong volume to shift momentum decisively in favor of buyers. If this materialises, a move beyond $0.23 could be imminent, which is the major resistance to achieve. 

However, the momentum may fade for a while around this range, but if the bulls manage to reclaim the levels after a brief correction, reaching $0.3 may not be a tedious job for the Pi price rally. 

Why Jupiter Price Has Skyrocketed This Week: Here Are the Key Drivers

Why Jupiter Price Has Skyrocketed This Week Here Are the Key Drivers

The post Why Jupiter Price Has Skyrocketed This Week: Here Are the Key Drivers appeared first on Coinpedia Fintech News

Jupiter price has quietly become one of the strongest performers this week. While much of the market has been moving cautiously, JUP has climbed more than 24% over the past seven days, and the move doesn’t look random. Institutional capital stepped in. A major supply unlock was absorbed without panic. And technically, the chart has shifted from compression to expansion. When those pieces align, markets tend to pay attention.

So what exactly pushed Jupiter higher, and can this momentum continue?

The $35M Institutional Backing That Changed Sentiment

The biggest catalyst came from ParaFi Capital, which committed $35 million into Jupiter. That number matters, but the timing matters even more.

The investment was announced during broader market weakness, when many funds were reducing risk exposure. Instead of stepping back, ParaFi leaned in. The allocation reportedly includes long-term positioning rather than short-term trading exposure, signaling conviction in Jupiter’s role inside the Solana ecosystem. Institutional capital entering during uncertain conditions often shifts sentiment quickly. Traders see it as a vote of confidence, not just liquidity. That narrative alone helped reprice expectations around JUP.

Supply Shock That Never Materialized

At the same time, Jupiter faced a significant test. Roughly 253 million JUP tokens, worth about $36 million, were unlocked as part of scheduled vesting. In weaker conditions, events like this typically trigger heavy selling.

Instead, the price moved higher. That tells you demand was strong enough to absorb the additional supply. When large unlocks fail to push price down, it often signals accumulation underneath the surface. Markets tend to reward that kind of resilience.

Jupiter Price Chart Finally Broke Out

For weeks, JUP had been stuck inside a descending wedge pattern. Lower highs pressed price downward, while buyers quietly defended support near the $0.135 region. That compression finally resolved upward. 

Jupiter price

JUP price broke through descending resistance with rising volume, the kind of breakout traders look for when confirming trend reversals. Momentum indicators also shifted higher, with RSI pushing above 60 without entering overbought territory. In simple terms, the market stopped drifting and started expanding. And that shift is what fuels continuation rallies.

Key Levels to Watch

JUP price now faces its first real test near the $0.18–$0.20 range. Clearing that zone convincingly could open room toward $0.22–$0.24, where previous supply once capped upside. On the downside, $0.16 has become the level bulls must defend. If price falls back below it, the breakout narrative weakens. For now, structure favors continuation, but confirmation requires holding above former resistance.

What’s Next for Jupiter (JUP) ?

Jupiter’s 24% weekly surge isn’t built on hype alone. It’s supported by institutional capital, supply absorption, and a clean technical breakout.

If broader market conditions remain stable and buyers defend support, JUP could extend this move further. However, resistance ahead will determine whether this is the start of a larger expansion phase or simply a sharp relief rally. For now, Jupiter has shifted from quiet consolidation to active momentum, and traders are watching closely to see how far it can run.

$400 Million Liquidation, Geopolitical shocks—Investors Are Turning to Contract-Based Income-Generating Investments for Returns

fort-miner

The post $400 Million Liquidation, Geopolitical shocks—Investors Are Turning to Contract-Based Income-Generating Investments for Returns appeared first on Coinpedia Fintech News

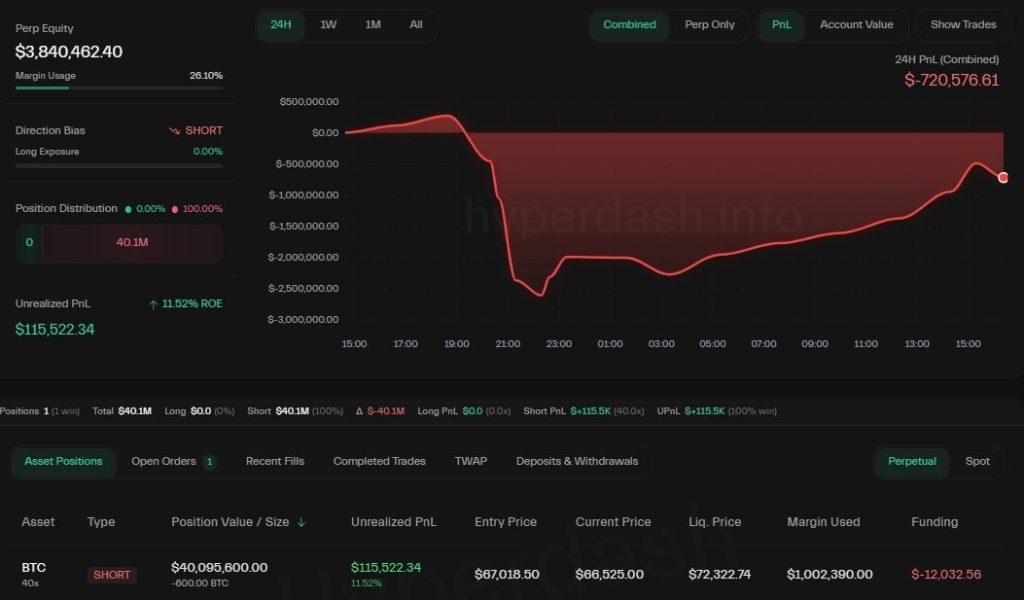
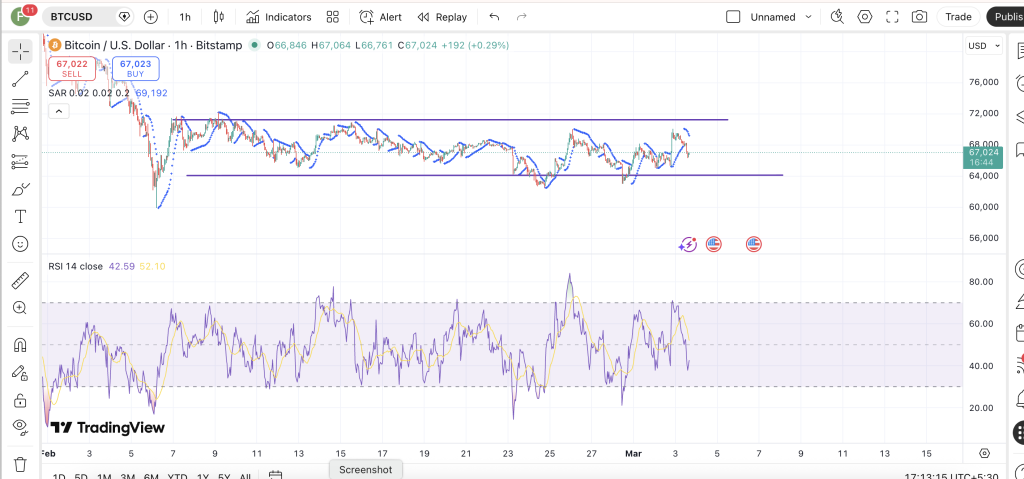
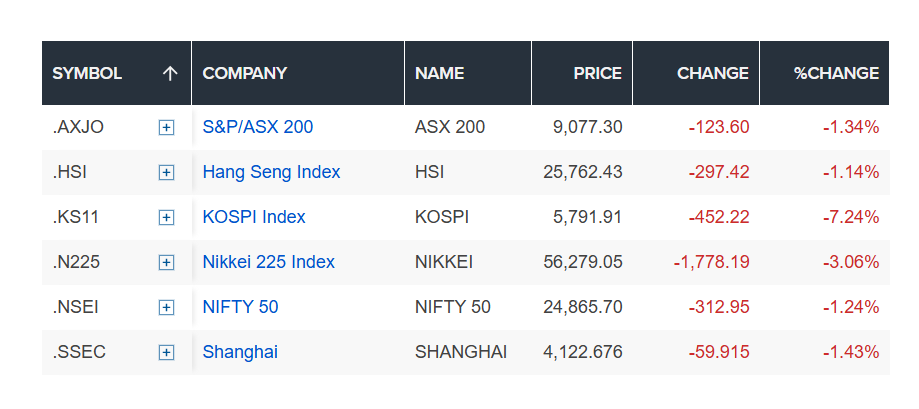
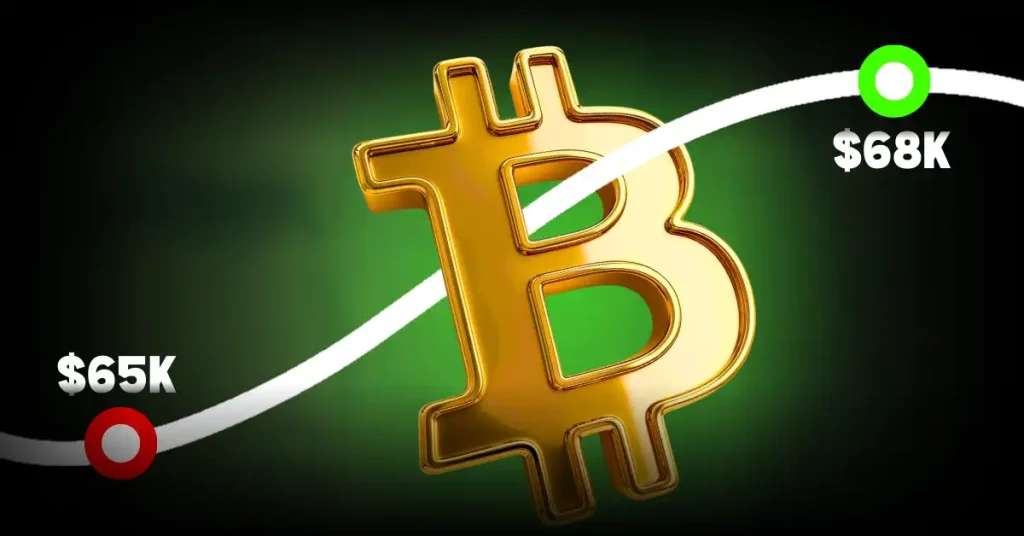
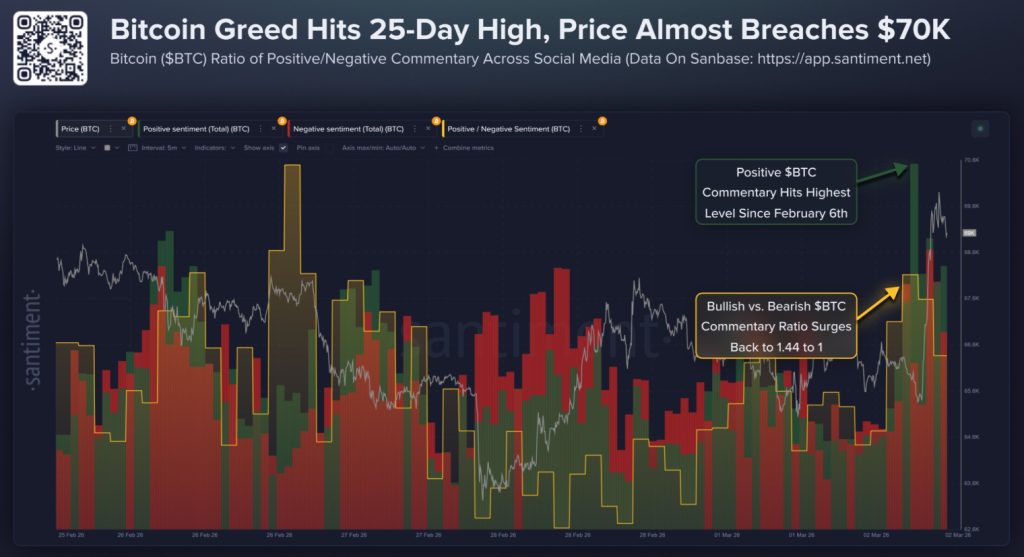
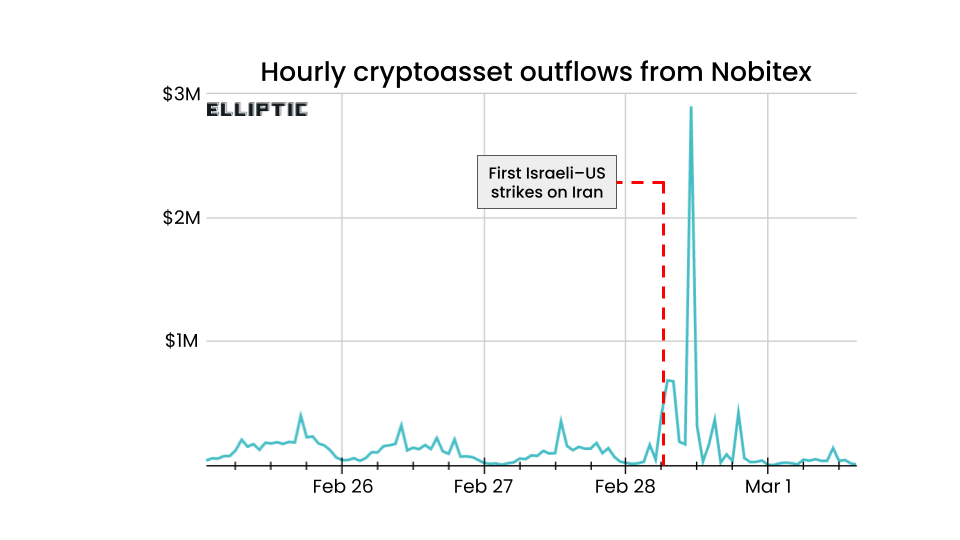
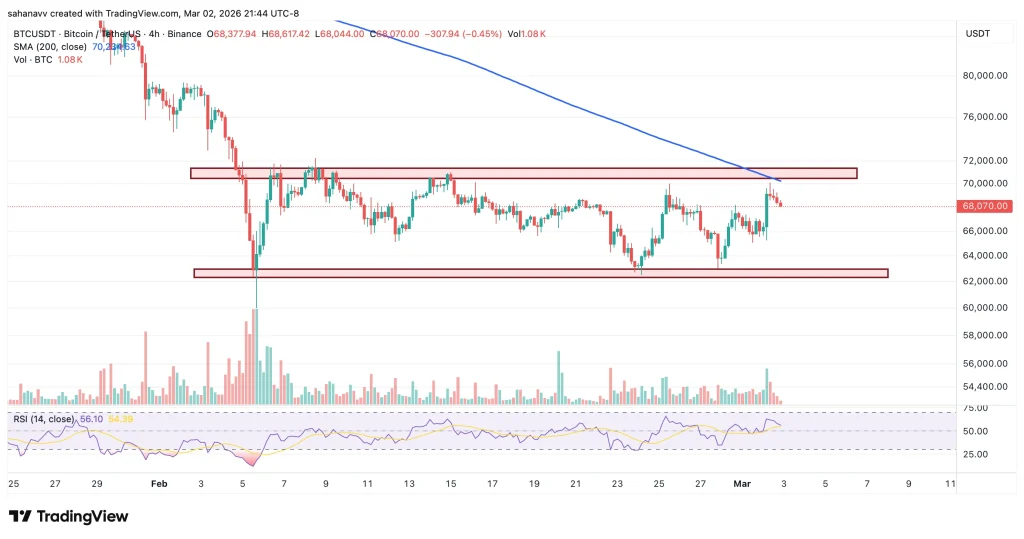
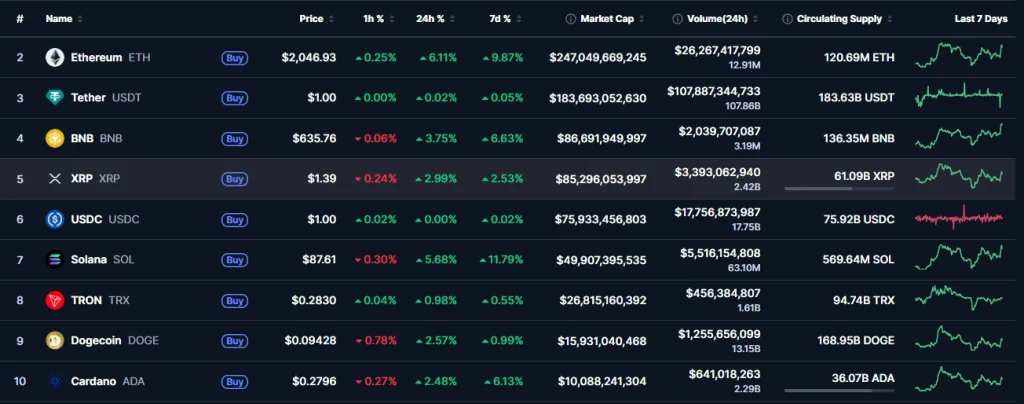
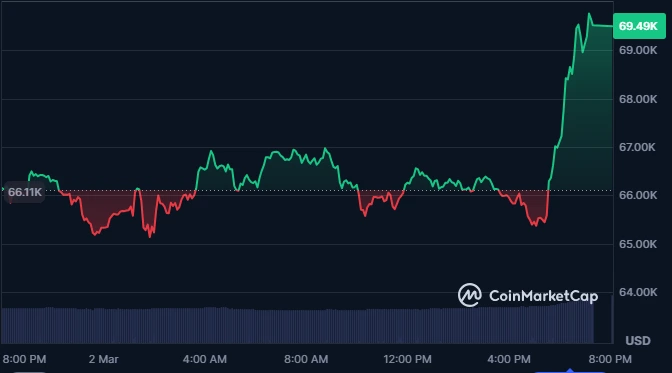
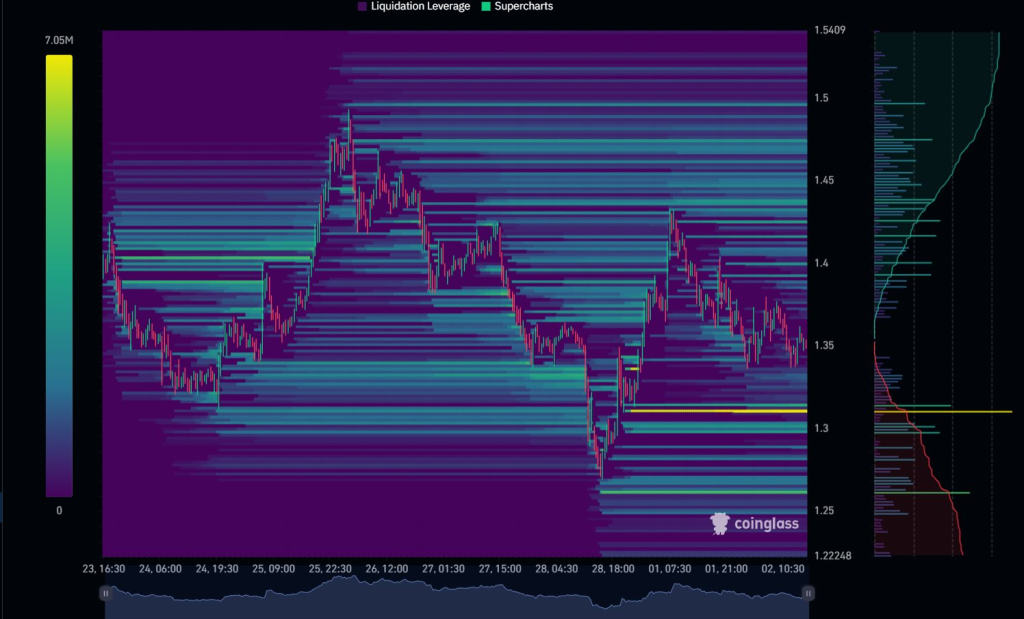
At the beginning of March, the cryptocurrency market once again experienced intense turbulence. Bitcoin briefly pushed toward a major psychological level before pulling back amid escalating geopolitical tensions and broader volatility across global risk assets. Within just 24 hours, more than $400 million in liquidations were recorded across the crypto market, wiping out both long and short positions and amplifying uncertainty.

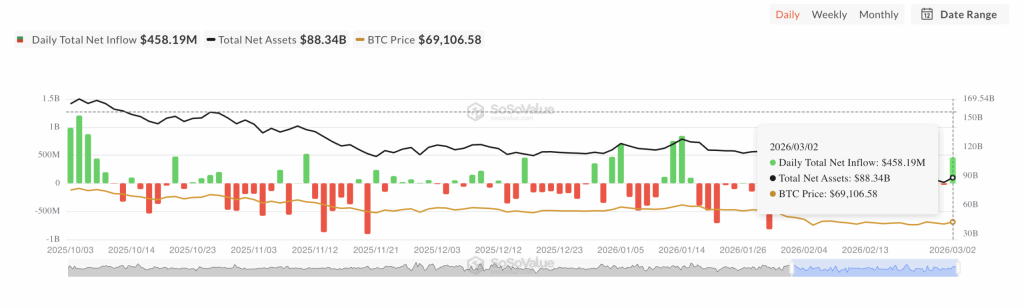
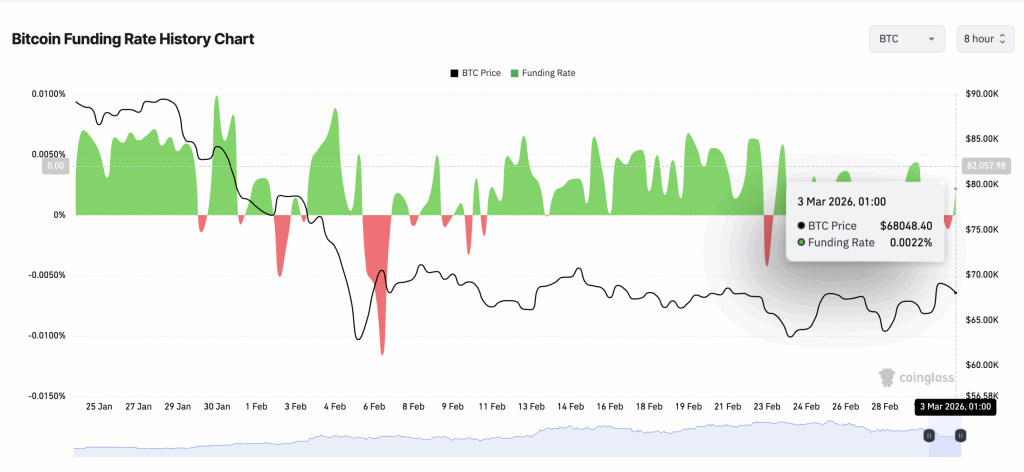
On one hand, some analysts argue that Bitcoin continues to demonstrate relative resilience despite macro pressure. On the other hand, sharp price swings and tightening liquidity conditions have made short-term direction increasingly difficult to predict. ETF flows, policy expectations, and geopolitical developments are all interacting, creating a highly uncertain environment.

Against this backdrop, more investors are asking a fundamental question:
When volatility becomes the norm, is there a more structured and rule-based way to participate?

From Price Speculation to Computing Infrastructure

Blockchain networks do not stop operating when prices fluctuate. Whether in bull markets or volatile consolidation phases, miners continue securing networks and earning block rewards by providing computing power.

Compared to short-term trading and leverage-driven strategies, contract-based cloud mining emphasizes participation in core infrastructure rather than simply betting on price direction. This structured approach is increasingly gaining attention as investors seek alternatives to high-volatility speculation.

Within this evolving landscape, London-based global cloud mining platform FORT Miner is emerging into the spotlight.

FORT Miner: A Technology-Driven Global Cloud Computing Platform

Headquartered in London, United Kingdom, FORT Miner is dedicated to providing secure, transparent, and efficient cryptocurrency mining power services to users worldwide.

Leveraging advanced blockchain infrastructure, intelligent hashrate scheduling systems, and a globally diversified mining network, FORT Miner has established an international operational framework and earned growing trust within the industry.

The company’s core team members come from globally recognized technology leaders such as Amazon, Bitmain, and Coinbase, bringing deep expertise in blockchain architecture, AI-driven computing optimization, energy management, and data center operations.

FORT Miner’s vision is clear:
To become a world-leading computing power technology platform, enabling users worldwide to participate fairly in the digital economy without requiring hardware ownership or technical expertise — while promoting greater transparency, security, and sustainability across the blockchain industry.

Core Advantages

🔹 Intelligent Hashrate Optimization
Algorithm-driven allocation of computing power and energy resources to maintain efficiency across different market cycles.

🔹 Multi-Regional Mining Deployment
Global infrastructure diversification reduces exposure to policy or energy fluctuations in any single region.

🔹 Transparent Revenue Mechanism
Users can monitor real-time operational data and earnings performance through a clear and trackable system.

🔹 Low Barrier to Entry
No need to purchase hardware or manage maintenance — participation is achieved through structured contract-based models.

How to Join FORT Miner

The participation process is straightforward and efficient:

1⃣ Visit fortminer.com and register an account

2⃣ Select a cloud mining contract that fits your investment preferences

3⃣ The system automatically deploys the corresponding hashrate — no technical setup required

4⃣ Earn mining rewards according to contract terms, with real-time data visibility

Contract Example: For additional details, please visit fortminer.com.

Experience Contract: Investment of $100, term of 2 days, daily return of $3.6, total return of $107.2 at maturity

Basic Level Mining Plan: Investment of $1200, term of 10 days, daily return of $17.04, total return of $1370.4 at maturity

Intermediate Mining Program: Investment of $5000, term of 20 days, daily return of $76.5, total return of $6530 at maturity

Advanced Mining Program: Investment of $30000, term of 25 days, daily return of $567, total return of $44175 at maturity

Flagship mining program: Investment of $100000, term of 30 days, daily return of $2150, total return of $164500 at maturity

After purchasing the contract, your earnings are guaranteed and automatically credited to your account every 24 hours. Your principal will be fully returned upon contract expiration. You can withdraw or reinvest at any time and enjoy compound interest.

Conclusion

As markets react to geopolitical shocks, macroeconomic uncertainty, and large-scale liquidation events, volatility has become a defining feature of the current crypto cycle. For many participants, the challenge is no longer solely about predicting price direction — it is about building a more resilient participation structure in an unpredictable environment.

Contract-based cloud mining models are emerging as one such alternative.

Before the next major market cycle unfolds, infrastructure strength and technological efficiency may ultimately prove to be the foundation of long-term competitiveness.

For more information, please visit the official FORT Miner website: fortminer.com

Will Bitcoin Hit $75K, As Institutions See A Dip Opportunity?

Will Bitcoin Hit $75K, As Institutions See A Dip Opportunity

The post Will Bitcoin Hit $75K, As Institutions See A Dip Opportunity? appeared first on Coinpedia Fintech News

Bitcoin acted as a good shock absorber for this time global chaos war-like event. It briefly dipped to $63000 after the U.S.-Israel-Iran attack, but had a quick rebound near $67,000 on Feb 28.

While indicators in mid-term paint a neutral to bearish continuation trend, the BTC Onchain data indicate a bullish approach of large and small investors. 

The ongoing market sentiments and performance indicators show a potential rally of Bitcoin Price to $75K, after breaking the horizontal channel formed since early Feb.

Bitcoin ETF’s Are All Green, Funding Rate Retuerned To Positive. 

The strong resilience of the Bitcoin price to a war situation has impressed institutional players; the big investors see this dip as an entry opportunity. 

As shown in SoSo data, Bitcoin BTC spot exchange-traded fund (ETFs), have recorded a total inflow of $458.19 million on March 2 Closing. Which is strong and concurrent. 

SOSO NET INFLW
Soso value : Bitcoin ETF inflow/Outflow

The flex is none of the 12 active ETFs registered any net outflow. Showing ‘Smart Money Confidence in big investors and so influencing the retail traders too. 

Additionally, Bitcoin’s funding rate is now back to the positive zone with a rate of 0.0022%. As the funding rate expresses a settlement between perpetual traders to keep the contract price in line with spot performance. 

Bicoin Funding Rate
Bitcoin Funding Rate : CoinGlass

A positive rate suggests long positions are in demand. 

The SAR Chart Denies Bullish Momentum 

While all the signs print a positive perspective for Bitcoin price growth, the indicator  Parabolic Stop and Reverse (SAR) stays bearish.

Bitcon SAR and RSI
Bitcon SAR and RSI


It is a trend reversal indicator that says having dots below the price line shows a bullish sign, and having dots above the price line is bearish.

Furthermore, the Relative Strength Index (RSI) at 42 shows growing selling pressure of the asset

BTC/USDT Targets $75K with a short pullback. 

Trading at $66,826 at press time, Bitcoin is travelling inside a horizontal channel since early February. 

Bitcoin has completed a strong bullish expansion after a clear market structure shift and is now pulling back into a key demand zone around $65K–$65.7K. 

BTC:USDT
BTC:USDT

Price is currently reacting from this support area, which could trigger a continuation move toward $69.6K, followed by a potential expansion toward $75K if buyers maintain control. 

However, a breakdown below $63.8K would invalidate the bullish outlook and open the door for a deeper correction.

Solana Meme Coin SANAE TOKEN Scandal: Creator Says ‘Not a Single Yen Earned’ as Japan PM Denies Link

Top MemeCoins Poised for Big Gains as Bitcoin Smashes $125K

The post Solana Meme Coin SANAE TOKEN Scandal: Creator Says ‘Not a Single Yen Earned’ as Japan PM Denies Link appeared first on Coinpedia Fintech News

Another Solana meme coin tied to a world leader just blew up, and not in the way its creators hoped.

Japan’s Prime Minister Sanae Takaichi has publicly denied any connection to SANAE TOKEN, a Solana-based meme coin that briefly surged to a $27.72 million market cap before collapsing to around $6 million.

Japan PM Issues Statement on X

Takaichi posted on X, stating, “I have absolutely no knowledge of this token, nor has my office been informed about what this token entails. We have not given any approval whatsoever in this matter.”

She added that she issued the statement “to ensure that the public does not labor under any misapprehensions.”

Within four hours of her post, the token’s value dropped more than 50%.

Who Created SANAE TOKEN?

The token was announced on February 25 by NoBorder, a YouTube channel run by Japanese entrepreneur Yuji Mizoguchi. It was positioned as an incentive token for a project called “Japan is Back,” a slogan Takaichi inherited from her mentor, former Prime Minister Shinzo Abe.

NoBorder said it chose the name because “sanae” symbolizes “a democratically elected leader.”

The token’s website does carry a disclaimer saying it is not affiliated with or endorsed by Ms. Takaichi. But the project drew criticism on social media, with users calling it misleading.

Creator Denies Profiting From the Token

NoBorder founder Yuji Mizoguchi responded to the controversy on X, stating, “We have not earned even a single yen in revenue from this matter.”

He acknowledged receiving significant backlash but pushed back against the pile-on.

“I’m not running this business to cut out my colleagues,” he wrote. “As a manager, I need to clarify the facts and where responsibility lies. We should face this not with emotions, but with facts.”

Mizoguchi also addressed delays in his public response, saying fact-checking and coordination with various parties were taking time.

On-Chain Data Raises Red Flags

According to GMGN data, the top three wallet addresses hold roughly 60% of the token’s supply. Multiple leading addresses showed significant token inflow activity, raising concentration concerns.

At the time of writing, SANAET is trading at $0.0075 with a market cap of around $7.5 million, down over 44% in the last 24 hours. The token has just 947 holders and less than $400K in liquidity backing it, according to DEXTools data.

Political Meme Coins Keep Crashing

This is not the first time a Solana meme coin linked to a political figure has caused turmoil.

Argentina’s President Javier Milei faced intense backlash after the LIBRA token, initially framed as having his backing, surged to a $4.5 billion valuation before crashing over 95%. That controversy triggered a federal investigation and a class action lawsuit.

Takaichi’s case is different. Unlike TRUMP or LIBRA, her involvement was never claimed by anyone with authority. The token was created entirely without her knowledge or consent, yet it still managed to reach a multimillion-dollar valuation before reality caught up.

Never Miss a Beat in the Crypto World!

Stay ahead with breaking news, expert analysis, and real-time updates on the latest trends in Bitcoin, altcoins, DeFi, NFTs, and more.

FAQs

What is the SANAE meme coin and why did it crash?

SANAE is a Solana-based token falsely implying ties to Japan’s Prime Minister. It crashed over 50% after she publicly denied any involvement.

Are political meme coins safe to invest in?

Political meme coins are highly risky, often driven by hype and rumors rather than fundamentals, making sharp crashes common.

Why do Solana meme coins crash so quickly?

Many rely on viral momentum, low liquidity, and concentrated token holdings, which can trigger rapid price collapses.

Are meme coins linked to politicians regulated?

Most operate without formal oversight, and false endorsement claims can raise legal and regulatory risks.

Bank of Japan Tests Blockchain for Faster, Safer Money Transfers

Bank of Japan Tests Blockchain for Faster, Safer Money Transfers

The post Bank of Japan Tests Blockchain for Faster, Safer Money Transfers appeared first on Coinpedia Fintech News

At the FIN/SUM2026 conference, Bank of Japan Governor Kazuo Ueda revealed a new blockchain sandbox project to experiment with settling central bank money, including interbank transfers and securities, using distributed ledger technology. The initiative aims to enable 24/7 instant settlement, improve efficiency, and explore tokenization, while managing risks such as smart contract vulnerabilities. It connects to international efforts such as Project Agorá, where central banks test tokenized deposits for cross‑border payments. The move positions Japan to balance innovation with financial stability as digital finance evolves.

Charles Hoskinson Says XRP Would Be a Security Under Crypto Clarity Act

Charles Hoskinson Confirms XRP Integration and Midnight Airdrop for Holders

The post Charles Hoskinson Says XRP Would Be a Security Under Crypto Clarity Act appeared first on Coinpedia Fintech News

While many in the industry were waiting for the Crypto Clarity Act to pass, a new debate has started around it. Cardano founder Charles Hoskinson warned that the bill could have classified XRP as a security at launch. He also criticized Ripple CEO Brad Garlinghouse for supporting the bill.

Hoskinson believes the proposal could harm the future of crypto in the United States.

So, how could this happen?

Hoskinson Says XRP Would Start as a Security Under Crypto Clarity Act

Speaking in a recent broadcast, Hoskinson argued that the Crypto Clarity Act, also known as H.R. 3633, places the burden of proof on crypto projects to show they are no longer securities. According to him, this could trap projects in long-term regulatory uncertainty.

To explain his concern, Hoskinson used XRP as a key example. He asked, “Gemini, would XRP be a security at the time of launch?”

Charles Hoskinson Says XRP Would Start as a Security Under Crypto Clarity Act

Explaining the Gemini answer, Hoskinson said that based on the bill’s framework, XRP would likely have been classified as an “investment contract asset,” meaning a security, when it first launched in 2012.

At that time, the XRP ledger was highly centralized and largely controlled by its founders, who later formed OpenCoin, renamed it Ripple Labs. 

Because the network depended heavily on the founders’ efforts and lacked decentralization, Hoskinson argued XRP would not have met the standard of a mature, decentralized blockchain in its early stage.

“This bill makes everything a security at the start,” Hoskinson said, adding that XRP, Cardano, Ethereum and others would have initially fallen into that category under the proposed rules.

Why This Bill is Dangerous for Future Crypto Projects?

Hoskinson described the bill as dangerous if not revised. He said the current wording means “everything starts as a security,” including XRP.

“Read the bill,” he urged viewers. “If everything starts as a security, what stops it from staying a security forever?”

XRP a security.

While older projects might eventually receive special treatment, he warned that new American crypto startups could face serious regulatory pressure.

He believes this structure could create loopholes for regulators, especially the SEC, to challenge or delay emerging blockchain innovations.

Ripple’s Garlinghouse Supports Regulatory Clarity

Ripple CEO Brad Garlinghouse has taken a different stance. He has publicly supported the Crypto Clarity Act, saying regulatory clarity is better than ongoing chaos. According to him, having clear rules would provide certainty for companies and investors. 

Earlier, Coinpedia reported that Garlinghouse said there was an 80% chance the bill could pass in April.

Meanwhile, a JPMorgan analyst, Coinbase CEO Brian Armstrong, and even a U.S. senator have recently suggested that the bill is likely to pass by mid-year, showing growing confidence around its approval.

Never Miss a Beat in the Crypto World!

Stay ahead with breaking news, expert analysis, and real-time updates on the latest trends in Bitcoin, altcoins, DeFi, NFTs, and more.

FAQs

Could the Crypto Clarity Act classify new crypto projects as securities?

Yes, under the bill, all new crypto could start as securities, creating potential regulatory hurdles for startups.

How would XRP have been affected by the Crypto Clarity Act?

XRP’s early centralized design could have made it a security at launch, limiting its legal flexibility in the U.S.

Does regulatory clarity help or hurt crypto innovation?

Clear rules provide certainty for investors and companies, but overly strict definitions could slow emerging U.S.-based projects.

Top Five Reasons March 2026 Could Shape the Next Crypto Rally

Crypto market outlook March 2026

The post Top Five Reasons March 2026 Could Shape the Next Crypto Rally appeared first on Coinpedia Fintech News

Crypto markets enter March 2026 facing a mix of policy decisions, economic signals, and industry events that could shape the next phase of the cycle.

A video published by FireHustle describes the month as unusually active. At the same time, new data from CryptoQuant shows that large parts of the market remain under pressure.

Five Developments in Focus

Lawmakers in Washington are reviewing the Clarity Act, a bill that would define which digital assets fall under commodities law and which qualify as securities. Clear classification rules could affect how institutions allocate capital in the sector.

On March 18, the Federal Reserve will announce its latest interest rate decision. After easing liquidity tightening in late 2025, markets are looking for guidance on whether rate cuts or a pause could follow. In past cycles, looser financial conditions have supported risk assets, including crypto.

Two industry events are also scheduled this month. The DC Blockchain Summit in Washington and the Digital Asset Summit in New York are expected to draw regulators, asset managers, and crypto firms. Public comments from officials at these events often move markets.

March will also bring fresh U.S. economic data, including inflation and labor reports, which could influence expectations around rates and liquidity.

Meanwhile, the Bitcoin network is nearing the mining of its 20 millionth coin. The protocol caps total supply at 21 million.

Bitcoin May Lead While Altcoins Remain Under Pressure

The FireHustle analysis outlines a familiar pattern from prior cycles. Capital often flows into Bitcoin first. Gains in Bitcoin have at times been followed by stronger moves in select altcoins.

Data from CryptoQuant presents a different picture for much of the altcoin market.

According to the firm, 38% of altcoins are trading near their all-time lows. CryptoQuant analyst Darkfost said this marks the largest altcoin pullback of the current cycle. The decline exceeds levels seen after the collapse of FTX in 2022.

The data shows liquidity has not meaningfully spread beyond Bitcoin. Many smaller tokens continue to record weak demand based on on-chain metrics tracked by the firm.

March Could Set the Tone

Regulatory decisions, central bank policy, and public statements from officials could influence capital flows in the weeks ahead.

If liquidity improves, Bitcoin has historically moved first. Whether altcoins follow may depend on sustained demand returning to the broader market.

For now, on-chain data shows a market that remains uneven, even as major policy and industry events approach.

Never Miss a Beat in the Crypto World!

Stay ahead with breaking news, expert analysis, and real-time updates on the latest trends in Bitcoin, altcoins, DeFi, NFTs, and more.

FAQs

What key events could influence crypto markets in March 2026?

Crypto markets may react to the Fed’s March 18 rate decision, Clarity Act progress, economic data, and major blockchain industry events.

Why are altcoins under pressure compared to Bitcoin?

38% of altcoins trade near cycle lows as liquidity remains concentrated in Bitcoin, limiting demand and price movement for smaller tokens.

Could Bitcoin gains lead altcoin recovery in March?

Historically, capital flows into Bitcoin first; sustained liquidity and demand are needed before altcoins show meaningful recovery.

What should traders watch for in March 2026?

Traders should monitor Fed rate updates, regulatory announcements, on-chain liquidity metrics, and public statements from crypto events.

38% of Altcoins Near All-Time Lows, Worse Than FTX: Is Altcoin Season Dead or Loading?

Top Altcoins to Watch

The post 38% of Altcoins Near All-Time Lows, Worse Than FTX: Is Altcoin Season Dead or Loading? appeared first on Coinpedia Fintech News

Nearly 4 out of 10 altcoins are now trading near their all-time lows. CryptoQuant author Darkfost dropped the data, and the numbers are hard to ignore.

At 38%, this is the largest altcoin regression observed during this entire cycle, surpassing even the aftermath of FTX’s collapse in 2022, when the metric hit 37.8%. In April 2025, it stood at 35%. The trend is moving in the wrong direction.

As Coinbureau put it: “This is the BIGGEST ALTCOIN WIPEOUT of this cycle.”

Why the Altcoin Market Keeps Bleeding

Darkfost pointed to a clear liquidity problem.

“The overall environment remains unfavorable for risk-taking, and the first sector to bear the consequences is the cryptocurrency market, particularly altcoins,” he wrote.

Gold has surged past $5,000 this year as investors chase safety. Meanwhile, even Bitcoin miners are liquidating BTC reserves to fund AI infrastructure, with firms like Core Scientific and Bitdeer dumping their entire holdings. Capital seems to be leaving the crypto sector altogether.

The Israel-Iran war is adding pressure. After U.S.-Israeli strikes over the weekend, Bitcoin briefly dropped to $63,000 before bouncing back above $65,000. The geopolitical shock triggered over $300 million in liquidations across crypto futures, and altcoins absorbed the worst of it.

But Bitcoin Is Setting Up for Something Bigger

This is the other side of the story.

Crypto analyst Michaël van de Poppe sees a very different setup forming on Bitcoin’s chart. BTC held above $65K, rallied toward range resistance, and has been consolidating for weeks.

Very good move of #Bitcoin yesterday, holding above $65K and rallied towards the range resistance.

I mentioned that I expected some days of consolidation before a breakout upwards is likely to occur.

The fact is that we've been establishing this range for quite some time.… pic.twitter.com/msvD2nkUIx

— Michaël van de Poppe (@CryptoMichNL) March 3, 2026

“With this build-up, I think that we’ll see $75-80K in March,” Van de Poppe posted on X.

That’s a bullish thesis. If Bitcoin breaks out while altcoins remain pinned near historic lows, the divergence could define this entire quarter.

Is Altcoin Season Loading?

Darkfost left the door open.

“It is precisely when conditions deteriorate significantly that opportunities also begin to emerge,” he noted.

History backs that pattern. The post-FTX bottom eventually led to one of the strongest rallies in crypto history. Whether this cycle follows the same script depends on whether liquidity returns to altcoins or continues concentrating in Bitcoin.

For now, the altcoin market is at its weakest point this cycle. What happens next could separate the dead projects from the survivors.

Never Miss a Beat in the Crypto World!

Stay ahead with breaking news, expert analysis, and real-time updates on the latest trends in Bitcoin, altcoins, DeFi, NFTs, and more.

FAQs

What caused the 2026 altcoin crash?

The 2026 altcoin crash stems from low liquidity, global uncertainty, and capital moving to Bitcoin and safe-haven assets like gold.

How are altcoins performing compared to Bitcoin in March 2026?

Bitcoin is consolidating above $65K with a bullish setup, while nearly 40% of altcoins remain near all-time lows.

Can altcoins recover if Bitcoin continues to rise?

Recovery depends on liquidity returning to altcoins. Historically, strong Bitcoin rallies can lead to a delayed altcoin season.

Is this a good time to invest in altcoins?

Weak market conditions can offer opportunities, but careful research is crucial to separate strong projects from failing ones.

Korean Stock Market Crash: KOSPI Plunges 7% Amid U.S.–Israel Iran War

South Korea Reviews Seized Crypto After Major Errors

The post Korean Stock Market Crash: KOSPI Plunges 7% Amid U.S.–Israel Iran War appeared first on Coinpedia Fintech News

Today, the Korean stock market crashed sharply by 7.24% after reopening from a long weekend. This is one of the worst day carsh korean market has seen in 19 months. This crash came into effect following the strike on Iran by the U.S. and israel joinlty. 

Stock markets across Asia, Europe, and the U.S. turned red, while the Bitcoin price surged towards $70K.

Korean Stock Market Crash Pushes KOSPI to 19 Month low

South Korea’s benchmark KOSPI index fell by 7.24% in a single session today. The drop wiped out about ₩390 trillion (around $270 billion) in market value. It was the biggest one-day fall since the 2024 yen carry trade crisis.

Many traders could not react earlier because Monday was a public holiday for Samiljeol (Independence Movement Day).

Later, when trading resumed, and institutional investors offloaded trillions of won worth of shares, reflecting strong fear in global financial markets.

Financial analysts say the fall was mainly caused by rising oil prices and supply fears. Crude oil jumped nearly 13%, moving close to $82 per barrel after Iran warned it could block the Strait of Hormuz, a key oil shipping route.

This move hit South Korea hard because the country imports about 2.76 million barrels of crude oil per day from the Gulf, much of it passing through the Strait of Hormuz, which Iran now threatens to block. 

Global Markets Also Turn Red

The Korean market was not alone in whose stock market crashed. Major indexes across the world also declined, including the U.S. (S&P 500), Britain’s (FTSE 100), Japan’s (Nikkei), Hong Kong’s (Hang Seng), and India’s (Nifty 50), all dropped between 1% and 3%.

Korean stock market crash bitcoin surge

The sell-off showed how closely global markets are linked when geopolitical risks rise.

Bitcoin Drops to $63K Before Recovering

The crypto market also felt pressure. Flagship cryptocurrency Bitcoin fell near $63,000 after news of U.S. and Israeli strikes on Iran

Other major cryptocurrencies, Ethereum, XRP, Solana, Doge, & other also saw a drop between 5 to 9%. 

Perhaps as of now, Bitcoin quickly recovered and climbed back toward $70,000 before settling near $67,000, showing how fast crypto reacts to global events.

Iran Crypto Market Sees 80% Volume Collapse

Inside Iran, crypto trading volume dropped nearly 80% within two days of the strikes. Around $3 million in digital assets moved out of local exchanges as users rushed to send funds overseas.

As of now, both stock and crypto markets remain highly sensitive as tensions between the U.S., Israel, and Iran continue.

Never Miss a Beat in the Crypto World!

Stay ahead with breaking news, expert analysis, and real-time updates on the latest trends in Bitcoin, altcoins, DeFi, NFTs, and more.

FAQs

Why did the Korean stock market crash today?

The KOSPI plunged over 7% due to rising geopolitical tensions after U.S. and Israeli strikes on Iran, sparking fears of an oil supply shock and global economic instability.

How did global markets react to the Korea crash?

Major indexes in the U.S., Europe, and Asia dropped 1–3% as investors reacted to heightened geopolitical risk.

How did oil prices affect South Korea’s market today?

Oil jumped nearly 13% after Iran threatened the Strait of Hormuz, impacting South Korea’s oil imports and stock market.

Core Scientific News: Bitcoin Miner to Sell All 2,537 BTC After Weak Q4 Earnings

Core Scientific News Bitcoin Miner to Sell All 2,537 BTC After Weak Q4 Earnings

The post Core Scientific News: Bitcoin Miner to Sell All 2,537 BTC After Weak Q4 Earnings appeared first on Coinpedia Fintech News

Bitcoin miner Core Scientific (NASDAQ: CORZ) is getting ready to offload virtually its entire Bitcoin stash. And the timing is interesting.

In its annual report filed Monday, the company revealed it expects to sell the majority of its 2,537 BTC holdings during Q1 2026. The proceeds will go straight into funding its AI compute colocation buildout.

“During 2026, we currently expect to monetize substantially all of our bitcoin holdings, subject to market conditions, to enhance liquidity and fund our planned capital expenditures and other cash requirements,” the company stated in the filing.

From 256 BTC to 2,537, and Now Back to Zero

Here’s what makes this interesting. Core Scientific spent all of 2025 hoarding. Instead of selling mined coins to cover costs, they held. Their reserve grew nearly tenfold, from 256 BTC at the end of 2024 to 2,537 BTC by December 31, 2025, all produced through self-mining. The carrying fair value sat at $222 million, based on an average price of $101,639 per coin.

That accumulation strategy is now being reversed entirely.

Also Read: Jack Dorsey’s Block AI Layoffs Spark Backlash: What This Means for Cash App Bitcoin Users

Core Scientific Q4 Earnings Add Pressure

The BTC sale announcement landed alongside a rough earnings report. Core Scientific posted Q4 2025 revenue of $79.8 million, falling well short of the $124.5 million analysts expected. Colocation revenue climbed to $31.3 million from $8.5 million a year ago, but it wasn’t enough to offset the mining slowdown.

The company is now scaling a 1.5 gigawatt pipeline of leasable AI capacity with over $10 billion in contracted revenue.

Another Miner Joins the BTC Exit

Core Scientific isn’t the first one.

As Coinpedia reported, Bitdeer also recently dropped its BTC holdings to zero. Cango sold 4,451 BTC for roughly $305 million. Riot Platforms moved 5,363 BTC in 2025 for about $535.5 million in proceeds.

Every one of these sales pointed toward the same destination: AI infrastructure.

What This Means for Bitcoin

With BTC currently trading around $66,988, well below the estimated $87,000 production cost for most miners, the pressure to sell is structural. Miners sitting on reserves they built at higher average costs now face a choice: hold and bleed, or sell and build.

Core Scientific has clearly made its call.

Never Miss a Beat in the Crypto World!

Stay ahead with breaking news, expert analysis, and real-time updates on the latest trends in Bitcoin, altcoins, DeFi, NFTs, and more.

Bitcoin Price Surges as Sentiment Spikes: Do On-Chain Signals Confirm the Move?

Bitcoin Price Surges as Sentiment Spikes Do On-Chain Signals Confirm the Move

The post Bitcoin Price Surges as Sentiment Spikes: Do On-Chain Signals Confirm the Move? appeared first on Coinpedia Fintech News

Bitcoin price has reclaimed the $68,000 level after briefly slipping toward $65K, a move that comes despite persistent broader market headwinds. Geopolitical tensions in the Middle East, elevated U.S. Treasury yields near 4%, and cautious risk sentiment have kept volatility elevated across global markets. Yet even within this fragile macro backdrop, Bitcoin price staged a sharp intraday reversal, climbing nearly 6% in just over two hours and reaching $69,000 before encountering resistance at $70K.

The immediate spark came from a sudden explosion in positive social sentiment. But the bigger question now is whether this Bitcoin price rally is simply a retail-driven reaction, or the early stage of a more structural shift backed by institutional and on-chain signals.

Positive Sentiment Spikes Spark Bitcoin Price Rally

According to Santiment, bullish commentary surrounding Bitcoin spiked sharply as price threatened to lose the $65K support level. Positive sentiment readings reached their highest point in 25 days. Within the next 2 hours and 20 minutes, Bitcoin price rallied from below $65,000 to nearly $69,900, marking a rapid 7% surge.

BTC price data

Such spikes often reflect retail-driven momentum. Santiment noted that crowd optimism accelerated quickly as Bitcoin avoided a breakdown, suggesting a reflexive reaction to perceived support strength. At the same time, social discourse remains heavily influenced by geopolitical headlines involving Iran, Israel, and the United States, keeping the market sensitive to sudden developments. Sentiment may have ignited the rally. Sustaining it requires capital flows.

Institutional Capital Steps In-ETF and Coinbase Data Align

Beyond social data, institutional metrics suggest deeper demand is returning to the market. In late February, U.S. spot Bitcoin ETFs recorded approximately $1.1 billion in net inflows over three consecutive trading sessions, including around $652 million into BlackRock’s IBIT alone.

That magnitude of inflow signals significant spot accumulation. At the same time, the Coinbase Premium Index, a key gauge of U.S. institutional demand, flipped positive to roughly +0.05%, marking its first sustained positive reading in nearly 40 days. The premium had remained negative for weeks, reflecting persistent U.S. selling pressure. Its reversal suggests renewed American spot buying activity.

Bitcoin coinbase data

Because Coinbase serves as a primary venue for U.S.-based institutional investors, a positive premium structurally supports Bitcoin price strength.

Importantly, derivatives markets do not show excessive leverage buildup. Funding rates remain relatively neutral, indicating that the Bitcoin price rally appears driven more by spot flows than speculative futures positioning.

The alignment between ETF inflows and Coinbase Premium improvement adds institutional credibility to the move.

A Rare On-Chain Signal Begins to Flash 

Bitcoin’s Inter-Exchange Flow Pulse (IFP) is approaching a golden cross. The IFP tracks capital movement between exchanges and long-term holding wallets. 

BTC on-chain

Historically, golden cross formations within this metric have coincided with transitions from corrective phases into expansion cycles. Previous IFP crossovers have preceded sustained upward price trends. If confirmed, the signal would indicate capital shifting away from exchanges and into stronger hands, a structurally bullish development for Bitcoin price over the medium term.

Bitcoin Price Analysis: Wedge Breakout Targets $80K

Bitcoin price has broken out of a wedge pattern that compressed volatility for several weeks. Descending resistance has been reclaimed, and a measured move toward $80,000 could be seen if momentum sustains.

Bitcoin price data

However, immediate resistance remains firm between $68,900 and $70,000, where whale sell walls have been identified. On the downside, strong buy walls remain clustered around $64,000–$65,000, reinforcing that zone as near-term structural support. 

A decisive break and sustained close above $70K would strengthen the bullish case and potentially accelerate Bitcoin price toward the $80K–$82K range. Failure to clear that level could send the BTC price back into consolidation. If flows persist and technical resistance gives way, Bitcoin price may be transitioning from reactive bounce to broader expansion. For now, $70,000 remains the line that could define the next phase of the cycle.

FAQs

What’s driving Bitcoin’s recent price surge in March 2026?

Bitcoin rallied due to positive social sentiment, U.S. institutional inflows, and early bullish on-chain signals.

Are institutional investors supporting Bitcoin now?

Yes, spot ETFs and Coinbase premium data show renewed U.S. institutional accumulation, strengthening BTC price.

Is the current Bitcoin rally retail-driven or structural?

Initially fueled by retail sentiment, the rally gains credibility from ETF inflows, Coinbase premium flips, and on-chain signals.

XRP News Today: David Schwartz Says Ripple’s DTCC Move “Seems Important” for Institutional Crypto

XRP News Today

The post XRP News Today: David Schwartz Says Ripple’s DTCC Move “Seems Important” for Institutional Crypto appeared first on Coinpedia Fintech News

Ripple has just taken a major step toward bridging traditional finance and crypto, and even Ripple CTO Emeritus David Schwartz thinks it’s significant. Reacting to a newly surfaced DTCC notice, Schwartz simply wrote that the development “seems important.”

The notice confirms that Ripple’s prime brokerage arm has officially integrated with Wall Street’s core clearing infrastructure, a move that could reshape how institutional crypto flows are processed.

DTCC Integration Explained

The development centers around the Depository Trust & Clearing Corporation (DTCC), the backbone of the U.S. financial system, which processes quadrillions of dollars in securities transactions each year.

According to the document, Hidden Road Partners CIV US LLC was added to the National Securities Clearing Corporation (NSCC) directory on March 2. The firm is now operating under the Executing Broker Alpha code “HRFI” for over-the-counter (OTC) products.

This means Ripple’s prime brokerage infrastructure is now directly connected to legacy U.S. clearing rails. In simple terms, Ripple has secured a gateway into the system that settles and clears trades for major financial institutions.

Bridging TradFi and DeFi

Having said that, this is where the pattern becomes clear. Ripple has been positioning itself not just as a crypto company, but as a bridge between traditional finance (TradFi) and decentralized finance (DeFi).

Hence, by integrating prime brokerage services with DTCC clearing infrastructure, Ripple lays the groundwork for potentially moving large institutional post-trade flows onto the XRP Ledger (XRPL). If post-trade processes, settlement, collateral movement, and liquidity management can eventually touch blockchain rails, that represents a structural shift rather than just a product launch.

It’s not about hype. It’s about plumbing.

Why the Old Name Appeared

Some confusion emerged online because the DTCC notice still listed “Hidden Road,” even though the firm was rebranded to “Ripple Prime” after Ripple completed its acquisition in October.

Schwartz addressed this directly. He suggested the integration process had likely been in motion before the acquisition was fully finalized, possibly delayed by lingering regulatory approvals. In other words, the paperwork timeline explains the naming discrepancy, not any structural issue.

Crypto Community Reaction: From Analysis to “Moon?”

Beyond the technical discussion, the broader crypto reaction quickly shifted tone. Some users pressed Schwartz for clarity, while others took a more speculative approach. 

One user bluntly asked, “moon or nah?” capturing the market’s hunger for price implications. 

Others posted optimistic messages like “Perhaps the stars are aligning,” and even symbolic references to a “blood moon,” reflecting typical XRP community enthusiasm.

Overall, the reaction blended serious institutional analysis with familiar crypto optimism. While Ripple’s DTCC integration signals a meaningful structural step toward bridging TradFi and DeFi, the market is still waiting for one thing: confirmation that infrastructure progress will eventually translate into price momentum.

Never Miss a Beat in the Crypto World!

Stay ahead with breaking news, expert analysis, and real-time updates on the latest trends in Bitcoin, altcoins, DeFi, NFTs, and more.

FAQs

What does Ripple’s DTCC integration mean for crypto markets?

It connects Ripple’s prime brokerage to U.S. clearing rails, enabling institutional crypto trades to settle through traditional financial infrastructure.

How could this impact the XRP Ledger (XRPL)?

If post-trade flows move on-chain, XRPL could support settlement, collateral, and liquidity functions for institutional transactions.

Will Ripple’s DTCC move immediately boost XRP price?

Not necessarily. Infrastructure progress strengthens long-term fundamentals, but price gains depend on adoption and market demand.

Why Is NEAR Protocol Price Rising Today? Key Drivers Behind the Rally

NEAR Protocol PricePoised for a Big Breakout—Will It Follow ICP’s Explosive Rally?

The post Why Is NEAR Protocol Price Rising Today? Key Drivers Behind the Rally appeared first on Coinpedia Fintech News

NEAR Protocol price has surged by 11.45% to $1.34 in the past 24 hours, significantly outperforming Bitcoin 3.3% gain. The rise is primarily driven by a broader rotation of capital into the altcoins. This move is supported by an increase in the trading volume and a breakout above the key technical levels. 

What the NEAR Price Structure Shows

On the 4-hour timeframe, NEAR has shifted from a prolonged downtrend into a recovery structure marked by higher lows. The recent rally accelerated after the price reclaimed the short-term moving averages (20/50 SMA), which are now beginning to curl upward, an early sign of momentum reversal.

near price

However, price is currently approaching a previously established supply zone near $1.40–$1.45. This level acted as resistance during earlier breakdowns and remains a critical barrier. A sustained move above this range could open the path toward the next resistance cluster near $1.65–$1.70.

Volume expansion during the latest leg higher indicates active participation rather than thin liquidity. Meanwhile, the RSI is trending upward and approaching the upper range without entering extreme overbought territory. This supports bullish momentum but also suggests the move is nearing a short-term decision point.

Key Levels to Watch

  • Immediate Resistance: $1.40–$1.45
  • Major Resistance: $1.65–$1.70
  • Immediate Support: $1.15–$1.20
  • Major Support: $0.95–$1.00

A breakout above $1.45 with sustained volume could confirm continuation. Failure at this zone may lead to a pullback toward the $1.20 support area.

Conclusion: What’s Next?

NEAR’s 4-hour structure reflects improving short-term momentum after weeks of consolidation and decline. Buyers have reclaimed key moving averages, but the $1.40–$1.45 resistance remains the defining level. The next directional move will likely depend on whether NEAR Protocol price can convert this supply zone into support or faces renewed rejection.

FED Rate Cuts May Be Delayed Amid Israel and Iran War, Says Janet Yellen

Fed rate cuts delayed due to Iran oil shock

The post FED Rate Cuts May Be Delayed Amid Israel and Iran War, Says Janet Yellen appeared first on Coinpedia Fintech News

The escalating US-Israel-Iran conflict is now spilling into monetary policy expectations. Former Treasury Secretary Janet Yellen warned that the situation makes the Federal Reserve’s job significantly more complicated, especially when it comes to rate cuts.

“I think the recent Iran situation puts the Fed even more on hold, more reluctant to cut rates than they were before this happened,” Yellen said during remarks delivered via video at a conference in Long Beach, California, according to Bloomberg.

Her concern centers on oil. If the Strait of Hormuz, a critical passageway for global oil shipments, remains disrupted for more than a few days, energy prices could stay elevated or climb further. That would worsen inflation at a time when it is already running about one percentage point above the Fed’s target.

Inflation Risks Resurface

Inflation had already become a growing concern inside the Federal Reserve. Minutes from January’s Federal Open Market Committee meeting showed several policymakers were increasingly wary of persistent price pressures. Some even suggested rate hikes could return to the table if inflation failed to cool as expected.

Now, the Iran shock adds another layer of uncertainty. Higher oil prices typically feed directly into consumer costs, squeezing growth while lifting inflation, a painful combination for central bankers.

Moreover, Yellen acknowledged that no one knows how long the current tension will last. But if oil remains elevated, the Fed may be forced to stay cautious longer than markets anticipated.

Meanwhile, US equities showed mixed reactions. The SPDR S&P 500 ETF (SPY) gained roughly 0.36%, the Invesco QQQ Trust (QQQ) rose 0.4%, while the SPDR Dow Jones Industrial Average ETF (DIA) slipped about 0.34%. Retail sentiment around the S&P 500 remained broadly bullish.

Arthur Hayes FED Prediction: War = Liquidity

While Yellen sees hesitation, Arthur Hayes sees opportunity. The Maelstrom CIO argues that every major US military engagement in the Middle East ultimately leads to higher government spending and, eventually, Federal Reserve easing.

According to Hayes, history shows that conflicts like the 1990 Gulf War and the post-9/11 period pushed the Fed toward rate cuts to stabilize markets and support economic growth. He believes the same pattern could unfold again.

“The cure, as always, is cheaper and more plentiful money,” Hayes wrote.

As per him, prolonged military engagement means ballooning federal outlays. To sustain that, policymakers are likely to lower rates and expand the money supply. In that environment, Hayes expects Bitcoin and high-quality altcoins to surge.

Bitcoin is currently hovering near $66,000, well below its prior $126,000 peak. But Hayes maintains that once the Fed shifts from holding to easing, the next major crypto rally could ignite.

For now, markets remain caught between inflation fears and liquidity hopes, with the Fed standing right in the middle.

Never Miss a Beat in the Crypto World!

Stay ahead with breaking news, expert analysis, and real-time updates on the latest trends in Bitcoin, altcoins, DeFi, NFTs, and more.

FAQs

How does the US-Israel-Iran conflict affect Federal Reserve rate cuts?

Rising geopolitical tension can lift oil prices and inflation, making the Fed more cautious and likely to delay interest rate cuts.

Could the Federal Reserve raise rates again if inflation worsens?

Yes. If inflation stays above target, the Fed may pause cuts or even consider rate hikes to maintain price stability.

What is the Fed’s biggest risk during geopolitical crises?

The Fed risks facing slow growth and high inflation at once, forcing tough policy choices between supporting jobs or controlling prices.

Bitcoin ETFs See $458M Inflows, No Outflows

Bitcoin ETFs See $458M Inflows, No Outflows

The post Bitcoin ETFs See $458M Inflows, No Outflows appeared first on Coinpedia Fintech News

On March 2, U.S. spot Bitcoin ETFs attracted strong investor demand, recording $458 million in net inflows with all 12 funds avoiding any outflows, a sign of healthy capital interest in Bitcoin products. Other crypto ETFs also saw positive activity, with spot Ethereum ETFs adding $38.69 million and XRP spot ETFs contributing $6.97 million, reflecting broader confidence and diversified appetite in the digital asset ETF space.

Iran Crypto Market Sees 80% Volume Drop After U.S.-Israeli Strikes

Will Bitcoin Hit $60,000 Amid US- Israel Strike on Iran Altcoins Also React

The post Iran Crypto Market Sees 80% Volume Drop After U.S.-Israeli Strikes appeared first on Coinpedia Fintech News

Iran’s cryptocurrency market saw a sharp shock after recent U.S.-Israeli airstrikes, which targeted Tehran, killing its supreme leader. This sent shockwaves through local exchanges as trading volume fell nearly 80% in just two days. Within hours, millions of dollars in digital assets moved out of the country. 

While the fighting was military, the financial impact spread quickly into the crypto space. Perhaps the country’s crypto infrastructure remains operational.

Iran’s Crypto Exchange Volume Crashed 80%

Data from blockchain research firm TRM Labs shows that trading volume on Iranian crypto exchanges dropped by nearly 80% between February 27 and March 1.

The sharp fall was mainly linked to the internet blackout imposed after the strikes. With restricted access, many users could not trade normally. At the same time, fear and uncertainty pushed traders to pause activity.

Iran’s central bank also ordered platforms to temporarily stop trading the USDT–toman pair, which connects crypto to the local currency. When trading restarted, liquidity was thin, and prices moved unevenly.

Despite the sudden drop in volume, major exchanges in Iran remain operational in what experts describe as a “risk-managed” mode, with slower withdrawals and tighter controls.

700% Crypto Outflows Signal Capital Flight

While trading slowed, money was moving fast. Blockchain analytics firm Elliptic recorded a more than 700% jump in crypto outflows from Nobitex, Iran’s largest exchange, within minutes of the first U.S.–Israel strikes.

Iran Crypto Market Sees 80% Volume Drop After U.S.-Israeli Strikes

Roughly $3 million in combined inflows and outflows were tracked as users rushed to transfer funds to overseas exchanges. Analysts believe many citizens were trying to protect their savings by shifting assets beyond Iran’s borders.

Despite the sudden drop in volume, major exchanges in Iran remain operational in what experts describe as a “risk-managed” mode — with slower withdrawals and tighter controls.

What This Means for Bitcoin, USDT & Global Exchanges

The Iran conflict shows how quickly crypto reacts to geopolitical stress involving the U.S., Israel, and Iran.

Bitcoin prices briefly dipped after news of the strikes to near $63K before recovering to now $68K. Meanwhile, Stablecoins such as USDT saw increased demand locally as traders looked for safer digital options.

If tensions rise further, more capital could flow through crypto channels, keeping both regional and global markets on alert.

Never Miss a Beat in the Crypto World!

Stay ahead with breaking news, expert analysis, and real-time updates on the latest trends in Bitcoin, altcoins, DeFi, NFTs, and more.

FAQs

Could further geopolitical escalation trigger additional crypto restrictions inside Iran?

Yes. In periods of national security tension, authorities such as the Central Bank of Iran may tighten oversight on exchanges, impose temporary trading suspensions, or increase monitoring of cross-border transfers. Such steps are typically aimed at preventing capital flight and stabilizing the local currency during uncertainty.

What risks do global exchanges face when handling sudden inflows from high-risk jurisdictions?

International platforms may increase compliance checks to meet anti-money laundering standards and sanctions rules. Sudden inflows from sanctioned regions can trigger enhanced due diligence reviews, temporary freezes, or stricter identity verification procedures.

Who is most financially vulnerable during crypto market disruptions in conflict zones?

Retail investors and small businesses that rely on crypto for savings or cross-border payments are typically most exposed. Limited liquidity, withdrawal delays, or exchange restrictions can disrupt personal cash flow and short-term financial stability.

Crypto News Today [Live] Updates : Bitcoin Price, Ethereum Price USD, Ripple (XRP), Gold Price Today

Why Is the Crypto Market Going up Today [Live] Updates on March 3, 2026

The post Crypto News Today [Live] Updates : Bitcoin Price, Ethereum Price USD, Ripple (XRP), Gold Price Today appeared first on Coinpedia Fintech News

March 3, 2026 11:41:23 UTC

ETH/BTC Pair Stuck as Traders Watch Key Levels

The Ethereum to Bitcoin pair remains quiet, trading between key price levels with no clear direction. Traders are watching two areas closely: around 0.026 BTC as a possible buy zone, and a breakout above 0.0325 BTC as a signal of strength. Until one of these levels is reached, price action may stay slow. Some analysts expect a dip toward 0.026 BTC before the Clarity Act takes effect, which could bring fresh momentum to the market.

March 3, 2026 10:27:35 UTC

38% of Altcoins Trade Near Record Lows

Nearly 38% of altcoins are now trading close to their all-time low levels, according to CryptoQuant analyst Darkfost. This is a deeper drop than the period following the collapse of FTX and marks the biggest pullback of the current market cycle. The wider market remains tough for risk assets like crypto. Investors are moving funds toward stocks and commodities, reducing demand and liquidity in the altcoin market.

March 3, 2026 09:01:36 UTC

NFT Floor Prices Crash Over 90% From Peak Levels

NFT prices have dropped sharply from their 2021–2022 highs. Bored Ape Yacht Club once reached about $290,000 per NFT, with a verified peak near $420,000 in May 2022. Azuki climbed to around $110,000.Today, many top projects trade near 4.5 to 6 ETH, roughly $9,000 to $12,000, with Ethereum near $2,000. That marks declines of more than 95% in some cases. While critics call the boom a bubble, supporters say communities like Pudgy Penguins remain active and see current prices as an opportunity.

March 3, 2026 08:58:07 UTC

Court Dismisses Lawsuit Against Uniswap After Four Years

A federal court in New York has dismissed a class action lawsuit against Uniswap. The case claimed the platform allowed scam tokens and price manipulation by outside issuers. The court ruled that Uniswap is not responsible for the actions of independent token creators. It also said that running a decentralized, open-source platform does not mean taking part in fraud. The case was dismissed with prejudice, meaning it cannot be filed again. The ruling supports the view that a protocol is separate from its users.

March 3, 2026 08:55:32 UTC

Bitcoin Price Today Holds Above $65K, Eyes $75–80K in March

Bitcoin stayed strong above $65,000 yesterday and moved closer to its recent high. After days of steady trading within a set range, the price is showing signs of building momentum. Analysts believe this period of calm could lead to a fresh move higher. With steady support at current levels, many now expect Bitcoin to climb toward $75,000 to $80,000 in March if buying pressure continues.

Very good move of #Bitcoin yesterday, holding above $65K and rallied towards the range resistance.

I mentioned that I expected some days of consolidation before a breakout upwards is likely to occur.

The fact is that we've been establishing this range for quite some time.… pic.twitter.com/msvD2nkUIx

— Michaël van de Poppe (@CryptoMichNL) March 3, 2026

March 3, 2026 07:08:27 UTC

Crypto Market Today: Bitcoin, Ethereum, and XRP Price Surge

Bitcoin and the broader crypto market remain in a cautious phase as BTC continues to trade within the $62,000–$63,000 range over the past few days. The market is showing signs of risk, with Bitcoin struggling to hold momentum toward the key $65,000–$70,000 resistance zone. Analysts note that a decisive breakout above $65,000 could open the path toward $74,000–$75,000. Meanwhile, gold prices remain elevated, reflecting ongoing macro uncertainty.

March 3, 2026 07:05:51 UTC

Crypto Withdrawals Surge at Iran’s Biggest Exchange

Iran’s largest crypto platform, Nobitex, is seeing a sharp spike in withdrawals as users move funds amid rising geopolitical tension. The exchange handles more than 87% of Iran-linked crypto activity, making it central to the country’s digital asset market.

March 3, 2026 06:42:08 UTC

Korean Stocks Plunge as Market Reopens

South Korea’s stock market suffered a sharp fall on reopening, with the KOSPI dropping 7.23% and wiping out about ₩390 trillion ($270 billion) in market value. The sell-off marks the biggest single-day decline since the August 2024 yen carry trade shock. Markets had been closed on Monday for a holiday, making this the first trading session since the rising Middle East tensions. Heavy selling was driven by fears over oil supply disruptions and growing global uncertainty.

March 3, 2026 06:42:08 UTC

Israeli Stocks Hit Record High Despite Iran Tensions

Israel’s main stock indexes climbed to fresh record highs even as tensions with Iran continue. The TA-35 Index surged 4.61% to 4,318.50, while the TA-125 Index jumped 4.75% to 4,268.43. Gains were led by defense, energy, and banking shares as investors showed confidence in the market’s strength. Meanwhile, the Israeli shekel strengthened about 1.5% against the U.S. dollar, signaling steady investor sentiment despite ongoing geopolitical uncertainty.

OM Rebrands to MANTRA Following v7 Upgrade

OM Rebrands to MANTRA Following v7 Upgrade

The post OM Rebrands to MANTRA Following v7 Upgrade appeared first on Coinpedia Fintech News

MANTRA Chain has successfully completed its transition from $OM to $MANTRA with the rollout of its v7.0.0 upgrade on March 3 UTC. The community-approved move automatically quadrupled token balances in a non-dilutive 1 to 4 split and updated token decimals from 6 to 18 for smoother use. The upgrade brings the ecosystem together under the MANTRA name, reinforces its focus on tokenizing real-world assets like art and real estate, and paves the way for exchanges to restore liquidity and support.

Hyperliquid Oil Perps Hit Record High

Hyperliquid Oil Perps Hit Record High

The post Hyperliquid Oil Perps Hit Record High appeared first on Coinpedia Fintech News

Open interest in Hyperliquid’s CL USDC oil perpetual contract climbed above $50M in late February 2026 as escalating tensions between the United States, Israel, and Iran drove traders toward commodity exposure. Oil on the platform rose 5% to 70.60 dollars per barrel, while gold gained 1.3% to $5323 and silver advanced 2% to $94.90. Following the HIP 3 upgrade, Hyperliquid expanded permissionless markets, pushing total trading volume beyond 4 trillion dollars and daily fees above 2 million dollars.

Crypto Market Today: Bitcoin Price Near $70K as Middle East Fears Ease

Crypto Market Today

The post Crypto Market Today: Bitcoin Price Near $70K as Middle East Fears Ease appeared first on Coinpedia Fintech News

After a sharp sell-off tied to escalating tensions in the Middle East, the crypto market has bounced hard. Bitcoin surged back toward $70,000, Ethereum reclaimed $2,065, and total market cap climbed above $2.38 trillion. 

The Dow Jones slipped just 140 points, while the Nasdaq 100 erased earlier losses and turned positive. Oil also failed to explode higher as feared. That muted reaction may have helped stabilize crypto sentiment.

But is this the start of a new leg up—or just a fake rally?

On-chain analytics firm Santiment highlighted a critical shift in crowd behavior. As Bitcoin threatened to drop below $65K, social data showed a huge spike in positive sentiment. Within the next 2 hours and 20 minutes, BTC rallied roughly 7%, reaching $69.9K before facing resistance at $70K.

According to Santiment, this type of rapid sentiment flip often signals a short-term, retail-driven pump. With discourse heavily focused on Iran, Israel, and U.S. tensions, volatility is expected to track geopolitical headlines. In short, the rally may have been fueled more by emotion and positioning than by structural change.

Why is the Crypto Market Up Today?

A key explanation behind the rebound is capital rotation. When markets dump, profits must flow elsewhere. Silver, tech stocks, and airline stocks were down, while Bitcoin, XRP, and SOL absorbed fresh liquidity.

There’s also the classic “buy the rumor, sell the news” dynamic. Investors dumped crypto ahead of the war escalation. Now that the economic damage appears contained, they’re buying back in. Traders are also pricing in possible de-escalation, with ceasefire odds reportedly rising to 46% by March 31 and 66% by April 30.

Strong U.S. macro data added fuel. S&P Global’s manufacturing PMI rose from 50.4 to 51, while ISM increased from 51.7 to 52.4, signaling economic resilience.

BTC vs Gold and the Dead-Cat Question

Analyst Michaël van de Poppe argues the BTC/Gold pair has bottomed due to strong bullish divergence on daily and weekly charts. He believes much of the geopolitical fear was already priced in and expects potential rotation from gold and silver into equities and Bitcoin.

Meanwhile, corporate accumulation continues. Michael Saylor’s Strategy bought over 3,000 BTC, and Tom Lee’s BitMine added more than 50,000 ETH despite volatility.

Still, caution remains. If this rally is primarily sentiment-driven, as market data suggests, it could be a classic dead-cat bounce before another move lower.

For now, crypto is climbing. Whether this marks a true breakout or just temporary relief depends on how sentiment, macro data, and geopolitics evolve in the coming days.

Never Miss a Beat in the Crypto World!

Stay ahead with breaking news, expert analysis, and real-time updates on the latest trends in Bitcoin, altcoins, DeFi, NFTs, and more.

FAQs

Why is the crypto market going up today?

Crypto is rising as war fears ease, U.S. data stays strong, and capital rotates back into Bitcoin and Ethereum after last week’s panic sell-off.

What does on-chain sentiment data signal right now?

On-chain data shows a rapid flip to bullish sentiment, often linked to short-term retail buying rather than long-term structural growth.

How do geopolitics impact Bitcoin and Ethereum prices?

Geopolitical tensions increase volatility. When risks ease, investors often rotate back into crypto, boosting short-term prices quickly.

Crypto Market Update Today: Bitcoin Holds Firm as Gold Surges and Nasdaq Rebounds

Missouri Bitcoin Strategic Reserve Bill

The post Crypto Market Update Today: Bitcoin Holds Firm as Gold Surges and Nasdaq Rebounds appeared first on Coinpedia Fintech News

The crypto market traded steadily today after a brief recovery ahead of the daily close. Total market capitalisation rebounded from local lows near $2.26 trillion to reclaim $2.34 trillion, signalling renewed buying interest rather than aggressive profit-taking.

Bitcoin price moved above its recent consolidation range around $67,000 and briefly approached the $70,000 mark, while Ethereum continued to hold firmly above $2,000 — indicating relative strength across large-cap assets.

Despite volatility in traditional markets and ongoing geopolitical tensions, crypto prices have largely remained within structured ranges. The absence of sharp liquidation cascades suggests participants are positioning cautiously rather than reacting impulsively. For now, price action reflects consolidation—not panic.

Bitcoin Price Today: BTC Surges, While Range-Bound Consolidation Continues

Bitcoin is up 1.9% from early trading levels, rising from local lows near $65,300 to $68,309. The move was supported by a 43% surge in spot volume to $54.84 billion, reflecting stronger participation. Perpetual futures open interest also climbed 9.19%, signaling fresh leverage entering the market.

Despite the recovery, BTC continues to face strong resistance at $70,000 — a level that has capped upside for more than a month. Until this barrier is cleared decisively, the move appears to be a range rebound rather than a confirmed breakout.

btc price

As seen on the chart, Bitcoin remains confined between resistance near $70,000 and support around $62,000. The RSI is hovering in neutral territory, neither overbought nor oversold, reinforcing the ongoing consolidation. A close above $70,000 or below $62,000 could trigger a volatility expansion, but for now, price action remains range-bound.

How are Ethereum & Other Altcoins Reacting?

As Bitcoin showed signs of strength, altcoins attempted a recovery, led by Ethereum. ETH briefly reclaimed the $2,000 level before slipping back toward $1,990, which weighed on other large-cap tokens. XRP trades near $1.36, Solana has dropped below $86, and Dogecoin is hovering around $0.091. Meanwhile, Cardano re-entered the top 10 by market cap after flipping Bitcoin Cash, though it remains capped near $0.27.

Among the day’s top gainers, NEAR Protocol advanced 5.21%, followed by LayerZero at 4.13%, while Memecore, Hyperliquid, and Morpho posted gains of over 2% each. On the downside, Pippin declined 9.73%, with Decred and Canton down more than 6%. Toncoin, Pepe, Kite, and Zcash also slipped by more than 5%.

The Crypto Fear & Greed Index has climbed to 20, improving from extreme fear to fear, suggesting sentiment is stabilizing but remains cautious.

Bitcoin vs Gold vs S&P 500: How Assets Are Behaving Amid Uncertainty 

Traditional safe-haven assets continued to attract capital as geopolitical risk persisted. Gold has climbed above $5,700 per ounce, reflecting sustained defensive positioning alongside rising inflation concerns. Spot silver has also recovered near $90 per ounce, showing renewed interest after recent volatility. 

In contrast, U.S. stock markets showed mixed performance. On March 2, the Nasdaq Composite advanced about +0.4% to ~22,749, and the S&P 500 edged up roughly +0.1%, despite earlier intraday weakness, as investors oscillated between risk appetite and caution. 

This divergence highlights how different asset classes are reacting: crypto and equities continue to behave more like risk assets, influenced by liquidity and sentiment, while gold and silver act as traditional hedges. The current correlation suggests that broader market sentiment, particularly equity market movements, remains a key driver of Bitcoin’s short-term direction.

What Could Happen Next?

Bullish Scenario: If Bitcoin manages a decisive close above the $70,000 resistance, short-term momentum could accelerate toward the next liquidity zone above the range. Rising spot volume and increasing open interest suggest traders are positioning for expansion. A continued rebound in equities may further support upside attempts.

Bearish Scenario: Failure to reclaim $70,000 could reinforce the ongoing range structure. If BTC slips below the $62,000 support, downside volatility may increase, especially with leverage building in derivatives markets. Escalating geopolitical tensions or renewed weakness in equities could add pressure.

For now, the broader structure remains intact. The next decisive move will likely emerge only after either boundary of the current range is broken with conviction.

AAVE Price Recovers as Binance Outflows Rise: Accumulation Underway?

Aave Surpasses $1 Trillion in DeFi Lending

The post AAVE Price Recovers as Binance Outflows Rise: Accumulation Underway? appeared first on Coinpedia Fintech News

AAVE price is back in the spotlight after climbing 3.32% to trade around $120, tracking the broader crypto market’s rebound. While Bitcoin and major altcoins stabilize, AAVE price action is showing early signs of structural improvement. However, the real story may not be the daily percentage gain. On-chain data reveals that Binance outflows from the top 10 largest AAVE transactions have been steadily increasing, a pattern often associated with accumulation rather than distribution.

With AAVE price still significantly below its previous highs after a 37% correction this year, the question now is: Are whales positioning ahead of a larger move?

Binance Outflows Rise: AAVE Price Accumulation Underway?

While AAVE price is attempting recovery, exchange flow data is showing a more structural shift beneath the surface. According to on-chain metrics tracking Binance activity, the monthly average of the top 10 largest AAVE outflows has increased from 147 AAVE to 232 AAVE per transaction in recent weeks.

AAVE whales data

That represents a roughly 58% increase in large-transaction withdrawals. More importantly, the share of total exchange outflows represented by these top 10 transactions has been rising consistently, indicating that larger holders are responsible for a growing portion of AAVE leaving Binance. This is significant for two reasons:

  • Large outflows reduce immediate sell-side liquidity on exchanges.
  • Whale-sized withdrawals typically reflect repositioning into longer-term custody rather than short-term trading.

This accumulation behavior is occurring despite AAVE undergoing a 37% correction year-to-date, suggesting that whales are not reacting to weakness, they are absorbing it. Historically, sustained exchange outflows during consolidation phases have preceded stabilization periods rather than breakdown extensions.

While the absolute token numbers may not appear dramatic in isolation, the trend direction is what matters, and it is clearly upward. Accumulation appears gradual, controlled, and deliberate.

AAVE Price Analysis: Early Breakout Attempt After Multi-Month Downtrend

AAVE price recently broke a lower-timeframe descending trendline that had governed price action since the previous macro high. This trendline rejection sequence defined the asset’s multi-month correction from the $300+ region toward sub-$110 levels. The recent breakout above that lower trendline marks the first structural shift in momentum.

AAVE price

Currently, AAVE price trades near $120, holding above a visible horizontal demand zone between $110 and $115, which has acted as a short-term base following February’s flush. The broader technical picture now shows:

  • A descending macro resistance trendline still intact overhead
  • Short-term higher lows beginning to form
  • Consolidation above newly reclaimed support

The next major test sits near the $140–$150 resistance zone, where the higher timeframe descending trendline intersects with prior price congestion. A clean break above that level would invalidate the broader corrective structure and open the path toward $170–$200.

However, failure to sustain above $115 would weaken the developing bullish structure and risk revisiting the recent swing lows. At present, AAVE price is transitioning from pure downtrend to potential accumulation phase, but confirmation depends on reclaiming macro resistance.

Broader Market Context Supports Recovery Attempt

The broader crypto market is modestly positive today, providing tailwind support to AAVE price recovery. As risk appetite stabilizes, select altcoins are beginning to show relative strength. What differentiates AAVE in the current environment is the alignment between improving price structure and rising whale outflows.

In previous market cycles, accumulation often began during periods of pessimism and consolidation, not during euphoric breakouts. The present conditions resemble early-stage positioning rather than speculative frenzy. If broader market stability continues, AAVE price may benefit from both improving technical momentum and declining exchange supply.

FAQs

Why is AAVE price rising today?

AAVE price is up as the broader crypto market rebounds and Binance outflows rise, signaling whale accumulation and reduced short-term sell pressure.

Is AAVE in an accumulation phase right now?

On-chain data and higher lows indicate AAVE may be entering accumulation, but confirmation requires a breakout above key resistance levels.

Can AAVE price drop again after this rebound?

Yes. If AAVE falls below the $115 support zone, the bullish setup weakens and a retest of recent swing lows becomes possible.

BlackRock ETF Hits 5-Month High in Bitcoin Inflows

BlackRock ETF Hits 5-Month High in Bitcoin Inflows

The post BlackRock ETF Hits 5-Month High in Bitcoin Inflows appeared first on Coinpedia Fintech News

BlackRock’s iShares Bitcoin Trust (IBIT) posted its largest single‑day Bitcoin accumulation in about five months, adding around 11,054 BTC ($767.5M) to its holdings as Bitcoin climbed back above $69,000. Trading volume for IBIT hit about $3.9 billion, the most since last October. Other U.S. spot Bitcoin ETFs also saw positive flows that day, contributing $195M-$962M overall. The rebound follows weeks of outflows totaling billions earlier in 2026 and has boosted market sentiment and optimism around tighter supply and renewed institutional interest.

SoftBank-Backed PayPay Targets $13.4B Valuation in Nasdaq IPO Push

PayPay U.S. IPO

The post SoftBank-Backed PayPay Targets $13.4B Valuation in Nasdaq IPO Push appeared first on Coinpedia Fintech News

SoftBank-backed fintech giant PayPay is pressing ahead with a U.S. initial public offering that could value the company at up to $13.4 billion. As per reports, the Japanese digital payments leader plans to sell nearly 55 million American depositary shares priced between $17 and $20, aiming to raise around $1.1 billion at the top end.

If completed successfully, the deal would rank among the largest U.S. listings by a Japanese company in recent years. PayPay intends to list on the Nasdaq under the ticker “PAYP.”

Market Volatility Tests Timing

The IPO comes amid shaky global market conditions. Geopolitical tensions have triggered volatility, leading some companies to delay public listings. PayPay itself briefly postponed its roadshow following market turbulence linked to the Middle East conflict.

Still, analysts argue that strong domestic fintech platforms can attract investor appetite even during uncertain periods. Matt Kennedy of Renaissance Capital noted that many pre-IPO firms have waited extensively for ideal conditions, and PayPay’s move signals confidence in its underlying business.

Founded in 2018 as a joint venture between SoftBank Group and Yahoo Japan, PayPay expanded aggressively by waiving merchant fees and promoting cashless payments. By the end of 2025, it had around 72 million registered users, cementing its role in Japan’s digital payments ecosystem.

Strong Backing, Limited AI Disruption Risk

Cornerstone investors, including a subsidiary of the Qatar Investment Authority, an arm of Visa, and the Abu Dhabi Investment Authority, have shown interest in purchasing up to $220 million worth of shares.

Analysts also suggest PayPay faces relatively limited short-term disruption from artificial intelligence. Its deep integration within Japan’s domestic payments infrastructure offers some insulation compared to fintech firms more exposed to rapid AI-driven changes.

Binance Japan Stake Sparks Debate

However, not all commentary has been optimistic. An X post by Nina_star flagged potential concerns, highlighting PayPay’s reported 40% stake in Binance Japan as a possible regulatory risk.

The post warned that crypto exchange exposure during an uncertain global regulatory climate could create compliance challenges, particularly if scrutiny of digital asset platforms intensifies. It also questioned whether the $13.4 billion valuation may be aggressive given broader market volatility.

While no immediate regulatory action has been suggested, critics argue that traditional payment processors with crypto ties may face added complexity compared to purely domestic fintech peers.

Never Miss a Beat in the Crypto World!

Stay ahead with breaking news, expert analysis, and real-time updates on the latest trends in Bitcoin, altcoins, DeFi, NFTs, and more.

FAQs

What is PayPay’s expected IPO valuation?

PayPay’s U.S. IPO could value the company at up to $13.4 billion, with plans to raise about $1.1 billion by listing on Nasdaq under PAYP.

How many shares is PayPay offering in its IPO?

PayPay plans to sell nearly 55 million American depositary shares priced between $17 and $20 per share.

When will PayPay list on Nasdaq?

PayPay plans to list soon under “PAYP,” though exact timing depends on market conditions and investor demand during pricing.

Cosmos (ATOM) Price Prediction 2026, 2027 – 2030: Will ATOM Price Hit $300?

Cosmos (ATOM) Price Prediction

The post Cosmos (ATOM) Price Prediction 2026, 2027 – 2030: Will ATOM Price Hit $300? appeared first on Coinpedia Fintech News

Story Highlights

  • The live price of the Cosmos token is  $ 1.82784606.
  • Cosmos’s price could move toward $12 by the end of 2026 if recovery phases could unfold.
  • Broader interoperability growth may support targets of $38 to $62 by 2030.

Cosmos is entering the middle phase of 2026 in a position few expected a few years ago. After an extended correction cycle that compressed most altcoin valuations, ATOM now trades near $1.80, a level that reflects caution more than enthusiasm. Yet long-term infrastructure assets rarely rebuild loudly. Cosmos was designed to solve interoperability, the ability for blockchains to communicate seamlessly. As the industry matures and multi-chain ecosystems expand, this narrative becomes more relevant, not less.

ATOM appears to be stabilizing after months of decline. Selling pressure has slowed, volatility has reduced, and the price is consolidating rather than breaking lower. Extended consolidation phases at depressed valuations often mark accumulation rather than distribution. The bigger question is whether this base can transition into sustained recovery over the next few years.

CoinPedia’s Cosmos Price Prediction

Coinpedia’s price prediction for Cosmos (ATOM) depends on current price structure and long-term interoperability relevance, Cosmos appears to be in a base-building phase rather than a breakdown phase. If the broader market remains constructive, ATOM could rebuild toward mid-cycle levels before attempting higher valuations.

A realistic long-term scenario supports $38 as a structural 2030 target, with potential extension toward $62 under favorable macro and ecosystem conditions.

YearPotential Low ($)Potential Average ($)Potential High ($)
20264.008.0012.00

Cosmos (ATOM) Price March 2026 Outlook

Cosmos is not in a breakout phase right now. It’s simply trying to stay stable. ATOM price has been moving around the $1.60 to $1.80 area, and so far that zone is acting like a floor. Every time ATOM drops toward the lower side, buyers step in. That’s a good sign. It means the market is not panicking anymore.

But strength only shows if the price can move above $2.40 and stay there. If that happens, we could see a slow move toward $3.50–$4.00 next. That area will be tougher, because that’s where the last big fall started. For now, March is about one thing: staying above support. Cosmos doesn’t need a rally yet. It needs stability first.

Cosmos (ATOM) Price Prediction 2026

Since 2026 is already underway, the focus is now on how Cosmos performs through the year. This is not about sudden spikes. It’s about steady improvement. If the broader crypto market strengthens and money starts flowing back into established infrastructure projects, Cosmos could benefit.

Cosmos (ATOM) Price Prediction 2026

The real turning point for ATOM would be a move above $5.00. That level represents the start of the previous breakdown. If ATOM can reclaim it and hold, the market will see it as a serious recovery. Under healthy market conditions, Cosmos could gradually move into the $8–$12 range during 2026. That would mark a strong rebuilding phase. From there, the long-term path toward $38 and even $62 by 2030 becomes possible, but only if the recovery continues over multiple years.

ATOM Crypto Price Prediction 2026 – 2030

YearPotential Low ($)Potential Average ($Potential High ($)
20264.008.0012.00
20278.0014.0020.00
202815.0024.0032.00
202925.0035.0048.00
203038.0050.0062.00

ATOM Price Forecast 2026

In 2026, Cosmos price could project a low price of $4.00, an average price of $8.00, and a high of $12.00

Cosmos Crypto Price Prediction 2027

As per the Cosmos Price Prediction 2027, Cosmos may see a potential low price of $8.00, The potential high for Cosmos price in 2027 is estimated to reach $20.00

Cosmos (ATOM) Price Prediction 2028

In 2028, Cosmos  price is forecasted to potentially reach a low price of $15.00, and a high price of $32.00

ATOM Price Prediction 2029

Thereafter, the Cosmos  (Cosmos) price for the year 2029 could range between $25.00, and $48.00

ATOM Coin Price Prediction 2030

Finally, in 2030, the price of Cosmos  is predicted to maintain a steady positive. It may trade between $38.00 and $62.00

ATOM Price Prediction 2031, 2032, 2033, 2040, 2050

The long-term projection assumes Cosmos sustains relevance in enterprise blockchain use cases, with growth moderating over time as the asset matures.

YearPotential Low ($)Potential Average ($)Potential High ($)
203145.0060.0080.00
203255.0075.00100.00
203372.0095.00130.00
2040300.00450.00600.00
2050850.001200.001800.00

ATOM Price Prediction: Market Analysis?

Year202620272030
Changelly$10.00$14.00$28.00
CoinCodex$12.00$18.00$35.00
WalletInvestor$11.00$20.00$25.00
Never Miss a Beat in the Crypto World!

Stay ahead with breaking news, expert analysis, and real-time updates on the latest trends in Bitcoin, altcoins, DeFi, NFTs, and more.

FAQs

What is Cosmos (ATOM) used for?

Cosmos enables different blockchains to communicate using IBC, allowing asset transfers, data sharing, and scalable app development across networks.

What is Cosmos (ATOM) price prediction for 2026?

Cosmos (ATOM) could trade between $4 and $12 in 2026 if market recovery strengthens and ATOM reclaims key resistance above $5.

How much will Cosmos (ATOM) be worth in 2030?

ATOM may approach $50 by 2030 if interoperability adoption grows and the broader crypto market remains bullish.

What is the Cosmos price prediction for 2040?

Cosmos (ATOM) could trade between $300 and $600 by 2040 if long-term adoption and multi-chain interoperability continue expanding globally.

What is the Cosmos price prediction for 2050?

If adoption scales globally, long-term models project ATOM could reach $850–$1,800 by 2050 under sustained ecosystem growth.

Is Cosmos a good long-term investment?

Cosmos shows long-term potential due to its interoperability focus, but price performance depends on adoption, market cycles, and technical breakouts.

FirstECN Review: A Regulated CFD Platform With Tiered Accounts & TradingView Charts

first-ecn

The post FirstECN Review: A Regulated CFD Platform With Tiered Accounts & TradingView Charts appeared first on Coinpedia Fintech News

This review of FirstECN has been prepared using industry-standard evaluation criteria, focusing on transparency, regulation, trading infrastructure, platform quality, and overall service depth. The objective is to provide traders with a comprehensive understanding of what FirstECN offers, enabling them to determine whether the broker aligns with their trading goals, risk appetite, and expectations.

Broker Snapshot

  • Minimum Deposit: $250
  • Leverage: Up to 1:200
  • Trading Platform: Proprietary WebTrader + Mobile App
  • Islamic Account: Not explicitly stated
  • Regulation: MISA
  • Operating Company: Nakito SA, Comoros
  • Main Domain: www.firstecn.com
  • Account Types: Silver, Gold, Platinum

What is FirstECN?

FirstECN positions itself as a modern CFD trading platform built for traders who want simplicity on the surface and TradingView-grade analytics underneath. It combines a clean WebTrader interface, real-time market data, and three tiered accounts to support different trading styles — from casual day-traders to more active, high-frequency users.

FirstECN Operates under Nakito SA, a registered financial services provider regulated by MISA (Mwali International Services Authority) in the Comoros Union. The platform is designed to simplify online trading through a web-based interface and mobile application, combining accessibility with essential trading tools.

FirstECN positions itself as a streamlined trading environment where users can access CFD markets with leverage, real-time data, and a user-friendly interface. The broker emphasizes modern charting tools, intuitive navigation, and cross-device compatibility, making it appealing to both new and moderately experienced traders.

Tradable Instruments

FirstECN provides access to a range of financial markets through CFDs. The key asset classes available include:

  • Cryptocurrencies
  • Forex
  • Commodities
  • Shares
  • Indices

Regulation & Licensing

FirstECN operates under:

  • Company: Nakito SA
  • Registration Number: HT00324015
  • Regulator: MISA
  • License Number: BFX2024050
  • Registered Office: Bonovo Road, Fomboni, Comoros

MISA provides recognized regulatory oversight, though it is considered a mid-tier jurisdiction — suitable for legal compliance but not as stringent as FCA, ASIC, or CySEC. Traders should view this as adequate for operational legitimacy but not equivalent to top-tier regulatory protections.

This broad coverage allows traders to diversify across major global asset classes, with the flexibility to trade long or short using leverage. As a CFD platform, FirstECN does not offer ownership of underlying assets; instead, it facilitates directional trading based on price movements.

Trading Platforms

FirstECN’s trading ecosystem is built around two primary platforms:

WebTrader

A browser-based trading terminal designed for speed and simplicity.
Key features:

  • Real-time market data
  • TradingView-powered charting
  • Multi-timeframe analysis
  • Clean interface suitable for beginners
  • No software installation required

Mobile App

The mobile platform is optimized for traders who prefer to monitor markets and execute trades on the go.
Key strengths:

  • Full access to account features
  • Price alerts and instant notifications
    Modern UI and easy navigation
  • Enhanced data security and privacy protocols

Together, the platforms deliver a seamless cross-device trading experience with the functionality needed for active trading.

Account Types

FirstECN offers three structured account tiers designed to accommodate varying levels of trading experience:

Silver Account

  • No swap discount
  • Leverage up to 1:200
  • Minimum lot size: 0.01
  • No spread discount
  • 5% stop-out level

Gold Account

  • 40% swap discount
  • Leverage up to 1:200
  • 0.01 minimum lot size
  • 50% spread discount
  • 5% stop-out level

Platinum Account

  • 60% swap discount
  • Leverage up to 1:200
  • 0.01 minimum lot size
  • 75% spread discount
  • 5% stop-out level

These tiers primarily differ in pricing benefits and swap/spread conditions, giving higher-tier users more cost-efficient trading.

Deposits & Withdrawals

FirstECN supports standard payment channels with an emphasis on simplicity and security.

Deposits

  • Credit/Debit cards
  • Bank transfers
  • No deposit fee charged by the broker

Withdrawals

  • Bank transfers
  • Credit/Debit cards
  • No withdrawal fee charged by the broker
  • Processing time typically up to 3 business days
  • Minimum withdrawal for bank transfers: $50

Although payment methods are reliable, the variety is more limited compared to brokers that support wallets or instant payment systems.

Customer Support

FirstECN provides 24/5 customer assistance through multiple channels:

  • Email: support@FirstECN.com
  • Live Chat: Built into the website
  • Contact Form: Available on the Contact Us page

The support approach emphasizes direct communication and quick issue resolution during market hours.

Safety, Transparency, and Risk Management

As a regulated broker under MISA, FirstECN must comply with operational and financial guidelines, including client-fund segregation and adherence to AML/KYC procedures.

The platform also includes standard risk management tools such as:

  • Stop-loss orders
    Margin alerts
  • Swap and spread disclosures via account types

CFDs are inherently high risk, and the broker correctly alerts users to potential losses due to leverage and market volatility.

Pros of FirstECN

  • Regulated under MISA
  • TradingView-powered charting
  • Modern WebTrader interface
  • Mobile app with full feature access
  • Multiple asset classes available
  • Simple deposit and withdrawal structure
  • Zero broker-imposed transaction fees
  • Structured account tiers with pricing benefits
  • Strong emphasis on platform usability

Cons of FirstECN

  • Offshore mid-tier regulatory oversight
  • Limited payment method diversity
  • No detailed public fee breakdown outside account tiers
  • Not ideal for institutional or advanced professional traders
  • No alternative trading platforms like MT4/MT5

Final Verdict

FirstECN offers a clean, accessible, and well-structured CFD trading environment backed by TradingView charting, leverage up to 1:200, and a beginner-friendly interface. The broker is legally regulated, provides essential modern trading tools, and supports web and mobile trading without unnecessary complexity.

However, its offshore regulatory status, limited payment options, and lack of deep institutional features make it more suitable for retail traders seeking simplicity rather than advanced professionals requiring robust infrastructure.

For traders who want a straightforward, modern platform with essential CFD features and an easy learning curve, FirstECN presents a practical option.

The Crypto and Stock Market Rebound Is Coming This March: Fundstrat’s Tom Lee

Bitcoin Bottom Confirmed Bernstein and Coinbase Analyst Agree on Bullish Outlook

The post The Crypto and Stock Market Rebound Is Coming This March: Fundstrat’s Tom Lee appeared first on Coinpedia Fintech News

Tom Lee, the co-founder, Managing Partner, and Head of Research at Fundstrat Global Advisors, has predicted a market-wide revival, which he says will take place this March. 

“I think March is going to be a turnaround month for the better.”

In an interview with CNBC’s Squawk Box, Lee identified 2026 as a bullish year, with tech companies and cryptocurrencies showing the best gains.

Crypto and stock market bull run

In the interview, Lee forecasted a year-end target of 7,700 for the S&P 500 Index, which closed at $6,881 on Monday.

As for crypto, Lee dismissed the recent market volatility as more of a “squall” than a structural failure. He further reiterated a $200,000-$250,000 (roughly +165%) target for Bitcoin in 2026, adding that the flagship cryptocurrency would retire its historic four-year cycle in favor of a more mature momentum. This comment is similar to that made by digital asset management company Grayscale Investments, in its report dubbed the “Dawn of the Institutional Era.”

Lee projected similar sentiments on Ethereum, saying it was primed for a “supercycle.” The second-largest cryptocurrency by market cap would move from being a speculative asset to a significant financial infrastructure following heavy institutional adoption. This uptake would catalyze a rally to a range of $7,000 – $9,000 (roughly +363.92%) by early 2026, according to Lee.

Crypto price chart

Source: CoinMarketCap

He further noted AI-driven productivity, strong corporate earnings, and government support as key contributors to this outlook. AI infrastructure company Nvidia reported a staggering 875% increase in net profit since January 2023, according to Forbes. As for interest rates, the US Federal Reserve paused any further changes to the current range of 3.50% to 3.75%, with potential cuts expected to be delayed until June or September.

@fundstrat's Tom Lee expects March to be an up month for the stock markets: https://t.co/lBY02LCI2j

— Squawk Box (@SquawkCNBC) March 2, 2026

Comments on Lee’s market outlook

Most of the comments on CNBC’s X post of the interview depict wariness of Lee’s predictions, labeling him a  “permabull” due to consistently optimistic forecasts for the US stock markets. One commentator compared him to Jim Cramer, citing previous notable missed calls, such as ETH hitting $6,500 on August 2025.

Is ETH at $6500 like he predicted last August? Or his company at $65? Have never listened to this guy.

— Jim Thrift/Dad of 5 (@JimThrift) March 2, 2026

Ethereum Rivals Cardano With Upcoming Upgrades as Markets Rally

Ethereum Drops 10% as U.S and Israel Strike Iran, Whale Buying the Dip

The post Ethereum Rivals Cardano With Upcoming Upgrades as Markets Rally appeared first on Coinpedia Fintech News

Ethereum plans on implementing Proposer-Builder Separation (ePBS) and Fork-Choice-Enforced Inclusion Lists (FOCIL) within this year’s Glamsterdam and Hegota upgrades. Both aim to uphold network decentralization and scalability while increasing speed, privacy, and security.

PBS will roll out first with the Glamsterdam fork scheduled for the first half of this year. The feature will further separate block builders and validators on Ethereum, preventing large validators from monopolizing and profiting from select transactions, a concept referred to as Maximal Extractable Value (MEV).

On the other hand, FOCIL (EIP-7805), scheduled for the 2nd half of 2026, will compel 16 randomly chosen validators to include certain transactions in their block. This will prevent transaction blocking or censoring on the grounds of perceived profitability.

Ethereum rivals Cardano in network development

In early 2026, Ethereum’s MEV rose to about $24 million in a single month. While profitable for validators, revenue-driven approaches such as front-running and sandwiching resulted in increased network congestion and gas fees for users.

PBS distributes validator power, mitigating MEV-induced centralization that was typically associated with large validators. A bigger version of FOCIL, simply known as “Big FOCIL,” would offer the same benefits as its parent, only on a much larger scale.

Ethereum outline of Glamsterdam and Hegota upgrades

Source: X

Rival chain Cardano plans on offering similar benefits with the upcoming Midnight sidechain. The chain would leverage a dual tokenomics system that would enable users to hide sensitive information, including account transactions and balances. This development would also separate private and public computations, making Cardano less congested and effectively lowering gas fees. Midnight will also be regulatory compliant, which will encourage adoption among privacy-centric institutions.

1/ ICYMI: As Midnight moves toward mainnet, we’ve been rolling out the federated node operators helping run, secure, and strengthen the network before Midnight transitions to full community-driven block production later this year.

So far, seven organizations across cloud… pic.twitter.com/pcD6IrqJIj

— Midnight (@MidnightNtwrk) March 2, 2026

ETH and ADA prices

At press time, both ETH (2nd by market cap) and ADA (10th by market cap) showed positive price movement following the recent broad relief rally. ETH traded at $2,042, up 6%, while ADA traded at $0.28, up 2.70% in the last 24h. Cardano also showed positive market sentiment, following the recent launch of its USDC-backed stablecoin, USDCx.

Since the two altcoins move in lockstep with Bitcoin, their future price action largely relies on whether BTC will break above $70K.

Ethereum and Cardano market prices

Source: CoinMarketCap

Bitcoin Reclaims 69K Amid Big Institutional Buys

Crypto Crash Today Should You Buy the Bitcoin Dip as US and Israel Strike Iran

The post Bitcoin Reclaims 69K Amid Big Institutional Buys appeared first on Coinpedia Fintech News

On March 2, Bitcoin (BTC) reclaimed the $69K psychological level after a week of volatility that saw its price drop to $62K. At press time, the flagship cryptocurrency was trading at $69,483, up 3.65% in the last 24 hours. BTC’s market cap was also up 3.62% over the same time period to reach $1.38 trillion, while its open interest grew 6.74% to reach $46.12 billion.

Bitcoin price chart

Source: CoinMarketCap

The recovery is closely related to the recent increase in institutional accumulation, as firms take advantage of BTC discounted prices. 

Institutional buys buoy Bitcoin price

Strategy Inc. (NASDAQ: MSTR), the leading Bitcoin holder among publicly traded companies, has today reported accumulating 3,015 BTC in the past week. The purchase marks the firm’s 101st recorded Bitcoin acquisition and brings its total holdings to 720,737 BTC. At writing time, Strategy’s shares were trading at $137.42, up 6.32% in the last 24h.

Strategy has acquired 3,015 BTC for ~$204.1 million at ~$67,700 per bitcoin. As of 3/1/2026, we hodl 720,737 $BTC acquired for ~$54.77 billion at ~$75,985 per bitcoin. $MSTR $STRChttps://t.co/o9WaALcjan

— Strategy (@Strategy) March 2, 2026

Considering Strategy’s Average Cost Basis of $75,985 per BTC, this brings the company’s total net unrealized loss to $7.35 billion (13.4%). Still, the company continues to grow its Bitcoin treasury as it places greater preference on the long-term benefits of dollar-cost averaging over short-term gains. Underscoring this tactic is Strategy’s Q4, 2025 earnings call of 22.8% BTC yield for the whole of 2025.

The Turn of the Century. pic.twitter.com/6xiyuZrzVk

— Michael Saylor (@saylor) March 1, 2026

Another company that has recently increased its Bitcoin Treasury is ProCap Financial Inc. (NASDAQ: BRR), having announced an acquisition of 450 BTC at $30 million. This brings its total stash to 5,457 BTC, ranking it #19 in a list of public Bitcoin Treasury companies. ProCap plans to continue aggressively repurchasing its shares in order to cut the difference between stock prices and Net Asset Value (NAV), the latter being the amount of Bitcoin represented by each share.

Procap buys more Bitcoin

Source: Business Wire

Other companies that have recently reported increased BTC acquisitions include Metaplanet Inc.(35, 102), Block Inc.(8,883), and American Bitcoin Corp (5,843). Spot Bitcoin ETFs have accumulated roughly 21,000 BTC since October (the last major accumulation). Meanwhile, retailers continue to retreat, with Binance seeing retail inflows surge by $5 billion.

BTC Price Forecast

According to one renowned CoinMarketCap analyst, should BTC break its near-term resistance zone ($68K), then its price could shoot to upto $79K.

Bitcoin price forecast

Source: CoinMarketCap

Notably, BTC could restest $72,106 should it break above the $69,266 Fibonacci support. If not, then we could see a dip towards $65,224.

Why are Bitcoin, Ethereum and XRP Prices Rallying Today?

Why Is the Crypto Market Up Today Bitcoin, Ethereum & XRP Lead Broad Rally

The post Why are Bitcoin, Ethereum and XRP Prices Rallying Today? appeared first on Coinpedia Fintech News

Crypto markets turned green today. Bitcoin surged past $68,000 and briefly traded near $69,500, rising about 5% in just 50 minutes. The move added roughly $60 billion to Bitcoin’s market capitalization.

Ethereum followed closely, breaking above $2,000 and climbing nearly 6% within the same window, adding more than $20 billion in value.

XRP also joined the advance, trading around $1.41. In total, the broader crypto market added close to $100 billion in under an hour, triggering nearly $80 million in short liquidations during the surge.

So what’s behind the sudden rally?

Strong U.S. Economic Data Sparks Risk Appetite

One of the main drivers appears to be fresh macroeconomic data.

The U.S. ISM Manufacturing PMI came in at 52.4, beating expectations of 51.8. A reading above 50 signals expansion in the manufacturing sector.

For markets, that matters.

An expanding economy reduces immediate recession fears and often encourages investors to rotate back into risk assets. Crypto, which has shown a strong correlation with equities in recent months, reacted quickly to the upside surprise.

With risk sentiment improving, leveraged traders positioned for further downside were forced to cover.

A Massive Short Squeeze Accelerates the Move

As Bitcoin began pushing higher, short sellers were caught off guard. Roughly $80 million in short positions were liquidated within 45 minutes. Over 24 hours, total liquidations approached $128 million.

When short positions are forced to close, they effectively become market buy orders, which pushes prices even higher. That feedback loop created a sharp upward spike across major assets.

Bitcoin’s rapid 5% jump became the trigger that lifted the entire market.

Gold and Silver Plunge as Capital Rotates

At the same time, traditional safe-haven assets sold off aggressively.

Gold fell more than 2%, erasing an estimated $750 billion in market value, while silver dropped nearly 7%, wiping out about $370 billion.

The sharp decline in precious metals shows a rotation out of defensive positions. Crypto, which had been trading under pressure amid global tensions, appears to have benefited from that shift.

Recent data shows crypto moving inversely to gold, reinforcing the idea of capital rotation rather than isolated speculation.

Institutional Buying Adds Fuel

Beyond short liquidations, there are signs of continued institutional participation.

Strategy recently disclosed a $200 million Bitcoin purchase, reinforcing long-term conviction from corporate buyers. Large inflows like these provide underlying support during volatile sessions.

Where the Market Stands Now

The total crypto market capitalization climbed back toward $2.37 trillion, up more than 2% on the day. Despite the rebound, sentiment indicators still sit in “Extreme Fear” territory, suggesting positioning had been heavily defensive before the move.

Bitcoin now faces a critical test near the $69,000 level. Holding above $66,360 is seen as important for maintaining short-term structure.

The next major macro event is the Federal Reserve meeting on March 18. A dovish tone could extend momentum, while a hawkish stance may cool risk appetite again.

White House Apology? Why Gensler’s Reported Words Could Change XRP’s Future

Ripple CEO Brad Garlinghouse Explains

The post White House Apology? Why Gensler’s Reported Words Could Change XRP’s Future appeared first on Coinpedia Fintech News

In a moment few in the crypto industry expected, former SEC Chair Gary Gensler allegedly offered a personal apology to Brad Garlinghouse over the agency’s long-running lawsuit against Ripple.

The revelation came during remarks delivered at the XRP Australia Sydney 2026 conference. According to Garlinghouse, the encounter took place during a private interaction at the White House.

“He comes up to me and says, sorry,” Garlinghouse recounted in a video clip from the event. “He’s like, ‘Oh gosh, wait, no, I’m sorry. I was wrong. And you guys have done an incredible job.’ It was kind of weird that it happened at the White House.”

Gary Gensler reportedly apologized to Ripple 👀

Gary Gensler. .. "Sorry… I was wrong."

At #XRPSydney2026, Ripple CEO Brad Garlinghouse revealed a shocker: Gary Gensler personally approached him at the White House and said, "Sorry… I was wrong."
Garlinghouse says the long… https://t.co/Kq3UJeGHc8 pic.twitter.com/fEZ91mQ4lW

— 𝗕𝗮𝗻𝗸XRP (@BankXRP) February 27, 2026

If accurate, the statement marks a dramatic turn in one of crypto’s most consequential regulatory battles.

From Lawsuit to Apology

The SEC filed its lawsuit against Ripple in December 2020, alleging that XRP had been sold as an unregistered security. The case triggered widespread uncertainty across the digital asset sector and led to major exchange delistings. XRP’s price plunged, and the token spent years navigating legal and reputational headwinds.

Gensler, who took over as SEC chair after the case was initiated, became closely associated with the agency’s broader crackdown on crypto markets. Under his leadership, enforcement actions expanded, and regulatory scrutiny intensified.

That is why the reported apology carries weight. Sitting or former regulators rarely acknowledge missteps publicly, especially in high-profile enforcement matters. If Gensler did indeed tell Garlinghouse “I was wrong,” it signals more than a personal gesture. It suggests a shift in tone at the highest levels of financial oversight.

A Changed Regulatory Climate

Since Gensler’s departure, Washington’s approach to digital assets appears to be evolving. Lawmakers have pushed for clearer market structure frameworks, and discussions around digital asset classification have gained bipartisan traction.

For Ripple and XRP holders, the apology, whether symbolic or substantive, is being interpreted as institutional validation. The lawsuit that once cast a shadow over XRP now looks, in hindsight, like a chapter closing rather than a threat lingering.

Garlinghouse framed the moment as proof that utility ultimately prevails. He told attendees that if Ripple continues focusing on real-world use cases and cross-border payments infrastructure, he remains confident about the company’s direction.

What This Means for XRP in 2026

The bigger question now is whether this turning point could position XRP for a stronger cycle in 2026.

Legal clarity has historically played a major role in XRP’s price movements. When court rulings favored Ripple during the legal battle, the token responded sharply. Regulatory overhang has long been cited as one of the primary factors limiting sustained upside.

If that overhang is truly gone, the narrative around XRP shifts. Instead of surviving a lawsuit, the token re-enters the conversation as one of the few major cryptocurrencies to withstand direct federal scrutiny and continue operating globally.

Market performance will still depend on broader crypto conditions, liquidity cycles and Bitcoin’s direction. But with the legal cloud lifting and policy discussions becoming more structured, XRP could find itself back in focus during the next expansion phase.

Michael Saylor’s Strategy Acquires 3,015 BTC

Michael Saylor’s Strategy Acquires 3,015 BTC

The post Michael Saylor’s Strategy Acquires 3,015 BTC appeared first on Coinpedia Fintech News

Michael Saylor’s firm Strategy has added 3,015 bitcoins at an average price near $67,700, spending about $204.1 million in its most recent purchase. This move reflects continued confidence in Bitcoin’s long-term value. As of March 1, 2026, Strategy holds a total of 720,737 bitcoins, acquired at an average price of around $75,985 and a combined cost basis of about $54.77 billion. The firm remains one of the largest and most committed institutional holders in the crypto market.

Cronos (CRO) Price Prediction 2026, 2027-2030: Is CRO Set for a Major Breakout?

Cronos Price Prediction

The post Cronos (CRO) Price Prediction 2026, 2027-2030: Is CRO Set for a Major Breakout? appeared first on Coinpedia Fintech News

Story Highlights

  • The live price of Cronos crypto is  $ 0.07526590.
  • Cronos coin price is expected to go as high as $0.3000 to $0.3500 in 2026.
  • CRO crypto may cross the $1 mark, with a potential high of $1.3190 by 2029.

Cronos (CRO) serves as the backbone of the Cronos Chain, a high-performance, open-source ecosystem engineered by Crypto.com. Designed to bridge the gap between traditional finance and Web3, CRO acts as a versatile utility token that facilitates instantaneous, low-cost global transactions while powering a vast suite of DeFi applications, perpetuals, and fiat-integrated markets.

Driven by institutional-grade infrastructure and a rapidly expanding global footprint, CRO’s market performance increasingly reflects a surge in investor confidence and real-world utility. As the network matures into 2026, its role in the next generation of digital asset exchange becomes even more pivotal.

In this analysis, we leverage advanced technical indicators and historical performance models to forecast the trajectory of Cronos. Whether you are a long-term holder or a strategic investor, this guide provides essential price projections for 2026 and through to 2035, helping you determine if CRO/USD is the missing piece for your portfolio.

Cronos Price Today

Cryptocurrency Cronos
Token CRO
Price $0.0753 up 0.50%
Market Cap$ 3,091,387,415.96
24h Volume$ 10,967,233.1476
Circulating Supply41,072,882,442.8934
Total Supply98,439,549,730.1517
All-Time High$ 0.9698 on 24 November 2021
All-Time Low$ 0.0115 on 17 December 2018

Coinpedia’s CRO Price Prediction 2026

CRO is currently in a “wait and see” period. If the demand zone at $0.0500 – $0.1000 continues to hold, the convergence of a bullish MACD cross and recovering CMF points toward a gradual climb back to the $0.3000 level. Investors should watch for a definitive close above the supply zone to confirm a long-term bullish reversal.

Cronos Price Prediction March 2026

The Cronos price is currently consolidating on the daily chart around the central horizontal line at approximately $0.0777, which marks the multi-year demand range block (indicated in green). This consolidation is showing less momentum, and if it continues on the daily chart, we may see this trend persist into March. 

However, if the price breaches $0.1000, we can expect it to reach the 200-day EMA band around $0.1200 by March. On the other hand, if bearish forces come into play, March could see the price drop to the lower end of the current demand range, potentially hitting a low of around $0.0600.

Cronos Price Prediction March 2026

Recent Updates & Network News

On February 5, 2026, Cronos announced the development of a unified trading platform offering tokenized stocks, commodities, and prediction markets. This expansion is supported by a strategic integration with Fireblocks, providing the secure, institutional-grade custody infrastructure necessary for market makers to trade at scale.

Following this, a post on February 28 announced the Cronos v1.7 Network Upgrade is scheduled for March 10 at 07:00 GMT. This technical maintenance will involve approximately 30 minutes of downtime to align with recent SDK updates and implement RPC performance improvements to ensure long-term chain stability.

CRO Price Prediction for 2026

The weekly chart for CRO/USD reveals a persistent long-term structure defined by a well-established accumulation zone. Since late 2023, Cronos has consistently found a floor within the $0.0500 to $0.1000 demand area. This “buy zone” has historically triggered significant rallies, notably in late 2024 and mid-2025, where the price peaked at $0.3900.

As of early 2026, CRO has returned to this familiar base, setting the stage for its next major move.

The current weekly price action suggests a period of base-building. We are seeing a repeat of the historical pattern where CRO enters a deep consolidation phase before a vertical expansion.

Supply Zone: The primary target for a breakout lies between $0.3000 and $0.3500.

The Pivot Point: Simply hitting the supply zone isn’t enough; for a true trend reversal, CRO must flip this resistance into support to reclaim its 2022 highs.

CRO Price Prediction for 2026

Moreover, While the price remains flat, the underlying “engine” of the market (indicators) is starting to show signs of exhaustion from the bears:

In MACD for instance we are currently approaching a weekly bullish cross. Historically, this cross has served as the starting gun for intensified consolidation that eventually leads to a breakout at later stage.

CMF is the most encouraging sign. The CMF has bounced sharply from a low of -0.32. This move toward the zero line suggests that selling pressure is fading and capital is starting to stabilize within the ecosystem.

RSI & AO, Both indicate that the “cooling off” period is still in effect. This lack of a clear direction in RSI confirms we are in a neutral accumulation phase, which is often known as the quiet before the storm.

CRO price

What Makes CRO Interesting in 2026?

In 2026, Cronos (CRO) stands out as a unique bridge between high-finance and retail utility. The landscape shifted dramatically in late august 2025 when Trump Media Group announced a $6.42 billion CRO Digital Asset Treasury strategy, signaling a massive institutional endorsement of the token’s scarcity.

Beyond the headlines, Cronos remains a technical powerhouse with zero downtime over four years. It currently supports 150M+ users via the Crypto.com ecosystem and powers payments for 10M+ merchants. While the broader market has cooled in Q1, Cronos maintains a healthy 100,000 daily transactions, proving its resilience. This blend of “battle-tested” infrastructure and “institutional-grade” liquidity makes it a critical pillar of the 2026 digital economy.

Cronos Daily Transaction

Cronos (CRO) Price Prediction for 2027-2035

YearMinimum Price ($)Maximum Price ($)Average Trading Price ($)
20270.16900.34900.2490
20280.35700.69900.5090
20290.71001.31900.9890
20301.34902.40101.8210
20312.42004.19903.2350
20324.22107.10005.5290
20337.109011.50509.1650
203411.591018.451014.7650
203518.429028.711023.1990

Cronos Token Price Prediction for 2027

By 2027 Cronos token price is expected to trade between $0.1690 and $0.3490. The average expected trading cost is $0.2490.

CRO Price Prediction for 2028

In 2028, CRO price is expected to trade between $0.3570 and $0.6990. The average expected trading cost is $0.5090.

Cronos (CRO) Crypto Price Prediction for 2029

Experts expect Cronos crypto to trade between $0.7100 and $1.3190 in 2029. The average expected trading cost is $0.9890.

CRO Price Prediction for 2030

Based on technical CRO price analysis it is expected to trade between $1.3490 and $2.4010 in 2030. The average expected trading cost is $1.8210.

CRO/USD Price Prediction for 2031

Based on technical analysis by experts, in 2031 CRO/USD is expected to trade between $2.4200 and $4.1990. The average expected trading cost is $3.2350.

Cronos Price Prediction for 2032

Following 2031, in 2032, Cronos price is expected to trade between $4.2210 and $7.1000. The average expected trading cost is $5.5290.

CRO Token Price Prediction for 2033

In 2033, CRO token price is expected to trade between $7.1090 and $11.5050, with an average expected trading cost of $9.1650.Price Prediction for 2034

CRO Crypto Price Prediction for 2034

Based on technical analysis by cryptocurrency experts, in 2034 CRO crypto is expected to trade between $11.5910 and $18.4510. The average expected trading cost is $14.7650.

CRO Price Prediction for 2035

According to technical analysis by top specialists, the CRO price is projected to range from $18.4290 to $28.7110 by 2035. The anticipated average trading price is $23.1990.

Never Miss a Beat in the Crypto World!

Stay ahead with breaking news, expert analysis, and real-time updates on the latest trends in Bitcoin, altcoins, DeFi, NFTs, and more.

FAQs

What is the Cronos (CRO) price prediction for 2026?

CRO is expected to trade within the $0.05–$0.35 range in 2026, with a breakout above $0.30 needed to confirm a bullish reversal.

Can Cronos (CRO) reach $1 by 2030?

Based on long-term projections, CRO could trade between $1.34 and $2.40 by 2030 if adoption and momentum continue.

Is Cronos a good long-term investment through 2035?

Long-term forecasts suggest gradual growth toward higher ranges by 2035, but returns depend on adoption and market cycles.

What could drive CRO price growth in 2026?

Institutional integration, network upgrades, rising utility, and a confirmed bullish MACD cross could support upside momentum.

XRP Price Prediction for March 2026: Could XRP Drop Below $1?

XRP trading activity surge on Bitrue

The post XRP Price Prediction for March 2026: Could XRP Drop Below $1? appeared first on Coinpedia Fintech News

XRP price continues to trade under sustained pressure on the daily timeframe, with price action firmly locked inside a descending channel that has guided the broader correction since last year’s peak near $3.50.

At the time of writing, XRP is hovering around the $1.34 region, sitting just above a critical psychological and structural support zone near $1.00–$1.10. The key question for March: Is XRP price stabilizing, or is the $1 level becoming vulnerable?

Daily Structure Remains Bearish While Momentum Signals Weak Recovery

Price has consistently printed lower highs and lower lows within a well-defined descending channel. Each attempt to rally toward the upper boundary has been rejected, reinforcing the dominant bearish structure. Recent price action shows XRP breaking toward the lower half of the channel again after failing to sustain a recovery above $2.00 earlier this year.

Until the upper channel resistance is reclaimed, momentum remains tilted to the downside.

xrp price

The daily RSI is hovering below the neutral 50 level, currently sitting in the high-30s to low-40s range. This suggests bearish momentum still dominates, although the market is not deeply oversold. There was a recent RSI dip toward oversold territory, followed by a mild bounce. However, that recovery has lacked follow-through.

OBV (On-Balance Volume) continues to trend lower, indicating that buying pressure has not meaningfully reversed the broader distribution phase. Sustained accumulation is not yet visible on volume. In simple terms, buyers are present but not aggressive.

Why is the $1 Level Technically Important for the XRP Price Rally?

The $1 zone carries both psychological and structural significance. Historically, round-number levels often act as magnets for liquidity. On this chart, $1 aligns closely with the lower boundary of the descending channel projected forward. If XRP continues drifting lower within the channel, a test of $1 becomes increasingly likely in March.

However, a clean breakdown below $1 would require increased selling volume and a decisive daily close beneath that support, which has not occurred. Only a break above the descending channel resistance or a daily close back above the $1.6 to $1.7 region to establish a higher high could stabilize the price.   

Conclusion—What To Expect in March 2026?

XRP’s daily chart remains technically bearish heading into March 2026. The descending channel structure is intact, and momentum indicators do not yet show confirmed accumulation. The most probable short-term scenario is continued movement within the descending channel, with $1 acting as the next major test zone. If $1 holds, XRP could attempt another relief bounce toward the mid-channel region near $1.60. If it fails, the breakdown could trigger a deeper liquidity sweep.

 Whether XRP stabilizes above it or loses it will likely define the tone for the coming weeks.

Until the channel breaks, caution remains warranted.

Ethereum price Crashes While Supply Quietly Vanishes: Is ETH Supply Shock Brewing Now?

Ethereum price Crashes While Supply Quietly Vanishes Is ETH Supply Shock Brewing Now

The post Ethereum price Crashes While Supply Quietly Vanishes: Is ETH Supply Shock Brewing Now? appeared first on Coinpedia Fintech News

The Ethereum price may be flashing red, but beneath the surface, something very different is happening. While traders focus on falling candles, holders are steadily pulling coins off exchanges and not in small amounts.

Exchange reserves have dropped to 16 million ETH, down sharply from 23 million in 2023. That’s a multi-year low. And here’s the twist: this decline happened while the Ethereum price dumped.

Normally, price crashes are fueled by panic selling. This time? The coins are leaving exchanges instead of flooding them.

Exchange Reserves Hit Lows

Exchange reserves track how much ETH is sitting on trading platforms, ready to be sold. Less ETH on exchanges generally means less immediate sell pressure.

But let’s be real. the reserves dropping during a rally is one thing. Reserves dropping during a crash? That’s different.

It suggests holders aren’t rushing to exit. They’re withdrawing. To staking. To cold storage. To DeFi. An active choice to hold rather than panic, per an analyst.

When you overlay that dynamic on the Ethereum price chart, the divergence becomes hard to ignore.

Ethereum price Crashes While Supply Quietly Vanishes: Is ETH Supply Shock Brewing Now?

Validator Queue Explodes

If the reserve data raises eyebrows, the staking numbers make them shoot up.

At the time of writing, 3,472,679 ETH is waiting to be staked on the network. Meanwhile, only 96 ETH is queued to exit. Entry requests outpace exits by roughly 36,174 times.

That’s not a typo.

The last time exits exceeded entry requests was in late December 2025. Since then, validator interest has surged. Capital isn’t running from the network, it’s lining up to lock in.

For anyone building an Ethereum price prediction, this imbalance is difficult to dismiss. Supply sitting idle on exchanges is shrinking, while supply being locked away is growing.

Ethereum price Crashes While Supply Quietly Vanishes: Is ETH Supply Shock Brewing Now?

Quiet Accumulation Phase?

Historically, supply shocks don’t begin with fireworks. They start quietly.

Coins disappear from exchanges. Staking participation climbs. Retail sentiment stays cautious. Price action looks weak. And then, eventually, liquidity tightens.

The market right now is clearly nervous. But on-chain data paints a calmer picture. Holders appear to be making deliberate decisions: fewer coins available for immediate sale, more coins committed to long-term positioning.

That doesn’t guarantee a rally tomorrow. It doesn’t invalidate short-term volatility in ETH/USD either.

But if supply keeps contracting while demand stabilizes, the setup shifts. The current Ethereum price may reflect fear yet the structural backdrop suggests something more strategic could be unfolding beneath the surface.

Ethereum Price Crash or Cycle Bottom? Whale Data May Reveal the Truth

Is Ethereum at Risk? Vitalik Buterin Reveals Post-Quantum Upgrade Strategy

The post Ethereum Price Crash or Cycle Bottom? Whale Data May Reveal the Truth appeared first on Coinpedia Fintech News

Ethereum price enters March under pressure, and the Ethereum price crash narrative is quickly gaining traction across the market. With global tensions rising and risk appetite fading, investors are reassessing exposure to high-beta assets like crypto. ETH is now hovering near a structural support level that has defined its macro uptrend for nearly five years. At the same time, on-chain data shows whale wallets slipping into unrealized losses, a signal that has historically appeared closer to market bottoms than the start of prolonged collapses.

So the real question becomes: Is this Ethereum price crash the beginning of deeper downside, or the final stage of correction before a recovery phase? The data suggests this is more than just another dip.

Whale Unrealized Losses Turn Negative: A Late-Cycle Stress Signal

On-chain analytics tracking Ethereum addresses holding between 1,000 and 10,000 ETH show unrealized profit ratios falling below zero. This means a significant portion of large holders are now underwater relative to their average cost basis. Historically, sustained negative whale unrealized profit conditions have appeared during:

  • The 2018–2019 macro bottom
  • The 2022 capitulation phase
  • High-stress market flush events
ETH whales data

When whales move into loss territory, it typically signals late-stage correction rather than early-stage breakdown. Large holders rarely distribute aggressively while deeply underwater. Instead, this phase often reflects exhaustion among weaker participants while stronger hands stabilize positioning. Current readings suggest Ethereum is entering a high-pressure zone historically associated with inflection points.

This does not confirm a bottom, but it does indicate structural stress is elevated.

Ethereum Price Tests Five-Year Structural Support: What It Means for ETH?

From a technical standpoint, Ethereum price is compressing near a rising monthly trendline that has supported its broader macro structure since the last cycle reset. This trendline previously acted as:

  • A long-term accumulation base
  • A corrective floor during major drawdowns
  • A foundation for extended upside expansions
ETH price crash

Importantly, ETH is not breaking down impulsively below this support. Instead, price action shows tightening consolidation directly above the level. Compression at structural support is significantly different from breakdown. A confirmed monthly close below this trendline would strengthen the Ethereum price crash thesis and potentially open deeper retracement zones. However, as long as the level holds, the broader macro structure remains technically intact.

Macro Conditions Add Pressure to the Ethereum Price Outlook

The broader market backdrop remains fragile. Rising geopolitical tensions and reduced liquidity across global markets have increased volatility in risk assets. Crypto derivatives positioning reflects this caution. Funding rates have leaned neutral-to-negative, suggesting speculative long exposure has cooled rather than expanded. 

ETH funding rate

This environment typically aligns with defensive positioning, not euphoric excess. Historically, major bottoms form when:

  • Sentiment weakens
  • Leverage is flushed
  • Large holders absorb volatility

Ethereum’s current setup aligns with that template more closely than with early bull-cycle exuberance. Ethereum price must hold its five-year structural support to invalidate deeper crash scenarios. For now, Ethereum price stands at macro crossroads. On the upside, reclaiming the near-term resistance zone of $2,200 would signal returning strength and shift short- term momentum back toward recovery. On the downside, a decisive break below the macro support zone of $1,700 would expose ETH to deeper historical demand zones near $1500 and intensify the Ethereum price crash narrative. 

After 5 Red Months, Is Bitcoin About to Explode? What It Means for XRP Price

After 5 Red Months, Is Bitcoin About to Explode? What It Means for XRP Price

The post After 5 Red Months, Is Bitcoin About to Explode? What It Means for XRP Price appeared first on Coinpedia Fintech News

A new month has begun, and for crypto markets, March could carry more weight than usual.

After months of sideways trading and repeated pullbacks, some analysts believe Bitcoin and XRP may be approaching a decisive moment. The argument is simple. Extended periods of weakness are often followed by sharp reversals. And on the higher time frame charts, Bitcoin has now logged five consecutive red monthly candles, a rare stretch in its history.

The last time Bitcoin saw that kind of sustained monthly decline, a strong rebound followed soon after.

Bitcoin’s $72,000 Test

On the technical front, one level stands out. Bitcoin needs to break and hold above $72,000 to shift the broader structure. Until that happens, the market remains range-bound, moving up and down without a clear trend.

A confirmed move above that zone would signal that buyers have regained control on higher time frames. Such a breakout could end the choppy conditions that have defined the past several weeks.

If Bitcoin clears that level decisively, it would lift sentiment across the broader market, including XRP and other altcoins.

What XRP Needs to Reclaim

For XRP, the level to watch is around $1.50.

The token has been consolidating after recent volatility, and price action remains compressed within a defined range. A sustained break above $1.50 would shift the structure and open the path toward $2, according to market observers.

So far, XRP appears to be stabilizing alongside Bitcoin. The argument from the analyst is that the worst of the recent pullback may already be behind the market. However, confirmation depends on reclaiming resistance, not anticipation.

Why March Matters

Historically, extended downturns often end when sentiment reaches exhaustion. After months of declines, trading volumes typically thin out, social engagement drops, and retail participation slows. That environment can create conditions for a reversal if buyers step in.

Bitcoin’s five-month losing streak places it in that type of setup. While history does not guarantee repetition, past cycles show that prolonged weakness has sometimes preceded sharp recoveries.

Expectations of eventual Federal Reserve rate cuts, the ongoing digital asset policy debate in Washington, and progress on market structure legislation could influence risk appetite in the coming months.

Still, these are supportive narratives. Price confirmation remains the deciding factor.

Never Miss a Beat in the Crypto World!

Stay ahead with breaking news, expert analysis, and real-time updates on the latest trends in Bitcoin, altcoins, DeFi, NFTs, and more.

FAQs

What price level must XRP reclaim to turn bullish?

XRP needs a strong close above $1.50. Holding that level could open the path toward $2 and shift market structure.

Why could March be important for crypto markets?

Extended downturns can end when sentiment is exhausted. March may bring volatility as traders watch for breakout confirmation.

How do Federal Reserve rate cuts affect Bitcoin and XRP?

Rate cut expectations can improve risk appetite. If liquidity conditions ease, crypto assets may benefit from renewed buying interest.

Bitcoin price Flashes 2021 Déjà Vu as NUPL Warns of Deeper Flush

Bitcoin price Flashes 2021 Déjà Vu as NUPL Warns of Deeper Flush

The post Bitcoin price Flashes 2021 Déjà Vu as NUPL Warns of Deeper Flush appeared first on Coinpedia Fintech News

The Bitcoin price is starting to look uncomfortably familiar. Multiple tops. Lower highs. Weak rebounds. If you squint at the current structure and compare it to 2021, the resemblance isn’t subtle but it’s somewhat eerie thats making it hard to slide.

Back then, the pattern ended in a violent capitulation. And now, as 2026 unfolds, charts and onchain are whispering the same word again: flush.

Bitcoin Price Mirrors 2021 in 2026

Pull up the Bitcoin price chart on the 2-week timeframe and the structure stands out. In both 2021 and 2025, price carved out multiple tops before sliding into a series of lower highs. Each bounce looked promising, until it wasn’t.

That staircase down eventually gave way to a sharp breakdown the last time around. The current setup in 2026 is tracing a similar rhythm: rally, rejection, weaker rally, rejection again.

Well, here’s the kicker. According to an analyst, MerlijnTrader, one projection on the chart points toward the $48,000 region if history continues to rhyme into 2026. That’s not a prediction carved in stone, but it’s a scenario traders are clearly watching as the broader Bitcoin price prediction narrative shifts from bullish optimism to defensive positioning.

Bitcoin price Flashes 2021 Déjà Vu as NUPL Warns of Deeper Flush

Weak Rebounds, Heavy Structure

Lower highs are typically not bullish. They signal exhaustion. Buyers step in, but not with conviction. Sellers regain control faster each time. That’s exactly what defined the final stages of the previous cycle peak.

The current Bitcoin/USD structure shows similar hesitation. Instead of explosive recoveries, rebounds are fading quickly. Momentum looks tired.

And while some argue this is just consolidation before another breakout, the historical comparison isn’t comforting. The prior pattern didn’t resolve upward. It resolved violently downward.

NUPL Adds Bearish Weight

If the price pattern feels uneasy, the on-chain data doesn’t exactly calm nerves.

The Net Unrealized Profit/Loss (NUPL) metric currently sits at 0.17 which is above the zero line. That matters. According to the framework, a true bottoming phase typically forms when NUPL dips below zero, remains there for a period, and then rebounds.

Bitcoin price Flashes 2021 Déjà Vu as NUPL Warns of Deeper Flush

Per this chart, We’re not there yet in bottoming phase. At 0.17, the market still holds net unrealized profit. That suggests the kind of deep capitulation seen at cycle lows hasn’t happened yet. In other words, bearish pressure may not be fully exhausted.
So what does that mean? If the structure continues to mirror 2021 and NUPL stays above zero, the Bitcoin price could still face another leg down before a genuine bottom forms. If history rhymes again, 2026 might bring the final washout before a fresh rally can truly begin.

Pi Network News: 60,000 Pi Locked in 12 Days, Is 100K Next?

Pi Network News 60,000 Pi Locked in 12 Days, Is 100K Next

The post Pi Network News: 60,000 Pi Locked in 12 Days, Is 100K Next? appeared first on Coinpedia Fintech News

Pi momentum is heating up again. With foundational systems in place, the network’s growth will depend on the applications, services, and real-world utilities developed on top of that infrastructure. After previously touching 74,000 Pi staked, the BNPi community is now pushing toward a new milestone: 100,000 Pi. 

In just 12 days, over 60,289 Pi have already been locked, sparking renewed excitement across the ecosystem and raising one big question: 

Can the community hit six figures before Pi Day? Let’s find out!

The latest update from BNPi confirms that 60,289.207523 Pi is currently staked, a sharp climb that highlights growing engagement within the network. The pace has surprised even longtime supporters. With staking accelerating daily, optimism is building that the 74,000 milestone could soon be left behind.

Community Push Toward 100K Pi

BNPi’s team is leaning heavily into community energy. In a recent post, they reminded followers of the last 74,000 milestone and asked whether 100,000 is achievable this time. The message was simple but powerful: progress happens step by step, and collective effort drives results.

That sentiment appears to be resonating. The staking surge suggests users are not just watching from the sidelines but actively participating. The psychological impact of nearing a round-number target like 100,000 Pi could further fuel momentum in the coming days.

Analysts Highlight Growing Ecosystem Utility

Community voices are amplifying the excitement. Crypto analyst drealFx described the 60K milestone in just 12 days as “crazy,” pointing to undeniable energy around BNPi. He emphasized that the momentum is tied to something deeper than hype, real-world utility.

BNPi positions itself within the Pi real-estate ecosystem, aiming to expand tangible use cases. That narrative appears to be strengthening confidence. Rather than purely speculative interest, supporters are framing staking growth as a reflection of expanding ecosystem value.

Utility Narratives Driving Engagement

The broader theme emerging from these discussions is utility. BNPi continues to promote real-world applications for Pi, particularly in real estate. This gives the staking campaign a more structured foundation compared to short-lived social media trends.

Historically, milestone-driven pushes can create strong bursts of activity. If staking momentum remains steady beyond headline targets, it could indicate deeper ecosystem commitment.

For now, the data shows one clear trend: participation is accelerating. With over 60K Pi already staked and community enthusiasm rising, the race toward 100,000 has officially begun.

Never Miss a Beat in the Crypto World!

Stay ahead with breaking news, expert analysis, and real-time updates on the latest trends in Bitcoin, altcoins, DeFi, NFTs, and more.

FAQs

What is the BNPi 100K Pi staking milestone?

It’s a community goal to lock 100,000 Pi in BNPi staking. Crossing it would signal stronger engagement and growing ecosystem confidence.

How much Pi is currently staked in BNPi?

Over 60,289 Pi has been locked in just 12 days, reflecting accelerating participation and renewed momentum across the network.

Does higher staking mean long-term ecosystem growth?

Sustained staking often signals deeper commitment. If momentum holds beyond milestones, it may reflect stronger long-term adoption.

Is World War III Starting? U.S.–Israel–Iran Conflict Escalates Beyond, Bitcoin Price At Risk

Is World War III Starting U.S.–Israel–Iran Conflict Escalates Beyond, Bitcoin Price At Risk

The post Is World War III Starting? U.S.–Israel–Iran Conflict Escalates Beyond, Bitcoin Price At Risk appeared first on Coinpedia Fintech News

Fears of World War III are rising as the U.S., Israel, and Iran conflict grows and more countries take sides. The UK, France, and Germany back the U.S., while Russia and China criticize the strikes. As tensions increase, the Bitcoin price has impacted hard, as investor shifts for a safer haven.

Are we on the verge of World War III?

U.S.-Israel & Iran Conflict Escalating World War III

On February 28, 2026, the U.S. and Israel carried out large airstrikes across Iran. The attacks targeted military sites, key leaders, and major facilities. One strike reportedly hit the office of Iran’s Supreme Leader Ayatollah Ali Khamenei, who was killed.

Iran quickly responded with missile and drone attacks on Israel and U.S. military bases in the Gulf region. Strikes were also reported in Bahrain, Qatar, Kuwait, Saudi Arabia, Oman, the UAE, & other nations, where U.S. forces are present.

Iran has also threatened to block the Strait of Hormuz, a key route that carries about 20–30% of the world’s oil supply.

The rapid rise in attacks has increased fears of a bigger war, with some worrying about World War III.

Rising Global Tensions Raise Fears of Wider War

Because this fight is no longer just between two sides. Hezbollah, a group backed by Iran, fired rockets at northern Israel, and Israel struck back in Lebanon.

France, Germany, and the United Kingdom support the United States. They criticized Iran’s response and asked for talks to stop the conflict from growing.

Meanwhile, China and Russia strongly criticized the U.S. and Israeli attacks. They said the strikes were not justified and warned that they could make the Middle East conflict much worse.

The United Nations and many countries have called for restraint and a return to diplomacy to avoid further violence.

Bitcoin Price To Hit Hard

Bitcoin, the leading cryptocurrency, dropped sharply to $63,000 during that time. At the same time, major altcoins like ETH, XRP, SOL, ADA, and Dogecoin also fell around 10%.

Bitcoin closed February down 15%, marking its fifth straight month in the red. According to a CryptoQuant analyst, about 9.09 million BTC, nearly 46% of the total supply, is now sitting at a loss.

Looking at the current price trend, the $58,000 level stands out as a strong historical buying zone. In past cycles, this level has often acted as solid support for Bitcoin.

My target for Bitcoin.

First level: 65k. That's the previous all-time high. We're already there. If you buy the thesis, it's already time.

Second level: 58k. The 200-week simple moving average.

In 2020, the 200W SMA caught the COVID crash. In 2018, it marked the absolute… pic.twitter.com/gyUdYnLv3M

— VirtualBacon (@virtualbacon) March 2, 2026

What Did Ripple CTO Mean by ‘I Hope You Do Really Well’ on XRP?

‘We Designed XRPL So Ripple Could Not Control It’ David Schwartz Breaks Silence

The post What Did Ripple CTO Mean by ‘I Hope You Do Really Well’ on XRP? appeared first on Coinpedia Fintech News

A casual exchange on X has turned into a widely discussed moment within the XRP community, after Ripple’s Chief Technology Officer opened up about selling Ethereum far too early.

It began when tech YouTuber Dave Jones shared a familiar crypto story.“I bought Ethereum at $15. Thought I was winning selling at $90 for a 6-bagger,” he wrote.

For many early investors, that kind of exit once felt like a victory.

“Thought I Was an Investing Genius”

The response from David Schwartz, CTO of Ripple and one of the creators of the XRP Ledger, quickly caught attention.

“Same. Sold 40,000 ETH at $1.05 and thought that I was an investing genius.”

Ethereum later climbed into the thousands of dollars, turning early sales like that into some of crypto’s most painful “what if” stories.

The comment resonated because it showed something even seasoned insiders experience: mistimed exits.

From Ethereum Regret to XRP Accumulation

The conversation soon shifted to XRP. When asked about his current position, Jones replied simply: “I just acquired more XRP.”

Schwartz followed with another comment that sparked fresh discussion:

“Whenever people tell me they hold or bought XRP, I always tell them that I hope they do really well. They think that I’m being nice to them.”

The remark led some to question whether he was being sarcastic. Others interpreted it as subtle confidence.

Understated Confidence, Not Hype

Schwartz is known for avoiding price predictions and hype-driven messaging. His public comments typically focus on technology, network development, and long-term adoption rather than short-term price moves.

Within the XRP community, his words were largely viewed as a quiet show of belief in the asset’s future.

The irony remains striking. The executive who once sold Ethereum at $1.05 is now watching XRP’s trajectory unfold in real time.

Will XRP Price Drop Below $1? Iran War Fears Put Altcoins on Edge

XRP Price

The post Will XRP Price Drop Below $1? Iran War Fears Put Altcoins on Edge appeared first on Coinpedia Fintech News

XRP price is under pressure again as global tensions tied to the Iran war weigh on crypto markets. The altcoin has already faced months of steady selling, and the latest U.S.-Israel attack on Iran has added uncertainty. 

While XRP price is still holding above the psychological $1 level, current data shows the downside risk has not disappeared. In February, XRP dropped 16.35%, marking its biggest monthly fall in the past year. The decline also extended its losing streak to five straight months since October 2025. 

So far in 2026, XRP is down 26.76%, which already exceeds its total loss for all of 2025. This shows the token has struggled to regain sustained buying interest.

XRP “Death Zone” and Liquidation Heatmap Levels

XRP Price Analysis

According to analyst Egrag Crypto, a possible “Death Zone” between $0.64 and $0.77. This range could come into play if selling pressure intensifies. 

XRP liquidation heatmap data shows heavy liquidity sitting near $1.30 and $1.25. These areas often attract price moves during volatile conditions because large clusters of positions tend to get cleared there.

XRP On Chain Data

The analyst noted that XRP must reclaim $1.40 with strong volume to weaken the current bearish structure.

World War 3 Fears Impact XRP Price

Rising tensions in the Middle East, widely discussed under World War 3 risk fears and the ongoing Iran conflict narrative, have already triggered sharp but brief reactions across crypto.

Bitcoin price recently dipped near $63,000 before recovering toward the $67,000–$68,000 area. During the same period, XRP saw a roughly a 7% sell-off and has been trading around the $1.29 to $1.35 range.

Here’s Where Ripple’s XRP Price Can Move Next

With the ongoing Iran attacks, oil prices remain high but stable, and stock markets are volatile without a major crash. In this environment, Bitcoin usually performs better, while altcoins like XRP tend to move more sharply. XRP may continue trading sideways with occasional dips unless overall market liquidity improves.

In a more bearish scenario, if the conflict continues, especially if the Strait of Hormuz is disrupted, Bitcoin could see sharp single-day declines, while altcoins typically fall even more. In such conditions, XRP could retest the $1 level, and in a deeper sell-off, it could move toward around $0.85.

There is also a recovery scenario. If tensions ease and the conflict ends quickly, crypto markets often drop first and then recover. Market confidence could return within weeks, shifting focus back to ETF flows, regulation, and broader market factors.

FAQs

Why is XRP price falling today?

XRP is under pressure due to Iran war tensions and weak market liquidity, extending months of selling and keeping downside risk elevated.

Can XRP fall below $1 again?

Yes, if global tensions rise or Bitcoin drops sharply, XRP could retest $1 and potentially slide toward $0.85 in a deeper sell-off.

What levels must XRP break to turn bullish?

XRP needs a strong move above $1.40 with high volume to weaken the current bearish trend and restore buyer confidence.

How do global conflicts affect XRP price?

Geopolitical shocks reduce risk appetite, pushing investors toward safer assets. Altcoins like XRP often fall harder than Bitcoin.


Bitcoin Drops Below $66,000

Bitcoin Drops Below $66,000

The post Bitcoin Drops Below $66,000 appeared first on Coinpedia Fintech News

Bitcoin fell as low as $65,575 on Monday after reports of an attack on a major Middle East oil facility triggered fear in global markets and a risk-off move that also dragged S&P 500 futures down 1.4%. The cryptocurrency is down about 2% in 24 hours, with roughly 46% of circulating BTC held at a loss and the Fear & Greed Index at an extreme 10, while traders track key support levels between $58,000 and $64,000 amid heightened volatility.

3 Crypto To Watch Amid The US-Israel Iran War 

3 Crypto To Watch Amid The US-Israel Iran War

The post 3 Crypto To Watch Amid The US-Israel Iran War  appeared first on Coinpedia Fintech News

It’s now open to the world that war is on the table, and geopolitics is in a deep mess now. The US-Israel and Iran war shows that Unpredictable movements, impactful losses, and trade limitations are directly impacting global stock markets and crypto prices.

In the chaos of Volatility, there are 3 types of cryptos you can watch to keep your portfolio adjusted. 

Bitcoin: Controlled Volatility 

Despite all the liquidations, the negative fundamentals, and Long/Short Sell-offs, Bitcoin has maintained a Dominance above 50% for a long time now. The recent war news did not break its support at $62,000 in the last week of War tension.
As the conflict grows among Middle East countries, Western countries, its economical hush can also be seen on asia and European trades. Bitcoin, after Gold stands as a sole asset for trade and payments. 

At the time of writing, Bitcoin hovers near the strong support zone of ​​ $65,700, trading at $66,057.

Bitcoin price has broken out of a bearish channel and is showing signs of a bullish market structure shift. Price is currently testing a strong demand zone around $63K, which could trigger a move toward $65.6K–$67.5K if buyers step in. 

Bitcoin Analysis
Bitcoin Analysis

However, a breakdown below $62.8K would invalidate the bullish outlook and signal further downside

Tokenized Gold Tokens

Trading at $5300 per ounce, Gold Prices are now up 100% since last year. Gold in 2025 has raised its bars of safe-heaven investment, except for the Feb 2026 beginning’s unprecedented drop, it is mostly up. In the war situation, 

Tokenized Gold assets like Paxos’ PAX Gold (PAXG) and Tether’s Tether Gold (XAUT ) that hold similar market cap and security are alternative Gold assets.

These blockchain-backed, collateralized Gold assets can be traded in off-traditional hours. In war situations, Gold and Silver represent security and are poised to spike. 

Privacy Focused Coins 

In war-like situations, we have seen data representing assets and privacy assets show up on demand.  Cryptocurrencies like Zcash (ZEC) , Monero (XMR), Litecoins (LTC), and DASH coin. If we see through, ZEC Coin is down 33% in the month, but up by 434% in the yearly frame.

Zcash is saying “buy the dip.”

ZCASH/USDT after the breakout has printed a change of character, confirming its momentum has changed from bearish to bullish. Right now, the price is moving towards the key demand zone ($203 –  $208 ) where buyers usually enter.


If price holds this approach, Zcash will cross the higher resistance targets.

Now, if price respects this support and shows strong buying momentum, we can expect a move toward the $219 resistance level, followed by a potential push toward the $231 zone. However, if the price breaks below the demand zone and loses support, the bullish setup becomes invalid, and further downside could follow.

The other assets seem not to be performing well, but under careful watch and war situations, they can become Volatile or spike unexpectedly.

South Africa Activates Crypto Tax Transparency Under CARF, Capital Gains Tax Rules in Focus

$566M Bitcoin Escape_ South Africa’s Crypto Laws Just Got Exposed!

The post South Africa Activates Crypto Tax Transparency Under CARF, Capital Gains Tax Rules in Focus appeared first on Coinpedia Fintech News

South Africa has activated the Crypto-Asset Reporting Framework (CARF), bringing crypto holdings and offshore accounts under global tax transparency rules. The move signals tighter monitoring of cross-border crypto flows, as authorities prepare for automatic financial data sharing between participating countries.

South Africa Activates CARF to Track Crypto Holdings

In a recent post, the South African Revenue Service said it will start using the Crypto-Asset Reporting Framework (CARF). This is a global system made to improve tax rules for digital assets. 

Under this rule, crypto exchanges and financial companies must share details about users’ holdings and cross-border transactions with tax officials.

Authorities introduced CARF to stop people from hiding crypto assets in other countries. It allows countries to share financial data automatically. This means South Africans who hold crypto overseas may now have to report it and pay tax.

Parliament Reviews Fiscal Framework and Revenue Proposals

The announcement comes as South Africa’s Parliament enters an important stage of its budget process. The Select Committee on Finance is reviewing the country’s income and spending plans after Finance Minister Enoch Godongwana presented the national budget.

The coming 12 days are critical. The Fiscal Framework is the foundation upon which the entire budget architecture rests. We call upon all South Africans — especially those in rural and underrepresented provinces — to participate actively in our processes. As Chairperson of the…

— Parliament of RSA (@ParliamentofRSA) March 2, 2026

Lawmakers said public input is important in shaping the budget. The budget explains how much money the government expects to collect, how much it plans to spend, and how much it may borrow.

Officials also said that decisions made at the national level directly affect provinces, districts, and local municipalities.

South Africa Crypto Tax: Capital Gains Tax Up to 40%

Under the current tax framework, crypto profits in South Africa are subject to Capital Gains Tax (CGT). The tax system includes 40% of capital gains in an individual’s taxable income.

Depending on a taxpayer’s income bracket, this can result in an effective Capital Gains Tax rate of up to 18%. 

With CARF now active, tax authorities will have stronger visibility into crypto transactions, making compliance more critical for investors.

With this step, South Africa joins other countries working with the OECD to create clear crypto tax rules and reduce tax gaps in the growing digital asset market.

War Tensions Shake Crypto, But These Altcoins Could Move Next

Altcoin launches and airdrops March 2026

The post War Tensions Shake Crypto, But These Altcoins Could Move Next appeared first on Coinpedia Fintech News

Global markets are falling again. Escalating war tensions have pushed investors toward safer assets, resulting in sharp swings across equities, commodities, and crypto. Bitcoin has felt the pressure, slipping below important support levels in recent sessions before managing to steady itself.

However, several altcoin ecosystems are moving ahead with launches, incentives and token events that could drive short-term activity regardless of the broader uncertainty.

Here’s what’s on the radar.

Starknet Brings New Utility to Bitcoin

Starknet is preparing to roll out strkBTC, a Bitcoin-backed token that includes built-in privacy features.

Their goal is to expand Bitcoin’s role inside decentralized finance. Instead of simply holding BTC, users could deploy it across lending, trading and other DeFi strategies within a Layer 2 environment.

Avalanche Launches $40 Million Incentive Program

Avalanche will kick off a $40 million incentive campaign on March 2.

Programs of this size typically aim to attract developers and liquidity providers. In the short term, that often translates into higher on-chain activity and a bump in total value locked. Whether that growth sticks depends on how much real usage follows once rewards taper off.

Polygon Cuts Gas Costs for Payments

Polygon plans to begin subsidizing agent-to-agent gas fees for payments starting March 4.

Lower transaction costs could make Polygon more appealing for payment-focused applications and everyday transfers. In competitive Layer 2 markets, fee reductions often cause bursts of activity.

DeFi Vaults, TGEs, and Airdrops

Elsewhere in DeFi, Theo Network is introducing a pre-deposit vault for thUSD, a yield-bearing stablecoin backed by delta-neutral gold strategies. The model blends crypto infrastructure with commodity exposure, reflecting continued experimentation in how yield products are structured.

Several token events are also expected in the coming days:

  • Paradex’s DIME token generation event is anticipated soon.
  • Opinion (OPN) is rumored to launch its token in early March.
  • Resolv will open Season 4 airdrop claims on March 5.
  • Avantis plans to release its second airdrop the same day.

Rotation Rather Than Breakout?

With geopolitical tensions unresolved, this week may favor sector-specific rotation rather than a full-scale breakout.

If Bitcoin stabilizes and macro data does not deteriorate further, capital could flow selectively into ecosystems offering fresh incentives, token launches, or new utility narratives.

Never Miss a Beat in the Crypto World!

Stay ahead with breaking news, expert analysis, and real-time updates on the latest trends in Bitcoin, altcoins, DeFi, NFTs, and more.

FAQs

Why do global conflicts cause volatility in crypto markets?

Geopolitical tensions push investors toward cash, gold, or bonds. Crypto trades 24/7, so it often reacts first, showing sharper and faster price swings.

How do crypto incentive programs affect token prices?

Large reward programs can temporarily boost liquidity and on-chain activity. Prices may rise short term, but lasting impact depends on real user adoption.

How do airdrops influence crypto ecosystems?

Airdrops reward early users and attract attention. They can increase wallet activity and community growth, but long-term value depends on project fundamentals.

BXB Market Review 2026: Is This Broker a Reliable Choice for Traders?

bxb-market (1)

The post BXB Market Review 2026: Is This Broker a Reliable Choice for Traders? appeared first on Coinpedia Fintech News

This review of BXB Market follows a structured assessment approach used in the global trading industry. It evaluates the broker’s regulatory status, platform features, account structure, and overall trading environment. The objective is to highlight the strengths and limitations so readers can judge whether BXB Market fits their trading expectations.

Quick Snapshot

  • Minimum deposit: $1
  • Maximum leverage: 1:200
  • Regulation: MISA (Comoros)
  • Trading platform: WebTrader (TradingView-powered)
  • Official website: www.bxbmarket.com

What Is BXB Market?

BXB Market is an international CFD brokerage Trading Market offering access to forex, stocks, commodities, indices, metals, and cryptocurrencies. The platform focuses on simplicity, fast onboarding, and a streamlined interface designed for beginner and intermediate traders.

BXB Market is an online brokerage platform offering multi-asset CFD trading through a browser-based WebTrader interface. The company positions itself as a simplified, beginner-friendly option with a very low entry requirement (minimum deposit of $1), while still providing advanced charting capabilities powered by TradingView.

The broker’s services cover a mix of global financial instruments, and its infrastructure is built around accessibility — clients can open an account, fund it, and start trading entirely through a web interface without needing to download specialized software.

Key characteristics include:

  • A proprietary WebTrader platform with TradingView charting support
  • Multi-region customer service
  • A $1 entry barrier
  • Tiered account structure suitable for different trader profiles
  • Emphasis on secure fund handling and simple account management

The overall positioning is that of an accessible, user-centric broker with straightforward trading tools.

Regulation & Legal Framework

BXB Market operates under the supervision of MISA (Mohéli International Services Authority) within the Union of Comoros.

What this means for traders:

  • The broker is legally licensed and authorized to operate
  • MISA is a mid-tier regulator, not equivalent to FCA, ASIC, or CySEC
  • The regulatory oversight ensures operational transparency but offers limited investor protection mechanisms
  • The operating entity is Dynamix Ltd, registered in Comoros

This regulatory structure is acceptable for many retail traders but may not meet the requirements of those seeking top-tier regulation.

What Can You Trade with BXB Market?

BXB Market provides access to CFDs across major global markets, offering exposure to several asset classes without requiring direct ownership of the underlying instruments.

Based on publicly available information and cross-referenced data from similar MISA-licensed brokers, the platform typically supports:

  • Forex pairs (majors, minors, selected exotics)
  • Cryptocurrencies (major assets like BTC, ETH, LTC, plus selected altcoins)
  • Commodities (oil, gold, silver, energy assets)
  • Indices (global benchmarks including US, EU, and Asian markets)
  • Stocks/Equities (CFD access to multinational companies)
  • Metals (gold, silver, sometimes platinum or copper CFDs)

BXB has not publicly listed the exact number of instruments, but the general structure aligns with diversified CFD brokers targeting retail clients.

Trading Platforms

WebTrader

BXB Market’s WebTrader is powered by TradingView technology, offering:

  • Real-time market data
  • Multiple technical indicators
  • Basic drawing tools
  • One-click order execution
  • Watchlist creation
  • Clean, browser-based interface
  • Cross-device synchronization

Overall, it sits in the moderately advanced category — more capable than many basic web platforms but not as customizable as MT4, MT5, or cTrader.

Mobile App

The mobile application provides:

  • Full account access
  • Real-time trade execution
  • Price alerts and notifications
  • An intuitive layout for trading on the move

The app is functional and practical for monitoring and executing trades away from the desktop.

Account Types

BXB Market offers three main live trading accounts, along with a demo option.

Silver Account

  • Standard spreads
  • No swap discount
  • Leverage up to 1:200
  • Minimum lot size: 0.01
  • Stop-out level: 5%
  • Designed for entry-level traders

Gold Account

  • Spread discounts compared to Silver
  • Reduced swap costs
  • Leverage up to 1:200
    Minimum lot size: 0.01
  • Stop-out level: 5%
  • Suitable for traders seeking better pricing

Platinum Account

  • Highest spread and swap discounts
  • Leverage up to 1:200
  • Minimum lot size: 0.01
    Stop-out level: 5%
  • Includes VIP-style trading conditions for high-activity traders

Other Account Options

  • Demo account for practice

Deposits & Withdrawals

BXB Market supports a wide set of global payment options. From the screenshots provided, available methods include:

  • VISA
  • Mastercard
  • Maestro
  • VISA Debit
  • PayPal
  • Apple Pay
  • Google Pay
  • Skrill
  • Neteller
  • AstroPay
  • Kuady

Additional notes:

  • Deposits are generally instant for card and wallet channels
  • Withdrawal speeds are not clearly stated on the website
  • No public information on withdrawal fees
  • No confirmation of crypto deposits or withdrawals

Traders may need to register an account to get exact processing times and limits.

Customer Support

BXB Market provides multi-regional customer assistance through:

  • Email: Support@bxbmarket.com
    Live chat on the website
  • Phone support in:
    • United Kingdom
    • Japan
    • India

The presence of local phone lines adds credibility and accessibility for traders in those regions.

Is BXB Market a Scam?

Based on available information:

  • BXB Market is not a scam
  • It is a registered and licensed brokerage operating under MISA
  • It provides transparent account tiers, multiple payment methods, and functional trading platforms
  • Customer support channels are active and verifiable

However:

  • It operates under a mid-tier regulator, meaning investor protection is more limited than with top-tier bodies
  • Public information on fees, spreads, and withdrawal conditions is not fully detailed

Traders should proceed with the usual level of due diligence expected from any offshore-regulated broker.

Pros of BXB Market

  • Regulated under MISA
  • $1 minimum deposit
  • TradingView-powered WebTrader
  • Wide range of payment methods
  • Clean and intuitive interface
  • Multiple account types
  • Useful mobile trading app
  • Multi-region customer support

Cons of BXB Market

  • No publicly listed fee or withdrawal policy
  • Instrument list not disclosed in detail
  • Crypto funding/withdrawal options unclear
  • Regulated under a mid-tier authority, not a top-tier one

Final Verdict

BXB Market is a practical, beginner-friendly trading broker with a modern interface, flexible payment options, and a straightforward account structure. It provides the essential tools most retail traders look for, especially those who prefer TradingView-style charting and low barriers to entry.

That said, traders who prioritize strict regulation, detailed transparency, or advanced professional tools may find the platform somewhat limited.

For newcomers and intermediate traders looking for a simple, well-organized, low-threshold trading experience, BXB Market is a reasonable option — provided they understand the regulatory context and confirm withdrawal conditions firsthand.

Ethereum News: Crypto Whale Loses $74M Longing ETH, Left With Just $8.5K on Hyperliquid

Ethereum News Crypto Whale Loses $74M Longing ETH, Left With Just $8.5K on Hyperliquid

The post Ethereum News: Crypto Whale Loses $74M Longing ETH, Left With Just $8.5K on Hyperliquid appeared first on Coinpedia Fintech News

Six months ago, crypto whale Machi Big Brother started leveraging long on Ethereum when ETH traded near $4,700. Today, on-chain intelligence firm Arkham flagged what’s left of that bet: just $8,500 in his Hyperliquid account.

MACHI BIG BROTHER HAS $10K LEFT

In the last 6 months Machi Big Brother has lost $74 Million – attempting to leverage long ETH since September, when ETH was at $4.7K.

He now has $8.5K left in his HL account. It appears that he is almost out of money. pic.twitter.com/mpp9GX012n

— Arkham (@arkham) March 2, 2026

The trader, whose real name is Jeffrey Huang, has been liquidated over 145 times on Hyperliquid since October 2025, repeatedly opening 25x leveraged long positions on Ethereum and re-entering after each wipeout. On-chain data shows he even tapped PleasrDAO treasury funds deposited five years ago to cover margin on recent positions.

Five months ago, Arkham estimated his net worth was close to nine figures.

From Hip-Hop Star to Crypto’s Most Watched

Huang is no stranger to controversy. The Taiwanese-American former musician rose to fame with hip-hop group L.A. Boyz in the 1990s before entering crypto in 2017. He founded Mithril, which collapsed roughly 80% within months.

He was involved with Formosa Financial, where 22,000 ETH later went missing. He forked Compound to create Cream Finance, which suffered exploits totaling over $192 million. On-chain investigator ZachXBT accused him of embezzlement in 2022. Huang responded with a defamation lawsuit.

Despite all of it, he kept trading.

Ethereum Price: What Should You Watch?

ETH trades at $1,955, still well below its daily 50-day and 200-day moving averages. The daily RSI reads 41.4, below neutral, while the MACD sits deep in sell territory at -139.35.

The daily summary reads Sell, with weekly and monthly both flashing Strong Sell.

According to Coinglass, ETH is down 54.80% over the past 180 days and 30.20% over 90 days.

Geopolitical risk and sticky inflation, with the Core PPI rising 0.8% month-over-month, have reduced expectations for Fed rate cuts, keeping risk appetite low across crypto markets.

What Analysts Expect for ETH This Week

Analysts project a trading range of $1,770 to $2,160 for the coming week. The probability of a sustained rally remains below 20%.

Viktoras Karapetjanc of Traders Union noted, “If Ethereum can hold above immediate support and sentiment shifts, a move towards $2,160 is still on the table this week.”

A breakout above $2,021 would be the first signal of relief. Without it, the same conditions that wiped out one of crypto’s biggest whales remain firmly in place.

Never Miss a Beat in the Crypto World!

Stay ahead with breaking news, expert analysis, and real-time updates on the latest trends in Bitcoin, altcoins, DeFi, NFTs, and more.

FAQs

Why is Ethereum price down today?

Ethereum is under pressure from geopolitical risk, sticky inflation data, and reduced rate cut hopes, weakening demand for risk assets.

 Is Ethereum a buy, sell, or hold right now?

Technical indicators currently show a “Sell” signal, with ETH trading below key moving averages and momentum remaining negative.

What is the Ethereum price prediction for this week?

Analysts expect ETH to trade between $1,770 and $2,160 this week, with a sustained rally currently having less than a 20% probability.

Bitcoin Consolidates Between $62K and $71K: Accumulation or Range Trap Before the Next Move?

Bitcoin Price Today

The post Bitcoin Consolidates Between $62K and $71K: Accumulation or Range Trap Before the Next Move? appeared first on Coinpedia Fintech News

Bitcoin price continues to trade within a predefined range in the short and long term following a sharp decline in mid-February. The crypto is oscillating between a well-established support zone near $62,000 and a resistance band around $70,500 and $71,500. This consolidation phase reflects compression rather than directional conviction, with early signs of higher lows forming inside the range. 

Therefore, it would be interesting to watch whether the BTC price will trigger a decisive breakout, which could confirm whether the crypto is transitioning into accumulation or preparing for another liquidity sweep. 

Are Buyers Quietly Building Positions?

The star crypto appears to be in the early phase of accumulation as the rally has begun to form higher lows within the range. After bouncing from the local lows around $62,000, the pullbacks have been shallower. Moreover, the price is strongly holding above $64,000 and $65,000 on recent dips, instead of revisiting the bottom of the range. This shift suggests buyers may be stepping in earlier. 

Volume suggests the initial sell-off from $79,000 came with heavy participation. While the bounce that followed was solid but not explosive. On the other hand, the liquidity is resting on both of the current ranges. In an environment like this, it’s common to see one side swept before the real move begins. 

btc price

As seen in the above chart, the crypto is trading between a significant demand and supply zone and currently, the BTC price is not choosing a direction but compressing between a defined range. Therefore, a strong close beyond any of the range could define the next price action as a close above $71,500 with an expanding volume, which would shift the short-term momentum with the upside targets over $74,000 extending to $78,000. 

Conversely, a failure to hold $64,000 followed by a breakdown below $62,000 would invalidate the accumulation. In this case, the lower target could be $60,000 or slightly lower. 

Bitcoin Price Prediction for the Short Term

The Bitcoin price is not trending, but it is compressing. Compressing phases often precede volatility expansion, but direction requires confirmation. As long as BTC trades between $62,000 and $71,000, conditions favor rotational price action. Therefore, the next few hours are likely to determine the momentum for the coming week. Until then, the BTC price structure remains balanced and reactive rather than directional. 

FAQs

Is Bitcoin price showing signs of recovery?

Yes. Higher lows and strong defense of $64K–$65K suggest early recovery, but a breakout above $71.5K is needed for confirmation.

What confirms a full Bitcoin price recovery?

A decisive close above $71,500 with strong volume would confirm recovery and signal upside continuation.

What is the downside prediction if support fails?

If BTC loses $64,000 and breaks below $62,000, price may drop toward $60,000 or slightly lower.

How long could Bitcoin remain in this recovery range?

Bitcoin may continue consolidating between $62K and $71K until a volume-backed breakout triggers volatility expansion.

Bitcoin Price at Risk as Oil Jumps 13% After U.S.–Israel Strikes Iran

Bitcoin Price at Risk as Oil Jumps 13% After U.S.–Israel Strikes Iran

The post Bitcoin Price at Risk as Oil Jumps 13% After U.S.–Israel Strikes Iran appeared first on Coinpedia Fintech News

Global oil prices jumped 13% after U.S. and Israeli strikes on Iran, which reportedly killed Iran’s Supreme Leader, Ayatollah Ali Khamenei. In response, Iran moved to block the Strait of Hormuz, a key route that carries 20% to 30% of the world’s oil supply. Experts warn that if this route remains closed for a week, crude oil prices could rise even higher, which may indirectly put pressure on the Bitcoin price.

Oil Price Spike 13% After U.S-Israel and Iran Conflict

After the strike on Iran, global oil markets reacted very fast. Iran’s decision to block the Strait of Hormuz raised strong fears about oil supply. Brent crude quickly jumped to $82.37 per barrel, its highest level since January 2025.

When oil prices rise, inflation also goes up. This reduces spending and tightens money in the market. During such times, investors often sell risk assets like stocks and cryptocurrencies. 

💥BREAKING:

Oil prices surge by 13% pic.twitter.com/1E6Nub86r1

— Crypto Rover (@cryptorover) March 1, 2026

Financial analysts at Citi said oil prices could rise further if the conflict continues. They expect Brent crude to trade between $80 and $90 per barrel in the coming days.

Oil Tankers Attacked Near Strait of Hormuz

Several oil tankers were hit by missiles near the Strait of Hormuz on Sunday. This narrow sea route handles nearly one-fifth of the world’s oil shipments. Reports also confirmed that missile strikes on oil tankers near the strait killed one crew member. 

As tensions grew, more than 200 ships, including oil and gas tankers, stopped and remained anchored in nearby waters.

Even Maersk, the world’s second-largest shipping company, also paused its shipments through the Strait of Hormuz due to the ongoing U.S.–Israel and Iran conflict.

Will Bitcoin price fall if Oil Prices Continue Rising?

Bitcoin has already reacted to the geopolitical shock. On February 28, after the first U.S.-Israel strike on Iran, Bitcoin dropped from $68,000 to near $63,000, losing about 8% in a single day.

Meanwhile, crypto analysts has warn that if the conflict continues for more than a week, Bitcoin price could fall below the key $60,000 level or more. 

On the flip side, popular trader Captain Faibik said that if Bitcoin reclaims the $72,000 resistance level, a rally toward $82,000–$83,000 in March is possible.

$BTC #Bitcoin Big move is expected..🔜

imo, we might see a bear trap from here first then Bounce Back.. 📈

If the Bulls manage to Reclaim the 72k Resistance, we could see a Bullish Rally toward 82–83k in March. 🚀📈 pic.twitter.com/gb4mN16Dxa

— Captain Faibik 🐺 (@CryptoFaibik) March 1, 2026
Never Miss a Beat in the Crypto World!

Stay ahead with breaking news, expert analysis, and real-time updates on the latest trends in Bitcoin, altcoins, DeFi, NFTs, and more.

FAQs

Why did oil prices surge after the U.S.–Israel strikes on Iran?

Oil jumped 13% as fears grew over supply disruptions after Iran moved to block the Strait of Hormuz.

How does rising oil price affect Bitcoin?

Higher oil can lift inflation and reduce risk appetite, leading investors to sell volatile assets like Bitcoin.

What could trigger a Bitcoin rebound despite the conflict?

If Bitcoin reclaims key resistance near $72,000, traders see potential for a rally toward $82,000–$83,000.

South Korea Reviews Seized Crypto After Major Errors

South Korea Reviews Seized Crypto After Major Errors

The post South Korea Reviews Seized Crypto After Major Errors appeared first on Coinpedia Fintech News

South Korea’s government has launched a high-level review of how seized digital assets are managed after two major mishaps exposed serious weaknesses. In 2022, police in Seoul’s Gangnam District lost track of 22 bitcoins, and crypto exchange Bithumb accidentally credited a user with $40 billion in bitcoin due to a technical error. Deputy Prime Minister and Finance Minister Goo Yun-cheol said tighter controls and improved security are needed, though officials have not yet outlined specific steps to prevent future losses.

Silver and Bitcoin to Blast off, says Robert Kiyosaki

Gold price surge amid geopolitical tensions

The post Silver and Bitcoin to Blast off, says Robert Kiyosaki appeared first on Coinpedia Fintech News

Gold price surged $128 in a single day, opening with a strong bullish gap as geopolitical tensions fueled safe-haven demand. Analysts note the metal respected a key bullish order block and delivered strong upside momentum, keeping the near-term structure positive. Robert Kiyosaki suggests the move could spill over into assets like silver and Bitcoin. However, traders warn that sharp rallies often bring volatility, making macro signals and follow-through price action crucial to watch.

Crypto’s Next Rally May Depend on One Vote in Washington

Crypto’s Next Rally May Depend on One Vote in Washington

The post Crypto’s Next Rally May Depend on One Vote in Washington appeared first on Coinpedia Fintech News

Crypto markets remain fragile, but a potential regulatory breakthrough in the United States may change the tone in the second half of the year. Bitcoin remains range-bound in the mid-$60,000 area, while Ether continues to underperform near $2,000. Trading volumes have thinned, volatility has compressed, and investor conviction appears weak.

Analysts at JPMorgan Chase believe U.S. crypto market structure legislation could be approved by mid-year, and if passed, it may serve as a meaningful catalyst for digital assets.

Here’s what’s developing and why it matters for the broader market.

Regulatory Clarity Could Reset Sentiment

According to a report led by Nikolaos Panigirtzoglou, the proposed Digital Asset Market Structure CLARITY Act could reshape how crypto is regulated in the U.S. The House has already advanced the bill, while Senate discussions continue.

If approved, the legislation would establish clearer boundaries between the U.S. Securities and Exchange Commission and the Commodity Futures Trading Commission, defining which tokens qualify as securities and which fall under commodity oversight.

For years, uncertainty around this distinction has weighed on the industry. JPMorgan argues that ending “regulation by enforcement” could unlock institutional participation and reduce compliance risks that have kept large investors cautious.

Structural Changes for the Industry

Beyond classification clarity, the bill proposes new frameworks for token issuance, custody, and market infrastructure. It introduces a transition path for certain tokens to move from a securities status to a commodities status if they become sufficiently decentralized.

The proposal also includes a “grandfather clause” allowing certain tokens linked to spot exchange-traded funds to be treated as commodities under CFTC oversight. In addition, new crypto projects could raise to $75 million annually without full SEC registration, provided disclosure requirements are met.

JPMorgan believes these measures could ease compliance burdens, revive onshore issuance, and encourage venture activity that has increasingly shifted overseas.

Key Sticking Points Remain

Despite optimism, negotiations are not complete. Debate continues over whether stablecoin issuers should be allowed to offer yield, a move banks argue could draw deposits away from traditional institutions. Conflict-of-interest provisions related to government officials are also under discussion.

While these issues remain unresolved, JPMorgan suggests compromise is possible before mid-year.

Second-Half Catalyst?

Crypto sentiment has weakened in recent months, with assets like Bitcoin struggling to maintain momentum. However, JPMorgan maintains a constructive outlook, recently reiterating a long-term Bitcoin price target of $266,000 based on volatility-adjusted comparisons to gold.

In the near term, markets may remain cautious. But if the legislation is approved by mid-year, analysts believe it could provide the regulatory certainty needed to shift flows back into digital assets.

Much like past turning points in crypto, clarity, rather than hype, may determine the next major move.

Never Miss a Beat in the Crypto World!

Stay ahead with breaking news, expert analysis, and real-time updates on the latest trends in Bitcoin, altcoins, DeFi, NFTs, and more.

FAQs

What is the Digital Asset Market Structure CLARITY Act?

It’s a proposed U.S. crypto bill that defines which tokens are securities or commodities and clarifies SEC and CFTC oversight rules.

How could U.S. crypto legislation affect Bitcoin and Ether?

Clear rules may boost investor confidence, attract institutional capital, and reduce legal risk, potentially supporting prices.

Why does regulatory clarity matter for crypto markets?

Unclear rules raise compliance costs and legal risk. Clear guidelines help exchanges, issuers, and investors operate with confidence.

Could this legislation become a second-half catalyst for crypto?

If passed, it may shift sentiment, improve capital flows, and mark a turning point for U.S.-based digital asset growth.

HYPE Price to $150? Arthur Hayes Sparks Fresh Rally Talk Around Hyperliquid

HYPE Price to $150 Arthur Hayes Sparks Fresh Rally Talk Around Hyperliquid

The post HYPE Price to $150? Arthur Hayes Sparks Fresh Rally Talk Around Hyperliquid appeared first on Coinpedia Fintech News

Amid broader market headwinds and persistent volatility across crypto, bold bullish calls are becoming rare. But one high-profile analyst is leaning the other way. Arthur Hayes has sparked fresh rally talk around Hyperliquid (HYPE), suggesting that HYPE price could surge toward $150, nearly a 5x move from current levels. At a time when risk appetite remains fragile, such a projection has quickly reignited debate across the derivatives and on-chain community.

Is this optimism premature, or is Hyperliquid quietly setting up for its next breakout? Let’s take a closer look.

Arthur Hayes’ Bullish Narrative on HYPE

Hayes believes HYPE price remains in “price discovery,” implying that the market has not yet established a clear long-term ceiling. According to his thesis, the protocol’s rapid growth in perpetual trading volume and ecosystem traction could justify a significantly higher valuation.

🚨 BREAKING

ARTHUR HAYES SAYS $HYPE TO $150

Arthur Hayes believes Hyperliquid’s $HYPE could surge from ~$30 to $150 — nearly a 5x move — as he says the token is still in “price discovery.”

However, on-chain data shows he has reduced part of his position earlier.👀

What’s… pic.twitter.com/hOYhJDjU8Y

— Whale Degen (@hiwhaledegen) March 2, 2026

His $150 projection would represent a substantial expansion from current levels near $31–$32, positioning HYPE among the strongest-performing exchange-native tokens if realized.

However, on-chain observers have noted that Hayes previously reduced part of his exposure, adding nuance to the narrative. While his macro thesis remains bullish, positioning adjustments suggest tactical risk management rather than blind conviction. Still, the call has injected fresh momentum into market sentiment.

HYPE Price Analysis: Falling Wedge Breakout in Play

HYPE token appears to be emerging from a prolonged corrective structure. HYPE’s daily chart shows:

  • A multi-month falling wedge pattern is typically considered a bullish reversal structure.
  • Price recently broke above the upper wedge resistance.
  • HYPE is now attempting to reclaim the 200-day EMA, currently near the $32 zone.
HYPE price analysis

A sustained close above the 200-day EMA would confirm structural strength and potentially trigger momentum inflows. The next key resistance zone sits around $40–$42, followed by a broader supply area near $50.

Notably, the chart projection suggests a possible move toward $50 in the medium term, aligning with the initial breakout measured move. If that level clears decisively, price expansion could accelerate. On the downside, key support rests near:

  • $29–$30 (breakout retest zone)
  • $25 (major structural support)

As long as HYPE holds above wedge support, bulls retain control.

Futures Market Outlook: Hyperliquid’s Positioning Remains Constructive

Beyond price action, derivatives data offers additional insight. Recent metrics show:

  • Long/Short Trader Ratio: 1.65
  • Long Traders: 30,369
  • Short Traders: 18,610
HYPE futures data

Funding dynamics indicate elevated short-side pressure relative to longs.

A long/short ratio above 1 signals that more traders are positioned long than short, suggesting constructive sentiment. However, the presence of significant short-side funding implies potential for a short squeeze scenario if price momentum accelerates. If HYPE decisively clears the 200-day EMA and pushes toward $40, forced short covering could amplify upside volatility. This aligns with the technical breakout narrative.

Final Words

While the broader crypto market remains cautious, Hyperliquid is showing early signs of structural recovery. Arthur Hayes’ $150 target may appear ambitious, but the technical setup and futures positioning indicate that HYPE is not structurally weak. The first real confirmation comes above $32. The next acceleration likely unfolds above $40, and if $50 clears with conviction, the narrative shifts decisively bullish.

FAQs

Is HYPE showing signs of recovery right now?

Yes. The falling wedge breakout and attempts to reclaim the 200-day EMA suggest early-stage recovery.

What confirms a full recovery in HYPE price?

A strong close above $32 followed by acceptance above $40 would confirm structural recovery and trend continuation.

Could a short squeeze push HYPE price higher?

Yes. If price breaks resistance, forced short covering could accelerate upside volatility.

What risks could invalidate the bullish recovery setup?

A breakdown below $29 or repeated rejection at the 200-day EMA would weaken momentum and delay upside targets.

CLARITY Act Could Pass by Mid-Year, Say JPMorgan, Ripple & Coinbase CEO

Stablecoin rewards White House

The post CLARITY Act Could Pass by Mid-Year, Say JPMorgan, Ripple & Coinbase CEO appeared first on Coinpedia Fintech News

Crypto market could see bullish upside as the proposed U.S. crypto market structure bill, known as the CLARITY Act, moves closer to approval. Banking giant JPMorgan, Ripple CEO Brad Garlinghouse, and Coinbase CEO Brian Armstrong believe the bill may pass by mid-year, a move that could reduce uncertainty and attract strong institutional investment into crypto.

CLARITY Act May End “Regulation by Enforcement”

The CLARITY Act aims to create a clear legal framework for digital assets in the United States. Its main goal is to clearly divide authority between the SEC and the CFTC. 

If passed, the bill could bring more certainty to the industry and unlock large amounts of institutional money from pension funds and corporate treasuries that have stayed on the sidelines due to unclear rules.

The bill may also include a grandfather clause. This could allow tokens like XRP, Solana, Litecoin, Hedera, Dogecoin, and Chainlink to operate under lighter CFTC rules, easing regulatory pressure.

Many believe this could finally end “regulation by enforcement,” where companies face legal action without clear guidelines.

CLARITY Act Could Pass by April 2026

According to a recent JPMorgan report, the bill could pass by mid-year and become a strong driver for the crypto market in the second half of the year. Meanwhile, clear rules may help grow tokenization, enable more institutions to offer crypto custody, and accelerate the adoption of blockchain-based financial products.

Several industry leaders believe the bill has a strong chance of passing soon. Ripple CEO Brad Garlinghouse has said in an interview that there is an 80% to 90% probability that Congress could approve the legislation by April.

Ripple CEO Brad Garlinghouse said he believes there is roughly an 80% likelihood that the CLARITY Act will pass Congress by April, signaling optimism about upcoming crypto legislation.

He emphasized that the bill could establish a clearer legal framework for digital asset… pic.twitter.com/nCgn581Hv0

— CryptoSensei (@Crypt0Senseii) February 19, 2026

Similarly, Coinbase CEO Brian Armstrong and U.S. Senator Bernie Moreno both signaled that the Clarity Act will pass hopefully by April. 

How Bitcoin Price Will React, If the Bill Passes

Industry experts believe the passage of the CLARITY Act could remove long-standing regulatory uncertainty, which has kept many large investors on the sidelines.

Interestingly, billionaire investor Kevin O’Leary has said he expects the bill to pass. He believes clear crypto rules could push Bitcoin toward $200,000 over time.

🚨 BREAKING

Billionaire Kevin O’Leary says the Clarity Act will pass and send Bitcoin to $200,000. pic.twitter.com/DM6au6GIKM

— BitPass (@aw1765958) March 2, 2026

Standard Chartered also has a very bullish view on this, predicting that Bitcoin could reach $150,000 by 2026, supported by rising ETF demand.

As of now, Bitcoin is trading near $66,580. The price has recovered nearly 3% after the recent drop caused by the U.S.–Israel strikes on Iran.

Never Miss a Beat in the Crypto World!

Stay ahead with breaking news, expert analysis, and real-time updates on the latest trends in Bitcoin, altcoins, DeFi, NFTs, and more.

Crypto News Today [Live] Updates : Bitcoin Price Crash, Aramco Refinery Saudi Arabia Attack, Iran War, Natanz Nuclear Facility Hit

Crypto News Today

The post Crypto News Today [Live] Updates : Bitcoin Price Crash, Aramco Refinery Saudi Arabia Attack, Iran War, Natanz Nuclear Facility Hit appeared first on Coinpedia Fintech News

March 2, 2026 11:03:20 UTC

Binance Open Interest Falls 25% as Traders Turn Cautious

Open interest on Binance has dropped roughly 25% since the start of the year, signaling broad deleveraging as macro and geopolitical risks rise. Data shows open interest declined from 130,800 BTC to 97,680 BTC, reflecting reduced appetite for risk. The Estimated Leverage Ratio also points to caution, with the weekly average falling to 0.146—its lowest since the April 2025 correction. Historically, dips below the 0.15 level have marked periods of heavy deleveraging.

March 2, 2026 08:43:07 UTC

Machi Big Brother Nearly Wiped Out After ETH Bets

Crypto trader Machi Big Brother has reportedly suffered massive losses after repeatedly leveraging long positions on Ethereum since September, when ETH traded near $4,700. Over the past six months, his losses have reached roughly $74 million. On-chain data indicates he now has only about $8.5K remaining in his Hyperliquid (HL) account, suggesting the high-risk strategy has nearly exhausted his trading capital.

March 2, 2026 08:24:52 UTC

Crypto Hack Losses Fall to Lowest Level Since March 2025

Crypto-related hacks and scams totaled $26.5 million in February, according to PeckShield. The figure represents a sharp 69.2% drop from January’s $86 million in losses. Only 15 security incidents were recorded during the month, signaling a quieter period for the sector. However, the data shows risk remains concentrated, with just two major exploits responsible for the majority of February’s total losses.

March 2, 2026 08:14:14 UTC

Gold, Silver Explode After Aramco Strike

Gold and silver prices are surging after Iran reportedly struck a Saudi Aramco oil refinery, boosting safe-haven demand. Gold has reclaimed the $5,400 level, rising 2.22% and adding roughly $1 trillion in market value over the past six hours. Silver also rallied strongly to $96, up 4.32% and gaining about $250 billion in the same period. Gold now sits just 3.20% away from a new all-time high, with markets closely watching for continued upside momentum.

March 2, 2026 08:05:17 UTC

Bitcoin Drawdown Still Mild Compared to Past Bear Markets

Despite a 47% drawdown on a daily closing basis, Bitcoin remains far from the extreme declines seen in earlier cycles. The deepest bear market occurred in 2012, when Bitcoin plunged more than 90%. Even so, some critics are already declaring Bitcoin “dead.” Historically, however, each bear cycle has shown slightly less severe drawdowns. If this long-term pattern continues, analysts suggest the current cycle could eventually see a decline in the 60%–70% range rather than the extreme losses of the past.

Bitcoin Bear Market Correction

March 2, 2026 08:03:06 UTC

Bitcoin Price Crash Below $66K as Middle East Tensions Weigh on Markets

Bitcoin pulled back from its Asian session highs, falling below $66,000 after briefly nearing $67,000. The decline came as risk sentiment weakened following reports that Iran stepped up attacks in the Middle East, including a strike on a Saudi oil refinery.U.S. stock futures also turned lower, with S&P 500 E-mini futures dropping 1.4% to 6,790 after earlier gains. Meanwhile, oil prices surged more than 7% globally, reflecting rising geopolitical risk and adding pressure to broader markets.

March 2, 2026 07:44:15 UTC

Gold Price Today Surge to $5,400

Gold prices have jumped back above $5,400 per ounce, marking a sharp rebound of about 23% over the past month. The rally accelerated Monday as heightened geopolitical tensions increased global economic uncertainty and boosted safe-haven demand. Analysts note that another 3.3% gain would push gold to a fresh all-time high. If prices manage to hold above the $5,400 level for the next three trading sessions, it could confirm the formation of a new upward trend channel and signal continued bullish momentum.

March 2, 2026 07:10:58 UTC

Bitcoin Liquidation Zones Signal Key Levels Ahead

Potential short liquidations above $69,000 for Bitcoin could help drive momentum toward another test of the $70,000 resistance level. However, if the price starts to move lower, a cluster of long liquidations sits near $62,500. Traders are watching these levels closely, as liquidation cascades on either side could accelerate the next major move in the market.

March 2, 2026 06:38:59 UTC

CertiK Flags Exploit Targeting Inverse Finance

Security firm CertiK has reported a new exploit involving Inverse Finance. According to the alert, the attacker used roughly $30 million in flash-loaned funds to manipulate the protocol’s sDOLA balance.The move allowed the exploiter to liquidate 27 users’ sDOLA-collateralized positions, generating an estimated profit of about $240,000. The incident highlights ongoing risks tied to flash-loan attacks in the DeFi ecosystem, with users urged to monitor developments closely.

#CertiKInsight 🚨

We have seen an exploit in https://t.co/LmGLXgIVj1

After manipulating @InverseFinance's sDOLA balance with ~$30M flashloaned, the exploiter was able to liquidate 27 users' sDOLA collateralized positions and profited ~$240K.

Stay Vigilant!

— CertiK Alert (@CertiKAlert) March 2, 2026

March 2, 2026 06:38:59 UTC

Crypto Market Today: Bitcoin Etheruem and XRP Price Trends

Crypto markets ended the week mixed as geopolitical tensions kept investors cautious. Bitcoin closed at $65,776, down 2.76% weekly but rebounded strongly from an intraday low of $63,030. Ethereum fell 0.93% to $1,939 despite record staking of 37.1 million ETH and lower exchange supply.XRP dropped 2.93% to $1.352, tracking broader market weakness. Solana bucked the trend, rising 0.98% to $83.60 on strong developer and on-chain activity. The total crypto market cap declined 1.87% to $2.25 trillion, while Bitcoin dominance eased to 58.50%. Meanwhile, U.S. spot Bitcoin ETFs snapped a five-week outflow streak, recording over $1 billion in net inflows across three straight days—hinting at renewed institutional interest.

March 2, 2026 05:59:45 UTC

Token Unlocks Worth $572M Set to Hit Market This Week

According to Tokenomist, the crypto market is preparing for major token unlocks over the next seven days, with the total value expected to exceed $572 million. Large one-time unlocks (over $5 million) are scheduled for HYPE, ENA, RED and others. Meanwhile, linear daily unlocks above $1 million are expected for SOL, WLD, DOGE, TRUMP, RAIN, RIVER, CC and ASTER. Traders are watching closely, as significant unlock events can increase circulating supply and potentially add short-term price pressure.

Token Unlocks

March 2, 2026 05:59:45 UTC

Tron Inc. Expands TRX Treasury With 177,637 TRX Tokens Purchase

Tron Inc. has acquired 177,637 TRX tokens at an average price of $0.28, further boosting its digital asset treasury. The latest purchase brings the company’s total holdings to more than 684.4 million TRX.The firm said it plans to continue expanding its Tron DAT reserves as part of its strategy to enhance long-term shareholder value. Investors are closely watching the company’s designated on-chain TRX treasury wallet for further accumulation signals.

March 2, 2026 05:54:42 UTC

UAE Shuts Stock Markets Amid Rising Iran Tensions

The UAE stock markets have been temporarily shut following rising tensions linked to Iran. The Dubai Financial Market and the Abu Dhabi Securities Exchange will remain closed on March 2 and 3, according to local reports. While officials have not described the move as a panic response, the rare closure signals that the regional conflict is beginning to affect financial systems. Investors across global markets are now watching the situation closely for any further impact.

March 2, 2026 05:52:11 UTC

Whale Swaps ETH for Tokenized Gold, Takes $60K Loss

A crypto whale has swapped 1,000 ETH worth about $1.94 million for 358.49 XAUT at an average price of $5,413, booking a loss of over $60,000 on the trade. On-chain data shows the wallet accumulated 1,645 ETH for roughly $3.26 million over the past two years and still holds 645 ETH valued near $1.25 million. The move suggests a shift toward tokenized gold exposure as some large holders rebalance during ongoing market uncertainty.

March 2, 2026 05:37:30 UTC

Bitcoin May Be Undervalued as Gold Surges

Bitcoin is currently trading 24%–66% below its historical trend compared to gold and global money supply, according to Samson Mow, CEO of Jan3. He believes gold looks overextended at current levels. April gold futures closed at $5,247.90 on Friday, while tokenized gold PAX Gold traded above $5,360 at the time of writing. Mow said the widening gap could signal a potential Bitcoin reversal ahead.

SBF Praises Trump’s “Surgical” Foreign Strategy

SBF Praises Trump’s “Surgical” Foreign Strategy

The post SBF Praises Trump’s “Surgical” Foreign Strategy appeared first on Coinpedia Fintech News

Former FTX CEO Sam Bankman-Fried (SBF) has sparked debate after praising Donald Trump’s foreign policy approach in a recent tweet. SBF claimed Trump’s actions in Iran and Venezuela achieved results that long ground wars in Iraq and Afghanistan failed to deliver. He described the strategy as “surgical,” arguing it came at a far lower cost and with fewer casualties. The post quickly drew mixed reactions online, with critics and supporters debating the comparison and its accuracy.

XRP Trading Volume Jumps on Bitrue as Buying Pressure Builds

XRP trading activity surge on Bitrue

The post XRP Trading Volume Jumps on Bitrue as Buying Pressure Builds appeared first on Coinpedia Fintech News

XRP trading activity has surged on Bitrue, with spot purchase volumes rising 212% and outpacing sell orders by more than two times. The spike comes amid what analysts describe as a quiet accumulation phase by institutional investors following the launch of XRP ETFs. Overall, XRP has attracted about $1.1 billion in net assets, posting positive weekly inflows and recording outflows on only five days so far—signaling steady demand in the market.

$652M XRP Mystery: Why Billions Just Moved Before Markets Reopened

$652M XRP Mystery Why Billions Just Moved Before Markets Reopened

The post $652M XRP Mystery: Why Billions Just Moved Before Markets Reopened appeared first on Coinpedia Fintech News

The crypto market didn’t have a quiet weekend. As tensions between the United States, Israel and Iran escalated sharply, digital assets became the first place investors reacted. With stock markets closed when the initial strikes were reported, crypto traded in real time,  and the volatility showed it.

Bitcoin plunged toward $63,000 in the first wave of selling before rebounding just as quickly on reports surrounding developments in Iran’s leadership. By late Sunday, it had reversed again, slipping lower as traders tried to make sense of fast-moving headlines.

Crypto Moves First When Markets Are Closed

According to on-chain analyst Darkfost, the timing of the geopolitical shock amplified crypto’s volatility. When traditional equity markets are shut, digital assets become the only major trading venue open.

That often means sharper swings. Without stocks, bonds, or commodities trading in full force, crypto becomes the pressure valve for global uncertainty. Traders reposition quickly. Liquidity shifts fast. And price moves can overshoot in both directions.

This weekend was no exception.

While Bitcoin and Ether reacted to the macro tension, XRP showed a different signal entirely, one that may matter more in the coming days.

$652 Million in XRP Moves to Binance

Darkfost said that more than 472 million XRP,  worth around $652 million, has flowed into Binance over the past week. That marks the largest inflow of XRP onto the exchange this month.

XRP Ledger

When tokens move from private wallets to exchanges, it usually means one thing: optionality. Holders are preparing to sell, hedge, or at least keep liquidity ready if conditions worsen. It does not mean a sell-off is guaranteed. But it does mean supply is closer to the market. 

The big question now is intent.

Are investors simply reacting to war headlines and preparing for short-term volatility? Or is this the early stage of something bigger?

Historically, large exchange inflow spikes tend to precede volatility. Sometimes it leads to quick sell-offs. Other times, it ends up being defensive positioning that never materializes into heavy selling.

Geopolitical events often trigger emotional reactions. Once tensions cool, markets sometimes retrace just as fast as they dropped. Right now, the data does not confirm a breakdown. But it does show a market on edge.

High exchange inflows combined with geopolitical instability create a delicate balance. If broader sentiment stabilizes when traditional markets reopen, crypto could find a footing. If global markets open sharply lower, digital assets may absorb another wave of selling.

Never Miss a Beat in the Crypto World!

Stay ahead with breaking news, expert analysis, and real-time updates on the latest trends in Bitcoin, altcoins, DeFi, NFTs, and more.

FAQs

How do geopolitical events impact crypto markets?

Geopolitical shocks raise uncertainty. Traders cut risk quickly, causing fast price swings—especially when traditional markets are closed.

What does it mean when crypto whales move coins to exchanges?

When whales transfer significant holdings to exchanges like Binance, it increases the available supply for trading. This is often a signal they are preparing to sell or hedge against potential market downturns.

Will the crypto market recover after the weekend volatility?

Recovery depends on how traditional markets react when they reopen. If global stocks stabilize, crypto might find its footing; if markets open sharply lower, digital assets could face another wave of selling.

Bitcoin Price Prediction March 2026: Macroeconomist Says BTC Will Hit $100K

Bitcoin Price Prediction April 2025: Will BTC Hit $100K Again?

The post Bitcoin Price Prediction March 2026: Macroeconomist Says BTC Will Hit $100K appeared first on Coinpedia Fintech News

Bitcoin slipped in the past 24 hours, but one top macroeconomist says a powerful rally could be just ahead.

Bitcoin is down 1.18% to around $66,538, moving in line with the broader crypto market decline. The drop comes as rising tensions in the Middle East triggered a wider “risk-off” move across global markets. Investors pulled back from volatile assets, and heavy liquidations added extra selling pressure.

Yet despite the short-term dip, macroeconomist Henrik Zeberg has laid out big price targets for Bitcoin this month.

“Bitcoin Rallies to $110–120K”

In his March 2026 portfolio outlook, Zeberg wrote: “Bitcoin rallies to $110–120K in the primary scenario, fueled by Risk-On Fever, ETF inflows, and continued institutional adoption.”

He also outlined a secondary scenario with a 25% probability where Bitcoin could climb to $140,000–$150,000 if the cycle extends further.

That places the $100,000 milestone well within reach under his base outlook.

What Could Drive the Move?

Zeberg points to three main forces behind the potential surge:

1. Return of Risk Appetite

Markets often shift quickly from fear to aggressive buying. If geopolitical pressure eases and investors rotate back into growth assets, crypto could benefit.

2. Continued ETF Inflows

Spot Bitcoin ETFs have brought steady institutional demand. Large inflows tighten available supply and support higher prices.

3. Institutional Adoption

More asset managers and public companies now treat Bitcoin as part of diversified portfolios. That steady participation adds structural demand to the market.

Ethereum and Solana Also in Focus

Zeberg’s outlook extends beyond Bitcoin.

For Ethereum, he sees the ETH/BTC ratio moving toward 10%, which would place Ethereum between $10,000 and $12,000.

He also names Solana as a high-beta asset in the cycle, with a projected range of $350 to $500 if the broader rally unfolds.

Why is Bitcoin Price Going Down Today?

Bitcoin price bottom prediction

The post Why is Bitcoin Price Going Down Today? appeared first on Coinpedia Fintech News

The crypto market is under pressure again. Total market value has fallen to around $2.28 trillion, down more than 2% in the past 24 hours. Investors are asking the same question: Why is crypto crashing today?

Here’s what’s happening:

1. Rising Tensions in the Middle East

The biggest reason behind today’s drop is growing geopolitical tension between the United States, Israel and Iran.

Reports of military strikes and political instability have made global investors nervous. When uncertainty rises, many traders move their money out of risky assets like cryptocurrencies.

Right now, crypto is behaving like a “risk asset,” similar to stocks. In fact, Bitcoin has been moving closely with the S&P 500, showing about 78% correlation recently. 

2. Bitcoin Is Leading the Drop

Bitcoin is trading around $66,200, down roughly 2–3% in 24 hours.

Ethereum has dropped to about $1,947, falling more than 4%.

Other major altcoins are also lower:

  • Solana around $83
  • XRP near $1.36
  • Cardano around $0.27
  • Dogecoin near $0.09

When Bitcoin falls, the rest of the market usually follows.

3. Fear Is Extremely High

The Crypto Fear & Greed Index is now at 15, which is labeled “Extreme Fear.”

This means investors are very worried. When fear is high, people sell faster and buy less. That increases downward pressure on prices.

The market was already nervous before this latest news. The conflict simply made things worse.

4. $130 Million in Liquidations Made It Worse

Another reason prices dropped quickly is liquidations.

Over the past 24 hours, more than $130 million worth of Bitcoin positions were liquidated. Most of these were long positions, meaning traders who were betting on higher prices got forced out.

When exchanges automatically close losing positions, it creates extra selling. This can turn a normal dip into a sharper crash.

5. Gold Is Rising While Crypto Falls

Interestingly, while crypto is dropping, gold and silver are rising sharply.

Gold jumped nearly 2% within the first hour of market opening and is now close to hitting a new all-time high. Investors often buy gold during times of war or uncertainty because it is seen as a safer store of value.

This shows that money is moving out of risky assets and into safer ones. Right now, everything depends on geopolitical news. If tensions calm down, crypto could recover. If the conflict escalates, volatility may continue.

Exclusive Pi Network News: The Hidden Liquidity Story Behind the 94% Drop

Pi Network News Today

The post Exclusive Pi Network News: The Hidden Liquidity Story Behind the 94% Drop appeared first on Coinpedia Fintech News

One year after launching its Open Network, Pi Network is navigating a challenging phase.

While the project recently celebrated its first Open Network anniversary, Pi Coin is trading near historic lows, raising concerns among investors who had anticipated faster gains.

At the time of writing, Pi Coin is priced around $0.1622, below its reported all-time high of $2.98 recorded on February 26, 2025. The token remains down more than 94% from that peak, though it has recovered roughly 28% from its recent all-time low of $0.1312 earlier this month.

“Price Is Driven More by Liquidity Than Utility”

In an interview with Coinpedia, crypto analyst Dr Altcoin addressed investor concerns about Pi Network’s current price performance.

“Many investors expected immediate upside, but Pi entered open trading after years in an enclosed ecosystem,” he said.

He explained that early post-launch trading dynamics tend to be dominated by short-term forces rather than long-term fundamentals.

“At this stage, price is driven more by liquidity conditions, supply unlocking, and short-term speculation than by fully developed utility.”

According to him, this pattern is not unique to Pi Network. Many blockchain projects experience early volatility before stronger fundamentals begin to influence valuation.

Explaining the Gap Between All-Time High and Current Price

Dr Altcoin also discussed the significant difference between Pi Coin’s early all-time high and its present trading levels.

“Early all-time highs were formed under conditions of thin liquidity, hype, and, in some cases, confusion caused by IOU pricing before real market depth developed.”

He said that early expectations may have priced Pi as a fully matured ecosystem, whereas the current valuation reflects a project still building infrastructure and real-world use cases.

“This gap highlights that early expectations priced Pi as a finished product, while the current price reflects a network still actively building real-world usage and infrastructure.”

Still Ranked Among Top Projects

Despite the price decline, Pi Network has managed to maintain a top-50 ranking on CoinMarketCap, even without listings on major tier-1 centralized exchanges.

This signals resilience rather than failure, suggesting that the project’s long-term relevance will depend on ecosystem growth rather than short-term speculation.

As Pi Network moves into its second year of Open Network operations, the focus now shifts to development progress, adoption metrics, and whether utility can eventually support stronger price stability.

❌