The post Store, Trade, Earn, Spend: How ULTIMA Turned Crypto Into Everyday Finance appeared first on Coinpedia Fintech News
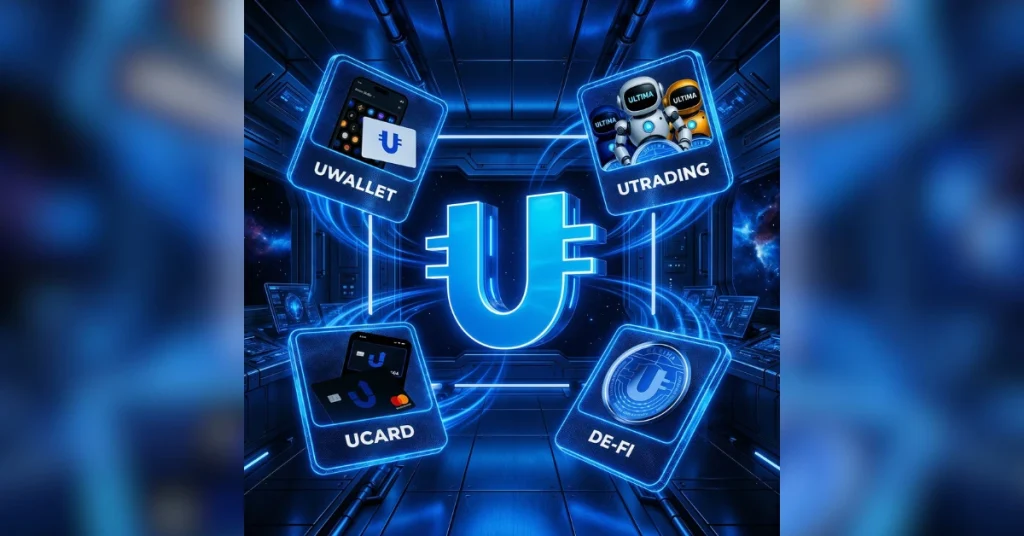
ULTIMA has built an interconnected crypto financial ecosystem, including a wallet, trading bots, DeFi, debit cards, and its own marketplace, operating in 120 countries and serving more than 2.8 million users.
Most cryptocurrency media coverage follows a familiar loop: hype cycles, hack headlines, regulatory battles. In practice, blockchain is quietly reshaping the payment infrastructure hundreds of millions of people rely on daily, from NYSE to Swift or Visa with Mastercard.
India ranks first globally in real-world cryptocurrency adoption, according to the Chainalysis 2025 Geography of Crypto Report — over 100 million users, despite some of the strictest regulation and taxation in the world. India’s numbers are part of a wider pattern: growing demand for products built around daily use rather than speculation. One ecosystem designed around that premise is ULTIMA. The project operates across more than 120 countries — from Europe to South and Southeast Asia — and serves 2.8 million users.
On its own Smart Blockchain, ULTIMA has built interconnected tools covering the full cycle of what a cryptocurrency holder might need: storing, trading, earning, and spending.
Store and secure
The foundation is UWallet, a multi-currency, non-custodial crypto wallet that supports ULTIMA, BTC, ETH, USDT, and other assets. Non-custodial means private keys remain solely on the user’s device. No one else can control the funds, a structural difference from custodial platforms, whether traditional banks or crypto exchanges, where assets are entrusted to a third party.
A built-in Fee Protector feature automatically prevents overpaying on fees, one of several design choices aimed at users without a crypto background.
For additional security, UDefender adds a physical layer of protection. The NFC card stores part of the key required to manage funds entirely offline. Without it, no one can access the funds even if the device is lost or compromised.
Trade and earn
Once stored and secured, crypto assets can be put to work. UTrading offers preconfigured trading bots for algorithmic trading.
The bots connect to HTX, BingX, and MEXC exchanges via a secure API and are never granted withdrawal permissions — only trading access. Users set a return target through Performance Packs; bots then trade until the target is met, with no time limit. Because the bots operate without leverage, there is no risk of forced sell-offs. Three trading strategies run simultaneously, designed to adapt to varying market conditions.
DeFi-U extends earning potential beyond active trading. Where UTrading generates returns through market strategies, DeFi-U offers a passive alternative: users allocate tokens to reward pools and receive $ULTIMA coin without managing trades or monitoring markets. Several independent reward pools operate directly on the blockchain, each with its own distribution schedule. No intermediaries handle funds at any stage.
Like the coin itself, pool rewards are periodically halved on a set schedule — reducing what each pool distributes over time.
Both trading and DeFi operations require network resources to process transactions. Users can stake — temporarily lock — their tokens to support the network and earn these resources in return. Ultima Energy is the platform for managing staked tokens and the network resources they generate.
Spend
Two products handle the spending side — converting crypto holdings into real-world purchases.
UCard offers virtual and physical crypto debit cards for everyday transactions, from groceries and fuel to subscriptions and app stores. The balance can be topped up with BTC, USDT, or USDC from any crypto wallet.
Ultima Store is the ecosystem’s marketplace, offering users vouchers for popular brands and retail platforms on favourable terms. In practice, it provides a way to convert crypto assets into goods and services without leaving the ecosystem.
Between UCard and Ultima Store, cryptocurrency is no longer a blockchain abstraction. It becomes spendable — completing the cycle from storage to real-world use.
$ULTIMA: Scarcity by Design
Every product in the ecosystem runs on a single asset: $ULTIMA coin. The total supply is fixed at 100,000 coins, and periodic halvings reduce what enters circulation over time. The January halving cut daily $ULTIMA distribution from 25 to 6 coins.
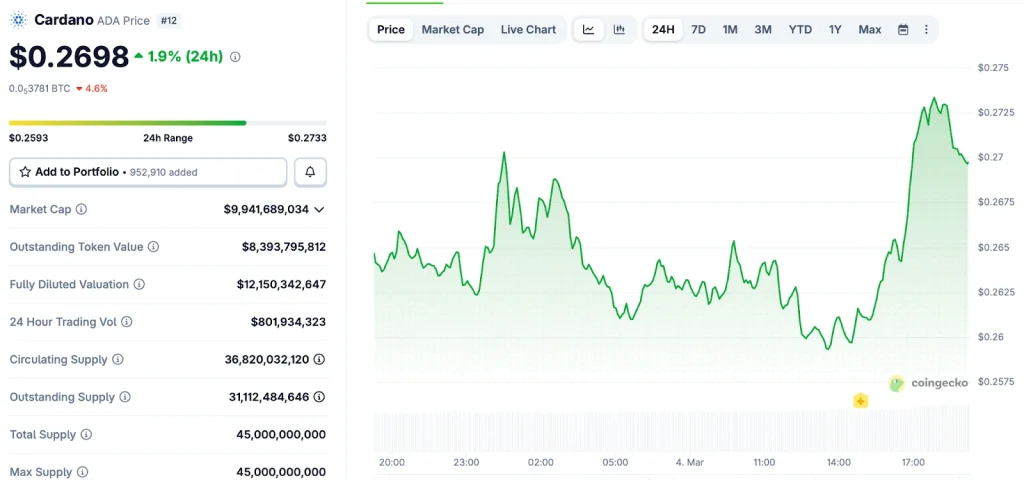
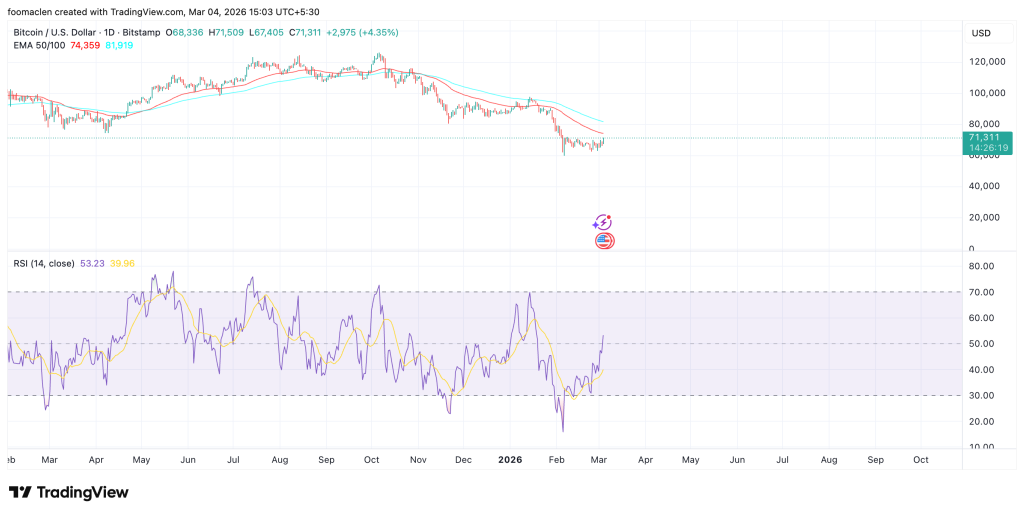
Against this shrinking supply, the coin is used across all operations, creating an economy where scarcity tightens with every halving. According to CoinGecko data, the token has risen 120 per cent against Bitcoin over the past three months, with the January halving pushing the price up a further 20 per cent since early February — and as the broader market stabilises, this sets the stage for even stronger growth.
The coin’s underlying code locks its supply rules permanently — once published, no one, including the project’s developers, can alter them. The code is publicly verifiable on the blockchain, published on GitHub, and has been audited by CertiK.
Nine years and counting
Launched out of Switzerland in 2016, ULTIMA has operated for nine years and currently ranks among the top 250 crypto assets globally on CoinMarketCap.
Originally designed for everyday payment scenarios, ULTIMA continues to operate in 120+ countries with support seven days a week. In markets from Europe to India — the country that ranks first globally in real-world cryptocurrency adoption — an ecosystem that lets users store, trade, earn, and spend from a single platform is no longer theoretical.


 THE SINGLE BIGGEST NEWS OF 2026 JUST DROPPED.
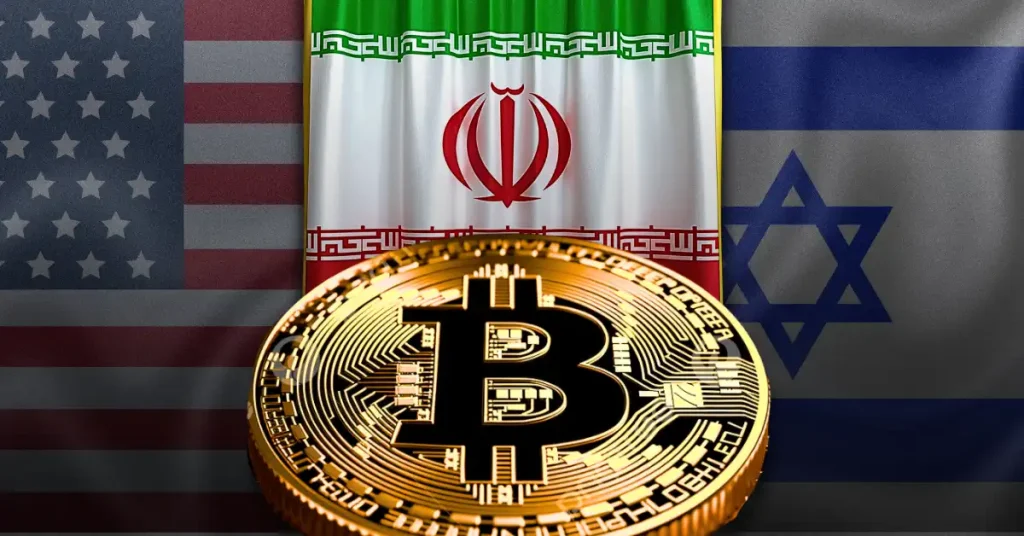
 Iran says it is READY to ABANDON its ENTIRE nuclear program — if the U.S. offers a satisfactory deal.
 WHY THIS CHANGES ABSOLUTELY EVERYTHING:
 The #1 reason for this war…


![Why Is the Crypto Market Up Today [Live Updates] March 5, 2026](https://image.coinpedia.org/wp-content/uploads/2026/03/05131243/Why-Is-the-Crypto-Market-Up-Today-Live-Updates-March-5-2026-2-1024x536.webp)