Reading view

PI Network Price Jumps 15% as Volume Rises But $0.28 Holds the Real Answer

Pi Network Gains Attention Today With New Update

The post PI Network Price Jumps 15% as Volume Rises But $0.28 Holds the Real Answer appeared first on Coinpedia Fintech News

The PI Network price is suddenly back on traders’ radar this weekend. Not because it exploded into a massive rally but because something subtler is happening beneath the surface: volume is quietly heating up.

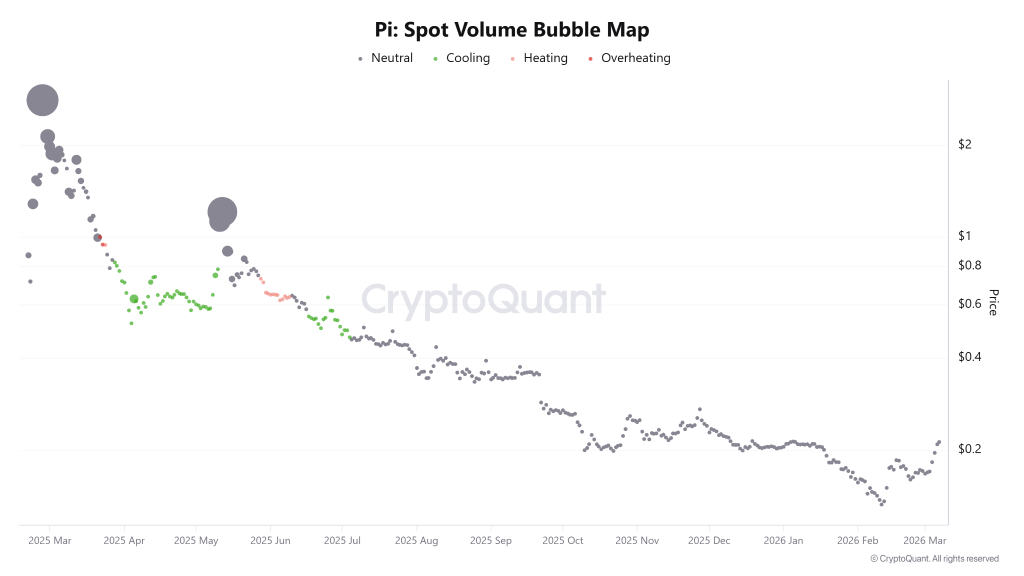
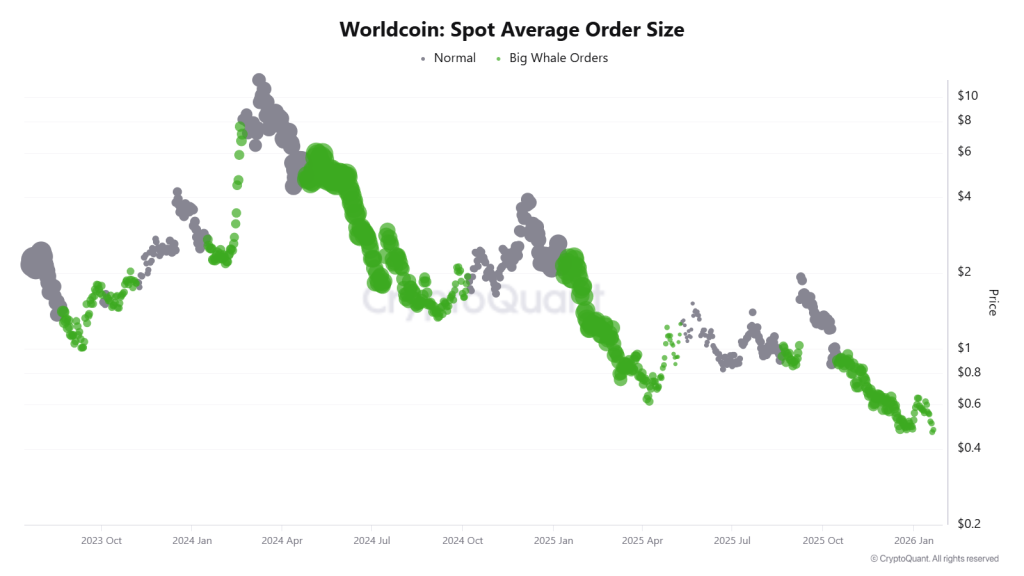
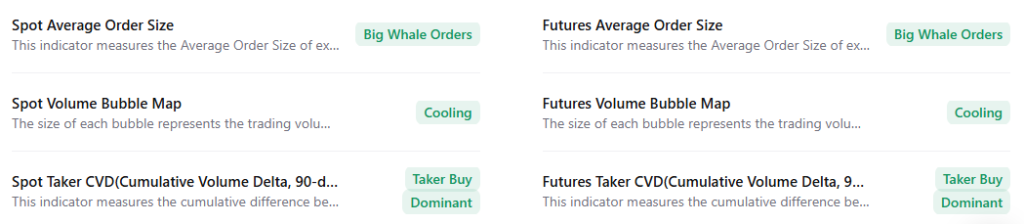
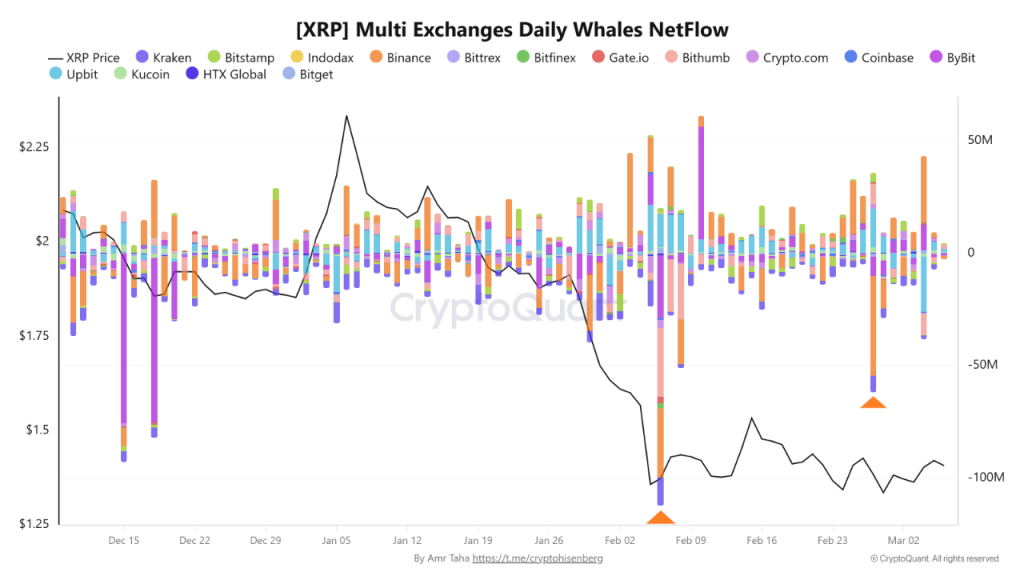
And in crypto markets, rising volume during a price recovery tends to get people paying attention. According to data from CryptoQuant’s spot volume bubble map, trading activity has started climbing alongside the recent PI/USD move. Now, before anyone starts screaming “breakout,” there’s a catch. The indicator still labels the current volume environment as neutral.

Oddly enough, that’s not bad news. Neutral volume during a rising price trend often hints that accumulation might still be underway rather than a full-blown speculative frenzy.

PI Network Price Volume Trend

Take a closer look at the volume map and the pattern becomes clearer. The bubbles tracking spot activity have been gradually expanding, signaling a rise in trading interest. But they’re not glowing red-hot or light orange yet. In other words, momentum hasn’t strengthened yet and to reach peak speculation territory it needs some more efforts to do it.

For long-term watchers of the PI Network price chart, that distinction matters. If volume remains controlled while price edges upward, it can suggest investors are slowly building positions rather than chasing a short-term pump.

Still, crypto has a long history of teasing traders before pulling the rug.

PI Network Price Jumps 15% as Volume Rises But $0.28 Holds the Real Answer

The $0.28 Fakeout Warning

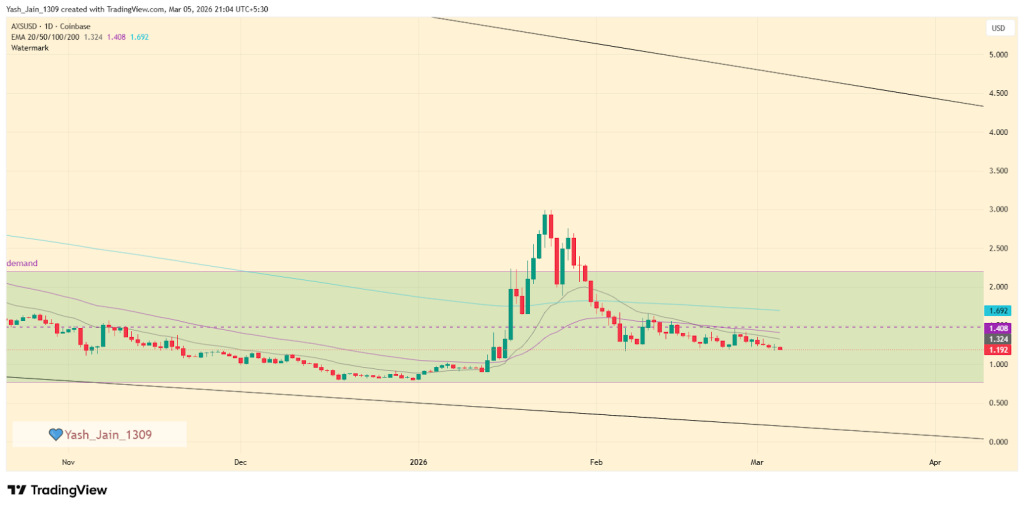
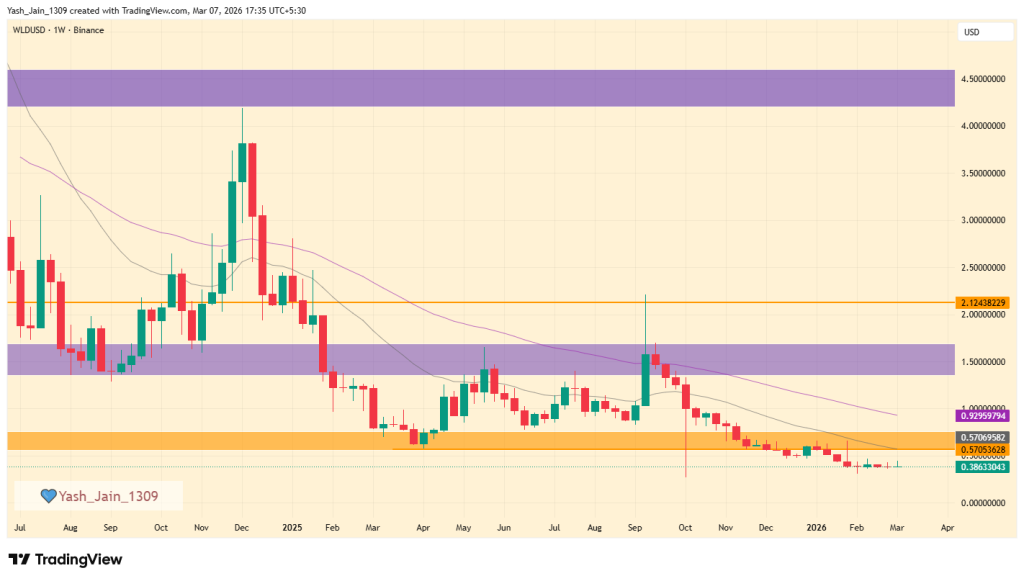
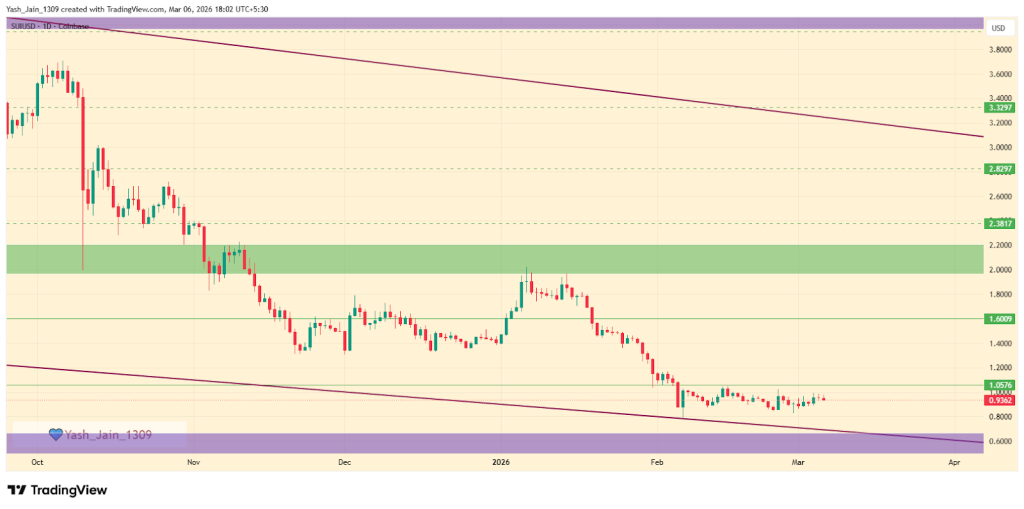
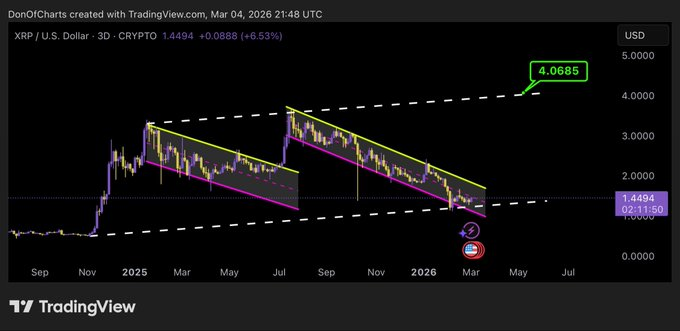
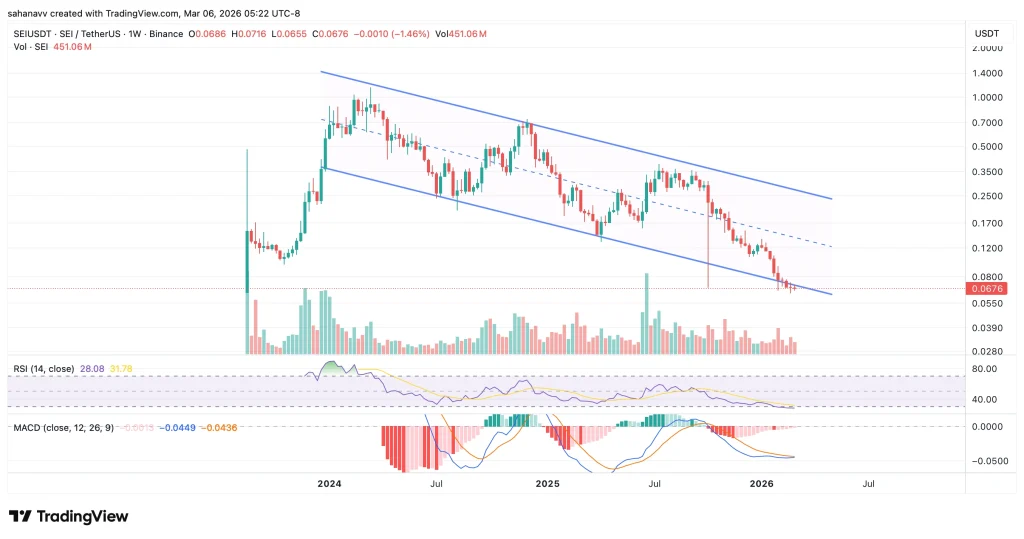
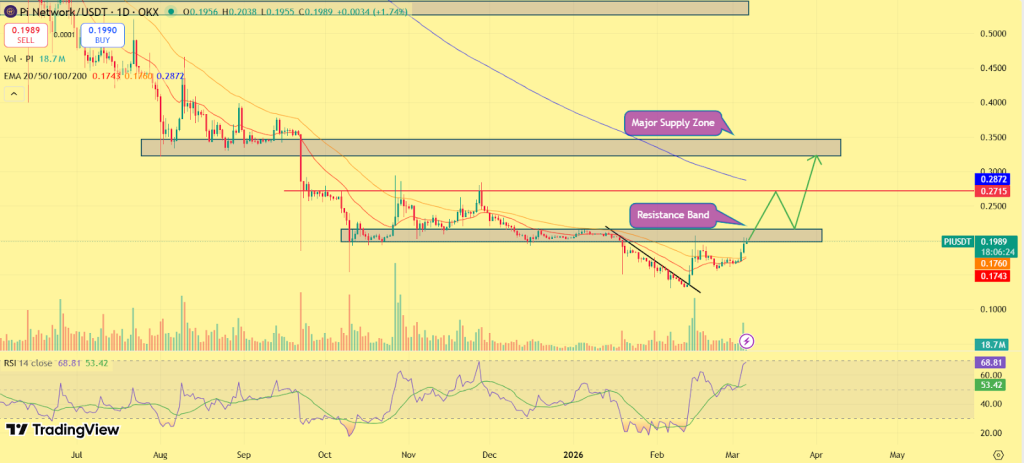
History provides a useful cautionary tale here. Back in Q4 2025, the asset surged from roughly $0.19–$0.20 but ran into a stubborn ceiling at $0.28. That level ultimately triggered a loss of strength, turning the rally into what traders later labeled a classic fakeout.

Fast forward to Q1 2026, and the story looks slightly different. This time, the asset found support much lower, in the $0.13–$0.14 zone. From there, it managed to reclaim $0.20, a move that technically signaled a shift in short-term trend.

But the real test hasn’t arrived yet. If price once again stalls beneath $0.28, the market could start asking uncomfortable questions about whether history is repeating itself.

Network Updates Fuel Investor Interest

So why the renewed attention now? Two recent developments inside the ecosystem appear to be driving the interest.

First came the announcement that Protocol v19.9 migration has been successfully completed, with the next upgrade, v20.2, targeted for completion before Pi Day 2026. Node operators were advised to ensure their systems are updated ahead of the next phase.

Then things got even more interesting. A separate update revealed a proof-of-concept project exploring a new Pi Node utility for decentralized AI training and computing tasks. The project reportedly uses spare computing power from over 421,000 Pi Nodes to process AI-related workloads.

The initiative was conducted in collaboration with OpenMind, a robotics startup backed by Pi Network Ventures. The experiment showed that Pi Nodes could handle AI workloads and return useful results quickly, an early step toward integrating the network into distributed AI infrastructure.

PI Network Price Eyes Breakout

So where does that leave things?

Simple. The PI Network price prediction debate now circles around a single technical hurdle.

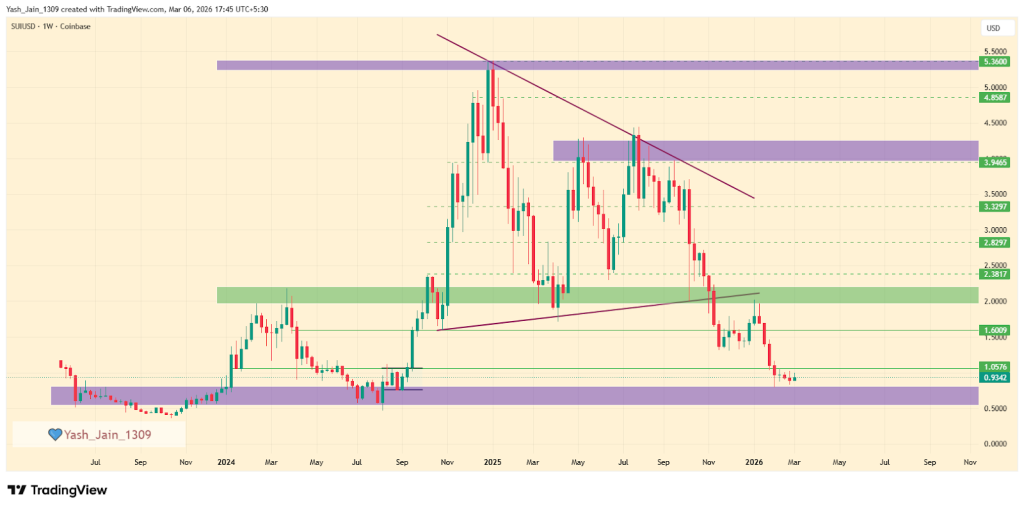
If the PI Network price climbs decisively above $0.28, the probability of the current rally being another fakeout drops significantly. Rising volume on CryptoQuant’s chart could then signal accelerating momentum.

PI Network Price Jumps 15% as Volume Rises But $0.28 Holds the Real Answer

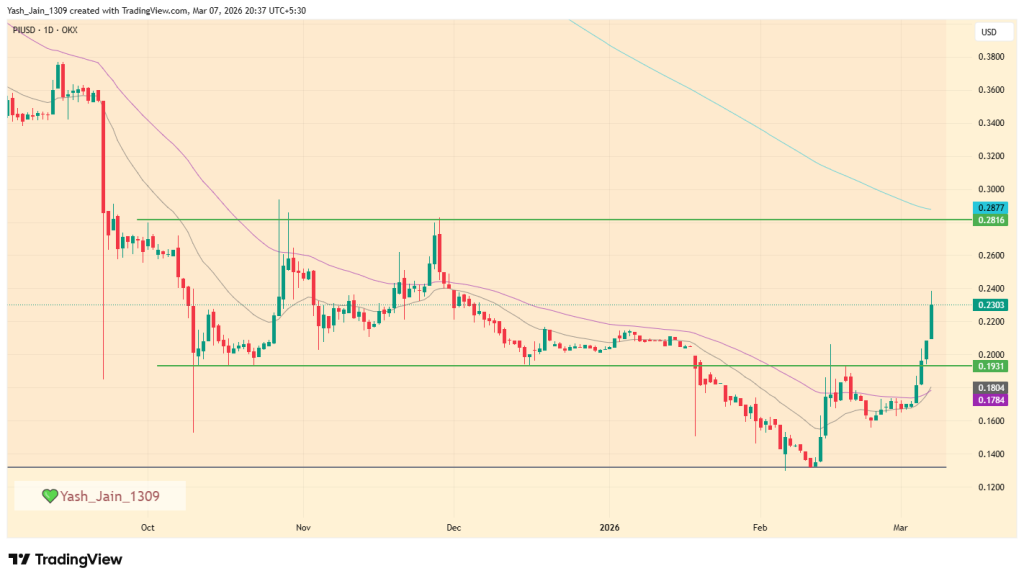
And if that momentum continues building, some traders believe the next long-term target could eventually stretch toward $1. But first things first. The market still has one stubborn ceiling to deal with.

Ethereum Price Builds Quiet Strength as RWAs Hit $20.4B and L2 Ecosystem Expands

FG Nexus Sells Additional Ethereum as Losses Hit $82M

The post Ethereum Price Builds Quiet Strength as RWAs Hit $20.4B and L2 Ecosystem Expands appeared first on Coinpedia Fintech News

The Ethereum price may look sluggish on the surface, but under the hood the network’s fundamentals are doing something far less boring which quietly expanding. And in crypto, quiet expansion tends to get loud eventually.

Since January 2025, the value of tokenized RWAs on blockchain has climbed to $20.4 billion, according to the latest data. That growth isn’t happening in isolation either. It’s unfolding alongside a rapidly expanding Layer 2 ecosystem and a massive stablecoin footprint across the Ethereum network.

So while traders argue over candles on the Ethereum price chart, the infrastructure beneath the market keeps getting bigger.

Ethereum Ecosystem Growth Tells Story

Let’s start with the raw numbers. The Ethereum ecosystem now hosts 146 live Layer 2 networks. That’s not a typo, 146 separate scaling environments designed to handle transactions and applications without clogging Ethereum’s base layer.

And despite the brutal token corrections many of those L2 projects have faced recently, the capital sitting inside them hasn’t exactly vanished.

Ethereum Price Builds Quiet Strength as RWAs Hit $20.4B and L2 Ecosystem Expands

The total value locked across Ethereum’s L2 networks currently sits at $38.2 billion. Sure, that’s down from the $58 billion peak recorded in mid-December 2025, but it’s still a massive figure considering the broader market turbulence.

In other words, the infrastructure didn’t disappear just because prices dropped.

Stablecoins Dominate Ethereum Network Liquidity

Now here’s another piece of the puzzle. When combining Ethereum’s mainnet and its L2 networks, stablecoins account for over 60% of the market share, representing roughly $179 billion.

That’s a staggering amount of liquidity circulating inside one ecosystem. Why does it matter? Because stablecoins function as the financial plumbing of crypto. They power trading, lending, payments, and DeFi. When the majority of that liquidity sits inside Ethereum’s orbit, it tells you where most of the financial activity still lives.

Ethereum Price Builds Quiet Strength as RWAs Hit $20.4B and L2 Ecosystem Expands

Ethereum Price Signals Possible Accumulation

Meanwhile, another metric is quietly flashing on analysts’ dashboards: declining ETH exchange reserves. Put simply, fewer ETH tokens are sitting on centralized exchanges.

Historically, that kind of movement suggests accumulation. Investors pull assets off exchanges when they’re planning to hold rather than sell. Not exactly the behavior you see during panic exits. 

Ethereum Price Builds Quiet Strength as RWAs Hit $20.4B and L2 Ecosystem Expands

Ethereum Price Outlook Sparks Bullish Sentiment

Now here’s where things get interesting. Some market watchers believe the current setup could be quietly building pressure. One particularly blunt sentiment floating around crypto circles sums it up pretty clearly: many investors may not fully grasp how bullish the broader chart structure appears.

Ethereum Price Builds Quiet Strength as RWAs Hit $20.4B and L2 Ecosystem Expands

The argument goes like this. Sentiment across the market remains crushed. Massive capital reportedly sits on the sidelines waiting for regulatory clarity. Meanwhile, institutions, governments, and banks are increasingly experimenting with blockchain-based financial infrastructure.

If that alignment plays out, the Ethereum price prediction suggests that it could eventually reflect the scale of the ecosystem being built around it. And when that happens, the ripple effects across the altcoin market could be hard to ignore.

Worldcoin Price Prediction 2026, 2027 – 2030: Will WLD Price Reach $10?

price prediction Worldcoin

The post Worldcoin Price Prediction 2026, 2027 – 2030: Will WLD Price Reach $10? appeared first on Coinpedia Fintech News

Story Highlights

  • The live price of the WLD token is  $ 0.37715429
  • Price predictions for 2026 range from up to $4.18.
  • Long-term forecasts suggest potential highs of $35.60 by 2030.

WLD price was almost $12 ATH but went crashing to $0.50 in the last remaining days of 2025. This has raised concerns among investors and traders about WLD’s future, and as a result, the Worldcoin price prediction 2026 has become a topic of significant discussion, with many being intrigued about its prospects in the coming year.

Its prolonged period of downtrend has left many wondering if the project’s initial buzz was fading. But, behind the scenes, Worldcoin is still quietly building its platform. Now, experts view Q1 2026 as a potential turning point where renewed momentum could be observed.

So many are now asking a crucial question: is this the start of a new chapter for Worldcoin? Will the project’s focus on decentralized identity and its connection to the AI sector be enough to fuel a powerful comeback and reclaim its spot in the market spotlight?

Let’s delve into the anticipated Worldcoin price predictions 2026 to 2030 and the years to come.

Worldcoin Price Today

Cryptocurrency Worldcoin
Token WLD
Price $0.3772 down -2.95%
Market Cap$ 1,091,475,399.21
24h Volume$ 85,552,594.6396
Circulating Supply2,893,975,824.9380
Total Supply10,000,000,000.00
All-Time High$ 11.8171 on 10 March 2024
All-Time Low$ 0.3140 on 06 February 2026

CoinPedia’s WLD Price Prediction 2026

In early 2026, the price dropped to $0.27, prompting efforts to stabilize the market. However, investor sentiment continues to be cautious. The immediate short-term support level is at $0.31; a drop below this level could result in further declines. If the prices increase, we could see a bounce back to $0.60 and potentially $0.95 in March. For a long-term recovery, it is essential to break through the resistance at $1.50.

Worldcoin Price Prediction 2026

Following a false breakout to $2.12 in September 2025, the bearish trend continued into the first quarter of 2026, with prices dropping as low as $0.27. However, since mid-February, there have been efforts to sustain the price and prevent further declines. 

Given the significant drop already experienced, broader market conditions have notably affected liquidity within the cryptocurrency sector. As a result, traders and investors have remained on the sidelines, waiting for clearer market signals to emerge.

In March, the market would find itself in a precarious situation, as odds suggest it could struggle to stabilize. Investor sentiment remained lukewarm, with many hesitant to take advantage of opportunities despite substantial price discounts.

Currently, the immediate critical support level is at $0.31. If this level is breached, lower prices may be possible. On the other hand, if the price rises, March could see a bounce towards $0.60 and $0.95 in the short term. For long-term recovery, the price needs to breach the $1.50 resistance zone.

Worldcoin Price Prediction 2026

WLD On-Chain Analysis

The WLD Spot Average Order Size chart reveals persistent green clusters into January 2026, indicating sustained “Big Whale” participation. This heavy institutional accumulation suggests that smart money is aggressively building positions, viewing the current price range as a high-conviction entry point.

Worldcoin Spot Avg Order Size

Similarly, development activity on Worldcoin is surging to new local highs in January 2026, showcasing intense builder commitment. This spike in innovation, combined with whale interest, creates a powerful fundamental divergence that historically precedes a massive price reversal.

Worldcoin On Chain Activity

WLD Price Forecast 2026 – 2030

YearPotential Low ($)Average Price ($)Potential High ($)
20262.506.009.50
20277.0011.2515.70
202810.7515.9521.15
202915.6521.6027.50
203019.7527.7535.60

This table, based on historical movements, shows Worldcoin price to reach $35.60 by 2030 based on compounding market cap each year. This table provides a framework for understanding the potential Worldcoin price movements. Yet, the actual price will depend on a combination of market dynamics, investor behavior, and external factors influencing the cryptocurrency landscape.

Worldcoin Price Forecast 2026

Worldcoin’s price for 2026 is projected to range between $2.50 and $9.50, with an average price of approximately $6.00.

WLD Price Prediction 2027

Worldcoin’s price for 2027 is expected to fluctuate between $7.00 and $15.70, with an average price of around $11.25.

Worldcoin Price Forecast 2028

Worldcoin’s price for 2028 is anticipated to be between $10.75 and $21.15, with an average price of about $15.95.

WLD Token Ai Price Forecast 2029

Worldcoin’s price for 2029 is projected to vary from $15.60 to $27.50, with an average price of roughly $21.60.

Worldcoin AI Token Price Prediction 2030

Worldcoin’s price for 2030 is expected to fluctuate between $19.75 to $35.60, with an average price of approximately $27.75.

Market Analysis

Firm Name20262030
Swapspace$1.30$2.07
coincodex$2.40$4.30
DigitalCoinPrice$3.02$4.06

*The targets mentioned above are the average targets set by the respective firms.

Never Miss a Beat in the Crypto World!

Stay ahead with breaking news, expert analysis, and real-time updates on the latest trends in Bitcoin, altcoins, DeFi, NFTs, and more.

FAQs

What is Worldcoin?

Worldcoin is a cryptocurrency project aiming to distribute digital assets to a global audience through a unique identity-verification system.

What is the current price of 1 Worldcoin?

At the time of writing, the price of one WLD token was  $ 0.00349731.

What is the Worldcoin price prediction for 2026?

WLD price forecasts for 2026 suggest a potential range between $2.50 and $9.50, depending on market recovery and technical breakouts.

What is the Worldcoin price prediction for 2030?

Long-term models suggest WLD could trade from about $19.75 to $35.60 by 2030 under bullish conditions.

What is the Worldcoin price prediction for 2040?

While speculative, extended growth forecasts envision potential for WLD beyond 2040 based on adoption and tech use cases.

Is Worldcoin a good long-term investment?

Worldcoin offers long-term potential due to its focus on decentralized identity and AI, but it remains volatile and requires risk awareness.

What factors influence WLD price the most?

WLD price is driven by AI narrative strength, user adoption, token supply dynamics, market sentiment, and overall crypto market trends.

Ethereum Price Make-Or-Break Level: Will This Decide Altcoin Season 2026?

Ethereum Price Analysis Whale Accumulation and Rising Volatility Put ETH at Crossroads

The post Ethereum Price Make-Or-Break Level: Will This Decide Altcoin Season 2026? appeared first on Coinpedia Fintech News

Ethereum is sitting at $1,987 and the chart is flashing something most traders aren’t paying attention to right now.

ETH is touching the same ascending trendline that has caught every major low since 2019. It held in 2020. It held after the 2022 collapse – twice. Each time it bounced, it launched a significant rally. This is the fifth test, and analysts say it’s the most important one yet.

Ethereum Price Make-Or-Break Level: Will This Decide Altcoin Season 2026?
@CryptoTice_ on X

ETH Has No Room to Slip

What makes this different from the previous tests is the condition Ethereum is arriving in. Bitcoin is already 20% off its recent lows. ETH hasn’t recovered the same way. It has underperformed Bitcoin throughout this entire cycle, which means it’s hitting this critical level with less momentum behind it than at any point before.

Analyst Crypto Tice said it directly: “ETH doesn’t get a second chance at this level. This is hold or collapse.”

This trendline represents the last sequence of higher lows that keeps ETH’s long-term bull case intact. If it goes, the technical argument goes with it.

Also Read: MakerDAO’s Black Thursday: How One Bot Got $8.32M in ETH for Free

Bullish and Bearish Outcomes for Ethereum

A hold here doesn’t just save Ethereum’s chart. It sets off a chain reaction that a lot of crypto investors have been waiting for. Relative strength returns, Bitcoin dominance starts to roll over, and capital rotates into altcoins. For millions of investors searching for signs of altcoin season, this might be a solid indicator.

A break does the opposite.

As one analyst put it: “ETH either holds here and leads the next leg or becomes the funding source for BTC’s final blow-off.”

Money exits altcoins, flows back into Bitcoin, and the downside on ETH opens up with little structural support below.

The Market Isn’t Making This Easy

Ethereum is holding this trendline during one of the more difficult macro environments in recent memory. Oil prices are surging on the back of the Iran conflict. US jobs data came in at negative 92,000 for February, well below expectations. Risk appetite across markets is compressed, and ETH is absorbing all of it at the exact level it needs to hold.

The weekly close will settle the debate. Until then, this is the only Ethereum price level worth watching.

Hyperliquid Price Prediction 2026, 2027 – 2030: Will HYPE Price Hit A New ATH?

Hyperliquid Price Prediction

The post Hyperliquid Price Prediction 2026, 2027 – 2030: Will HYPE Price Hit A New ATH? appeared first on Coinpedia Fintech News

Story Highlights

  • The live price of the Hyperliquid crypto is  $ 30.06004876.
  • The 2025 HYPE price suggests it could hit $40-$105 in 2026.
  • Forecasts suggest that HYPE could reach a potential average price by 2030 of around $125, with highs up to $185.

The crypto market is buzzing with excitement over Hyperliquid and its native token, HYPE. As a decentralized, paperless alternative to platforms like Binance and Coinbase, Hyperliquid is quickly gaining traction, prompting investors to look closely at the HYPE price prediction for 2026 and beyond

With its unique “HyperBFT” consensus mechanism, lightning-fast transactions, and zero KYC hurdles, Hyperliquid is rewriting the rules of perpetual trading. Beyond its consensus mechanism, Hyperliquid also allows users to trade crypto perpetual futures, including major assets like BTC, ETH, SOL, AVAX, and SUI, even without owning the underlying asset. 

As the platform gains traction for its streamlined trading experience, many investors are now turning to analyze the HYPE token price outlook. But does its innovative model signal long-term growth for HYPE Token Price? 

In this article, we dive deep into market sentiment and Hyperliquid price projections from 2026 to 2030.

Hyperliquid Price Today

Cryptocurrency Hyperliquid
Token HYPE
Price $30.0600 down -2.67%
Market Cap$ 7,747,213,701.69
24h Volume$ 159,918,023.9533
Circulating Supply257,724,588.6824
Total Supply957,398,105.6950
All-Time High$ 59.3926 on 18 September 2025
All-Time Low$ 3.2003 on 29 November 2024

Coinpedia’s HYPE Price Prediction 2026

In 2026, HYPE retested support at $21 and rose to $38 but now faces resistance at the upper wedge boundary around $32. If it breaks $32, it could reach $44 or $50; otherwise, it may fall below $21 to $18.

HYPE Price Prediction March 2026

In February, HYPE’s price fell from its $38 peak and is now 30% lower at $26. But late February saw a faint demand again, which pushed the price back up to retest the 20-day and 50-day EMA bands. If it crosses, in March, a retest of $32 could be possible, or even a breach, with targets at $44. But, if $32 repels, then it could hit $21.

HYPE price prediction March 2026

Hyperliquid Price Prediction 2026

In 2026, the HYPE price underwent a significant retest of dynamic support at $21, which coincided with the lower boundary of a falling wedge pattern. This retest led to a price rise to $38 by early February. However, the upper boundary of the falling wedge then served as dynamic resistance, preventing any further upward movement.

Currently, HYPE is consolidating within a narrowing wedge, with the trading range narrowing each month. At present in March, it is fluctuating around the 20-day and 50-day EMA bands.

In the short term, the price has tested the upper boundary of the falling wedge again, approximately at $32. If it successfully breaks through and maintains above this level, it may initiate a rally towards $44 or $50. Conversely, if it is rejected at $32, the price could decline below $21, potentially reaching as low as $18.

Hyperliquid Price Prediction 2026
YearPotential LowPotential AveragePotential High
2026 (conservative)$15$35$80

HYPE On-Chain Outlook

The Dune analytics dashboard provided an quick on-chain overview of the utility metrics of the Hyperliquid token (HYPE), which appears to be improving significantly with each passing month.

HyperEVM total transaction fees have surpassed 235.57K and are at an ATH, and total trading volume has crossed $3.64 trillion and is at an ATH. Even its revenue has reached an ATH, crossing $993 million.

HYPE On-chain outlook

All the major metrics suggest that it is experiencing great adoption among peers, and its on-chain metrics are proof of that, suggesting that if the rally occurs, then 2026 might end on very good numbers.

Hyperliquid Coin Price Targets 2026 – 2030

YearPotential Low ($)Potential Average ($)Potential High ($)
2026255090
20274075105
20285595130
202985110155
2030105125185

HYPE Price Projection 2026

By 2026, the value of a single Hyperliquid token price could reach a maximum value of $90 with a potential low of $25. With this, the average price could land at around the $50 level.

Hyperliquid Coin Price Prediction 2027

During 2027, the HYPE could reach a maximum value of $105 with a potential low of $40. Considering this, the average price of this altcoin could settle at around $75.

HYPE Crypto Price Action 2028

The Hyperliquid price could achieve the $130 milestone by the year 2028. On the flip side, the altcoin could record a low of $55 and an average price of $95.

Hyperliquid Price Analysis 2029

The HYPE crypto prediction for the year 2029 could range between $85 to $155 and the average price could be around $110.

HYPE Price Prediction 2030

Looking forward to 2030, the Hyperliquid Price may range between $105 and $185, and a potential average value of around $125.

Market Analysis

Firm Name202520262030
Binance$37$63$164
DigitalCoinPrice$76$54$97

*The aforementioned targets are the average targets set by the respective firms.

CoinPedia’s HYPE Price Projection

This Layer-1 project has taken the crypto market by storm within a short time frame. With a market cap of over $7 billion, this altcoin has successfully secured a position in the top 25. Moreover, with the mass adoption, this altcoin could claim a spot in the top 10 during the upcoming bull run.

If the bullish sentiment intensifies, the Hyperliquid price will reach a high of $41.39 this year. On the flip side, if the market experiences unfavorable events, this could result in this altcoin settling at a low of $14.65.

YearPotential LowPotential AveragePotential High
2025$14.65$28.02$41.39
Never Miss a Beat in the Crypto World!

Stay ahead with breaking news, expert analysis, and real-time updates on the latest trends in Bitcoin, altcoins, DeFi, NFTs, and more.

FAQs

What is Hyperliquid (HYPE) and why is it gaining popularity?

Hyperliquid is a fast, decentralized trading platform with no KYC and low fees, making HYPE popular among traders seeking speed and independence.

What is the Hyperliquid (HYPE) price prediction for 2026?

HYPE price in 2026 is projected to range between $25 and $90, with an average near $60 if adoption and trading volumes keep rising.

What could HYPE be worth by 2030?

Long-term projections suggest HYPE might reach an average of $125 by 2030, with possible highs near $185 if platform usage keeps expanding.

Is Hyperliquid (HYPE) a good long-term investment?

HYPE may appeal to long-term investors due to strong platform growth, but like all crypto, it carries risk and requires careful research.

Avalanche Price Prediction 2026, 2027 – 2030: Will AVAX Price Hit $100?

Avalanche Price Prediction

The post Avalanche Price Prediction 2026, 2027 – 2030: Will AVAX Price Hit $100? appeared first on Coinpedia Fintech News

Story Highlights

  • The live price of the Avalanche is  $ 8.88929091.
  • Price predictions for 2026 range from $400 to $600.
  • Long term outlook suggests gradual growth potential to approach $1200 by 2030.

Aave (AAVE) is a decentralized finance protocol built on Ethereum that facilitates permissionless lending and borrowing through smart contracts. After witnessing a strong expansion in the previous market cycle, AAVE entered a prolonged correction phase, with price gradually retracing from its earlier highs. Throughout 2025, AAVE remained in a consolidation structure, reflecting a period of market digestion rather than trend continuation. While short-term momentum has cooled, the broader technical structure suggests that AAVE may be transitioning into a new accumulation phase. 

As volatility contracts and price holds above long-term demand levels, attention is now shifting toward whether 2026 can trigger the next major price discovery cycle.

Avalanche Price Today

Cryptocurrency Avalanche
Token AVAX
Price $8.8893 down -1.72%
Market Cap$ 3,838,146,567.91
24h Volume$ 158,151,029.1316
Circulating Supply431,771,961.1772
Total Supply463,441,061.1772
All-Time High$ 146.2179 on 21 November 2021
All-Time Low$ 2.7888 on 31 December 2020

CoinPedia’s Avalanche Price Prediction

Currently, the Avalanche price is testing the $9 mark in March after hitting resistance at $15 in January. A recovery is expected in March, and projections for the first quarter of 2026 suggest it could regain previous levels. Experts are targeting $20, with a potential rise to $28. If it breaks through $28, it may reach $44 by mid-year. However, if $28 acts as strong resistance, consolidation may continue.

Avalanche (Avax) Price Prediction 2026

AVAX price prediction 2026

The price action of AVAX hasn’t been so great since its Q1 2024 high of $65; it has been in decline ever since. Most of 2024 and all of 2025 were in decline.

Even in 2026, this bearish momentum’s shadow didn’t lift; it worsened, with the broader market in turmoil. In January, the AVAX price faced rejection from $15 and slipped to $9 support zone after hitting a low of $7.53 in February. But things can change this time around. Since Q1 still has several days left, a recovery remains an option, as it has been testing a demand area of $9 that ignited the late 2024 rally. Sustained demand here could signal a reversal.

Now, expectations for its recovery, which are gaining momentum in Q1 2026, are significantly higher. Now, it appears AVAX may not have performed in the past two years, but it was all about establishing a base, and it seems it has done so. Now, an impressive rally ahead is a strong possibility.

For Q1, we expect $20 with potential to test the pattern’s upper border at $28. However, if it clears the upper border, we can expect AVAX to hit $44 by the end of the first half. But if $28 repels, then the first half could see consolidation stretching.

YearPotential LowPotential AveragePotential High
2026 (conservative)$25$33$50

AVAX On-Chain Analysis

AVAX shows a highly bullish sentiment. Big Whale Orders in both spot and futures indicate strong institutional accumulation. With Taker Buy Dominance at 90 days, aggressive buyers are in control, while the Cooling volume bubble map suggests a healthy consolidation phase. Collectively, major metrics point to a bullish rally ahead.

AVAX onchain analysis

Avalanche Price Prediction 2026 – 2030

YearPotential Low ($)Potential Average ($Potential High ($)
2026400500600
2027550690820
2028650830980
20297409501100
203082010001200

AAVE Price Forecast 2026

Looking ahead to 2026, AVAX’s potential price is anticipated to rise even further, with a projected low of $20.00 and a high of $80.00. The average price for AVAX in 2026 will likely be $50.00.

AAVE Price Prediction 2027

In 2027, the analysis suggests a continued upward trend in AVAX’s value, with the price potentially ranging between $31.50 and $126.50. Based on the calculated figures, the average price is projected to be approximately $79.00 during this period.

AAVE Prediction 2028

By 2028, AVAX’s price could potentially experience further growth, falling within the range of $50.50 and $202.50. The average price during this period, calculated from the data, is expected to be around $126.50.

AAVE Price Prediction 2029

Moving forward to 2029, AVAX’s price is predicted to ascend between $81.00 and $324.00. The average price during this period is estimated at around $202.50 based on calculated figures.

AAVE Price Prediction 2030

By 2030, AVAX’s price is forecasted to soar between $129.50 and $518.50. Further, the average price during this period, calculated from the data, could stand at $324.00.

AAVE Price Prediction 2031, 2032, 2033, 2040, 2050

Based on the historic market sentiments and trend analysis of the largest cryptocurrency by market capitalization, here are the possible AAVE price targets for the longer time frames.

YearPotential Low ($)Potential Average ($)Potential High ($)
203189011001350
203292012001500
2033110013501780
2040160022003000
2050260033004500

AAVE Price Prediction: Market Outlook?

Year202620272030
Changelly$500$750$1100
DigitalCoinPrice$480$680$1000
WalletInvestor$520$650$1250
Never Miss a Beat in the Crypto World!

Stay ahead with breaking news, expert analysis, and real-time updates on the latest trends in Bitcoin, altcoins, DeFi, NFTs, and more.

FAQs

Is AAVE a good investment for 2026?

AAVE shows long-term growth potential if it breaks key resistance levels. However, price depends on market conditions and DeFi adoption.

What should investors watch before buying AAVE?

Watch support near $135–$150, resistance above $250, overall market trend, and activity within the Aave protocol.

What could drive Avalanche (AVAX) price growth in the coming years?

Key drivers include DeFi expansion, institutional adoption, subnet growth, and overall crypto market recovery cycles.

What is the AVAX price prediction for 2026?

The AVAX price prediction for 2026 suggests a potential range between $400 and $600 if market momentum and network growth remain strong.

What is the AVAX coin price prediction for 2030?

AVAX coin price prediction for 2030 points to a possible range of $820 to $1,200, assuming sustained adoption and favorable market conditions.

What is the Avalanche price prediction for 2040?

Avalanche price prediction for 2040 estimates a broad range between $1,600 and $3,000 if long-term blockchain adoption accelerates globally.

AVAX
BINANCE

Hyperliquid Price Prediction: $680M Inflows and Falling Wedge Breakout Hint at $58 Target

Hyperliquid Unstakes 140K HYPE Tokens

The post Hyperliquid Price Prediction: $680M Inflows and Falling Wedge Breakout Hint at $58 Target appeared first on Coinpedia Fintech News

Hyperliquid price is gaining fresh momentum this week as the HYPE token trades near the $30 region, while nearly $680 million in capital inflows has entered the network. This surge in activity is now strengthening the broader Hyperliquid price prediction narrative among traders and analysts.

The rapid rise in liquidity, combined with strong protocol revenue and expanding derivatives trading activity, has pushed the decentralized trading platform into the spotlight across the crypto market.

With improving fundamentals and strengthening technical signals, traders are increasingly asking: Could Hyperliquid price rally toward the $55–$58 range in the coming weeks?

Hyperliquid Sees $680M Weekly Capital Inflows

One of the biggest catalysts supporting the current Hyperliquid price prediction outlook is the sharp increase in capital entering the ecosystem.

According to data from blockchain analytics platform Artemis, Hyperliquid recorded around $680 million in net inflows during the past week, making it the top-performing blockchain network in terms of capital growth during that period. 

Hyperliquid inflows

The platform outpaced several major ecosystems including Ethereum, Polygon, and Arbitrum, which followed behind in weekly inflows.

Large capital inflows typically indicate growing investor confidence and expanding liquidity, both of which tend to support stronger price momentum for network tokens. For derivatives-focused platforms like Hyperliquid, rising liquidity is particularly important because it improves market depth, trading efficiency, and platform usage. The latest inflow surge suggests that traders are increasingly viewing Hyperliquid as a rapidly growing infrastructure layer for decentralized derivatives trading.

Hyperliquid Price Analysis: Falling Wedge Breakout Signals Potential Rally

Hyperliquid price is beginning to show signs of a bullish reversal. The HYPE token had previously been trading inside a descending price structure, reflecting the broader consolidation phase seen across the crypto market in recent months.

Hyperliquid price prediction

However, recent price action indicates that Hyperliquid price is attempting to break out of a falling wedge pattern, a structure commonly viewed by analysts as a bullish reversal formation. Following the breakout attempt, the token is currently consolidating near the $30–$32 region, which is starting to act as an important short-term support zone. Immediate resistance sits around $32, a level that has capped several recent upward attempts. A strong breakout above this region could accelerate bullish momentum.

Based on the projected move from the wedge pattern, analysts are watching a potential upside target in the $55–$58 range, which would represent a major expansion if buying pressure continues.

Hyperliquid Leads Blockchains in Fee Generation

Another factor strengthening the Hyperliquid price outlook is the network’s rising protocol revenue. Recent data shows Hyperliquid generating approximately $1.7 million in fees within a single 24-hour period, making it the highest fee-generating blockchain during that timeframe.

The protocol managed to outperform several major networks including Ethereum, TRON, and BNB Chain, highlighting the scale of trading activity currently taking place on the platform.

Hyperliquid fees

In blockchain ecosystems, rising fee generation is widely considered a strong indicator of real network demand and user engagement. Higher fees typically reflect growing trading volume, deeper liquidity, and increasing adoption of the platform’s services. For Hyperliquid, this surge in protocol revenue suggests the platform is quickly evolving into one of the most actively used decentralized trading ecosystems in the crypto market.

Final Thoughts 

Hyperliquid is rapidly emerging as one of the fastest-growing ecosystems in decentralized derivatives trading. Strong capital inflows, rising protocol revenue, and expanding platform activity are reinforcing its long-term fundamentals. At the same time, Hyperliquid price is forming a bullish technical structure that could support further upside. If the token maintains support above the $30 zone and successfully clears the $32 resistance level, the current setup may evolve into the next major rally for the HYPE token.

FAQs

What is driving Hyperliquid’s recent price surge?

Hyperliquid’s price is rising due to $680M capital inflows, strong protocol revenue, and growing derivatives trading activity on the platform.

What is the current support and resistance for HYPE token?

HYPE token is consolidating near $30–$32, with $30 acting as support and $32 as immediate resistance for potential upside moves.

Why is rising protocol revenue important for Hyperliquid?

Higher revenue reflects growing trading volume, deeper liquidity, and increased platform adoption, supporting long-term token value.

Why Are Bitcoin, Ethereum, and XRP Prices Crashing Today? US‑Iran War Fears Drive Sell‑Off

Why Are Bitcoin Ethereum and XRP Prices Crashing Today?

The post Why Are Bitcoin, Ethereum, and XRP Prices Crashing Today? US‑Iran War Fears Drive Sell‑Off appeared first on Coinpedia Fintech News

The crypto market turned red again after Bitcoin’s price failed to hold above $74,000. The drop came as tensions grew in the ongoing U.S.–Israel and Iran conflict. The situation further intensified after a White House official said the U.S. wants to cut off Iran’s oil revenues.

Other major cryptocurrencies, including ETH, XRP, Solana, and Dogecoin, are also down by around 3% to 5%.

U.S. Wants to Cut Iran’s Oil Revenues, Iran Won’t Surrender

The recent market drop came after a White House official said the U.S. wants to stop Iran from using its oil money to fund groups like the Islamic Revolutionary Guard Corps (IRGC). The plan aims to limit Iran’s oil sales, which are the country’s main source of income.

Yesterday, Donald Trump also posted on Truth Social, saying there would be no deal with Iran unless it agrees to an unconditional surrender.

This recent response from white house and Trump came in response to Iranian  President Masoud Pezeshkian rejecting the demand and saying Iran would never surrender.

These strong statements have increased fears of growing this war into a bigger conflict.

Bitcoin Price Drop, Now Eying $55K Level

Tensions between the U.S. and Iran are rising, and this is adding pressure to the crypto market. Bitcoin erased most of the gains it had recently made. The digital asset dropped roughly 4%, pushing the price below $68,000 and reducing the total crypto market value.

Popular crypto trader Captain Faibik points to a bearish flag pattern forming on the 8-hour chart of Bitcoin. After the sharp drop earlier, the price has been moving inside an upward-sloping channel.

BTCUSDT 8H Chart

If Bitcoin breaks below the lower support of the flag with strong volume, it could confirm the bearish continuation pattern. According to this setup, the next major downside target sits near the $55,000 level.

Altcoins Also Slide as Risk Appetite Drops

The decline is not limited to Bitcoin. Ethereum has dropped below $2,000, falling about 4%, while XRP is hovering around $1.37. Meanwhile, Solana, Cardano, and Dogecoin have also slipped, each losing roughly 3% to 5%.

The rising tensions hint that neither side is ready to step back, increasing uncertainty for both the traditional and the crypto market.

Never Miss a Beat in the Crypto World!

Stay ahead with breaking news, expert analysis, and real-time updates on the latest trends in Bitcoin, altcoins, DeFi, NFTs, and more.

FAQs

How does the U.S.–Iran conflict affect cryptocurrency prices?

Geopolitical tension fuels market fear, causing Bitcoin and altcoins to drop as investors avoid high-risk assets.

Can crypto act as a safe haven during the U.S.–Iran tensions?

Crypto is volatile; while some view it as a hedge, rising conflict often triggers short-term sell-offs.

Which altcoins are most sensitive to global conflicts?

Bitcoin, Ethereum, and XRP usually react first, with smaller altcoins following as risk appetite declines.

Could the U.S.–Iran conflict trigger a broader crypto market crash?

Escalating conflict can intensify fear, potentially pushing major cryptocurrencies lower if uncertainty persists.

MakerDAO’s Black Thursday: How One Bot Got $8.32M in ETH for Free

MakerDAO (MKR) Defies Market Trend, Poised for 50% Surge

The post MakerDAO’s Black Thursday: How One Bot Got $8.32M in ETH for Free appeared first on Coinpedia Fintech News

On March 12, 2020, one bot acquired $8.32 million worth of ETH and paid absolutely nothing for it. There was no hack and no exploit. Just a broken assumption inside one of DeFi’s most trusted protocols and a 40-minute window that nobody saw coming.

Here’s the story.

What MakerDAO’s System Was Built to Do

MakerDAO lets users lock ETH as collateral to borrow DAI. When that collateral loses too much value, the vault gets liquidated through an on-chain auction. Bots called keepers bid DAI to purchase the collateral, the debt gets covered, and the protocol stays solvent.

The entire mechanism relied on one assumption holding true: that competing bots would always show up.

The 40 Minutes That Broke DeFi

ETH dropped 43% in hours that day. Hundreds of vaults went underwater at the same time, and every keeper bot on the network tried to respond at once. Ethereum could not handle the traffic. Gas prices spiked 10x and most keeper bots ran on fixed gas settings, leaving their transactions stuck in the mempool and going nowhere.

Auctions were opening and nobody was bidding.

One bot noticed. It submitted a bid of 0 DAI, waited out the timer, and collected real ETH for free when no competing bids arrived. Then it did it again. For nearly 40 minutes, that one bot swept auction after auction at zero cost, walking away with $8.32 million in ETH before the network stabilized and other bots could get back in.

Also Read: Did the Clarity Act Pass? Not Yet, But Banks Are Already Buying These 8 Altcoins

MKR Holders Paid the Price

MakerDAO was left with $4.5 million in bad debt, something the protocol had never faced before. MKR holders voted to mint new tokens and sell them into the open market just to cover the shortfall, diluting every existing holder in the process.

The contract had done exactly what it was coded to do. The auction ran correctly. The bot followed the rules.

As one observer summed it up in the thread that is now going viral on X: “The protocol didn’t break because the rules were wrong. It broke because the design assumed continuous market participation at the exact moment the market became least functional.”

Why the Story Still Matters

Analysts say every major DeFi liquidation system built after 2020 traces its risk design back to one 40-minute window. Black Thursday changed how the entire industry approaches risk when liquidity, bots, and block space fail all at once.

With DeFi liquidations back in the headlines and billions under pressure with the ongoing US-Israel-Iran war, the lesson is hitting differently right now.

CLARITY Act Gains Momentum Again: What the Proposed U.S. Crypto Bill Means for Bitcoin and Regulation

CLARITY Act

The post CLARITY Act Gains Momentum Again: What the Proposed U.S. Crypto Bill Means for Bitcoin and Regulation appeared first on Coinpedia Fintech News

During the current crypto market downturn, the proposed CLARITY Act is gaining renewed attention in the United States. The bill aims to create clear rules for digital assets and determine which government agencies will regulate different parts of the crypto industry.

Kristin Smith believes the legislation could pass by July 2026, although the political process remains complex. Her timeline is similar to projections from analysts at JPMorgan, who also expect the bill to be approved around mid-year.

However, some industry leaders are even more optimistic. Brad Garlinghouse previously suggested that the chances of the bill passing could reach 90% by April, reflecting strong confidence within parts of the crypto sector.

What Went Wrong?

Despite early optimism, the CLARITY Act briefly lost momentum earlier this year. The turning point came when Brian Armstrong withdrew support for the legislation, arguing that parts of the proposal appeared to favor the traditional banking sector.

The sudden criticism created uncertainty across the industry and raised concerns that the window for passing the bill in 2026 could close. For a time, many believed the proposal might stall entirely.

Political Challenges Still Remain

Even with renewed momentum, passing a standalone crypto bill in Washington remains difficult. Unlike other legislation, the CLARITY Act cannot easily be attached to larger government spending bills without bipartisan support.

The proposal also faces criticism from lawmakers such as Elizabeth Warren, a vocal critic of the crypto industry. However, support from leaders like Chuck Schumer and Ruben Gallego could help move the bill forward in Congress.

Meanwhile, the administration of Donald Trump has also become increasingly involved. Advisors such as David Sacks and Patrick Witt are reportedly working to resolve key policy issues.

Bull vs Bear Scenarios for Crypto

If the CLARITY Act passes, many analysts believe it could create a bullish environment for crypto by providing regulatory clarity that attracts institutional investors. Clear rules could encourage banks, asset managers, and traditional finance firms to expand their crypto offerings.

However, a bearish scenario remains possible if political disagreements delay the bill or significantly alter its structure. Prolonged uncertainty could keep institutional capital cautious and slow adoption in the U.S. market.

Time to Buy the Dip?

Market analysts also note that regulatory developments often influence Bitcoin sentiment. Crypto analyst Ted Pillows recently pointed out that Bitcoin slipping below $68,000 may trigger a retest of the $65,000–$66,000 support zone unless it quickly reclaims the $70,000 level.

Historically, major regulatory milestones have followed a “buy the rumor, sell the news” pattern, meaning markets often rally before major announcements and consolidate afterward. If the CLARITY Act advances in the coming months, traders may once again position themselves ahead of the official decision.

Never Miss a Beat in the Crypto World!

Stay ahead with breaking news, expert analysis, and real-time updates on the latest trends in Bitcoin, altcoins, DeFi, NFTs, and more.

FAQs

When could the CLARITY Act pass in the United States?

Industry leaders expect the bill could pass by July 2026, though political negotiations and bipartisan support will determine the final timeline.

How could the CLARITY Act impact the crypto market?

If passed, the bill could boost investor confidence by creating clear regulations, potentially encouraging institutions to expand crypto investments.

How might the market react if the CLARITY Act passes?

Clear crypto rules could attract institutional capital and improve market sentiment, though short-term volatility may occur as traders react to the news.


Crypto Market Crash: $302M Liquidations as Bitcoin, Ethereum Drop Amid Iran Tensions

Crypto Market Crash

The post Crypto Market Crash: $302M Liquidations as Bitcoin, Ethereum Drop Amid Iran Tensions appeared first on Coinpedia Fintech News

The crypto market remained under pressure as a mix of geopolitical tensions, macroeconomic concerns, and rising oil prices pushed investors away from risk assets. Over the past 24 hours, the market recorded more than $302.75 million in liquidations, accelerating the recent sell-off across major cryptocurrencies.

The global crypto market capitalization slipped to around $2.33 trillion, marking a 3.4% decline. This freefall highlights how global instability continues to influence investor sentiment across digital assets.

Iran’s Response Escalates Geopolitical Risks

The latest decline followed strong remarks from Masoud Pezeshkian, who declared that Iran “will not surrender” amid the ongoing conflict.

Pezeshkian reportedly said that enemies should“take their wish for the unconditional surrender of the Iranian people to their graves,” signaling Tehran’s firm stance against external pressure. The comments have heightened fears of a wider regional conflict, pushing investors away from risk assets such as cryptocurrencies.

Weak US Jobs Data Adds Pressure

Another reason behind the freefall is the disappointing U.S. labor data. According to the Bureau of Labor Statistics, nonfarm payrolls dropped by around 92,000 jobs, signaling a potential slowdown in the labor market.

The weaker employment report added to market concerns, as investors had already anticipated increased volatility ahead of the data release.

Crypto Prices Turn Red

Amid rising geopolitical risk, the global crypto market capitalization fell to around $2.33 trillion, marking a 3.4% decline over the past day.

Major cryptocurrencies reflected the broader market drop:

  • Bitcoin declined nearly 5%, trading around $67,947.
  • Ethereum dropped 4.75% to about $1,984.
  • XRP slipped 2.67%, trading near $1.37.
  • Solana fell 4.4% to roughly $84.57.

The sell-off highlights how global political uncertainty continues to influence investor sentiment across digital assets.

Another Sell-Off?

On-chain data suggests that short-term Bitcoin holders were responsible for much of the recent selling pressure. According to CryptoQuant analyst Darkfost, more than 27,000 BTC worth roughly $1.8 billion was transferred to exchanges in profit within a single day, marking one of the largest spikes in recent months.

These investors typically react quickly to macro developments. Data shows the only short-term holders currently in profit are those who accumulated Bitcoin between one week and one month ago at a realized price close to $68,000, suggesting some traders are locking in gains rather than extending positions.

Never Miss a Beat in the Crypto World!

Stay ahead with breaking news, expert analysis, and real-time updates on the latest trends in Bitcoin, altcoins, DeFi, NFTs, and more.

FAQs

Why is crypto crashing today?

Crypto is falling due to rising geopolitical tensions, weak U.S. jobs data, and risk-off sentiment, triggering over $302M in liquidations across the market.

How low could the crypto market go in the current correction?

If selling pressure continues, Bitcoin could test key support near $65K or lower. Market direction will depend on macro news, investor sentiment, and liquidity.

When could the crypto market start recovering?

Recovery may begin once macro uncertainty eases and selling slows. Historically, markets stabilize after liquidation-driven corrections.

Is the current crypto market drop a correction or a bigger crash?

For now, it appears to be a short-term correction driven by macro events and profit-taking. Long-term trends depend on adoption and broader market conditions.

What signals could indicate a crypto market recovery?

Signs include lower exchange inflows, stabilizing Bitcoin prices, easing geopolitical tensions, and stronger economic data improving investor confidence.

“War Is Profitable”: Will Silver Price Rally Because of the US-Israel-Iran War?

Robert Kiyosaki Buys Silver Eagles as Market Cools After Rally

The post “War Is Profitable”: Will Silver Price Rally Because of the US-Israel-Iran War? appeared first on Coinpedia Fintech News

Robert Kiyosaki is in Vietnam right now, and his latest post is going viral.

The Rich Dad Poor Dad author took to X today to make a case he’s been building for years – that war isn’t just a human tragedy, it’s a financial system. And that system runs, in part, on silver.

What Kiyosaki Actually Said

Kiyosaki pointed out that modern rockets carry between half a pound and four pounds of silver each, which is metal that’s gone the moment they detonate.

“Silver stackers get richer as people on both sides pay the price in blood, sweat, tears, and money,” he wrote.

He leaned on Eisenhower’s warning about the military industrial complex to make the point: the people supplying war profit from it. The people fighting it don’t.

It’s not a new argument. But with the US-Israel-Iran conflict actively escalating, the timing is important.

Silver Has Surged 150% Since Last Year

Silver has surged more than 150% year-on-year, climbing from around $32 per ounce in 2025 to above $80 in early 2026. Safe-haven demand is rising alongside fears around the Strait of Hormuz, which handles a significant chunk of global oil shipments.

Kiyosaki has publicly called for silver to reach $200 in 2026. The war is making that prediction look a lot less extreme.

Where Silver Stands Right Now

Silver is trading at $84.33, up 2.51% in the last 24 hours.

The metal hit a record $116 in late January before crashing nearly 40% to $70.90 in early February. The Iran conflict actually worked against silver for much of last week – rising oil prices stoked inflation fears, pushing the dollar higher and delaying Fed rate cut expectations to late 2026. Non-yielding assets like silver took the hit.

Friday’s jobs report changed the mood fast. A surprise drop of 92,000 in non-farm payrolls and unemployment rising to 4.4% raised the chances of earlier rate cuts and silver bounced.

The Crypto Connection

Kiyosaki didn’t mention Bitcoin in today’s post, but his broader thesis has always tied all three together – gold, silver, and Bitcoin as protection against what he calls “fake money.”

When governments spend big on war, they print to cover it. That erodes purchasing power. That’s the exact setup Kiyosaki has argued pushes real assets higher.

He closed his post with this: “Today I fight for peace and freedom, and real financial education… not war.”

Also Read: Crypto Crash Today: Should You Buy the Bitcoin Dip as US and Israel Strike Iran?

U.S. Economy Loses 92,000 Jobs, Fueling Speculation of Fed Rate Cuts

Fed rate cut expectations

The post U.S. Economy Loses 92,000 Jobs, Fueling Speculation of Fed Rate Cuts appeared first on Coinpedia Fintech News

Fresh U.S. labor market data has intensified expectations that the Federal Reserve may soon move toward rate cuts after the economy shed around 92,000 jobs, signaling cooling employment conditions.

The data from the Bureau of Labor Statistics pushed unemployment to roughly 4.4%, raising concerns about a broader slowdown.

Following the report, Michelle Bowman acknowledged the labor market may require support.

“I was comfortable holding rates earlier this year,” Bowman said, adding that the latest data confirms that labor conditions are weakening and could benefit from policy easing. 

When Could the Fed Start Cutting Rates?

As per earlier plans, there was no rate cut in March, but looking at the labor market scenario, the next policy decision from the Federal Reserve is scheduled for March 17–18, as per a Bloomberg report. However, most economists expect officials to wait before making their first rate cut. Several analysts believe policymakers may hold rates steady until mid-year or later to confirm whether the labor slowdown persists while ensuring inflation pressures remain contained.

According to Christopher Waller, future rate decisions will depend heavily on incoming employment data and inflation trends, suggesting the central bank will remain cautious.

However, the prediction markets show the odds of a March Fed rate cut rising by 2% points to 4.7%, with some platforms also indicating minor expectations of a small policy adjustment.

Bitcoin’s Next Move?

Crypto markets are closely watching Fed policy because interest rates influence global liquidity and risk appetite. Crypto analyst Arthur Hayes has argued that potential rate cuts and renewed monetary easing could ultimately benefit Bitcoin, as cheaper money often pushes investors toward alternative assets.

Hayes has repeatedly suggested that liquidity expansion from central banks could drive the next major crypto rally, although short-term volatility may occur if economic conditions deteriorate further.

How does the Community See This?

The latest economic data has also triggered debate among economists and market watchers.

In discussions on Reddit’s r/Economics community, some users argued that cutting rates too soon could worsen inflation, particularly amid oil price shocks and other cost pressures.

Others suggested the Fed may wait until summer before taking action, especially if unemployment remains below 5%, a level many see as a key policy threshold.

Key Implications for Investors

A shift toward lower interest rates could significantly influence global markets:

  • Stocks: Growth sectors may benefit from cheaper borrowing costs.
  • U.S. Dollar: A dovish Fed stance could weaken the dollar, supporting commodities.
  • Bond Markets: Rate cuts could push bond yields lower while boosting prices.
  • Energy and Inflation-Sensitive Assets: Volatility may ease if inflation pressures from oil stabilize.

With economic signals remaining mixed, investors are closely monitoring Fed communication and upcoming data releases to gauge when the first rate cut could arrive, and how markets, including Bitcoin, may react.

Never Miss a Beat in the Crypto World!

Stay ahead with breaking news, expert analysis, and real-time updates on the latest trends in Bitcoin, altcoins, DeFi, NFTs, and more.

FAQs

When could the Federal Reserve start cutting interest rates?

While no cut occurred in March, many economists expect the Fed may wait until mid-2026 or later, depending on labor market trends and whether inflation continues easing.

How do Federal Reserve rate cuts affect Bitcoin?

Lower interest rates increase market liquidity and risk appetite, which can push investors toward alternative assets like Bitcoin and potentially support crypto prices.

Why is the Fed cautious about cutting interest rates quickly?

The Fed wants to confirm the labor slowdown while ensuring inflation remains under control, since cutting rates too early could trigger renewed price pressures.

Bitcoin Bottom Near? 5 On-Chain Signals Suggest the Bitcoin Price Bottom

Will Bitcoin Recover or Crash to $40K Next Analysts Can’t Agree

The post Bitcoin Bottom Near? 5 On-Chain Signals Suggest the Bitcoin Price Bottom appeared first on Coinpedia Fintech News

Bitcoin has entered March under heavy uncertainty. After weeks of volatile trading and macro-driven market pressure, Bitcoin price is hovering around the $70,000 region, leaving investors divided over whether the correction is over or if another drop lies ahead. Sentiment across the crypto market remains fragile, yet on-chain data is beginning to tell a different story. Several key metrics, many of which have historically appeared near major turning points, are now flashing signals that often emerge around a Bitcoin bottom or Bitcoin price bottom formation.

So the big question remains: Is the Bitcoin bottom already forming? Here are five on-chain signals suggesting the Bitcoin price bottom could be closer than many traders expect.

A Historic Bitcoin Exodus from Exchanges

One of the clearest signals pointing toward a potential Bitcoin bottom comes from exchange flow data. Nearly 31,900 BTC, worth around $3 billion, was withdrawn from exchanges in a single day, marking one of the largest outflow events seen this year.

Bitcoin exchange data

When Bitcoin leaves exchanges at this scale, it usually indicates investors are moving coins into long-term storage rather than preparing to sell. Reduced supply on exchanges often appears during accumulation periods when experienced investors begin positioning for future price appreciation.

Historically, large exchange outflows have appeared near Bitcoin price bottom zones, when institutional and long-term investors accumulate while market sentiment remains pessimistic.

Short-Term Holder Selling Signals Capitulation

Another important signal comes from short-term holder behavior, which often reflects emotional reactions to market volatility. Recent data shows that more than 27,000 BTC in profit was sent to exchanges by short-term holders, one of the largest readings in recent weeks. Most of these coins were accumulated between one week and one month ago, with a realized price near $68,000.

BTC STH DATA

Short-term holders typically react quickly to uncertainty, often selling during corrections. Historically, this type of selling pressure tends to appear near Bitcoin price bottom formations, when weaker hands exit the market.

Rather than signaling structural weakness, the activity may represent a classic capitulation phase, where reactive traders sell while long-term investors quietly accumulate.

Long-Term Holders Are Accumulating Again

Long-term holder behavior is widely considered one of the most reliable indicators of a Bitcoin bottom. On-chain data now shows that long-term holders are accumulating Bitcoin at the fastest pace since July 2025, ending nearly eight months of steady distribution.

BTC LTH DATA

This group typically consists of experienced investors who accumulate during undervalued periods and distribute near market peaks. Historically, when long-term holders shift from selling to aggressive buying, Bitcoin often enters a macro accumulation phase that precedes the next major rally. The recent shift suggests these investors may believe the market is approaching a Bitcoin price bottom zone

Inter-Exchange Flow Pulse Golden Cross Appears

Another signal comes from the Inter-Exchange Flow Pulse (IFP) indicator, which tracks Bitcoin movement between spot exchanges and derivatives markets.

BTC on chain

The indicator recently formed a golden cross, a signal that has historically preceded strong bullish phases in the Bitcoin market. Golden cross events in this indicator typically appear after extended consolidation or re-accumulation periods, suggesting market participants are shifting back toward spot accumulation rather than speculative derivatives activity. Analysts believe the signal could indicate that the current re-accumulation phase is nearing completion.

Bitcoin Holding the 2021 All-Time High Support

Bitcoin is currently trading near one of the most historically significant levels in its price structure, the 2021 all-time high region. This level has transitioned from major resistance into a long-term support zone, reinforcing the argument that the broader market structure remains strong despite recent corrections.

Bitcoin Price Bottom

Bitcoin price is also moving within a descending channel pattern, a formation that often appears during consolidation phases before bullish breakouts once selling pressure fades. If Bitcoin continues to hold above this region, analysts argue it could strengthen the case that the market is forming a macro Bitcoin price bottom, potentially laying the foundation for the next expansion phase of the cycle.

Final Words

Markets rarely confirm a bottom in real time, but several on-chain signals are beginning to align. Massive exchange outflows, renewed buying from long-term holders, and strong technical support near historic levels are patterns often seen around a Bitcoin bottom. While volatility may persist in the short term, the current data suggests Bitcoin could be stabilizing near a potential Bitcoin price bottom, with investors closely watching whether the market can defend key support levels in the coming weeks.

Did the Clarity Act Pass? Not Yet, But Banks Are Already Buying These 8 Altcoins

U.S. CLARITY Act Delayed as Banks Oppose Stablecoin Rewards, ALL Eye On April 16

The post Did the Clarity Act Pass? Not Yet, But Banks Are Already Buying These 8 Altcoins appeared first on Coinpedia Fintech News

Crypto analyst Tim Warren is sounding the alarm.

In arecent video, Warren laid out why banks aren’t waiting for the Clarity Act to pass before accumulating select altcoins. With Polymarket odds on passage climbing from 56% to 71% in a single week and Trump calling out banks on Truth Social for holding the bill “hostage,” – the window is narrowing fast. The Senate Banking Committee is targeting a vote in the second half of March.

Smart money, it seems, is already moving.

Where Is the Money Going?

The thesis is straightforward: regulatory clarity unlocks institutional mandates. And two themes are driving which coins banks are targeting – stablecoin regulation and real-world asset (RWA) tokenization.

Warren points to 8 altcoins sitting in that institutional crosshairs.

The 8 Altcoins on the List

Ethereum ($1,981) and Solana ($84.47) lead as the stablecoin infrastructure plays. Both are foundational layer-1s that benefit directly from stablecoin regulation – ETH sits 60% below its ATH, SOL 71% below. Warren puts the move back to highs at 184% and 332%, respectively.

XRP ($1.37) has already cleared its biggest hurdle, which is winning the case against the SEC. With the Senate draft legislation reportedly classifying it as a “non-ancillary asset” alongside BTC and ETH, XRP is positioned as the cross-border payment rail banks actually want. Some analysts are citing $10-$15 speculative targets.

Chainlink ($8.78) is the infrastructure play that wins regardless of which chain dominates. As Warren put it, Chainlink will be used to bring information “from the web two to the web three world in every situation.” Currently 83% below its ATH of $52.88, with long-term targets of $300-$500 floated for 2030. Warren considers it the most durable hold on the list.

HBAR ($0.0966) is pitched as potentially the largest RWA beneficiary on the list, with early institutional adoption already underway. It is currently 83% below its all-time high of $0.57. Warren recommends diversifying across both HBAR and Chainlink for RWA exposure.

Canton Network ($0.1529) targets private institutional-ledgers and real-world asset data, with early bank adoption already in motion. It is framed as a longer-term conviction hold.

Uniswap ($3.83) carries one signal above all others: BlackRock has already invested. Around 600% to its 2024 ATH. As Warren noted, “If BlackRock’s buying, pretty convincing that I should be buying it as well.” UNI sits 91% below its ATH of $44.97.

Ondo Finance ($0.25) is the highest-risk, highest-upside entry. Down roughly 88% from its $2.14 ATH, yet over 60% of RWA conversions still run through Ondo.

Check live prices on Coinpedia.

What Crypto Investors Should Know

This isn’t a “buy the bottom” call. The strategy is DCA accumulation over time.

As Warren put it: “Don’t just think about next week or the month after. Think about the next couple of years. That is how truly wealthy people think.”

The Clarity Act vote is coming. The question is whether you’re positioned before or after the crowd figures that out.

Never Miss a Beat in the Crypto World!

Stay ahead with breaking news, expert analysis, and real-time updates on the latest trends in Bitcoin, altcoins, DeFi, NFTs, and more.

FAQs

What is the Clarity Act in crypto regulation?

The Clarity Act is a proposed U.S. law designed to define how digital assets are regulated, giving clearer rules for banks, investors, and crypto companies.

How could the Clarity Act benefit the crypto market?

Clear regulations may allow banks and institutions to invest in crypto more confidently, potentially increasing liquidity and broader adoption.

How has the market reacted to growing Clarity Act expectations?

Rising expectations of the bill have fueled speculation that institutions may begin positioning early in key crypto assets.

What future developments could follow the Clarity Act?

The law could pave the way for clearer stablecoin rules, real-world asset tokenization frameworks, and greater institutional participation in crypto markets.

Tether and Bitfinex Face Class Action Over Alleged Bitcoin and Ethereum Price Manipulation

Tether Freezes $4.2B in USDT to Fight Crime

The post Tether and Bitfinex Face Class Action Over Alleged Bitcoin and Ethereum Price Manipulation appeared first on Coinpedia Fintech News

On 6 March 2026, the U.S. federal court allowed the Tether, Bitfinex Crypto Case to move forward as a class action. However, the investor’s case claims that both companies manipulated Bitcoin and Ethereum prices during the 2017 crypto boom using newly issued USDT tokens.

Tether, Bitfinex Crypto Case Moves Forward

A federal judge in New York approved class action status in an ongoing lawsuit against Tether and Bitfinex. The decision made by U.S. District Court Judge Katherine Polk Failla allowed thousands of investors to join the lawsuit instead of filing individual claims.

The judge divided the plaintiffs into two groups to manage the case more efficiently. One group represents investors who bought cryptocurrencies directly in the spot market, while the second group includes traders who used futures contracts.

Tether. The largest financial fraud in history.

You’re welcome. pic.twitter.com/Tu8VdGfOk9

— Bitfinex'ed 🔥🐧 Κασσάνδρα 🏺 (@Bitfinexed) March 6, 2026

Meanwhile, the judgment of this case does not determine whether the companies broke the law. However, it allows the case to move forward toward further legal proceedings.

Lawsuit Claims USDT Were Issued To Manipulate BTC & ETH Price

Investors claim that large amounts of Tether (USDT) were issued between 2017 and 2019 without proper backing. According to the complaint, these tokens were allegedly used to buy Bitcoin and Ethereum, pushing prices higher & creating a market bubble.

The plaintiffs argue that the manipulation caused artificial price inflation during the historic 2017 bull run.

When the market later corrected, many investors suffered heavy losses. Some estimates suggest the alleged manipulation may have caused billions of dollars in damages across the crypto market.

Both Tether and Bitfinex have strongly denied the accusations. The companies say the lawsuit is based on incorrect assumptions and misunderstand how USDT issuance and trading activity work.

What’s Next in the Tether and Bitfinex Lawsuit?

Now that the class action status is approved, the case will move to the next stage, where both sides will present evidence.

For now, the court is reviewing parts of the judge’s sealed opinion. Lawyers from both sides must submit their proposals by March 9. 

Meanwhile, any major ruling could affect future rules on stablecoin transparency and market practices.

Never Miss a Beat in the Crypto World!

Stay ahead with breaking news, expert analysis, and real-time updates on the latest trends in Bitcoin, altcoins, DeFi, NFTs, and more.

FAQs

What is the history behind the Tether and Bitfinex lawsuit?

The lawsuit stems from the 2017 crypto bull run, when investors claimed large USDT issuances were used to buy Bitcoin and Ethereum and artificially inflate prices.

Did the court rule that Tether and Bitfinex manipulated crypto prices?

No. The court only approved class action status, allowing thousands of investors to join the case while the court reviews evidence and legal arguments

What could happen next in the Tether and Bitfinex case?

The case now moves to the evidence phase. Both sides will present documents and arguments before the court decides whether the claims have merit.

Trump’s New Cyber Strategy Puts Crypto Under National Security Spotlight

Trump Cyber Strategy for America

The post Trump’s New Cyber Strategy Puts Crypto Under National Security Spotlight appeared first on Coinpedia Fintech News

The White House has released a new cybersecurity framework titled President Trump’s Cyber Strategy for America, outlining how the U.S. plans to strengthen its response to cyber threats.

The seven-page document focuses heavily on cyber offense and deterrence, while offering relatively few details on how the policies will actually be implemented. Despite its shorter format, the strategy marks a major development for the crypto industry.

For the first time, cryptocurrency and blockchain technologies are explicitly mentioned as systems that must be “protected and secured.”

How It Differs From Previous Cyber Strategies

According to crypto policy analyst Alex Thorn, the new strategy is significantly shorter than previous cybersecurity frameworks.

For example, the cybersecurity strategy released in 2023 under Joe Biden was around 35 pages long, nearly five times longer than the new document.

However, Thorn noted that the latest framework focuses more on high-level strategy rather than implementation details, raising questions about how some of the policies will actually be carried out.

He also pointed out that neither Biden’s cybersecurity strategy nor the 2025 National Security Strategy mentioned crypto or blockchain at all, making their inclusion in the new document a first for U.S. cyber policy.

Crackdowns on Mixers and Privacy Coins?

While the strategy recognizes blockchain infrastructure, Thorn highlighted that it also contains language that could lead to stricter regulatory enforcement.

Under Pillar 1, the policy states the government will “uproot criminal infrastructure and deny financial exit and safe haven.”

According to Thorn, when combined with a new executive order targeting transnational cybercrime, this language could be used to justify crackdowns on crypto mixers, privacy-focused cryptocurrencies, and unregulated crypto off-ramps often associated with illicit activity.

The executive order also establishes a new operational cell within the National Coordination Center to target international cybercrime groups and directs the Attorney General to prioritize related prosecutions.

The U.S. government estimates that cybercrime caused $12.5 billion in losses in 2024 alone, underscoring why enforcement has become a major focus.

Offensive Cyber Operations and AI Defense

Another major point of the strategy is expanded offensive cyber capabilities. The document states the U.S. “will not confine our responses to the cyber realm,” suggesting broader retaliation options against hostile networks.

It also proposes AI-powered cyber defense systems, including autonomous “agentic AI” capable of detecting and deceiving cyber attackers at scale.

However, Thorn noted that the strategy does not outline oversight frameworks or limits on data collection, raising questions about governance.

Implementation Questions Remain

Despite the ambitious goals, Thorn highlighted challenges around implementation. The Cybersecurity and Infrastructure Security Agency, the main civilian cybersecurity body, has faced budget cuts and still lacks a Senate-confirmed director.

Having said that, this could shift more operational power toward military and intelligence agencies.

Overall, the strategy expands cyber offense, introduces AI-driven defense, and brings crypto into national cybersecurity policy for the first time, a move that could shape future regulation and adoption.

Never Miss a Beat in the Crypto World!

Stay ahead with breaking news, expert analysis, and real-time updates on the latest trends in Bitcoin, altcoins, DeFi, NFTs, and more.

$14T Giant BlackRock Blocks Withdrawals After $1.2B Exit Requests

Is Ripple Powering BlackRock’s $100 Trillion Blockchain Vision?

The post $14T Giant BlackRock Blocks Withdrawals After $1.2B Exit Requests appeared first on Coinpedia Fintech News

World’s largest asset manager, BlackRock, with AUM of $14 trillion, has limited withdrawals from its $26 billion lending fund after investors rushed to pull out $1.2 billion, far above the allowed limit.

The move has raised liquidity concerns for BlackRock. Many in the financial world are now asking why the firm has limited withdrawals and 

Is BlackRock facing deeper financial pressure?

BlackRock Fund Limits Withdrawals to 5%

A private credit fund managed by BlackRock recently limited the amount of money investors could withdraw after requests exceeded its preset cap.

The fund, called the HPS Corporate Lending Fund, manages roughly $26 billion in assets. During the first quarter of 2026, investors asked to withdraw about $1.2 billion, which represents 9.3% of the fund’s total assets.

JUST IN: BlackRock’s $26B private credit fund is limiting how much investors can pull out, capping withdrawals at 5% even though investors asked for 9.3%

Blackstone’s similar fund processed a record “7.9% OF SHARES” of withdrawal requests this week, with the firm and employees… pic.twitter.com/VjQLyMVGJS

— SwanDesk (@SwanDesk) March 6, 2026

However, the fund only allows 5% of assets to be withdrawn each quarter to avoid liquidity pressure. As a result, BlackRock paid out roughly $620 million to investors, while the remaining withdrawal requests were postponed.

This means many investors who wanted to exit the fund were unable to access their full money immediately.

Why BlackRock Faced Withdrawal Issues?

BlackRock is facing withdrawal pressure mainly because of how its private credit funds work. These funds give long-term loans to mid-sized companies, and unlike stocks or bonds, these loans cannot be quickly sold in the market.

Because of this, it can be harder for BlackRock to quickly raise cash if many investors ask to withdraw their money at the same time.

Analysts say this is a common issue in private credit. Investors may expect easy withdrawals, but the loans inside the fund often take years to be repaid, which can create short-term liquidity pressure.

Other Private Credit Funds Under Pressure

The issue is not only with BlackRock. Other big private credit firms are also seeing more withdrawal requests.

For example, Blackstone faced high withdrawals and added about $400 million of its own money to support its fund. Blue Owl Capital also paused some withdrawals for a short time to manage cash.

These problems are happening as the private credit market has grown to about $1.8 trillion, becoming an important funding source for many companies.

What This Means for Crypto as BlackRock Holds Bitcoin and Ethereum

Financial analysts believe that BlackRock’s private credit fund limiting withdrawals is mainly a problem in traditional finance, not directly in crypto.

Meanwhile, BlackRock is also a major crypto holder. Through its ETFs, the firm holds about 775,740 BTC (around $53B) and 3.17 million ETH (about $6B). That means it controls a noticeable share of both Bitcoin and Ethereum supply.

For crypto markets, this situation is mostly a signal to watch. If large financial firms face liquidity stress, they sometimes sell liquid assets to raise cash.

Never Miss a Beat in the Crypto World!

Stay ahead with breaking news, expert analysis, and real-time updates on the latest trends in Bitcoin, altcoins, DeFi, NFTs, and more.

FAQs

Is BlackRock facing serious financial pressure from these withdrawals?

No major pressure—it’s a standard gate in private credit funds to match illiquid loans. BlackRock’s $14T AUM remains strong; this protects all investors from forced sales.

How do other private credit funds like Blackstone handle withdrawals?

Firms like Blackstone injected $400M of their own cash, while Blue Owl paused some payouts briefly. These gates ensure stability as loans mature over years, not days.

Does BlackRock’s fund issue affect its Bitcoin and Ethereum holdings?

Unlikely—crypto ETFs are highly liquid. Private credit stress is traditional finance-specific; BlackRock’s 775K BTC ($53B) and 3M ETH ($6B) positions stay insulated for now.

SushiSwap (SUSHI) Price Prediction 2026, 2027-2030: Future Outlook, Targets, and Long-Term Forecast

SushiSwap (SUSHI) Price Prediction

The post SushiSwap (SUSHI) Price Prediction 2026, 2027-2030: Future Outlook, Targets, and Long-Term Forecast appeared first on Coinpedia Fintech News

Story Highlights

  • The price of the SUSHI token is  $ 0.19806765.
  • The Sushiswap price could hit a high of $0.7311 in 2026.
  • SUSHI price with a potential surge may reach a high of $10.38 by 2030.

Decentralized exchanges have evolved significantly since the early DeFi boom, and SushiSwap remains one of the most recognizable names in the sector. Originally launched as a community-driven fork of Uniswap, Sushi has transformed into a multi-chain liquidity network spanning more than 40 blockchains.

Instead of operating as a single trading platform, the project is now transitioning into a modular ecosystem under the “Sushi Labs” model, where multiple specialized DeFi tools operate under one umbrella.

With SUSHI trading near $0.199, investors are wondering whether this long-standing DeFi project can regain momentum in the next market cycle.

Here is CoinPedia’s SushiSwap (SUSHI) price prediction for 2026, 2027, and 2030.

Let’s explore.

SushiSwap Price Today

Cryptocurrency SushiSwap
Token SUSHI
Price $0.1981 down -4.13%
Market Cap$ 56,812,688.57
24h Volume$ 13,823,536.1968
Circulating Supply286,834,766.8498
Total Supply287,676,365.3148
All-Time High$ 23.3823 on 13 March 2021
All-Time Low$ 0.1733 on 06 February 2026

CoinPedia’s SushiSwap (SUSHI) Price Prediction

From CoinPedia’s perspective, SushiSwap’s future will depend less on hype and more on product innovation and liquidity depth.

The protocol’s shift toward the Sushi Labs model, combined with cross-chain integrations like Solana, suggests that Sushi is trying to rebuild its competitive edge in the crowded DEX market.

If trading volumes increase and total value locked rises across multiple chains, SUSHI could reclaim the $0.7311 range in 2026.

YearPotential Low ($)Potential Average ($)Potential High ($)
2026$0.055$0.37$0.7311

Sushi (SUSHI) Price Targets For March 2026

March 2026 may represent an important turning point for SushiSwap as the protocol expands its multi-chain strategy.

One of the biggest developments arrived in February 2026, when SushiSwap officially launched on the Solana blockchain. The integration uses Jupiter Exchange’s system to help users swap tokens on Solana and also do cross-chain trades from the Sushi platform.

This move is important because Solana is one of the fastest-growing DeFi networks. If trading grows there, SushiSwap could bring back users and liquidity that had earlier moved to other DEX platforms.

Still, if multi-chain trading volumes increase and TVL stabilizes, SUSHI could attempt a move toward $0.3754 by March 2026.

MonthPotential Low ($)Potential Average ($)Potential High ($)
SushiSwap Price Prediction March 2026$0.1679$0.2454$0.3754

Sushi Price Prediction 2026

SushiSwap’s future will depend on how well its new Sushi Labs plan works. Instead of being just one trading platform, it is now building more DeFi tools like cross-chain swaps and liquidity tools.

SushiSwap has historically maintained approximately $44.84 million in total value locked (TVL) across multiple chains. This represents a significant decline from its historical peak of over $8 billion in 2021.

SushiSwap (SUSHI) Price Prediction 2026

Technical Analysis

Looking at the Sushi 1-day price chart, it shows that the token has been moving inside a long downward channel, which means the overall trend is still bearish. 

Recently, SUSHI has started to stabilize around the $0.19–$0.20 support zone, where buyers are trying to defend the price. If this level holds, the price could recover toward the $0.37 resistance.

However, a stronger bullish move would likely happen only if the price breaks above the upper trendline and the $0.57 level. If that happens, it could signal a trend reversal and push the price toward $0.73.

On the downside, if the $0.19 support breaks, the price could fall toward the next major support around $0.05.

YearPotential Low ($)Potential Average ($)Potential High ($)
SushiSwap Price Prediction 2026$0.055$0.37$0.7311

SushiSwap Price Prediction 2026 – 2030

YearPotential Low ($)Potential Average ($)Potential High ($)
2026$0.055$0.37$0.7311
2027$0.30$0.85$1.70
2028$0.698$2.21$4.60
2029$1.50$3.57$6.90
2030$2.20$4.80$10.38

SushiSwap (SUSHI) Price Prediction 2026

If SushiSwap successfully attracts liquidity from Solana and other high-speed chains, SUSHI could approach $0.73 as trading activity improves.

SushiSwap Price Prediction 2027

By 2027, Sushi Labs may evolve into a broader DeFi ecosystem with multiple revenue-generating products. This will push SUSHI to near $1.70.

Sushi Coin Price Prediction 2028

As cross-chain trading becomes a major DeFi trend, Sushi’s multi-chain infrastructure could push the token toward $4.60.

Sushi Price Prediction 2029

Once decentralized exchanges capture a larger share of global crypto trading, SushiSwap’s liquidity pools and aggregator features could drive SUSHI near $6.90.

Sushi (SUSHI) Price Prediction 2030

By 2030, if SushiSwap evolves into a major cross-chain liquidity hub across dozens of blockchains, SUSHI could target the $10.38 range.

What Does The Market Say?

Year202620272030
Binance$1.49$0.52$1.91
Digitalcoinprice$0.25$0.82$0.31
Coincodex$1.60$1.33$0.30
Never Miss a Beat in the Crypto World!

Stay ahead with breaking news, expert analysis, and real-time updates on the latest trends in Bitcoin, altcoins, DeFi, NFTs, and more.

FAQs

What is the SushiSwap (SUSHI) price prediction for 2026?

SUSHI could trade between $0.055 and $0.7311 in 2026. If adoption grows through cross-chain tools and higher DeFi activity, the token may average around $0.37.

What could SushiSwap be worth by 2030?

If DeFi adoption expands and Sushi becomes a major cross-chain liquidity hub, SUSHI could potentially reach up to $10.38 by 2030 in a strong market cycle.

What is the SushiSwap price prediction for 2040?

Long-term forecasts vary, but some projections suggest SUSHI could reach around $0.90 in conservative models or much higher in bullish scenarios by 2040.

Is SUSHI a good investment?

Investing in SushiSwap (SUSHI) is primarily suitable for investors with a high risk tolerance and a long-term outlook.

JasmyCoin Price Prediction 2026, 2027 – 2030: Is JASMY a Good Long-Term Investment?

JasmyCoin Price Prediction

The post JasmyCoin Price Prediction 2026, 2027 – 2030: Is JASMY a Good Long-Term Investment? appeared first on Coinpedia Fintech News

Story Highlights

  • The live price of the Jasmy token is  $ 0.00553317.
  • If the descending structure breaks, JASMY could gradually climb toward the $0.0500 region by the end of 2026.
  • In a stronger adoption cycle, JasmyCoin could extend its rally toward $0.26

JasmyCoin has spent the past year quietly compressing inside a prolonged downtrend, gradually approaching a key support band near $0.005–$0.0055. While price action has remained subdued, the broader setup suggests the market may be entering a decisive phase. Originally built as a data-ownership blockchain for IoT devices, Jasmy’s long-term prediction revolves around giving users control over their personal data while enabling secure data sharing between connected devices. 

As industries increasingly move toward decentralized data infrastructure, projects like Jasmy could gradually regain attention during the next market expansion. So, let’s dive into Coinpedia’s JasmyCoin (JASMY) Price Prediction 2026, 2027 – 2030.

JasmyCoin Price Today

Cryptocurrency JasmyCoin
Token JASMY
Price $0.0055 down -3.34%
Market Cap$ 273,587,465.07
24h Volume$ 11,466,002.7520
Circulating Supply49,444,999,677.17
Total Supply50,000,000,000.00
All-Time High$ 4.9943 on 16 February 2021
All-Time Low$ 0.0027 on 29 December 2022

CoinPedia’s JasmyCoin Price Prediction

Coinpedia’s price prediction highlights that JasmyCoin price appears to be approaching a critical phase where long-term compression could soon resolve. If the token manages to break above its descending resistance structure, the market could gradually shift toward recovery. Under favorable conditions, JasmyCoin could reach around $0.050 by 2026, with a longer-term expansion potentially pushing the token toward $0.26 by 2030.

YearPotential Low ($)Potential Average ($)Potential High ($)
20260.0120.0300.050

JasmyCoin (JASMY) Price March 2026 Outlook

With March already underway, JasmyCoin continues trading close to the lower boundary of its consolidation range. The $0.005 region remains the most critical support level, as losing this area could extend the long-term downtrend. However, holding above it keeps the accumulation narrative intact.

On the upside, the first signal of a structural shift would be a move toward $0.008–$0.009, where the descending trendline currently sits. If bulls manage to push above this barrier, momentum could gradually build toward $0.012 and $0.015, where previous price reactions occurred. For now, JasmyCoin appears to be in a waiting phase, where traders are watching whether the compression resolves into a breakout or a continuation of the broader consolidation.

JasmyCoin Price Prediction 2026

Looking toward 2026, the outlook for JasmyCoin will likely depend on two major factors: broader cryptocurrency market expansion and the relevance of decentralized data infrastructure. If blockchain adoption within IoT ecosystems continues to develop, projects focused on data sovereignty and device-to-device data markets could regain traction. 

JasmyCoin (JASMY) Price Prediction 2026

The most important milestone for JASMY would be reclaiming the $0.020 level, which would signal that the prolonged downtrend has transitioned into recovery. Once this level is reclaimed, the token could gradually target $0.030–$0.040, with stronger bullish momentum potentially pushing the token toward $0.050 by 2026. While such a move would represent a significant recovery from current levels, it would still remain within a realistic expansion scenario during a broader crypto cycle. 

On the downside, the $0.0050–$0.0055 region has acted as a consistent demand zone. Multiple price reactions have occurred near this level, suggesting that buyers continue defending the area.

JasmyCoin (JASMY) Price Prediction 2026 – 2030

YearPotential Low ($)Potential Average ($Potential High ($)
20260.0120.0300.050
20270.0180.0450.070
20280.0350.0800.120
20290.0700.1500.200
20300.1200.2000.260

JasmyCoin Price Prediction 2026

In 2026, JasmyCoin price could project a low price of $0.012, an average price of $0.030, and a high of $0.050.

JasmyCoin (JASMY) Price Prediction 2027

As per the JasmyCoin price Prediction 2027, JasmyCoin  may see a potential low price of $0.018, The potential high for JasmyCoin price in 2027 is estimated to reach $0.070

JasmyCoin Price Forecast 2028

In 2028, JasmyCoin price is forecasted to potentially reach a low price of $0.035, and a high price of $0.120

JasmyCoin Price Target For 2029

Thereafter, the JasmyCoin (JASMY) price for the year 2029 could range between $0.070, and $0.200

JasmyCoin (JASMY) Price Prediction 2030

Finally, in 2030, the price of JasmyCoin is predicted to maintain a steady positive. It may trade between $0.120 and $0.260.

JasmyCoin Price Prediction 2031, 2032, 2033, 2040, 2050

JasmyCoin’s long-term outlook largely depends on the growth of the decentralized data economy and IoT adoption. As industries explore secure data sharing and user-owned data models, platforms like Jasmy that focus on data sovereignty could gradually gain relevance. If the broader crypto market continues expanding alongside real-world blockchain use cases, JASMY could benefit from renewed ecosystem development and sustained market participation.

YearPotential Low ($)Potential Average ($)Potential High ($)
20310.150.250.38
20320.200.400.55
20330.250.500.70
20401.402.203.00
205014.0022.0028.00

What Does The Market Say?

Year202620272030
Changelly$0.028$0.080$0.090
CoinCodex$0.040$0.084$0.120
WalletInvestor$0.060$0.090$0.150
Never Miss a Beat in the Crypto World!

Stay ahead with breaking news, expert analysis, and real-time updates on the latest trends in Bitcoin, altcoins, DeFi, NFTs, and more.

FAQs

What is JasmyCoin (JASMY) and what does it do?

JasmyCoin is a Japan-based crypto focused on data democracy, letting users control, share, and monetize personal data from IoT devices.

Why is JasmyCoin called the “Bitcoin of Japan”?

Jasmy is called the Bitcoin of Japan due to its local roots, regulatory focus, and mission to give users ownership over digital data.

Where can I buy JasmyCoin (JASMY)?

JasmyCoin is available on major crypto exchanges like Binance, Coinbase, and KuCoin, where users can buy JASMY using USDT or fiat.

What will be the maximum trading price of JASMY by the end of 2026?

If ecosystem growth continues, JASMY’s maximum price in 2026 could reach around $0.04 under favorable market conditions.

How high may JasmyCoin (JASMY) price hit by the end of 2030?

Based on long-term projections, JasmyCoin could trade between $0.120 and $0.260 by 2030 if crypto adoption and IoT data networks continue expanding.

What is the price of JasmyCoin (JASMY) in 2040?

Some long-term models suggest JASMY could trade around $3.5–$4.7 by 2040 if blockchain data infrastructure and IoT ecosystems grow significantly.

What is JasmyCoin price prediction for 2050?

In a strong long-term adoption scenario, analysts estimate JASMY could reach roughly $4–$6 by 2050, though such forecasts remain highly speculative.

Why Crypto Market Is Down Today?

Crypto Market Crash Today Bitcoin Falls Below $66K, Ethereum and XRP Extend Losses

The post Why Crypto Market Is Down Today? appeared first on Coinpedia Fintech News

The crypto market is under pressure again after a brief recovery attempt earlier this week. Bitcoin had surged toward $73,000, sparking optimism that the broader market could regain bullish momentum heading into March. That optimism did not last long. As of March 7, the crypto market has turned lower again. Bitcoin has dropped toward $68,000, Ethereum price is trading near $1,976, and XRP has slipped toward $1.36.

The latest decline comes as traders react to a combination of macroeconomic shocks, including surging oil prices, a surprisingly weak U.S. jobs report, and a wave of leveraged liquidations across crypto derivatives markets. Together, these forces have pushed investors into a risk-off environment, explaining why the crypto market is down today.

Macro Shocks Hit Risk Assets

One of the major triggers behind the market decline is rising geopolitical tension in the Middle East. Concerns about disruptions in the Strait of Hormuz, a critical shipping route responsible for roughly 20% of global oil supply, have pushed energy markets sharply higher. As a result, Brent crude oil surged above $91 per barrel, marking a sharp weekly increase.

JUST IN: Brent crude oil price surges to $91, up 25% in the past 7 days. pic.twitter.com/2uXw8TyPK5

— Watcher.Guru (@WatcherGuru) March 6, 2026

Higher oil prices typically increase inflation pressure and reduce expectations of near-term interest rate cuts from central banks. When interest rates remain elevated, risk assets such as cryptocurrencies often face renewed selling pressure.

Weak U.S. Jobs Data Adds to Market Uncertainty

Another catalyst weighing on the crypto market is the latest U.S. labor market report. The February Nonfarm Payrolls report showed the U.S. economy lost roughly 92,000 jobs, a sharp miss compared with expectations for job growth. Meanwhile, the unemployment rate climbed to around 4.4%, signaling signs of a cooling labor market.

FEBRUARY U.S. JOBS REPORT

NONFARM PAYROLLS -92K, (Est. +55K) UNEMPLOYMENT RATE 4.4%, (Est. 4.3%)

The probability of a rate cut is rising pic.twitter.com/R23L5M4ZhC

— Couch Investor🛋 (@Couch_Investor) March 6, 2026

The weak data has increased fears of economic slowdown while inflation risks remain elevated due to rising energy prices. For crypto markets, which tend to react strongly to global liquidity conditions, the combination of slowing growth and persistent inflation has created additional uncertainty.

$302M Liquidations Accelerate the Crypto Sell-Off

The latest drop in prices has also been intensified by large liquidations across crypto derivatives markets. According to Coinglass data, more than $302.75 million in crypto positions were liquidated in the past 24 hours.

Bitcoin accounted for the largest share of liquidations at roughly $132.79 million, followed by Ethereum with about $63.73 million, while the remaining liquidations were spread across various altcoins.

Crypto Liquidations

Such liquidation cascades occur when leveraged traders are forced to close positions after prices move against them. This forced selling often amplifies market declines and increases volatility.

Bitcoin Price Analysis: Key Levels To Watch

After briefly touching $73,000 earlier this week, the BTC price failed to sustain its bullish momentum and has now retraced toward the $68,000 level. Technically, the $67,000–$68,000 region now represents a critical support zone. This area previously acted as a demand region during the recent consolidation phase and may determine the next direction for the market. If buyers manage to defend this level, Bitcoin could attempt a rebound toward $70,000 and $72,000. However, a decisive break below $67,000 could open the door for a deeper correction toward the $65,000 support level.

Ethereum Price Analysis: Can ETH Reclaim $2,200?

Ethereum has also moved lower alongside Bitcoin and is currently trading around $1,976, slipping below the important $2,000 psychological level.

The $1,850–$1,900 zone now acts as a key support range for Ethereum. If buyers manage to defend this area, the asset could attempt a recovery toward $2,080 and $2,200. However, if bearish pressure continues, ETH may revisit deeper support near $1,850, which previously served as a strong demand region.

XRP Price Analysis: What’s Next for XRP?

XRP is also experiencing mild downside pressure as the broader crypto market weakens. The token is currently trading near $1.36, consolidating after failing to extend its earlier recovery. The $1.30 level now represents a critical support level. If this zone holds, XRP could attempt another move toward $1.45 and $1.50. However, if Bitcoin continues to decline and broader market sentiment weakens, XRP could revisit the $1.20 support zone before buyers step in again.

FAQs

Why does geopolitical tension in the Middle East impact crypto?

Rising conflict, like in the Strait of Hormuz, fuels fear and volatility, causing investors to move away from risk assets like crypto.

Can rising interest rates affect Bitcoin and altcoins?

Yes. Higher rates make risk assets less attractive, often leading to declines in Bitcoin, Ethereum, and other cryptocurrencies.

What is a liquidation cascade in crypto markets?

When leveraged traders are forced to close positions due to price drops, it triggers further selling, amplifying market declines.

How do oil price surges influence crypto volatility?

Spiking oil prices raise inflation concerns and market risk, which can lead to short-term drops in Bitcoin and major altcoins.

Sui Crypto (SUI) Price Prediction 2026, 2027-2030: Is This the Best Time to Buy SUI?

Sui (SUI) Price Prediction

The post Sui Crypto (SUI) Price Prediction 2026, 2027-2030: Is This the Best Time to Buy SUI? appeared first on Coinpedia Fintech News

Story Highlights

  • The live price of SUI crypto is  $ 0.91186943.
  • SUI shows strong bullish momentum in early 2026, backed by rising TVL, ecosystem growth, and renewed investor confidence.
  • If key resistance breaks, SUI could target $3–$5 in 2026, with long-term potential extending toward $15–$18 by 2030.

As a next-generation Layer 1 blockchain, Sui is redefining the architecture of the decentralized web by introducing an object-centric model where assets, data, and permissions are natively ownable and programmable. Built to handle the demands of modern commerce, the Sui Stack provides a modular toolkit that allows developers to scale on resilient infrastructure while delivering high-performance experiences without typical blockchain trade-offs.

From powering institutional capital markets and DeFi to even revolutionizing the gaming sector, the network has already secured a significant foothold with a Total Value Locked (TVL) of $583 million, per the official website. 

By prioritizing verifiable security and composable scaling, Sui ensures that value created within its ecosystem is shared rather than extracted. In this comprehensive SUI price prediction 2026–2030, we analyze how this business-ready infrastructure and growing industry adoption will impact SUI’s token and market valuation in the years to come.

Sui Price Today

Cryptocurrency Sui
Token SUI
Price $0.9119 down -3.83%
Market Cap$ 3,556,276,817.54
24h Volume$ 457,956,126.9241
Circulating Supply3,899,984,688.4154
Total Supply10,000,000,000.00
All-Time High$ 5.3519 on 06 January 2025
All-Time Low$ 0.3643 on 19 October 2023

Coinpedia’s SUI Price Prediction 2026

SUI/USD is in a corrective phase after peaking at $5.36 in late 2024. It’s currently testing $0.80 support, with a risk of dropping to the key $0.50 level. Stabilization at $0.50 could signal a reversal. Key resistance levels to watch are $1.05, $1.60, and $2.00, while a breakout above $3.50 would confirm a trend reversal. Until then, it’s a “buy the dip” phase for long-term investors.

Sui (SUI) Price Prediction March 2026

On the daily timeframe, SUI price entered 2026 with an initial retest of the $2.00 psychological level, but aggressive selling pressure forced a deep correction. This decline culminated in a macro low of $0.80 in early February. Since then, the price has been grinding sideways, carving out a tight consolidation range just beneath the $1.00 mark.

As we move through March, SUI/USD sits at a critical technical crossroads. If SUI token price manages to generate enough momentum to clear the $1.05 resistance, it would confirm a local bottom. This could trigger a rapid relief rally toward the $1.60 liquidity pocket, with an outside chance of re-testing the $2.00 supply zone before the end of the month.

Conversely, if the $0.80 support floor fails to hold, the downtrend is likely to extend into the next major interest zone. In this capitulation scenario, SUI could seek out deeper support within the $0.50–$0.60 range.

SUI Price Prediction March 2026

Sui (SUI) Crypto Price Prediction 2026

The weekly price action for SUI/USD reveals a market in a major corrective phase after its late-2024 peak, currently in Q1 2026, searching for a definitive long-term bottom. 

What we witnessed is that after the 2024’s explosive rally that topped out near $5.36, the asset entered a persistent downtrend, characterized by a series of “lower highs” capped by a prominent descending resistance line. This primary trendline has remained unbroken throughout 2025, consistently forcing the price toward deeper support levels as the initial hype cycle cooled.

Currently, the SUI price is testing $0.80 support after losing $1.05 support in Q1 2026. The odds suggest a chance of reaching the $0.50 support zone if it fails to hold $0.80, because the $0.50 area is of immense technical importance, as it represents the original “genesis” accumulation level from early 2024. 

The price has dipped a lot, and now it’s showing signs of stabilization as sellers are about to reach exhaustion once it hits $0.50. Real consolidation could begin, and a true reversal to fruit has better odds. This area serves as the “line in the sand” for bulls; maintaining this floor is essential to prevent a complete technical breakdown and to begin building a new base for the next market cycle.

Looking ahead, the chart identifies several key resistance levels that SUI must reclaim to shift its bearish structure. The immediate hurdle lies at the $1.05, $1.60, and $2.00 horizontal zones. A successful bounce from the current demand floor would likely target these levels first. 

However, a true trend reversal will only be confirmed if SUI breaks and closes above the long-term descending trendline, currently near $3.50. Until that breakout occurs, the asset remains in a “buy the dip” accumulation phase for long-term investors.

SUI Price Prediction 2026

SUI Crypto Price Prediction 2026 – 2030

YearPotential Low ($)Potential Average ($)Potential High ($)
2027$4$6$8
2028$8$10$12
2029$10$13$16
2030$12$15$18

Sui (SUI) Price Prediction 2027

Subsequently, the SUI price range can be between $4 to $8 during the year 2027. 

SUI Prediction 2028

Beyond the previous ATH,SUI bullish momentum may gain pace and will see another bullish spark in 2028. Specifically, as per our SUI Price Prediction, the potential SUI price range in 2028 is $8 to $12. 

SUI Price Forecast 2029

Thereafter, the SUI price for the year 2029 could range between $10 and $16

Sui (SUI) Price Prediction 2030

Finally, in 2030, the price of SUI is predicted to maintain a steady and positive. It can trade between $12 and $18.

SUI Price Prediction 2031, 2032, 2033, 2040, 2050

Based on the historic market sentiments and trend analysis of the largest cryptocurrency by market capitalization, here are the possible SUI price targets for the longer time frames.

YearPotential Low ($)Potential Average ($)Potential High ($)
2031$8$10$15
2032$10$13$18
2033$12$15$22
2040$20$32$40
2050$30$70$150+
Never Miss a Beat in the Crypto World!

Stay ahead with breaking news, expert analysis, and real-time updates on the latest trends in Bitcoin, altcoins, DeFi, NFTs, and more.

FAQs

What is the Sui Crypto (SUI) price prediction for 2026?

SUI could trade between $0.50 and $5 in 2026. If it breaks key resistance near $3.50, momentum may push the token toward the $3–$5 range.

How high can Sui Crypto go by 2030?

If adoption continues and the ecosystem expands, SUI could reach $12–$18 by 2030, driven by DeFi growth and network demand.

What is the Sui price prediction for 2040?

Long-term projections suggest SUI may trade between $20 and $40 by 2040, assuming strong blockchain adoption and sustained ecosystem growth.

What is the Sui Coin price prediction for 2050?

By 2050, SUI could potentially reach $30–$150+ if the network becomes widely used across finance, gaming, and Web3 infrastructure.

Where to buy Sui Crypto (SUI)?

You can buy SUI on major crypto exchanges like Binance, Coinbase, KuCoin, and OKX. Simply create an account, deposit funds, and trade for SUI.

Can SUI reach its all-time high again?

Yes, if SUI breaks above key resistance near $3 and market conditions stay favorable, a retest of its $5.35 ATH is possible.

Is SUI a good long-term investment?

SUI shows long-term potential due to its scalable Layer-1 design, growing DeFi adoption, and increasing developer and institutional interest.

What factors are driving SUI’s price growth?

Key drivers include rising TVL above $1B, strong on-chain activity, ecosystem expansion, and SUI’s reputation as a fast, scalable network.

Florida Senate Passes Unprecedented, Comprehensive Stablecoin Regulation

Hong Kong’s New Stablecoin Law Takes Effect

The post Florida Senate Passes Unprecedented, Comprehensive Stablecoin Regulation appeared first on Coinpedia Fintech News

On March 6, the Florida Senate unanimously passed Bill 314, which details comprehensive regulations regarding payment stablecoins. The pro-crypto state is the first in the US to develop such a framework, which now awaits signing into law by Governor Ron DeSantis.

Florida Senate passes stablecoin legislation

Florida’s framework borrows greatly from the nation’s GENIUS Act to remain federally compliant.

The Bill clarifies that stablecoins are not securities, but that their monetary value makes their issuers Money Services Businesses. This part of the Bill is similar to the specifications made by Texas and New York regarding stablecoins.

Issuers are therefore required to obtain operational licenses, such as the state MSB license or certain certificates of approval, in line with anti-money laundering provisions.

Providers must also perform KYC (Know Your Client) checks and keep real-time records of all transactions, just like banks. Issuers should report transactions above $10,000 to the state and those attracting suspicion to the Florida Office of Financial Regulation (OFR). They should also maintain a 1:1 reserve and transition into federal oversight once their total valuation reaches $10 billion.

In matters of stablecoin yield farming, the legislation says stablecoin issuers must not pay interest to holders if prohibited by federal law. This throws the ball back again to the US Senate, a place where the subject has been greatly debated and remains undecided.

Delays in the CLARITY Act

Some crypto opinionists argue that the GENIUS Act only prohibits issuers from offering stablecoin interest, and not any other rewards. Banks face criticism from US President Donald Trump and his son Eric Trump for lobbing against stablecoin yields, fearing capital flight.

Meanwhile, Tether has now participated in a $7.5 million funding round to build APIs that enable USDT payments on the Bitcoin network. Also developing is USDC, which is now the liquidity reserve for Cardano’s stablecoin USDCx.

The overall stablecoin market cap is now $312.85 billion, having risen from $205 billion in January of 2025.

Chart of stablecoin market cap

Source: DefiLlama

Bitcoin Falls Below $70K as Short-Term Sell Pressure Mounts, Is Capitulation Imminent?

Bitcoin Price Crash Today Has Bitcoin Entered a Bear Market

The post Bitcoin Falls Below $70K as Short-Term Sell Pressure Mounts, Is Capitulation Imminent? appeared first on Coinpedia Fintech News

Following a three-day streak above $70K, Bitcoin (BTC) has fallen below this resistance level, trading at $68,131 (down 3.96% in 24) at the time of writing.

Blockchain analytics firm CryptoQuant shows that Bitcoin selling pressure among short-term holders (STHs), or people who hold BTC for less than 155 days, has recently spiked. 

In the last 24h, panic-led STHs have sold over 27,000 BTC for profit on exchanges. This marked the highest level observed in recent months, signaling an upcoming capitulation phase.

STH Selling Pressure Emerges Despite BTC Recovery

“Over the past 24 hours, STHs have sent more than 27,000 BTC in profit to exchanges, which ranks among the highest levels observed in recent months.” – By @Darkfost_Coc pic.twitter.com/0gsKZM6LT3

— CryptoQuant.com (@cryptoquant_com) March 6, 2026

Another crypto analyst noted that Bitcoin formed a new death cross on March 3. On this day, the 50-day simple moving average crossed below the 200-day average, signaling bearish momentum.

It's happening! $BTC https://t.co/9vGw5OebLw pic.twitter.com/qhqvnAOanL

— Ali Charts (@alicharts) February 27, 2026

Is Bitcoin entering a capitulation period?

The death cross has historically signalled an upcoming capitulation phase, followed by a bottoming-out phase. Crypto markets fell an average of 52%, 50%, and 46% following death crosses in 2014, 2018, and 2022, respectively.

CryptoQuant shows a Bitcoin Exchange Whale Ratio (EWR) of 0.54, suggesting whales are increasingly moving their crypto assets to exchanges.

Bitcoin Exchange Whale Ratio

Source: CryptoQuant

Additional metrics supporting the bearish case include Bitcoin’s open interest dropping by 3.94% in the past day to $45.13 billion, while liquidations mounted to $159.29 million. 

Just yesterday, Bitcoin spot ETF outflows reached $228 million, reversing a 3-day inflow streak. BlackRock, the largest issuer of crypto ETFs globally, has placed a 5% quarterly cap on withdrawals, seemingly overwhelmed after surging withdrawal requests. Institutional crypto lender BlockFills is preparing for “restructuring” due to a liquidity crisis brought on by $75 million in losses in early 2025.

Rising oil prices amid the prevailing US-Iran war, inflationary fears, and heightened unemployment rates have also triggered de-risking among investors.

What Next?

Technically, Bitcoin could consolidate between $68-$70K if it holds above the $67,757 swing low. Failure to attain this would risk a test of $65K.

The community also awaits broader market price reactions to the March 18 US Federal Reserve policy announcement.

Cardano Price Prediction March 2026: ADA Recovers to $0.27, but Pepeto Targets 100x as Bitcoin Breaks $73,500 for First Time in a Month

ada-price-prediction (2)

The post Cardano Price Prediction March 2026: ADA Recovers to $0.27, but Pepeto Targets 100x as Bitcoin Breaks $73,500 for First Time in a Month appeared first on Coinpedia Fintech News

Bitcoin just broke through $73,500 for the first time in a month, significantly outperforming gold as a safe haven during Middle East conflict, and when BTC clears a resistance level it has been fighting for weeks, it means the recovery is accelerating and the capital rotation into altcoins follows fast. 

The cardano price prediction for March has now turned bullish, but ADA recovering to $0.40 is a fraction of what presale entries with real exchange infrastructure deliver when the listing reprices everything.

Bitcoin Breaks $73,500 for First Time in a Month as Crypto Outperforms Gold in the Rally

CoinDesk reported Bitcoin climbed to $73,500 during European trading on March 4, reaching a one month high as institutional buyers returned through spot ETFs and the market reassessed BTC as a safe haven, while Coinpedia data shows altcoins followed with SOL jumping 7.2% and LINK surging 8%.

When Bitcoin smashes through resistance like this, the rotation into presale entries follows, and the cardano price prediction debate becomes irrelevant compared to the multiples Pepeto offers from presale pricing.

Cryptos With Explosive Potential This Month: Can Pepeto Outrun the Cardano Price Prediction?

Pepeto : The Exchange With Massive Market Potential the Cardano Price Prediction Cannot Touch

Bitcoin’s recovery took many by surprise, and understanding crypto markets is tricky because capturing the signals is harder than with stocks or commodities. But Pepeto’s exchange infrastructure was built to solve exactly that problem, with cross chain bridging, zero fee execution, and risk scoring that captures signals invisible to traders using fragmented platforms.

For instance, the bridge connecting Ethereum, BNB Chain, and Solana routes liquidity across chains while the risk scoring system reviews every token’s profile before you commit capital. The result is a powerful exchange that will drastically improve trading for any crypto holder, and that is a market of more than 600 million people globally.

pepeto-upgrade

That kind of massive market potential has driven one of the fastest presale accumulations in the space. Over $7.5M has been raised at $0.000000186, and the SolidProof audit backs every contract while the cofounder of the Pepe ecosystem who built a token to $7 billion leads the development. The entry is still low enough that the returns from here to the listing carry the kind of multiples the cardano price prediction will never produce.

A $10,000 position earns roughly $20,900 in yearly staking rewards at 209% APY, about $1,741 per month compounding in your wallet while the listing approaches. But only those who enter the presale at this stage will enjoy the math, because every round that fills brings the listing closer and the stages are filling faster than last month, which means every day you sit outside is $57 in staking rewards flowing to someone else while your position stays at zero.

Cardano Recovers to $0.28 but the Price Prediction Caps at $0.40

ADA surged past $0.28 on March 4 and the baseline cardano price prediction for March now projects $0.40. But $0.40 from $0.28 is a 43% move needing sustained buying pressure, and at $10 billion market cap ADA requires unrealistic capital just to double. 

The cardano price prediction falls short when Pepeto at presale pricing delivers multiples in months that ADA needs a full year to attempt.

Ethereum Recovers to $2,043 as Whales Accumulate Aggressively

ETH trades near $2,043 according to CoinMarketCap with targets pointing toward $2,300 and Standard Chartered projecting $40,000 by decade end. 

eth-chart

But at $250 billion market cap the returns require patience, and presale entries with exchange infrastructure deliver faster multiples than any large cap.

The Bottom Line

The distance between presale pricing and listing pricing is the distance between ordinary returns and the kind that permanently reshape your financial future, and right now that gap sits wide open inside Pepeto at $0.000000186 while Bitcoin smashes through $73,500 and the recovery accelerates. 

Stages fill faster with every round, $1,741 in monthly staking income is flowing into wallets right now while most traders debate the cardano price prediction, and the listing will snap this gap shut permanently.

Visit the Pepeto official website and enter the presale now, because the recovery is here, and the people who waited will spend the rest of this cycle calculating what their hesitation cost them.

Click To Visit Pepeto Website To Enter The Presale

pepeto-presale

FAQs

What is the cardano price prediction for March 2026?

The cardano price prediction targets $0.40, but Pepeto at $0.000000186 with $7.5M raised and $1,741 monthly staking income offers returns ADA cannot match. Visit the Pepeto official website.

Why did Bitcoin break $73,500?

BTC broke a one month high as institutional buyers returned and crypto outperformed gold, and presale entries like Pepeto capture the rotation that follows.

Is Ethereum better than Cardano right now?

Both are rallying but at multi-billion valuations the returns are limited, while Pepeto at presale pricing offers faster multiplier potential from a fraction of the entry cost.

Crypto Is Frozen. XRP Is Not. The Man Who Built Ripple’s Products Explains Why

XRP Holders Selling at Loss as Price Struggles

The post Crypto Is Frozen. XRP Is Not. The Man Who Built Ripple’s Products Explains Why appeared first on Coinpedia Fintech News

It is one of the oldest questions in crypto: when prices fall and the headlines turn ugly, where does anyone actually make money? For Asheesh Birla, founder of Evernorth and a former senior figure at Ripple, the answer during the current downturn has a simple starting point: XRP.

XRP is the third-biggest digital currency by total market value, and the funds that track it have been outperforming those built around other tokens, including Bitcoin. That, Birla says, gives investors somewhere to sit while the broader market finds its feet.

“XRP ETFs are performing better than the alternative digital assets, including Bitcoin. So I think there is a lot of interest in XRP as a product. It is a very liquid asset.”

Riding Out the Winter

A crypto winter,  industry shorthand for a prolonged slump in prices,  tends to shake out projects that were built on hype rather than anything solid. Birla’s argument is that XRP weathers these periods better than most because it sits at the centre of a real-money use case: moving value between banks and financial institutions quickly and cheaply.

That underlying demand does not disappear when token prices drop. Banks still need to settle cross-border payments. Transactions still happen. And the fee income that runs through the XRP network does not stop just because retail investors are nervous.

Evernorth, Birla’s firm, focuses exclusively on XRP, a deliberate choice he says makes the business more focused and, critically, keeps liquidity pooled in one place rather than spread thin across dozens of competing networks.

“Digital assets are largely a liquidity business, and pooling that liquidity on fewer chains,  not more,  is going to make that experience better,” he added.

New Laws Are Changing the Game

Beyond the day-to-day mechanics of the market, Birla points to a shift in Washington as the bigger story. The GENIUS Act, which put rules around dollar-backed digital currencies known as stablecoins, has already passed. The CLARITY Act, which would set out clearer rules for the broader crypto industry, is working its way through Congress.

“We’ve seen again and again, if you have the technology, that’s not enough. What you need is technology, you need regulation, and then you see capital formation.” he said

He says the third piece, serious money coming in from big institutions,  is now starting to arrive. Franklin Templeton and BlackRock have both begun moving assets onto blockchains. Birla sees that as the beginning of something much larger.

What About the Price?

Crypto winters are, by definition, uncomfortable. Prices fall. Portfolios shrink. People ask hard questions. When Birla was shown data suggesting that activity across the broader decentralised finance space has barely grown,  even as the industry talks up its own progress, he did not dodge it.

“One year is not long-term, that is short-term. When you look at innovation cycles, you’ve got to look at these things in 10 years. Maybe our society needs to change a little bit and think about the bigger picture.”

Is XRP Price Preparing for $4 Breakout as 44M Tokens Leave Binance?

XRP Price Prediction Could Nasdaq Listing and Bullish Sentiment Push XRP to $9

The post Is XRP Price Preparing for $4 Breakout as 44M Tokens Leave Binance? appeared first on Coinpedia Fintech News

The XRP price is once again flirting with a familiar setup shrinking exchange supply and a technical pattern that’s starting to look suspiciously explosive.

Over the past few weeks, whale activity on major exchanges has quietly shifted. According to exchange flow data tracking XRP across 15 major trading platforms, one particular venue stood out: Binance. And not for the usual reasons. Because twice, large holders pulled tens of millions of tokens off the exchange.

Whales Pull Millions Off Binance in XRP

Tracking whale behavior can often reveal what the biggest market participants are doing before the broader crowd catches on. In this case, the data shows a sharp spike in negative NetFlow for XRP.

Negative flows mean tokens are leaving exchanges. On February 27, roughly 44 million XRP was withdrawn from whale wallets on Binance. That’s one of the largest outflow events visible in the dataset, per analyst Amr Taha.

But here’s where it gets interesting. Earlier that same month on February 6 another sizeable movement occurred. Around 30 million XRP left the exchange from whale-controlled wallets.

Two massive withdrawals. One month. Same exchange. That kind of pattern rarely goes unnoticed by traders who obsess over liquidity.

Why Exchange Outflows Matter

In simple terms, exchange flows can hint at market intentions. When large holders move assets into exchanges, it often suggests preparation to sell. That’s why positive NetFlow spikes can be interpreted as bearish signals.

But when the opposite happens, tokens leaving exchanges, the logic flips.

As less supply sits on trading platforms, fewer coins are immediately available for sale. If demand remains steady, the XRP price could face upward pressure.

Think of it as a liquidity squeeze. Less supply on the shelves. Same buyers walking into the store. Eventually, prices adjust.

Is XRP Price Preparing for $4 Breakout as 44M Tokens Leave Binance?

XRP Price Chart Shows Repeating Pattern

Meanwhile, the XRP price chart itself is telling its own story. On the XRP/USD three-day chart, price action has been forming a long-standing ascending channel that stretches back to late 2024. Inside that structure, the asset has been following a recurring fractal pattern.

Explosive rally. Slow descending consolidation. Then pressure builds again. Right now, XRP appears to be repeating that exact sequence.

After a sharp upward move earlier in 2025, the asset is now compressing inside a descending wedge an area often associated with accumulation.

At roughly $1.4494, XRP is sitting near the lower boundary of that wedge while simultaneously resting on a multi-month structural support zone. That combination tends to attract attention from technical traders.

Is XRP Price Preparing for $4 Breakout as 44M Tokens Leave Binance?

XRP Price Prediction Points Higher

If the current fractal plays out as previous cycles have, the next move could be aggressive.

A breakout above the wedge’s upper trendline would open the door toward the top of the broader ascending channel. In that scenario, the projected target sits around $4.0685. That would represent a potential 180% rally from current levels.

Of course, crypto markets rarely move in straight lines. But between whale withdrawals and tightening price structure, the stage is clearly being set. And if the pattern holds, the XRP price analysis suggests it may not stay quiet for long.

Why Is Bitcoin Price Plunging? Is Jane Street Behind the Latest BTC Volatility?

Is the Crypto Bottom In Jane Street Sued and 2 More Signals Flagged

The post Why Is Bitcoin Price Plunging? Is Jane Street Behind the Latest BTC Volatility? appeared first on Coinpedia Fintech News

The Bitcoin price has slipped below the $69,000 mark once again after facing strong rejection near the crucial $72,000 resistance level. The repeated failure to break above this barrier has intensified selling pressure across the market, pushing BTC into a fresh corrective phase. Technical indicators are now beginning to tilt bearish, suggesting that bullish momentum may be weakening in the short term.

Meanwhile, market attention has shifted toward Jane Street, as reports of large Bitcoin transfers linked to the firm have sparked speculation about potential market influence. With volatility rising, traders are now closely watching whether the recent downturn is purely driven by market dynamics or if large institutional movements are contributing to the current price action.

Jane Street’s Bitcoin Movements Raise Market Concerns

Recent on-chain activity has once again brought Jane Street into the spotlight after the firm reportedly moved nearly $19 million worth of Bitcoin to centralized exchanges earlier today. Large transfers to exchanges are often interpreted as a potential signal of selling intent, which may add short-term pressure to the market, especially during periods of heightened volatility.

Jane Street, which was recently accused of insider trading during the LUNA / Terra crash and dumping Bitcoin at 10 am, is still actively trading.

In the past 2 hours, wallets linked to #JaneStreet deposited 270 $BTC ($19M) to https://t.co/pkH43dUeP1 and LMAX Digital.… pic.twitter.com/fdSbq0R8iC

— Lookonchain (@lookonchain) March 6, 2026

The latest movement has reignited discussions among traders because Jane Street has previously been linked to major crypto market events. During the Terra Collapse in 2022, the firm’s trading activity reportedly drew attention amid the extreme market turbulence surrounding the fall of TerraUSD and Luna.

In addition, market participants have frequently pointed to a pattern of sharp Bitcoin sell-offs around the 10 AM trading window, a phenomenon that some traders speculate could be connected to large institutional trading strategies. While there is no confirmed evidence directly linking these patterns to Jane Street, the firm’s substantial liquidity and market-making role often place it at the center of such discussions.

Bitcoin Price Analysis: Key Levels to Watch as BTC Slips Below $69K

From a technical perspective, Bitcoin has broken below a crucial short-term support zone after failing to reclaim the $72,000 resistance level, which has triggered renewed selling pressure in the market. The 4-hour chart shows that BTC had been trading within a rising channel, but the latest rejection near the upper boundary pushed the price back toward the mid-range support. The price has now slipped below the 200-period moving average near $69,000, a development that signals weakening short-term momentum.

btc price

Currently, Bitcoin is trading around $68,700, and the immediate focus shifts toward the $66,000–$66,500 demand zone, which previously acted as a strong support region. This level also aligns with the lower boundary of the ascending channel and could serve as a crucial area where buyers may attempt to defend the price. The Relative Strength Index (RSI) on the 4-hour timeframe has dropped toward the 40 level, suggesting that bullish strength is fading while sellers gradually gain control.

If Bitcoin manages to reclaim the $70,000–$71,000 zone, it could signal renewed buying interest and potentially push the price back toward the $72,000 resistance level. A successful breakout above this level may open the door for a move toward $74,000. On the downside, failure to hold the $66,000 support zone could expose Bitcoin to a deeper correction toward $64,000, where the next major demand area lies.

Virtual Assets Act 2026: Pakistan Formalizes Its $300Bn Crypto Market

Pakistan crypto adoption 2025

The post Virtual Assets Act 2026: Pakistan Formalizes Its $300Bn Crypto Market appeared first on Coinpedia Fintech News

Pakistan’s parliament has officially passed the Virtual Assets Act 2026, establishing a permanent legal framework for cryptocurrency in the country. President Asif Ali Zardari signed the bill into law after it cleared the Senate on February 27 and the National Assembly on March 3.

The law formally establishes the Pakistan Virtual Assets Regulatory Authority (PVARA), giving it full authority to license, regulate, and supervise all virtual asset service providers operating in the country, including exchanges, custodians, and token issuers.

What Changes for Crypto Users in Pakistan

Pakistan ranks among the top three globally in cryptocurrency adoption, with an estimated 30-40 million users. Until now, all of that activity operated without a legal framework, against a backdrop of restrictions that date back to a 2018 State Bank of Pakistan directive prohibiting financial institutions from dealing with cryptocurrencies.

Under the new law, unlicensed trading carries penalties of up to five years in prison or a Rs. 50 million fine. The legislation also addresses market manipulation and insider trading, aligning Pakistan with international FATF standards.

Bilal bin Saqib, Chairman of PVARA, said the law was built for “the 100 million young Pakistanis who deserve a financial system that works for them.”

Binance and HTX Are Already In Line

PVARA has already issued No Objection Certificates to Binance and HTX, allowing both exchanges to begin AML registration and incorporate local subsidiaries as they work toward full licensing.

The Bigger Picture

The Act is part of a broader national strategy. Pakistan has announced plans for a strategic Bitcoin reserve, allocated 2,000 megawatts of surplus electricity for Bitcoin mining and AI data centers, and signed an MoU with an affiliate of Trump-linked World Liberty Financial to explore stablecoin infrastructure for cross-border payments.

The framework also includes a Shariah Advisory Committee, making Pakistan one of the first countries to formally integrate Islamic finance principles into crypto regulation.

Bitcoin Price at Critical Turning Point as IFP Golden Cross Signals Possible Rally

AI Models Favor Bitcoin Over Fiat in New Study

The post Bitcoin Price at Critical Turning Point as IFP Golden Cross Signals Possible Rally appeared first on Coinpedia Fintech News

The Bitcoin price might be standing at one of those uncomfortable moments markets love, where bullish signals scream “rally,” but the chart quietly whispers, “careful.”

A technical signal known as the Inter-exchange Flow Pulse (IFP) indicator has just flashed a golden cross for $BTC. Historically, that crossover has marked the beginning of major rallies. According to the indicator’s interpretation, by analyst, the long correction that dragged on for nearly a year could finally be over.

Sounds exciting. Maybe even convincing. But charts rarely move in straight lines, and the market right now seems to be sitting on a knife’s edge.

IFP Golden Cross Signals Rally Start

Let’s start with the optimistic side of the story. The Inter-exchange Flow Pulse indicator recently printed a golden cross. In simple terms, that crossover has previously aligned with the start of powerful upward trends in the market.

The signal suggests the prolonged consolidation phase might have served as a long period of reaccumulation. Instead of immediately blasting higher earlier in the cycle, the asset experienced a weaker rally followed by an extended cooling-off phase.

Now, according to the indicator, momentum could be shifting again. In previous cycles, similar golden crosses on the IFP indicator marked the early stages of significant rallies. That’s why some observers are framing the current signal as the point where the “real rally” begins.

Bitcoin Price at Critical Turning Point as IFP Golden Cross Signals Possible Rally

Bitcoin Price Testing Critical Chart Level

Now here’s where the story gets interesting and a little less comfortable.

The Bitcoin price chart is reportedly testing what some analysts call the most important line on the chart. Historically, this level has acted as a decisive turning point for the market.

The pattern is fairly straightforward. When price bounced off this level in past cycles, it eventually pushed toward new all-time highs. But when the level failed to hold, the market slid into deeper bear phases.

So the same line is back in play again. Same setup. Same tension. Different cycle. Which direction it breaks could determine the next major trend.

Bitcoin Price at Critical Turning Point as IFP Golden Cross Signals Possible Rally

Market Waits For Direction

So what does the Bitcoin price prediction crowd do with that? Well, this is where things get messy. One signal says the rally is just getting started. Another says the market is testing a structural level that historically decides between explosive growth and painful declines.

In other words, the chart isn’t giving answers yet. It’s asking a question. Traders watching Bitcoin/USD know this kind of setup well: long consolidation, conflicting signals, and a market hovering right at a critical support or resistance zone.

Break upward, and the narrative quickly shifts toward momentum and new highs. Lose the level, and suddenly the tone across the market changes entirely. For now, the market is simply waiting to see which direction the Bitcoin price chooses next.

Bitcoin Just Dropped 5%: Why Crypto Market is Down Today?

Bitcoin Down 50% From $126K Peter Schiff Warns of $40K Crash

The post Bitcoin Just Dropped 5%: Why Crypto Market is Down Today? appeared first on Coinpedia Fintech News

Bitcoin is at $68,807, down 5.19% today. Ethereum is at $2,005, barely clinging to the $2,000 level that traders treat as psychological bedrock, down 5.46%. Solana has dropped 6.47%, one of the worst performances among major coins today. XRP is down 4.50%. 

The total crypto market is sitting at $2.36 trillion, down 3.58% since yesterday. That sounds manageable until you do the arithmetic. That is roughly $87 billion gone in 24 hours.

Altcoins Are Getting Hit Hardest

When Bitcoin falls, altcoins do not just fall alongside it. They fall faster, further, and with less mercy. That is exactly what is happening today.

Solana is the clearest example, down 6.47% and underperforming Bitcoin by over a full percentage point. Ethereum, often treated as the safer non-Bitcoin option, dropped 5.46%. Cardano and Dogecoin are both sitting close to 4.70% and 4.66% losses respectively. Even BNB, which tends to hold up during sell-offs, lost 3.77%.

This is a well-worn pattern. Bitcoin leads the market in both directions. When confidence is high, altcoins ride the wave and often outperform. When fear takes over, money flows back to Bitcoin first, then out of crypto entirely. Everything else gets sold harder and faster.

Why It Is Happening

The trigger was the U.S. jobs report released this morning. The American economy lost 92,000 jobs in February. Unemployment rose to 4.4%, above the 4.3% analysts had expected. At the same time wages are still rising 0.4% and oil is sitting at $87 a barrel due to Middle East tensions. That combination is the worst possible scenario for risk assets.

The Federal Reserve cannot cut interest rates to help the economy because inflation is still running hot. It cannot raise them further without making the job losses worse. It is stuck. And when the Fed is stuck, investors get nervous and sell anything that feels speculative. Right now, crypto feels very speculative.

The Fear and Greed index has dropped to 23 out of 100, deep in fear territory. Crypto’s correlation with the S&P 500 is running above 72%, meaning the market is not trading on its own fundamentals at all. It is trading on pure global economic anxiety.

The Level Everyone Is Watching

Bitcoin at $68,000 is the line in the sand. If it holds, the market may stabilize and trade sideways while waiting for the Federal Reserve meeting on March 18. If it breaks, the next level experts are pointing to is $65,000, and altcoins would fall proportionally harder than that.

Ethereum holding $2,000 matters almost as much. A close below it today would add fuel to an already nervous market.

The Bigger Picture

Three things could change the mood over coming weeks. The Fed meeting on March 18 is the most immediate catalyst. Any signal that rate cuts are coming would send money back into risk assets fast. The potential signing of the CLARITY Act in early April would give institutional investors the regulatory certainty they have been waiting for. A change in Fed leadership expected in May could shift the entire tone of U.S. monetary policy in crypto’s favour.

Until one of those arrives, the market is treading water in a storm. Bitcoin will set the direction. Altcoins will amplify it.

Right now the direction is down. And in a market running at 23% on the fear index, down tends to stay down until something genuinely changes.

Altcoins May Have Bottomed as SEI Price Gears Up for a Massive Breakout—Key Levels to Watch

SEI Price Strengthens as Institutional Validation and Stablecoin Growth Accelerate

The post Altcoins May Have Bottomed as SEI Price Gears Up for a Massive Breakout—Key Levels to Watch appeared first on Coinpedia Fintech News

The broader altcoin market could be approaching a pivotal moment. Recent crypto market structure suggests that altcoins, excluding the top 10 crypto have dropped to a critical support zone, a level that historically marks the end of prolonged corrective phases.

After weeks of sustained selling pressure across the crypto market, the total altcoin market cap excluding the top 10 assets appears to be stabilizing near a key accumulation region. This development is raising speculation that the altcoin sector may be preparing for its next breakout phase.

Amid this potential shift in sentiment, Sei price is emerging as one of the altcoins that could lead the next move.

Altcoin Market Shows Signs of Bottom Formation

The chart tracking the crypto total market capitalization excluding the top 10 assets indicates that altcoins are currently holding near a major long-term support zone around $170 billion.

Historically, this region has acted as a strong demand area where buyers begin accumulating after extended market corrections. The latest price action shows that the market recently tested this support level and managed to stabilize, suggesting that selling pressure could be weakening.

sei price
Source: X

Momentum indicators further support this possibility. The Relative Strength Index (RSI) on the chart remains near the lower range, levels that have previously coincided with market bottoms in earlier cycles. Meanwhile, the stochastic momentum indicator is beginning to flatten, hinting that bearish momentum may be fading.

If the altcoin market manages to reclaim the $205 billion to $223 billion resistance zone, it could signal the beginning of a broader recovery across the altcoin sector.

SEI Price Testing a Critical Support Zone

Among the altcoins showing notable technical setups, Sei appears to be positioned at a key turning point. The weekly chart shows that SEI has been trading inside a descending channel, reflecting a prolonged corrective phase since its previous rally. Currently, the price is hovering near the lower boundary of this channel, around $0.065 to $0.07, which often acts as a strong support level in trending markets.

sei price

Momentum indicators are also beginning to signal that the selling pressure could be nearing exhaustion. The Relative Strength Index (RSI) on the weekly chart is currently hovering near 28, placing it close to oversold territory. Historically, similar RSI conditions have often preceded price recoveries. Meanwhile, the MACD indicator remains in negative territory but is beginning to flatten, as the levels are heading for a bullish crossover. 

What to Watch Next

The altcoin market appears to be approaching a critical turning point, with several indicators suggesting that the sector may be nearing the end of its correction phase. If the altcoin market cap excluding the top 10 cryptocurrencies begins to recover from its current support zone, it could trigger renewed momentum across the sector.

In such a scenario, Sei could emerge as one of the early movers and reach the resistance at $0.12, initially which may get extended to $0.18 and $0.25. On the downside, if itfails to hold the $0.06 support zone, the correction could extend further, delaying the potential breakout structure.

However, in the wider perspective, oversold indicators and a strengthening market structure suggest that the SEI price may be positioning itself at the foothill of a potential breakout if bullish sentiment returns to the altcoin market.

Jane Street Bitcoin Manipulation Fears Are Back as $19M in BTC Hits Exchanges

Crypto Market Today Bitcoin and Ethereum Pump After Jane Street Lawsuit

The post Jane Street Bitcoin Manipulation Fears Are Back as $19M in BTC Hits Exchanges appeared first on Coinpedia Fintech News

Wallets linked to Jane Street have deposited $19 million in Bitcoin to institutional-grade exchanges, and the crypto community is watching closely.

On-chain analyst Lookonchain flagged the move, confirming that in the past two hours, wallets associated with Jane Street deposited 270 BTC, worth approximately $19 million, to Bullish.com and LMAX Digital. The transfer hit around 10 a.m. UTC, exactly when U.S. markets opened.

Trader Ted (@TedPillows) corroborated the figures, noting the deposits totaled just under $19 million and that Jane Street is the same firm previously accused of manipulating Bitcoin’s price around the U.S. market open.

Ash Crypto was more direct on X: “IS JANE STREET PLANNING TO MANIPULATE BITCOIN AGAIN?

IS JANE STREET PLANNING TO MANIPULATE BITCOIN AGAIN?

Just now, wallets linked to Jane Street have deposited $19,000,000 in $BTC to institutional-focused exchanges.

These are the platforms used for high-frequency trading, which has been responsible for the 10am slam in the past. pic.twitter.com/yUGJbkQSKM

— Ash Crypto (@AshCrypto) March 6, 2026

Arkham on-chain data shows the transfers – 275 BTC to one address, 94.76 BTC to LMAX Digital, all within hours of each other.

What Is the Jane Street Bitcoin Manipulation Theory?

For months through late 2025 and into 2026, Bitcoin reliably sold off every morning at the U.S. market open. Traders watching the pattern gave it a name: the “10 a.m. slam.”

The theory alleged that Jane Street, acting as an authorized participant in BlackRock’s IBIT ETF, was algorithmically selling BTC at open, a pattern some blamed for driving Bitcoin down from $125,000 to as low as $62,000.

Then on February 23, Terraform Labs’ bankruptcy administrator filed a lawsuit accusing Jane Street of insider trading tied to the 2022 LUNA/Terra collapse. Within 48 hours, the 10 a.m. selling stopped and Bitcoin surged 6% toward $70,000.

Glassnode co-founders Jan Happel and Yann Allemann noted: “Jane Street Lawsuit gets made public, and miraculously the 10am $btc slam disappears.”

Jane street Lawsuit gets made public, and miraculously the 10am $btc slam disappears.

— 𝗡𝗲𝗴𝗲𝗻𝘁𝗿𝗼𝗽𝗶𝗰 (@Negentropic_) February 25, 2026

Allegations Against Jane Street

The Terraform case is not Jane Street’s only legal battle. In July 2025, India’s market regulator SEBI banned the firm from local markets and froze gains, citing a “morning pump, afternoon dump” scheme across 18 derivatives expiry days.

Not everyone in crypto agrees manipulation was ever happening.

Jane Street has denied all allegations, calling the Terraform suit “baseless, opportunistic claims.”

Economist Alex Kruger found that IBIT’s 10 a.m. returns closely mirrored Nasdaq performance rather than isolated Bitcoin selling.

CryptoQuant’s head of research Julio Moreno argued that Jane Street’s authorized participant activity is standard delta-neutral practice, fully within legal bounds.

How Low Will Bitcoin Fall?

Bitcoin has slipped below the $70,000 mark, currently trading at $69,998, down 3.15% over the last 24 hours. Whether today’s $19 million deposit from Jane Street wallets is connected to that move remains unconfirmed.

Also Read: Bitcoin Price Prediction: Will BTC Hold $70K as Iran-Israel Tensions Rise?

Ethereum Has Handled Trillions, But SUI Co-Founder Says It Was Never Built for What Crypto Actually Needs

Ethereum Quantum Roadmap

The post Ethereum Has Handled Trillions, But SUI Co-Founder Says It Was Never Built for What Crypto Actually Needs appeared first on Coinpedia Fintech News

Sui co-founder Evan Cheng has a simple argument. Whether crypto is ready to hear it is another matter. He has seen these systems from the inside. So when he says Ethereum and Solana are built on a flawed foundation, it lands differently than the usual founder noise.

It All Starts With a Spreadsheet

His argument begins somewhere disarmingly simple. Ethereum, at its core, is a ledger, a giant digital spreadsheet. Address A has 10 USDC. Address B has five. Money moves, numbers change. That is genuinely all it is. For shifting identical tokens between wallets, it works fine. It has worked fine for a decade.

The problem, Cheng argues, is that the real world does not behave like a spreadsheet.

The House That Changes Everything

Consider a house. On the day you buy it, it looks like every other house on the street, same value, same structure. But ten years later it is completely different. You renovated. The neighbourhood changed. A development went up next door. The house has a history now, a specific identity, relationships with things around it. It is not interchangeable with anything else.

Ethereum’s ledger was never designed for that kind of asset. It was built for coins, uniform, static, identical. Anything more nuanced gets bolted on as an afterthought, and it shows.

The Static Web Problem

The internet parallel is uncomfortable for Ethereum bulls. Early websites were static pages — digital brochures that could display information but couldn’t remember you, respond to you, or change. Companies that tried to force dynamic experiences onto that static architecture mostly failed. The ones that built for complexity from the ground up, Google, Amazon, won decisively.

Cheng believes crypto is approaching that same fork in the road.

What Sui Actually Claims to Solve

Sui treats every asset as an individual object with its own identity and history, something that can evolve through interaction rather than just sit in a balance column. Less spreadsheet, more living record.

Whether that architectural difference translates into real-world dominance remains genuinely open. Ethereum has a decade of battle-tested security behind it and trillions in value that never disappeared. That credibility is not easily dismissed.

Sui is newer, smaller, and still unproven at scale. Those are real limitations, not talking points.

The Uncomfortable Question

Cheng’s argument is not that Ethereum is broken. It is that Ethereum was designed for a simpler version of the problem than the one crypto now actually faces. That is a harder claim to dismiss, and a harder one to answer.

He may be early. He may be right. In technology, those two things have a long history of being exactly the same.

Why are Bitcoin, Ethereum and XRP Prices Crashing Today?

Why are Bitcoin, Ethereum and XRP Prices Crashing Today

The post Why are Bitcoin, Ethereum and XRP Prices Crashing Today? appeared first on Coinpedia Fintech News

A war scare, $228 million yanked from crypto funds, and a price ceiling Bitcoin couldn’t break — here’s what’s happening.

Crypto markets are deep in the red today. Bitcoin has dropped to $69,729, Ethereum sits at $2,042, and XRP is down to $1.38. The total market has shed over $80 billion in 24 hours. Three things happened at once, and together, they hit hard.

A War Scare Pulled the Rug

The biggest trigger was the Middle East. Reports of U.S. and Israeli strikes near Iran sent shockwaves through global financial markets. Investors feared a disruption to oil supply routes, crude prices jumped 22% in a week, and inflation fears came roaring back. When that happens, people sell anything considered risky, and crypto is near the top of that list. Bitcoin’s 72% correlation with the S&P 500 today confirms this wasn’t a crypto problem. It was a global investor panic, and crypto got caught in it.

Big Money Walked Out the Door

On March 5, institutional investors pulled $228 million out of spot Bitcoin funds in a single day, with BlackRock’s fund among the biggest to see withdrawals. When large institutions exit, markets feel it. On top of that, traders who had borrowed money to bet on Bitcoin rising were forced to sell as prices fell, triggering a chain reaction. In total, $115.6 million in Bitcoin positions were forcibly closed in 24 hours,  most of them betting that prices would go up.

Bitcoin Hit a Wall

Bitcoin had rallied nearly 15% over five days before today. That run stalled hard at $74,000,a level analysts had flagged as major resistance. When it failed to break through, traders locked in profits and sold. That selling added fuel to an already nervous market.

What Happens Next?

Everything hinges on whether Bitcoin holds $70,000. Over $2.2 billion in Bitcoin options expire today, with the pain point sitting at $69,000, markets tend to drift toward those levels. The U.S. jobs report, also due today, could swing sentiment either way. A strong print means more inflation fear. A weak one might give bulls some room to breathe.

XRP has actually held up best of the three, down just 0.59% over the past week, reflecting its steadier base of institutional interest.

The floor is $70,000. Whether it holds is the only question that matters right now.

Best Crypto Presales in March 2026: Pepeto Leads Over Maxi Doge and Digitap as February Hack Losses Collapse 98.2% to Just $26 Million

best-crypto-to-buy-now (1)

The post Best Crypto Presales in March 2026: Pepeto Leads Over Maxi Doge and Digitap as February Hack Losses Collapse 98.2% to Just $26 Million appeared first on Coinpedia Fintech News

February’s crypto hack losses collapsed 98.2% year on year to just $26 million across 15 incidents according to PeckShield, and when the security infrastructure of the entire ecosystem improves this dramatically, it means the capital that was sitting on the sidelines waiting for safety signals is about to flood back in. 

Seasoned investors know that the best crypto presales always emerge during the exact moment when fear peaks and fundamentals quietly improve, and right now that moment is here.

February Hack Losses Collapse 98.2% to $26 Million as Crypto Security Infrastructure Strengthens

CoinDesk confirmed PeckShield data showing February crypto hack losses totaling just $26 million across 15 incidents, down 98.2% from the prior year, while CoinMarketCap data shows the Fear and Greed Index at extreme fear, historically the zone where correction floors form. 

When security improves and fear peaks at the same time, the best crypto presales are the ones positioned to capture the recovery wave, and Pepeto with $7.5M raised and exchange infrastructure in development keeps leading that conversation.

Best Crypto Presales to Seriously Consider This Month Before the Window Closes

Pepeto: The Best Crypto Presale With the Adoption Potential to Deliver 100x

Regardless of geopolitics, macroeconomic data, or what the latest trends are, crypto investors always need real infrastructure to trade effectively, and during times of uncertainty, that need becomes even more critical. That is exactly what Pepeto provides, and that is why many consider it the leader among the best crypto presales for this month.

In simple terms, Pepeto is a complete exchange ecosystem with a cross chain bridge connecting Ethereum, BNB Chain, and Solana, a zero tax trading engine, and a risk scoring system that classifies every token before you commit capital. The bridge routes liquidity across chains in the context of live market conditions, while the zero tax engine and risk scoring work together to provide concrete, actionable execution advantages that make every trade smarter and every swap cheaper.

pepeto-upgrade

The result is a powerful platform that will radically improve trading for any crypto holder, anywhere in the world, and that is a market estimated at more than 600 million people globally.

With such adoption potential, it is no surprise that Pepeto’s presale has moved so fast. Over $7.5M has been raised, the SolidProof audit backs every contract, and the cofounder of the Pepe ecosystem who built a token to $7 billion leads the development. The entry price is still low enough that the returns to the listing are more than enough for massive multiples.

But if you want to see your portfolio transform this year, you need to enter the presale right now, because 209% APY staking compounds daily, and waiting means handing compounding profit to someone who already committed.

Maxi Doge Has Meme Culture but Zero Exchange Utility

Maxi Doge markets itself as a community driven meme coin with zero buy and sell tax and a non upgradable contract. But without an exchange, a bridge, or any trading utility beyond holding, the appeal is limited to meme speculators chasing pumps. 

The best crypto presales have always been the ones with real infrastructure, and Pepeto with a complete exchange leaves Maxi Doge in a completely different category.

Digitap Targets Tap to Earn but Faces Crowded Competition

Digitap positions itself in the tap to earn gaming niche with reward mechanics designed for mobile users, but the T2E space is saturated with dozens of similar projects competing for the same Telegram user base.

And without exchange infrastructure or cross chain utility, Digitap offers a narrow thesis that cannot compete with the returns the best crypto presales deliver when real trading volume flows in.

The Bottom Line

The security numbers do not lie: hack losses down 98.2% means the infrastructure protecting capital is stronger than ever, and the fear gripping the market right now is the exact signal that preceded every major recovery rally in crypto history. 

The people who bought Ethereum at $80 during the 2018 fear extreme and watched it climb to $4,800 understood that fear is the price of admission to generational wealth. 

Pepeto at presale pricing, with exchange infrastructure and 209% APY compounding while most traders are too scared to act, is that same caliber of opportunity sitting in front of you right now. 

The presale allocations fill faster each round, the crypto news cycle has not even started covering what happens when this exchange goes live, and the moment it does the price you see today will be a memory. Visit the Pepeto official website and enter the presale before this window slams shut.

Click To Visit Pepeto Website To Enter The Presale

join-pepeto-presale

FAQs

What are the best crypto presales in March 2026?

The best crypto presale in March 2026 is Pepeto with $7.5M raised, 209% APY staking, and exchange infrastructure that no other presale project in the market can match. Visit the Pepeto official website.

Why do lower hack losses matter for presale investors?

Hack losses dropping 98.2% signals the ecosystem is safer than ever, which removes a key barrier for institutional capital to enter, and the best crypto presales capture that inflow before the listing reprices everything.

Is Maxi Doge one of the best crypto presales?

Maxi Doge has meme energy but zero exchange infrastructure, while Pepeto builds a complete exchange with bridging, zero fee trading, and risk scoring that creates real structural demand.

Dubai Cracks Down on KuCoin’s Unlicensed Crypto Services

Dubai Cracks Down on KuCoin’s Unlicensed Crypto Services

The post Dubai Cracks Down on KuCoin’s Unlicensed Crypto Services appeared first on Coinpedia Fintech News

Virtual Assets Regulatory Authority has issued a formal warning against KuCoin, saying the platform has been offering crypto services to residents of Dubai without the required regulatory approval. The regulator stated that KuCoin does not hold a license to provide virtual asset services in or from the emirate and ordered the company to immediately stop any unlicensed activities. Authorities also advised investors to avoid using unregulated platforms as Dubai strengthens enforcement of its crypto licensing framework.

Uniswap Price Prediction 2026, 2027 – 2030: Will Uniswap Reach $50?

Uniswap Price Prediction

The post Uniswap Price Prediction 2026, 2027 – 2030: Will Uniswap Reach $50? appeared first on Coinpedia Fintech News

Story Highlights

  • The live price of the UniSwap crypto token is  $ 3.86373902.
  • Price predictions for 2026 range from $5.00 to $10.00.
  • Long term forecasts suggest UNI price may hit $30.00 by the end of 2030.

Founded in 2018 by Hayden Adams, Uniswap has transcended its origins as a simple Ethereum-based Automated Market Maker (AMM) to become the undisputed backbone of the decentralized finance (DeFi) economy. By mid-2026, the protocol has achieved a staggering $4.0 trillion in all-time volume, supported by 119 million swappers and $2.6 billion in Total Value Locked (TVL).

Uniswap Labs continues to dominate the landscape by offering a seamless, no-fee trading experience backed by deep, on-chain liquidity. Beyond simple swaps, its sophisticated Liquidity Pools allow users to earn yield by powering the very markets they trade in. As Uniswap integrates deeply with the on-chain economy into a single platform, the central question for investors remains: 

Will UNI reach $70? How high can UNI go in five years? Let’s take a look at Uniswap price prediction 2026 -2032 to provide answers to these queries.

Uniswap Price Today

Cryptocurrency Uniswap
Token UNI
Price $3.8637 down -4.45%
Market Cap$ 2,448,565,639.75
24h Volume$ 254,027,439.8054
Circulating Supply633,729,562.7465
Total Supply898,364,420.0366
All-Time High$ 44.9741 on 03 May 2021
All-Time Low$ 0.4190 on 17 September 2020

Uniswap Price Prediction March 2026

On the daily timeframe, Uniswap (UNI) experienced a significant downturn throughout the first quarter of 2026. The breakdown below the $5.00 support base in January accelerated the decline, eventually leading the price to a multi-year floor near $3.00 price level by early February. 

However, the remainder of February saw a sustained bullish reaction, characterized by steady absorption within the historical demand zone. This price action suggests a shift from distribution to accumulation as the market begins to value UNI/USD within the mid-range of its primary support box.

Now, heading into March, the technical outlook hinges on the interaction with the 50-day EMA. Therefore, if UNI price successfully flips the 50-day EMA and breaches the upper border of the current consolidation box, a recovery toward the $6.00 liquidity pocket is highly probable before the month concludes.

Conversely, if selling pressure intensifies, the $3.00 level remains the line in the sand. A failure to hold this psychological floor would likely result in a capitulation event, sending UNI price toward the $2.00 mark to seek deeper liquidity.

Uniswap Price Prediction March 2026

Recent News / Opinions

On March 3, 2026, Judge Failla of the Southern District of New York dismissed the Risley class action against Uniswap Labs and Hayden Adams with prejudice. This ruling effectively clears the protocol of all federal and state claims, providing a massive regulatory green light for the DEX’s operations.

Uniswap recently announced a strategic collaboration with Securitize to integrate BlackRock’s USD Institutional Digital Liquidity Fund (BUIDL) into the UniswapX ecosystem. Launched on February 11, this integration allows institutional-grade assets to be traded directly on-chain, bridging the gap between TradFi and decentralized liquidity.

UNI Price Prediction 2026

As of Q1 2026, Uniswap (UNI) is currently consolidating within a highly-crucial demand zone ranging from $1.80 to $4.50. This specific price floor carries immense historical weight, as it served as the original launchpad for the 2021 bull run that saw UNI skyrocket to its $44.50 all-time high. 

For the first time in five years, the price has returned to this foundational level, effectively completing a full market cycle. This re-entry into the “genesis demand zone” suggests a significant long-term accumulation phase is underway, as long-term holders seek to front-run a potential structural shift in DeFi liquidity.

While the market awaits a catalyst as explosive as the 2021 rally, the current price action is also defined by a massive descending triangle pattern. This structure indicates that while selling pressure is exhausting at the multi-year floor, the price remains capped by a descending resistance line. 

Throughout 2026, a steady recovery setup appears more likely than a vertical spike. Technical targets for the year point toward a possible retest of the $10.00 level, which aligns perfectly with the pattern’s upper border. A confirmed weekly breakout above this resistance could signal the end of the long-term bear cycle and the beginning of a sustained move toward mid-range targets.

Uniswap Price Prediction 2026

UNI Crypto Price Prediction 2026 – 2030

YearPotential Low ($)Potential Average ($)Potential High ($)
20277.0010.0013.50
20288.5011.5018.00
202910.0015.5022.00
203012.0019.0032.00

Uniswap Price Prediction 2027

 The UNI price range can be between $7.00 to $13.50 during the year 2027. 

Uniswap Price Forecast 2028

The UNI Network price for 2028 is anticipated to lie within the range of $8.50 to $18.00.

Uniswap Coin Price Prediction 2029

In 2030, the price of UNI is expected to systain trend and remain positive. It may trade between $10.00 and $22.00.

Uniswap (UNI) Price Prediction 2030

Finally, in 2030, the price of UNI is predicted to maintain a steady and positive. It may trade between $12.00 and $32.00.

UNI Price Prediction 2031, 2032, 2033, 2040, 2050

Based on the historic market sentiments and trend analysis of the largest cryptocurrency by market capitalization, here are the possible UNI price targets for the longer time frames.

YearPotential Low ($)Potential Average ($)Potential High ($)
203119.0029.0039.00
203226.5035.0041.00
203335.0037.0044.00
204042.0052.0057.00
205055.0062.0070.00

UNI Price Prediction: Market Analysis?

Year202620272030
Changelly$13.25$15.80$20.10
CoinCodex$10.90$14.85$19.45
Binance$12.40$15.10$20.85

CoinPedia’s UNI Price Prediction

Uniswap (UNI) is consolidating in a key demand zone of $1.80 to $4.50, marking a return to its foundational level from the 2021 bull run. A descending triangle pattern suggests potential for a steady recovery throughout 2026, with targets around $10.00. A breakout above this resistance may signal the end of the bear cycle.

Never Miss a Beat in the Crypto World!

Stay ahead with breaking news, expert analysis, and real-time updates on the latest trends in Bitcoin, altcoins, DeFi, NFTs, and more.

FAQs

What is Uniswap (UNI) and how does it work?

Uniswap is a leading decentralized exchange protocol, allowing users to trade tokens directly on Ethereum and Layer-2 networks without intermediaries.

What is Uniswap’s price prediction for 2026?

UNI could trade between $5.00 and $10.00 in 2026 if demand for DeFi grows and the token breaks key resistance levels.

What is the price prediction for Uniswap in 2027

Analysts estimate UNI could trade between $7.00 and $13.50 in 2027 if DeFi activity expands and the broader crypto market remains bullish.

How much will $1 UNI be worth in 2030?

Forecasts suggest UNI could reach $12.00 to $32.00 by 2030 if adoption increases and Uniswap continues leading decentralized exchange trading.

Can Uniswap (UNI) be a long-term investment?

UNI offers long-term potential as a key DeFi token, supported by Layer-2 adoption, stable protocol activity, and growing Ethereum ecosystem usage.

Analyst Warns Clarity Act 2026 Could Be Crypto’s Next “Sell the News” Trap

US Senate Draft Bill Could Finally Bring Clarity to the Crypto Market

The post Analyst Warns Clarity Act 2026 Could Be Crypto’s Next “Sell the News” Trap appeared first on Coinpedia Fintech News

The crypto community has a new catalyst, and the excitement is building fast.

With the Clarity Act 2026 stalled in the Senate but widely expected to pass, investors are already pricing in a major rally. JPMorgan called it a “positive catalyst.” Ripple CEO Brad Garlinghouse put the odds at 90% by end of April.

Across X, the narrative is that when regulatory clarity arrives, institutions flood in, prices explode.

But crypto trader Aaron, known as MooninPapa and a market participant since 2017, isn’t buying it.

“You’ve Seen This Movie Before”

Aaron’s argument isn’t that the Clarity Act doesn’t matter. It’s that by the time it passes, the market will have already moved.

“Buy the rumors, sell the news. Just because it’s crypto, it doesn’t mean that we shouldn’t be taking this into account,” he said.

His evidence is hard to ignore.

Bitcoin ETF rumors drove BTC from roughly $28,000 to $74,000, which is a 164% run. After the ETF actually launched, it was flat. Ethereum’s spot ETF announcement pumped ETH 20% in a single day. Over the following year, ETH lost 64%.

The same pattern has played out across forks, major partnerships, and protocol upgrades. And yet, every cycle, the crowd forgets.

Who’s Actually Winning Here?

Aaron also raises a harder question about who institutional adoption actually benefits.

“I’m rooting for BlackRock, a mega corporation that owns way too much Bitcoin, to have more influence over the price of Bitcoin in the future. Really.”

His broader near-term view is bearish. He believes Bitcoin topped in October 2025 and expects a bear market lasting roughly 12 months, with a price target around $35,000 by October 2026.

What It Means for Bitcoin and XRP

The Clarity Act may still pass. It may even spark a short-term move.

But if history is the guide, the traders who win won’t be the ones buying when the vote is confirmed. They’ll be the ones who bought while everyone was still asking when.

Never Miss a Beat in the Crypto World!

Stay ahead with breaking news, expert analysis, and real-time updates on the latest trends in Bitcoin, altcoins, DeFi, NFTs, and more.

FAQs

Will the Clarity Act 2026 cause a Bitcoin price explosion?

It could trigger short-term pumps as institutions enter, but history shows “buy the rumor, sell the news”—BTC surged 164% on ETF hype then flattened. Don’t chase the vote; position early.

Does institutional adoption from Clarity Act benefit everyday crypto traders?

It favors giants like BlackRock with massive BTC holdings, giving them price influence. Retail wins by trading rumors ahead, not holding through the “sell the news” dip.

Should I buy Bitcoin or XRP now ahead of Clarity Act 2026 passage?

Yes, if history repeats—rumors drove huge gains before ETF launches. But expect post-passage pullbacks; target entries during uncertainty, not confirmation, for max upside.

While Bitcoin and Ethereum Consolidate, This Altcoin Is Quietly Preparing for a Major Rally

Altcoins to Buy Now: Raoul Pal Says These Three Chains Stand Out

The post While Bitcoin and Ethereum Consolidate, This Altcoin Is Quietly Preparing for a Major Rally appeared first on Coinpedia Fintech News

While Bitcoin and Ethereum continue to move sideways, one major altcoin appears to be quietly building momentum beneath the surface. Growing institutional interest and a tightening technical structure suggest that Solana’s price could be positioning itself for a significant move in the coming weeks. Recent data shows cumulative Solana ETF inflows climbing, highlighting rising demand from institutional investors even as the broader crypto market consolidates.

Now that the SOL price action is tightening near key resistance levels, a decisive breakout seems to be approaching. However, it would be interesting to watch whether the price will make it to the $100 threshold or not. 

Institutional Demand for Solana Accelerates

The first chart highlights a consistent rise in cumulative inflows into Solana-based ETFs. Since late October, inflows have accelerated significantly, pushing the total to $1.45 billion.

Such steady capital inflows often signal growing institutional confidence in the asset’s long-term potential.

sol price

Institutional flows typically play a key role in shaping market cycles, as sustained demand from ETFs can absorb supply from the market and provide stronger price support during corrections. In the times when the SOL price has plunged over 57% since the spot ETF launch, it indicates that investors believe in the long term potential of the SOL price. This can be considered as conviction, but not hype, as smart money is getting in. 

Solana (SOL) Price is Forming a Bullish Structure

From a technical perspective, the Solana price has formed a strong bullish structure that aims to reach the highs not tested in the past few weeks. The price is trading within an ascending or rising wedge that usually results in a breakdown below the support. However, after a brief correction, the price is believed to rise and reach higher targets. 

sol price

The price is currently consolidating between a price range of $82 and $90, with a trendline support around $88. This tightening range indicates that buyers are gradually stepping in at higher levels, compressing price action toward resistance. Momentum indicators are beginning to show early signs of recovery, as RSI has been rising, forming constant higher highs and lows. Besides, DMI underwent a bullish crossover, indicating a drop in selling pressure. Together, these signals suggest that the market could be entering a reaccumulation phase. 

What’s Next—Key Levels to Watch

For Solana, the next major move will likely depend on how the price reacts around the current resistance zone. If SOL breaks above $92, the next upside target could emerge near $96, which aligns with the projected breakout path of the ascending triangle, opening the door to $100. Failure to hold the $82 support level may invalidate the bullish structure and could push the price back toward $65, where the next major demand zone lies.

The combination of rising institutional ETF inflows and tightening price structure suggests that Solana could be preparing for its next significant move. If institutional demand continues to build while technical support holds, SOL price may be positioned for a breakout in the coming weeks.

FAQs

Why is SOL’s price down today?

Solana’s price may dip due to short-term profit taking, broader crypto market consolidation, or resistance near $90, even as long-term institutional demand remains strong.

Is Solana likely to reach $100 soon?

Solana could approach $100 if it breaks above the $92 resistance. Strong ETF inflows and improving momentum suggest a potential bullish breakout.

What price level confirms a Solana breakout?

A sustained move above $92 would confirm bullish momentum for Solana, potentially opening a path toward $96 and the psychological $100 level.

Decred Price Analysis: Rising Channel Structure Signals Potential 60% Rally Ahead 

Decred Price Analysis Rising Channel Structure Signals Potential 60% Rally Ahead

The post Decred Price Analysis: Rising Channel Structure Signals Potential 60% Rally Ahead  appeared first on Coinpedia Fintech News

As the broader crypto market navigates another phase of volatility, several altcoins are beginning to display early signs of structural shifts on their charts. While major assets like Bitcoin and Ethereum continue consolidating, Decred price has quietly started attracting attention among technical traders. Recent price movements suggest that something more significant may be developing beneath the surface. After spending weeks in a compressed range, the token has begun to test key breakout levels, hinting that market sentiment around the token may be gradually changing. 

This subtle shift in structure is now raising an important question for traders watching the chart closely: Could Decred price be preparing for a much larger move ahead? To understand where the token might be heading next, the Decred price analysis offers some important clues.

Breakout Above Consolidation Signals Structural Shift

Decred token price recently managed to break above a critical horizontal resistance level near $25, which had capped the price during the previous consolidation period. This breakout marked an important turning point in the chart structure. Before this move, the token spent an extended period trading inside a compressed range where buying and selling pressure remained balanced. However, once the price pushed above this resistance zone, the structure began to shift toward a more constructive bullish formation.

Decred price analysis

Following the breakout, Decred price has started forming a clear rising channel pattern, a structure that typically reflects steady bullish momentum.

Within this formation, the price moves gradually higher while respecting two upward-sloping boundaries. The lower boundary acts as dynamic support, where buyers step in during pullbacks, while the upper boundary serves as the next resistance zone. 

So far, Decred has continued to respect the lower trendline of the channel, suggesting that buyers are defending dips and maintaining control of the trend. This behavior indicates that the market is building a stable upward trajectory rather than experiencing a sharp speculative spike. As long as the price continues trading within this channel structure, the overall outlook remains bullish.

Decred Price Analysis: Can Bulls Push Toward $45?

Based on the current chart setup, Decred appears to have room for further upside if the rising channel structure continues to hold. The next major resistance sits near the $45 region, which aligns with the upper boundary of the broader price projection. Reaching this level would represent roughly a 60% upside from current levels, making it a key target for bullish traders.

However, the token will likely experience short-term pullbacks along the way, which are common within ascending channel formations. These retracements often help sustain momentum by allowing the market to build new support levels. If Decred continues respecting the breakout zone and maintains the rising channel structure, the broader technical outlook suggests that DCR token could gradually move toward higher resistance zones in the coming weeks.

Final Outlook

Decred’s recent breakout from consolidation and the formation of a rising channel indicate that the asset may be entering a new bullish phase. While the move remains in its early stages, the current price structure suggests that buyers are beginning to regain control. If the key support zones hold and momentum continues building, Decred price could be positioning itself for a potential move toward the $45 resistance region.

FAQs

Why is Decred price gaining attention among crypto traders?

Decred recently broke above the $25 resistance level and formed a rising channel, signaling a potential bullish trend and renewed buying interest.

Can Decred price reach $45 in the near future?

If the bullish channel holds and buying momentum continues, the next major resistance target for Decred could be around $45.

Is Decred entering a new bullish phase?

The breakout from consolidation and sustained higher lows suggest growing bullish momentum, though short-term pullbacks may occur during the trend.

U.S. CLARITY Act Delayed as Banks Oppose Stablecoin Rewards, ALL Eye On April 16

Clarity Act Crypto 2026 Odds Crash as Tariffs Rattle Markets

The post U.S. CLARITY Act Delayed as Banks Oppose Stablecoin Rewards, ALL Eye On April 16 appeared first on Coinpedia Fintech News

The U.S. crypto bill has hit a roadblock after banks said they cannot support a White House plan on stablecoin rewards. Because of this disagreement, talks have slowed down. 

Now many are watching the April 16 roundtable by the U.S. Securities and Exchange Commission, where regulators and industry leaders will discuss the bill’s future.

CLARITY Act Hit A Roadblock, Why?

The ongoing negotiations over the CLARITY Act, a major U.S. crypto regulation bill, have hit a roadblock after banks opposed a proposed rule on stablecoin rewards. The bill, which passed the House last July, aims to bring clear rules to the digital asset market.

Under the proposal, the Commodity Futures Trading Commission would oversee digital commodities like Bitcoin, while the U.S. Securities and Exchange Commission would regulate crypto assets that qualify as securities.

Supporters believe the law could give the U.S. crypto market a clear legal structure and help companies operate with more certainty.

Stablecoin Rewards Dispute Between Banks and Crypto Firms

The biggest disagreement centers on stablecoin rewards. Crypto companies want to offer 3 to 4% incentives to attract users and compete in the growing digital payments market.

Banks strongly oppose this idea. They worry that rewards could encourage people to move money out of traditional bank accounts and into crypto wallets.

Some financial institutions estimate that stablecoins could pull $500 billions from bank deposits in the coming years. Such outflows could reduce funds available for loans and weaken parts of the banking system.

White House Proposal Fails to Win Bank Support

To resolve the dispute, the White House proposed a middle-ground solution. The plan allowed rewards only for limited uses, such as peer-to-peer payments, while banning incentives for stablecoins that remain idle in wallets.

Most crypto companies accepted the proposal because it still allows them to compete for users. However, banks rejected the compromise and pushed for stricter limits.

Following the disagreement, Donald Trump criticized banks on Truth Social and said he would not allow them to undermine his crypto agenda.

April 16: SEC Hosting Roundtable On Clarity Act

Despite the setback, discussions around crypto regulation continue. The U.S. Securities and Exchange Commission plans to hold a roundtable to review how federal securities laws should apply to digital assets.

The debate will also examine how new crypto rules could support innovation while protecting investors.

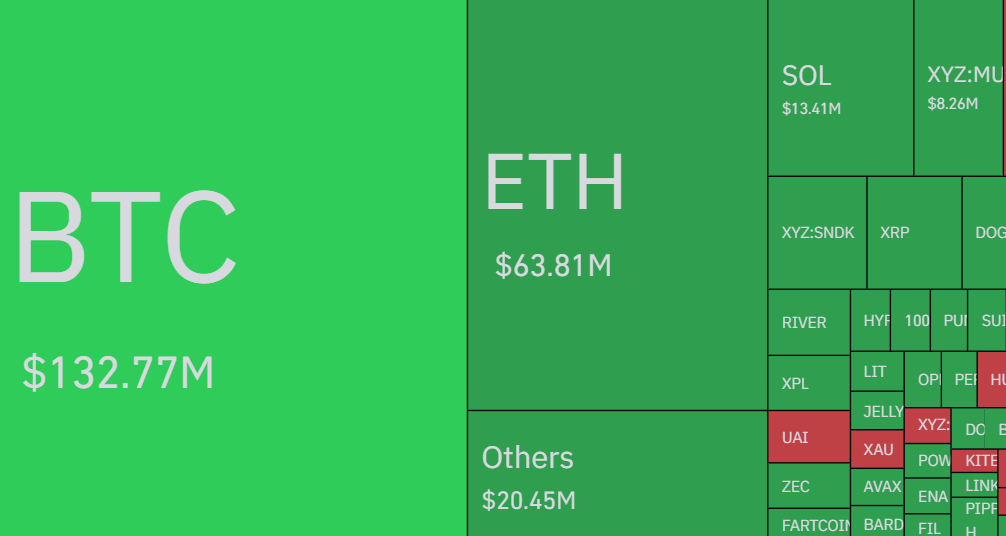
🚨BREAKING: The SEC is hosting a roundtable on CLARITY ACT on April 16! $RLUSD 🤝 #XRP pic.twitter.com/kR8hZOz3gQ

— JackTheRippler © (@RippleXrpie) March 6, 2026

However, with negotiations stalled and banks still resisting stablecoin rewards, many observers now believe the CLARITY Act may not become law until 2026.

Never Miss a Beat in the Crypto World!

Stay ahead with breaking news, expert analysis, and real-time updates on the latest trends in Bitcoin, altcoins, DeFi, NFTs, and more.

FAQs

Why is the CLARITY Act crypto bill facing delays?

The bill is stalled because banks oppose a White House plan to allow interest payments, or rewards, on stablecoins, causing a major disagreement in negotiations.

What’s the stablecoin rewards dispute in CLARITY Act?

Crypto firms push 3-4% rewards to lure users for payments; banks oppose, worried it’ll drain deposits and hurt lending. White House offered limited P2P rewards, but banks said no.

What’s next for the CLARITY Act after the roadblock?

SEC hosts an April 16, 2026 roundtable on applying securities laws to crypto, debating innovation vs. investor protection—key step amid stalled talks, possible law in 2026.

XRP Spot ETFs See $6.15M Outflows as Demand Slows

XRP Spot ETFs See $6.15M Outflows as Demand Slows

The post XRP Spot ETFs See $6.15M Outflows as Demand Slows appeared first on Coinpedia Fintech News

U.S. XRP spot ETFs recorded $6.15 million in net outflows, reflecting weak investor demand across crypto ETF products, according to data from SoSoValue. The entire outflow came from Franklin Templeton’s XRPZ fund, which saw $6.15 million leave the product during the period. Meanwhile, other XRP ETFs reported no net inflows or outflows, showing limited trading activity.

Fed Rate Cut Buzz Ignites Crypto Markets as Bitcoin Reclaims Momentum

FED Rate Cut

The post Fed Rate Cut Buzz Ignites Crypto Markets as Bitcoin Reclaims Momentum appeared first on Coinpedia Fintech News

The conversation around the Federal Reserve is heating up across crypto communities, and the mood is overwhelmingly bullish. According to social analytics platform LunarCrush, online sentiment toward the Fed has climbed to 91% positive, the highest level in the past year.

At the same time, engagement around the topic has exploded. LunarCrush recorded 181.2 million social interactions in just 24 hours, roughly 384% higher week-over-week, with more than 7,100 creators discussing the Fed. Nearly 95% of the activity came from the social platform X.

The reason for the optimism is simple: many investors believe interest-rate cuts could be approaching. Lower rates typically inject liquidity into markets and historically support risk assets such as Bitcoin and Ethereum.

But financial markets are not fully convinced.

Futures Market Says the Fed Will Likely Pause

Despite the bullish social sentiment, expectations from professional traders remain cautious. Data from the Chicago Mercantile Exchange FedWatch Tool shows that most strategists expect the Federal Reserve to pause interest rates at the March 17 meeting.

Instead of an immediate pivot, the first potential rate cut may not arrive until June, depending on economic conditions.

One key obstacle is inflation. The core Personal Consumption Expenditures index, the Fed’s preferred inflation gauge, remains around 2.8%, still above the central bank’s 2% target. Recent Fed meeting minutes also warned that policy easing “may not be warranted” until disinflation clearly resumes.

There are additional uncertainties as well. The term of Fed Chair Jerome Powell expires on May 15, meaning leadership changes could alter policy direction. Economists are also watching potential tariff passthrough effects, which could push consumer prices higher later this year.

How Crypto Could Still Rally Without a March Cut

Even if the Fed holds rates steady in March, the crypto market could still see upside momentum.

Crypto often rallies before the actual policy shift, as investors price in future liquidity conditions. If traders remain confident that rate cuts are coming later in the year, speculative capital could continue flowing into digital assets. Meanwhile, Bitcoin recently climbed close to the $72,000 level, rebounding roughly 20% from its February lows near $60,000, as institutional demand and improved risk appetite returned to the market.

This macro stability itself can support crypto. A Fed pause signals that tightening may be nearing its end, which historically improves risk appetite across markets.

Two Economic Reports That Could Trigger the Next Move

The next major catalysts for crypto markets will be two key economic reports.

The February jobs report on March 7 will reveal whether the labor market is cooling, while the February CPI inflation report on March 12 will show if price pressures are finally easing.

If both reports come in softer than expected, expectations for rate cuts could strengthen rapidly. In that scenario, crypto markets may begin pricing in a full liquidity cycle, setting the stage for the next major rally.

Never Miss a Beat in the Crypto World!

Stay ahead with breaking news, expert analysis, and real-time updates on the latest trends in Bitcoin, altcoins, DeFi, NFTs, and more.

FAQs

Why is crypto sentiment turning bullish about the Federal Reserve?

Crypto investors expect interest-rate cuts soon. Lower rates add liquidity to markets, which historically boosts demand for risk assets like Bitcoin and Ethereum.

Will the Federal Reserve cut interest rates in March?

Markets mostly expect the Fed to pause in March. Traders believe the first possible rate cut may come later in 2026 if inflation continues to cool.

How do Federal Reserve interest rates affect Bitcoin and crypto prices?

Lower rates increase liquidity and risk appetite. That often pushes investors toward assets like Bitcoin and Ethereum, helping crypto markets rally.

Which economic reports could impact crypto markets next?

The February jobs report and CPI inflation data are key. Softer numbers could strengthen rate-cut expectations and potentially trigger a crypto rally.

Kazakhstan Central Bank Plans $350M Crypto Investment In BTC, ETH  

Kazakhstan Central Bank Plans $350M Crypto Investment In BTC, ETH

The post Kazakhstan Central Bank Plans $350M Crypto Investment In BTC, ETH   appeared first on Coinpedia Fintech News

Kazakhstan, known as a regional digital powerhous is preparing to enter the crypto market in a big way. The country’s central bank plans to invest $350 million in cryptocurrencies, including Bitcoin, Ethereum, and other digital assets. 

The plan comes a month after early reports suggested Kazakhstan was exploring crypto investments.

Kazakhstan Central Bank Plan $350M Crypto Investment

The National Bank of Kazakhstan plans to allocate about $350 million to crypto-related investments using funds from its gold and foreign exchange reserves, which currently total around $69 billion.

The initiative was announced by central bank governor Timur Suleimanov, who confirmed that the institution is designing a list of financial tools connected to the digital asset market.

However, the plan will not focus only on cryptocurrencies themselves. 

🚨Just in: National Bank of Kazakhstan plans to allocate $350M to #crypto using funds from its gold and foreign exchange reserves.#CoinPedia #CryptoNews #Blockchain #CryptoMarket

— Coinpedia (@CoinpediaNews) March 6, 2026

According to Suleimanov, the bank is considering a wider strategy that includes several types of investments linked to the crypto industry.

Investment Goes Beyond Bitcoin, Ethereum

Officials explained that the central bank may allocate funds not only to digital assets like Bitcoin or Ethereum, but also to companies building infrastructure around cryptocurrencies.

This could include technology firms working in blockchain development, companies providing crypto-related services, and investment products such as index funds that follow the performance of digital assets.

The strategy suggests that Kazakhstan is exploring ways to gain exposure to the growing digital economy without relying solely on direct cryptocurrency purchases.

Investments Expected to Start in April or May

According to Aliya Moldabekova, the central bank expects the investment process to begin around April or May.

She clarified that the institution does not plan to move aggressively into cryptocurrencies immediately. Instead, officials are carefully selecting companies and financial instruments connected to digital assets before committing funds.

If implemented, the move could position Kazakhstan among a growing group of governments exploring the role of digital assets in national financial systems.

Never Miss a Beat in the Crypto World!

Stay ahead with breaking news, expert analysis, and real-time updates on the latest trends in Bitcoin, altcoins, DeFi, NFTs, and more.

FAQs

Is Kazakhstan’s central bank really investing $350 million in crypto?

Yes, the National Bank of Kazakhstan plans to allocate $350 million from its $69 billion reserves to crypto-linked investments, starting around April or May for steady exposure.

Why is Kazakhstan investing in cryptocurrencies now?

As a digital hub, Kazakhstan sees crypto’s growth potential. This diversifies reserves beyond gold and forex, tapping blockchain infrastructure without full crypto volatility.

When will Kazakhstan start its crypto investments?

Officials expect investments to begin around April or May after evaluating crypto companies and financial tools linked to the digital asset market.

How could Kazakhstan’s crypto investment affect the market?

Government investment can boost confidence in digital assets and highlight growing global interest in integrating cryptocurrencies into financial systems.

Pi Network Gains Attention Today With New Update

Pi Network Gains Attention Today With New Update

The post Pi Network Gains Attention Today With New Update appeared first on Coinpedia Fintech News

Pi Network is drawing growing attention after a recent price surge pushed its market ranking up to around 34th place. The project has also been teasing major ecosystem upgrades, including plans for decentralized exchanges (DEXs) and new applications on its network. These developments could bring more activity and adoption to the platform. Pi Network continues to build its ecosystem as it aims to move beyond its early mining phase and grow into a broader crypto platform.

Bitcoin Price Prediction: Will BTC Hold $70K as Iran-Israel Tensions Rise?

Bitcoin Price Prediction Will BTC Hold $70K as Iran-Israel Tensions Rise

The post Bitcoin Price Prediction: Will BTC Hold $70K as Iran-Israel Tensions Rise? appeared first on Coinpedia Fintech News

Bitcoin nearly touched $74,000 on Thursday. Today, it is down 3.29% and trading around $70,355 at the time of writing.

The run to $74,000 wiped out $471 million in crypto derivatives in under 24 hours, $348 million of it from short positions caught badly offside. It was the largest daily short liquidation since late February, resetting a significant chunk of leveraged positioning across the market.

The rally, however, didn’t hold.

What’s Weighing on Bitcoin Today

US-Israel-Iran tensions escalated sharply on March 6, sending shockwaves through global markets. The Dow is down over 780 points at 47,954. WTI crude is trading at $83.30. Gold is holding near $5,100

Bitcoin is now moving with a 0.86 correlation to gold, and $74,000 proved too strong a resistance to clear. It now sits directly on a whale bid zone that traders are watching closely.

The Level That Decides What Comes Next

Blockchain advisor and investor Anndy Lian pointed to the $70,000-$71,000 zone as the line to watch.

“If BTC holds the $70,000 to $71,000 whale bid zone, it could retest $74,000,” Lian noted. “A break below risks a move toward $67,500.”

He added that geopolitical risk and rising oil prices remain the primary macro drivers, with derivatives positioning adding crypto-native volatility on top.

One Analyst Still Sees $80K in March

Not everyone is reading this as a warning sign.

Crypto analyst Michael Van de Poppe posted on X: “Very healthy price action on Bitcoin and I think we’ll start to see that breakout next week and see $80K as a test in March.”

There we go,

Consolidation before continuation.

Very healthy price action on #Bitcoin and I think we'll start to see that breakout next week and see $80K as a test in March. pic.twitter.com/vqVZaWZa0C

— Michaël van de Poppe (@CryptoMichNL) March 6, 2026

Van de Poppe’s view is that the current pullback is consolidation, not deterioration and that the squeeze earlier this week was part of healthy price action resetting the market for a move higher.

The Market Is Split

The market is sitting with two competing views. Technically, the structure could still support a push higher. On the macro side, oil above $80 and a strengthening dollar complicate that path considerably.

With funding rates normalized and open interest slightly lower, what happens next depends on whether geopolitical pressure keeps draining risk appetite or the positioning reset sets up the next leg up.

The $70,000 level will likely tell the story.

Never Miss a Beat in the Crypto World!

Stay ahead with breaking news, expert analysis, and real-time updates on the latest trends in Bitcoin, altcoins, DeFi, NFTs, and more.

FAQs

How might geopolitical tension impact Bitcoin’s near-term prediction?

Escalating conflicts reduce risk appetite, boost safe havens like gold and oil, and can pressure BTC lower in the near term.

How will derivatives and liquidations shape short-term Bitcoin moves?

Derivatives resets and liquidations can amplify moves: leverage unwinds may trigger sharp squeezes that speed rallies or drops.

If bullish momentum returns, what longer targets should traders watch?

If momentum and macro conditions align, BTC could test $80k–$90k, but expect high volatility and risk from macro data.

Chinese Crypto Whale Predicts Bitcoin To Hit $500K This Year, Here’s Why

Bitcoin Price Prediction Is the BTC Bottom Finally In—or Is More Pain Ahead

The post Chinese Crypto Whale Predicts Bitcoin To Hit $500K This Year, Here’s Why appeared first on Coinpedia Fintech News

Flagship cryptocurrency Bitcoin, which has been struggling since the start of the year, is now believed to rally 10x. Chinese crypto whale Wei Zhao claimed that Bitcoin could surge to $500,000 by the end of this year. 

He says several strong trends are now coming together that could increase demand for Bitcoin.

He cited multiple reasons why Bitcoin is going to hit $500K This year.

AI Could Create New Demand for Bitcoin

According to Wei Zhao, many big tech companies are now building AI systems that could use crypto. Instead of humans making most payments online, AI agents may soon send money to each other automatically.

Zhao said that AI agents cannot easily use traditional payment networks such as bank accounts or credit cards. Therefore, crypto wallets could become the default payment method for automated software.

Following the advancement into AI, Zhao believes crypto networks could become the main payment system for AI-to-AI transactions.

If billions of AI agents eventually require crypto wallets, demand for digital assets like Bitcoin and stablecoins could increase dramatically.

Coinbase, Circle Fueling the AI-Crypto Trend

Several recent developments support his view. 

  • The crypto exchange Coinbase recently launched wallets designed for AI agents rather than human users. 
  • Meanwhile, payments company Circle introduced extremely small transactions that allow machines to send payments as low as $0.000001.

Zhao says this type of technology could unlock billions of automated transactions between machines.

Even SpaceX reportedly holds hundreds of millions of dollars worth of Bitcoin, while xAI, the AI venture linked to Elon Musk, has been expanding rapidly and hiring blockchain specialists.

Zhao’s Timeline for Bitcoin Price to hit $500K

According to Zhao’s outlook, Bitcoin could first break $100,000 as infrastructure for AI agents grows. Later, if AI-driven activity expands quickly, institutional investors could start buying Bitcoin aggressively. If that demand arrives, Zhao believes Bitcoin could reach $500,000 by the end of the year.

Looking at the long-term Bitcoin chart, the price seems to be following a similar pattern seen in past cycles before big rallies. Bitcoin is moving inside a long upward channel that has guided its growth for years. In earlier cycles, similar patterns led to huge price jumps.

Crypto Whale Predicts Bitcoin To Hit $500K This Year

While the $500K target is still uncertain, Wei Zhao says the current setup looks similar to past moments when Bitcoin rose far beyond expectations.

For now, Bitcoin is trading near $71,000, far below that level. 

Why is OKB Price Rising Today? $25B ICE Investment in OKX Sparks Massive Rally

OKB Price Prediction: Why the Exchange Token is Rallying to New Highs

The post Why is OKB Price Rising Today? $25B ICE Investment in OKX Sparks Massive Rally appeared first on Coinpedia Fintech News

OKB price has suddenly come to the spotlight after staging one of the strongest rallies in the crypto market this week. The token surged nearly 30% in a single day, pushing toward the $100 mark as traders rushed to price in a major institutional development surrounding the OKX ecosystem.

The rally follows reports that Intercontinental Exchange (ICE), the parent company of the New York Stock Exchange (NYSE), has invested in OKX at a valuation of roughly $25 billion. The news immediately sparked bullish sentiment, with market participants viewing the move as a significant step toward deeper institutional integration between traditional finance and crypto exchanges. While the broader crypto market has been relatively mixed, OKB’s sharp move suggests that investors are reacting strongly to the potential long-term implications of the deal.

Institutional Interest Returns to the OKX Ecosystem

The reported investment from ICE is being interpreted as a major confidence signal for the exchange. ICE is one of the most influential financial infrastructure companies globally and operates several major financial markets, including the New York Stock Exchange. Its involvement with OKX is therefore seen by analysts as a strategic move that could help expand institutional participation within the platform.

Market discussions suggest the collaboration could eventually lead to expanded institutional trading services and potential integration of tokenized financial assets, including equities and derivatives linked to traditional markets.

🚨 JUST IN: NYSE parent ICE invests in crypto exchange OKX at a $25B valuation to explore tokenized stock trading. pic.twitter.com/IqYrEhRHZq

— Xmarket | Prediction Markets (@Xmarketapp) March 6, 2026

If such initiatives materialize, OKX could position itself more firmly as a bridge between traditional finance (TradFi) and the crypto industry, a narrative that has been gaining momentum across the sector. For traders, however, the bigger question is whether the institutional news will translate into a sustained trend reversal for OKB price.

OKB Price Analysis: Breakout Momentum Builds Near Major Hurdle

OKB token price appears to be attempting a structural breakout after several months of downward pressure and consolidation. The daily chart shows that the token spent a prolonged period moving within a descending structure after peaking in late 2025. During this period, sellers repeatedly defended a major supply zone between $120 and $130, preventing any meaningful recovery.

OKB price

However, the recent surge has dramatically shifted the market structure. After forming a base around the $70–$80 demand zone, OKB began to stabilize and gradually build momentum. The latest rally pushed the token above the $95–$100 level, effectively breaking out of its recent consolidation range and signaling renewed bullish strength. This breakout now places the token directly beneath the major supply zone near $120–$130, which represents the next critical technical barrier.

If bulls manage to push the price decisively above this resistance area, the chart structure suggests that the next upside target could emerge around the $140 region, where the next historical resistance level sits. If OKB fails to clear the $120–$130 supply zone, the token could enter a short-term consolidation phase, with $95–$100 likely acting as the first support region where buyers may attempt to defend the breakout.

Bitcoin and Ethereum ETFs See $320M in One-Day Outflows

Bitcoin and Ethereum ETFs See $320M in One-Day Outflows

The post Bitcoin and Ethereum ETFs See $320M in One-Day Outflows appeared first on Coinpedia Fintech News

Spot Bitcoin and Ethereum ETFs saw heavy withdrawals on March 5, with nearly $320 million leaving the funds in a single day. Data from SoSoValue shows Bitcoin spot ETFs recorded about $228 million in outflows, with BlackRock’s IBIT seeing the largest withdrawal among the funds. Ethereum spot ETFs also faced pressure, posting $90.94 million in net outflows. Despite the broader trend, BlackRock’s ETHA stood out by attracting $30.25 million in inflows, making it the only major Ethereum ETF to record gains during the day.

Bitcoin Supply Shrinks to 2017 Levels as Wallets Hit Record High—Is BTC Price Preparing for a Big Move?

Bitcoin price crash 2026

The post Bitcoin Supply Shrinks to 2017 Levels as Wallets Hit Record High—Is BTC Price Preparing for a Big Move? appeared first on Coinpedia Fintech News

Bitcoin price is flashing a rare combination of growing adoption and tightening supply, a setup that historically precedes strong price expansions. The bulls are attempting to lift the price above the bearish influence, while the on-chain data has also turned bullish. The BTC wallet holders are rising while the exchange supply is plunging. This divergence suggests that investors are increasingly moving their Bitcoin into long-term storage rather than keeping it ready for sale.

With this, the question arises: Is the price gearing up for a huge price action? Is Bitcoin preparing a move to $100K?

Bitcoin Adoption Continues to Expand

The steady rise in non-empty wallets indicates that Bitcoin’s network participation continues to grow despite recent price volatility. On-chain data from Santiment shows that the number of non-empty Bitcoin wallets has surged to a new all-time high of 58.45 million, up nearly 1.69 million in the past six months. At the same time, the amount of Bitcoin held on exchanges has dropped to 1.17 million BTC — the lowest level since December 2017.

btc price

Even more notable is the sharp decline in Bitcoin reserves on centralized exchanges. When BTC leaves exchanges, it typically means that investors are transferring coins to cold storage or long-term custody solutions, reducing the immediate supply available for selling. With only 1.17 million BTC currently held on exchanges, market liquidity is tightening. If demand rises during this period of reduced supply, Bitcoin could face a potential supply squeeze, amplifying price moves to the upside.

Bitcoin Price is Testing Key Support

From a technical perspective, Bitcoin is currently testing a critical resistance zone around $74,000, which previously acted as a strong support level during the 2025 rally. The weekly chart shows that BTC recently broke below an ascending trendline that supported the broader bull cycle. However, a rise above the immediate resistance may only push the price towards the ascending trend line.

btc price

The weekly RSI reached the lower threshold and has displayed a bullish divergence, suggesting that selling momentum may be weakening. Meanwhile, the MACD remains in bearish territory, indicating that the market is still in a short-term corrective phase. However, the selling pressure seems to have waned in the long term, and as the MACD levels display, there is the possibility of a bullish crossover, which may ignite a strong recovery.

Key Levels to Watch

  • Immediate support: $74,000
  • Major support: $48,000
  • Trendline resistance: $91,500

A successful reclaim of the trendline could open the door for a retest of the $100,000 psychological level.

What This Means for the Crypto Market

The combination of record wallet growth and declining exchange supply suggests that long-term investors continue accumulating Bitcoin despite the recent pullback. If demand strengthens while exchange reserves remain low, BTC price could experience a supply-driven rally in the coming months.

However, failure to hold the $74K support level could extend the correction toward the $48K demand zone, where stronger buyer interest may emerge. For now, Bitcoin price appears to be in a short-term correction within a broader accumulation phase, with on-chain data hinting that the next major move could still favor the bulls.

Will The Pressure Hold For OKB, Humanity Protocol, and Kite After Bitcoin Slips Amid Extended US-Iran War

Will The Pressure Hold For OKB, Humanity Protocol, and Kite After Bitcoin Slips Amid Extended US-Iran War

The post Will The Pressure Hold For OKB, Humanity Protocol, and Kite After Bitcoin Slips Amid Extended US-Iran War appeared first on Coinpedia Fintech News

  • Bitcoin faces 2% reversal from the 50-day EMA on Thursday, Slips below $71000.
  • The surge in altcoins OKB, Human Protocol, and Kite continues to raise concerns.
  • Wll the pressure hold for Ethereum, XRP, and these altcoins as the US -Iran War extends? 

Top Cryptocurrencies Bitcoin, Ethereum, and XRP showed cautious trading, with a roughly 2% pullback near their respective key support levels on Friday. BTC was trading below $71,000, ETH price remained above $ 2,000, and XRP was in sideways consolidation.

Other top-performing cryptos today are OKB (26%), Human Protocol(30%), and Kite(21%), which have spiked, making it to the top coins of the day list. 

OKB Must Close Above 200-D EMA To Sustain. 

OKB exchange native Coin OKB moved nearly 3% since yesterday, adding to its 24% surge from the previous day. This surge was fueled by an Investment of $25B by the New York Stock Exchange’s parent company, Intercontinental Exchange. 

As we see in OKB/USDT daily chart, the declining EMA’s leave a bearish sentiment. OKB coin needs a strong close above its 200D EMA level at $104 for a sustain uptrend. This closing can send it straight to its 50% Retracemenr level at $124.

OK Coin towards 200 d EMA
OK Coin moving strong


RSI at 70 shows the coin is overbought zone, but MACD is in bullish side as it crosses the Signal line and a wide histogram.

Currently trading at $97.30, with the increased positive momentum around OKB, it is going to continue the rally. If rejected at any level, it will seek the 50-d EMA as its next at $87.

Humanity Protocol Remains Bullsh

Humanity Protocol extended roughly 4% today to its Thursday gains of 43%. The H has extended its gains above the 200-d EMA and other EMAs, eyes continue to rally as RSI at 57 has reversed from hitting the oversold zone. 

HUSDT Super Stromg on Charts

H/USDT attempted the $0.2, and is likely to surpass. If invalidated, it could test $0.13 50% retracement level. 

KITE Coin Bulls Are Strong

KITE Coin stands as the flag bearer of AI Coin in recent trading sessions as all the AI Coins seem to be underperforming. KITE on Friday is up 25%, showing increased buyer dominance. 

The KITE/USDT price chart shows its upward momentum since its launch. The asset is now extending gains above the 200-D EMA and others.

KITEUSD Super Bullish


Open Interest in futures surges to 35% to $102.48 million, indicating new positions opening in parallel with the rally. 

With the RSI moving toward the overbought zone, the KITE price may face rejections, but the rally continues. Invalidating this can bring it to its first resistance at $0.23. 

Vancouver City Staff Drops Bitcoin Reserve Plan, Says BTC Not Allowed

Bitcoin Faces Crucial $70,000 Test—Can Bulls Secure the Level and Shift Momentum

The post Vancouver City Staff Drops Bitcoin Reserve Plan, Says BTC Not Allowed appeared first on Coinpedia Fintech News

A proposal to make Vancouver a Bitcoin-friendly city is now facing a setback after city officials recommended cancelling the plan. Staff says local law does not allow the city to invest public funds in Bitcoin.

This puts an end to Mayor Ken Sim’s proposal to add Bitcoin to city reserves and accept crypto payments. He had even pledged to donate $10,000 in Bitcoin if the plan was approved.

Bitcoin Not an ‘Allowable Asset’ Under City Law

After reviewing the proposal, officials working for the City of Vancouver have advised the city council to withdraw the plan to add Bitcoin to the city’s financial reserves.

City staff said that Bitcoin does not qualify as an “Allowed Investment” under the Vancouver Charter. This law decides how the city manages its money and what types of assets it is allowed to invest in.

Since Bitcoin is not on the list of approved assets, the city staff recommended ending the work on this proposal. They also suggested that the city should focus its time and resources on other projects that are a higher priority.

Bitcoin reserve plan Bitcoin Not an ‘Allowable Asset’ Under Vancouver City Law

The recommendation came during a review of council plans. Officials looked at 181 plans made between 2018 and 2025. 103 are already finished, while the remaining 78, including the Bitcoin plan, are now being checked to decide if they should continue or be stopped

How the Bitcoin Reserve Plan Started?

The proposal “Preserving the City’s Purchasing Power Through Diversification of Financial Reserves – Becoming A Bitcoin Friendly City,” was introduced by Vancouver mayor Ken Sim in November 2024. 

#VanCityCouncil approves motion 3. Preserving of the City’s Purchasing Power Through Diversification of Financial Reserves – Becoming A Bitcoin Friendly City.

— Vancouver City Clerk (@VanCityClerk) December 11, 2024

Sim said that Bitcoin could help protect the city’s purchasing power over time. The plan asked city staff to study whether Vancouver could accept payments in Bitcoin and whether a small portion of the city’s financial reserves could be converted into the cryptocurrency.

The city council approved the plan in December 2024 and asked city staff to give an update by early 2025. However, no public report was shared until earlier this week.

Bitcoin’s Price Volatility Ends Vancouver’s Crypto Plan

When Ken Sim made this proposal in December 2024, Bitcoin had just crossed $100,000 for the first time.

Now the BTC price has fallen to around $71,000. City staff in Vancouver say Bitcoin does not qualify as an “allowed investment.”

With staff now recommending that the plan be closed, Vancouver’s plan to become a Bitcoin-friendly city may soon end.

Never Miss a Beat in the Crypto World!

Stay ahead with breaking news, expert analysis, and real-time updates on the latest trends in Bitcoin, altcoins, DeFi, NFTs, and more.

FAQs

Why did Vancouver cancel its Bitcoin reserve proposal?

City staff advised canceling the plan because local law does not classify Bitcoin as an allowable investment for public funds.

Can the City of Vancouver legally invest in Bitcoin?

No. Under the Vancouver Charter, the city can only invest in approved assets, and Bitcoin is not currently on that list.

Could Vancouver adopt Bitcoin in the future?

It’s possible if laws change or Bitcoin becomes an approved asset, allowing the city to legally invest or accept crypto payments.

Top Crypto Presale: Pepeto Goes Viral, Leaving Bitcoin Hyper and Mutuum Finance Behind as IREN Orders 50,000 Nvidia GPUs

best-crypto-presale (1) (1)

The post Top Crypto Presale: Pepeto Goes Viral, Leaving Bitcoin Hyper and Mutuum Finance Behind as IREN Orders 50,000 Nvidia GPUs appeared first on Coinpedia Fintech News

IREN just ordered more than 50,000 Nvidia GPUs and filed a potential $6 billion offering to fund its expansion into AI cloud infrastructure, and when the biggest Bitcoin miners on the planet are abandoning pure mining to build AI data centers. 

It tells you the market is repricing around utility and infrastructure in a way that rewards the top crypto presale entries with real products already in development.

IREN Orders 50,000 Nvidia GPUs as Bitcoin Miners Pivot From Mining to AI Infrastructure

CoinDesk reported IREN ordered more than 50,000 Nvidia GPUs and filed for a potential $6 billion at the market share sale to fund AI infrastructure expansion, while Bloomberg data shows TeraWulf, Cipher Mining, and Bitdeer all pivoting away from pure mining toward high performance computing. 

When the industry’s largest operators abandon mining economics to chase AI utility, the top crypto presale is the one already built around real infrastructure, and Pepeto with $7.5M raised and a full exchange in development is exactly where that conviction is flowing.

Top Crypto Presale: Why Traders Are Migrating to Pepeto as Feature Development Fuels Massive Projections

Pepeto: The Top Crypto Presale Winning Over Traders With a Working Exchange Nobody Else Has

The current state of the market has pushed traders to search for the top crypto presale opportunities, and right now, Pepeto is at the center of this conversation. While most presales are still planning for the future, this project has transitioned into full development mode with a SolidProof audit backing every contract, and that move is changing how serious traders look at early stage allocation.

The first major attraction is the straightforward exchange interface. The layout is clean and intuitive, so both new and experienced traders find it easy to use. From the main dashboard, users can move between the cross chain bridge connecting Ethereum, BNB Chain, and Solana, the zero tax trading engine, the risk scoring system that classifies every token before you commit capital, and the portfolio tracker that maps your entire position across chains.

pepeto-upgrade

For instance, if you want to bridge assets from Ethereum to Solana while checking the risk score of a token on BNB Chain, you can do it all from one interface without ever leaving the platform. This infrastructure makes Pepeto the top crypto presale and the kind of project that serious capital trusts with real money.

Not only this, but Pepeto’s focus on long term value is clear. The cofounder of the Pepe ecosystem who built a token to $7 billion leads the development, and with $7.5M raised, the conviction behind this presale keeps accelerating with every round.

And 209% APY staking compounds every position daily, building value over time and fueling the kind of accumulation that tightens supply before the listing arrives. As the exchange keeps advancing, now is the best time to enter the top crypto presale before the next development milestone pushes the conversation even further.

Bitcoin Hyper Faces Scaling Questions Despite $31.5M Presale Raise

Bitcoin Hyper positions itself as a Layer 2 solution using the Solana Virtual Machine for faster BTC transactions. 

But the presale has already raised around $31.5M, which reduces explosive growth compared to earlier stage projects. The L2 space is dominated by Arbitrum, Base, and Lightning Network with real users, and the top crypto presale offers better positioning at a fraction of the entry.

Mutuum Finance Shows Traction but DeFi Lending Is Already Dominated

Mutuum Finance markets itself as a decentralized lending protocol with variable rate borrowing and overcollateralized loans. But the lending sector belongs to Aave and Compound with billions in TVL and years of proven security. 

Late stage funding and a crowded niche reduce the potential for explosive returns that the top crypto presale like Pepeto can deliver with a complete exchange.

The Bottom Line

The smartest operators in crypto, from IREN to TeraWulf, are pivoting toward utility because they know that infrastructure is where the real value accrues in this cycle. 

Pepeto is doing the same thing at presale pricing, and the parallel is not lost on the investors who have already committed $7.5M. 

The Bonk holders who bought at six decimal zeros and watched the Solana meme coin create overnight wealth understood timing, and the window sitting open inside Pepeto right now carries that exact same energy. 

Every day you wait is compounding profit you are handing to someone who already bought, and the listing will reprice this token permanently so the entry you see right now simply ceases to exist. 

Visit the Pepeto official website and lock in your position before this presale stage closes and you spend the rest of the cycle wishing you had not hesitated.

Click To Visit Pepeto Website To Enter The Presale

pepeto-presale

FAQs

What is the top crypto presale to buy in 2026?

The top crypto presale in 2026 is Pepeto with $7.5M raised, 209% APY staking, and exchange infrastructure that no other presale project can match. Visit the Pepeto official website.

Why are Bitcoin miners pivoting to AI infrastructure?

Mining costs now exceed $87,000 per BTC, so miners like IREN are ordering 50,000 GPUs for AI, which proves utility infrastructure is where the market is heading and why Pepeto with a full exchange is the top crypto presale.

Is Bitcoin Hyper a good presale investment?

Bitcoin Hyper raised $31.5M but faces stiff competition from established L2s, while Pepeto at earlier stage pricing with exchange infrastructure offers far greater return potential.

XRP Holders Selling at Loss as Price Struggles

XRP Holders Selling at Loss as Price Struggles

The post XRP Holders Selling at Loss as Price Struggles appeared first on Coinpedia Fintech News

XRP holders are selling at a loss as market pressure increases. Data from Glassnode shows XRP’s Spent Output Profit Ratio (SOPR) has dropped below 1.0, meaning many investors are selling for less than they paid. The token is trading around $1.41 after failing to break the $1.45 resistance level. A similar pattern was seen during XRP’s long sideways market between 2021 and 2022. Despite the weakness, some investors remain hopeful. They point to possible support from future crypto regulations and speculation about a partnership between Elon Musk’s X Money platform and Ripple-linked Cross River Bank.

Neo’s 2025 Financial Report Offers a Window Into Its $461M Treasury And Plans For Future Cycles

neo-financial-report

The post Neo’s 2025 Financial Report Offers a Window Into Its $461M Treasury And Plans For Future Cycles appeared first on Coinpedia Fintech News

Neo, the open-source, community-driven blockchain platform, has published its 2025 Financial Report and Insights, offering a closer look at the ecosystem’s financial position and its plans for the next phase of development. The report places Neo’s combined treasury at approximately $460.8 million and outlines a roadmap focused on transparency, asset diversification, and deeper commitment to network decentralization.

Originally launched as AntShares in 2014, Neo has spent more than a decade building its network. Over that period, ecosystem assets grew from $5.2 million in 2014 to $461 million by the end of 2025, representing an increase of more than 8,800%. The treasury is split between the Neo Foundation, which manages 49 percent of assets, and Neo Global Development (NGD), which manages the remaining 51 percent. Holdings are spread across BTC, NEO, GAS, and cash equivalents, such as stablecoins, a structure designed to support the ecosystem during market volatility.

The report also marks the beginning of a more formal approach to financial disclosure. Beginning this year, Neo plans to publish annual reports outlining treasury composition, investment activity, and ecosystem funding initiatives. The organization has also engaged global audit firms to conduct due diligence on its assets as part of a broader push to strengthen transparency for the community. 

The figures outlined also provide insight into how the treasury was built. Growth is attributed to a combination of on-chain revenue and treasury management strategies, including 43.4 million GAS through network activity, $40.2 million returned following the liquidation of NGC Fund 1, and the accumulation of 1,112 BTC through various operational strategies.

Beyond financial insights, the report also outlines where Neo’s technical roadmap is headed. In addition to core protocol development, the ecosystem is leaning into artificial intelligence, introducing Neo X as its dedicated AI strategy. 

Neo X is described as an agent-first chain designed to support AI-driven activity within the network. The system aims to allow AI agents to interact directly with the network, manage assets, and execute on-chain tasks on behalf of its users. A multi-layer architecture is designed to support core requirements such as communication, data storage, the protection of sensitive logic, and the reliable execution of transactions.

For Neo Founder Da Hongfei, the report reflects a broader effort to prepare the ecosystem for its next stage of development: “From the beginning of Neo’s journey in 2014, our focus has always been on building for the long-term. We have experienced both growth and challenges, and each cycle has strengthened our commitment to transparency and resilience. Looking ahead into 2026, we see a clear opportunity to further mature the network, expand the ecosystem, strengthen governance, and continue to build a strong foundation for the years ahead.”

As blockchain treasuries expand and on-chain activity becomes increasingly automated, structured financial reports are emerging as a key lens for communities to evaluate governance, sustainability, and long-term growth plans. Over time, the projects that stand out will be those that make details clear and verifiable. 

Pi Network Price Rallies After Major Upgrade Update: Can PI Coin Reclaim $0.35?

Pi Network Update for 2026

The post Pi Network Price Rallies After Major Upgrade Update: Can PI Coin Reclaim $0.35? appeared first on Coinpedia Fintech News

Pi Network price is showing fresh signs of strength after weeks of consolidation, rising more than 10% in the past 24 hours and reclaiming the $0.19–$0.20 zone. The rebound comes as the broader crypto market attempts to stabilize, but a key catalyst appears to be emerging from within the Pi ecosystem itself. Recent updates from the development team confirm progress on network migration and upcoming protocol upgrades, which has reignited bullish sentiment around the project.

With momentum building and development activity accelerating, traders are now asking an important question: Can Pi Network price sustain its recovery and reclaim the $0.35 level next?

Pi Network Price Analysis: Is a Major Rally Next?

Pi Network price appears to be entering an important transition phase after spending several months under sustained bearish pressure. The daily chart shows that PI coin recently broke out of a descending trendline structure that had been guiding the market lower since late 2025. This breakout is often considered an early signal that selling momentum is fading and that buyers are gradually reclaiming control of the trend.

Following this move, the token rebounded toward the $0.19–$0.20 region, confirming that demand has begun to return after the extended downtrend. However, the market is now approaching a critical resistance band between $0.25 and $0.27, a zone that previously acted as a strong supply area where sellers repeatedly stepped in. This resistance region will likely determine the next directional move for Pi Network price.

PI network price

If bulls manage to push the asset decisively above the $0.27 level, it would mark a significant structural shift on the chart. Such a breakout would invalidate the previous lower-high pattern and could open the door for a broader recovery rally toward the $0.35 level, where a major supply zone is visible on higher timeframes.The Relative Strength Index (RSI) has moved higher from oversold territory, suggesting that buying pressure is steadily building as traders position for a potential breakout.

If Pi Network price fails to break through the resistance band, the coin could enter another consolidation phase, with the $0.17–$0.18 demand zone likely acting as the primary support area.

Network Upgrade Adds Tailwind

Alongside the improving chart structure, recent updates from the Pi Network ecosystem may also be supporting sentiment. 

💥BREAKING:

Pi Network officially announced that the v20.2 protocol version is being upgraded, with a deadline of March 12th at the latest. It also stated that all Pi mainnet nodes must complete the steps within this timeframe to connect to the network. pic.twitter.com/ZVpFXBZ4Xx

— Pi News (@PiNewsMedia) March 5, 2026

The project recently confirmed progress on its v19.9 migration milestone, while the next protocol upgrade v20.2 is expected in the coming days according to development updates. Although the rally appears primarily technical in nature, continued ecosystem development may be helping maintain positive market sentiment around the asset.

Can PI Price Rally Toward $0.35?

Pi Network price is now approaching a make-or-break technical level. If bulls manage to push the token above the $0.27 resistance band, the breakout could trigger a broader recovery move toward $0.35 in the near term.

However, failure to clear this zone could lead to another period of consolidation, with traders watching the $0.17 support area as the key downside level. For now, the combination of improving technical momentum and growing market attention suggests that Pi Network price could be preparing for its next major move.

FAQs

Why is Pi Network price rising now?

PI is rebounding due to fading bearish pressure, a trendline breakout, and Pi’s v19.9 migration progress boosting buyer momentum.

What is the next resistance for Pi price?

The $0.25–$0.27 band is critical; breaking it above $0.27 signals a bullish shift, while failure eyes consolidation near $0.17 support.

Is Pi Network a good buy right now?

PI shows strength with improving charts and ecosystem tailwinds, but watch $0.27 for breakout confirmation before entering—support at $0.17.

Bitcoin Miners Sell 15K BTC After $126K High, Is This the Reason Why Bitcoin is Dropping

Core Scientific News Bitcoin Miner to Sell All 2,537 BTC After Weak Q4 Earnings

The post Bitcoin Miners Sell 15K BTC After $126K High, Is This the Reason Why Bitcoin is Dropping appeared first on Coinpedia Fintech News

Publicly listed Bitcoin mining companies have sold more than 15,000 BTC since October, around the time Bitcoin reached its $126,000 all-time high. Now, several mining companies are planning to sell even more in early 2026. 

With Bitcoin struggling to stay above $70K, investors are asking: Is a bigger Bitcoin price drop coming next?

Bitcoin Miner Sold Over 15,000 BTC Since October

One of the largest sales came from Cango, which sold 4,451 BTC in February, equal to about 60% of its Bitcoin reserves. The company made this move because of its growing $407 million debt. 

By selling the Bitcoin, Cango aimed to reduce its debt and strengthen its balance sheet.

Another major mining company, Riot Platforms, also sold 1,818 BTC in December, reducing its holdings from 19,368 BTC to 18,005 BTC. In company filings, Riot stated that it may sell a significant portion of its Bitcoin holdings in 2026 to improve liquidity and support operational expenses.

Meanwhile, MARA Holdings currently holds more than 53,000 BTC, though the company says it retains the flexibility to buy or sell depending on the market.

Bitcoin Mining Firm Shifting Towards AI 

The recent BTC sales are not only about profit-taking. Some mining companies are also moving their money into AI projects and data centers, which are growing very fast right now. 

For example, Bitcoin miner Bitdeer sold 1,132.9 BTC in just one week, selling all the Bitcoin it was holding. The company now wants to grow its business in AI data centers, cloud services, and mining hardware. To support this plan, Bitdeer has already raised $325 million through convertible notes and $43.7 million through equity funding.

Another major miner, Core Scientific, plans to sell around 2,537 BTC during Q1 of 2026 to help fund its growing AI infrastructure projects.

Why Are Bitcoin Miners Selling BTC?

Several factors may be driving the selling. Eventually, mining costs have increased due to higher hash rates and mining difficulty, making operations more expensive. At the same time, Bitcoin’s recent drop toward $70K has reduced mining profit margins.

Some miners are also diversifying into artificial intelligence infrastructure, which requires large capital investments.

SwanDesk CEO Jacob King recently said on X that Bitcoin has become a “failed experiment,” saying companies that once promoted Bitcoin are now selling quickly after profits declined.

One by one, all Bitcoin treasury companies will either willingly dump their BTC or be forced to as prices fall.

Data shows companies have reduced their exposure to BTC by over
37% within the past three months, the largest downturn in history.

Bitcoin is a failed experiment.… pic.twitter.com/zwfYTLB27H

— Jacob King (@JacobKinge) February 23, 2026

Will Bitcoin Price Drop Ahead?

Some Bitcoin mining companies may sell more BTC in 2026, which could affect the price. At the same time, rising tension between the U.S., Israel, and Iran is making investors move away from risky assets like crypto.

Earlier this year, heavy miner selling pushed Bitcoin briefly below $60,000. Because miners often sell BTC to cover costs and upgrades, analysts believe more selling could happen this month.

As of now, Bitcoin is trading around $$70,191, reflecting a 3% drop in the last 24 hours. 

Never Miss a Beat in the Crypto World!

Stay ahead with breaking news, expert analysis, and real-time updates on the latest trends in Bitcoin, altcoins, DeFi, NFTs, and more.

FAQs

Why are Bitcoin miners selling their BTC?

Miners are selling to cover rising operational costs and debt. Many are also raising cash to invest in new artificial intelligence (AI) data centers.

Will more Bitcoin miners sell BTC in early 2026, and how might it impact price?

Yes, firms like Core Scientific plan to sell thousands of BTC in Q1 2026 for operations and AI investments. Past sales pushed BTC below $60K; more could pressure prices below $70K if demand weakens.

Is a bigger Bitcoin price drop coming due to miner selling and global tensions?

Possibly—miner sales for costs plus U.S.-Israel-Iran risks could drive BTC lower from $70K, as seen earlier this year. Watch liquidity needs and geopolitics for short-term volatility.

Vitalik Buterin: AI Wallets Need Strong Security

Vitalik Buterin: AI Wallets Need Strong Security

The post Vitalik Buterin: AI Wallets Need Strong Security appeared first on Coinpedia Fintech News

Vitalik Buterin says future crypto wallets will likely integrate AI, but he warns they should not directly control large transactions. Instead, AI could suggest a transaction plan while the wallet runs a simulation to preview the outcome. Users would then review the results and confirm manually. The goal is to ensure that what users intend matches what the system actually executes. This layered approach, using simulations, limits, and verification, could significantly reduce phishing attacks, mistakes, and other security risks.

OKB Jumps 23% After NYSE Parent Invests in OKX

OKB Jumps 23% After NYSE Parent Invests in OKX

The post OKB Jumps 23% After NYSE Parent Invests in OKX appeared first on Coinpedia Fintech News

OKB surged about 23% in the past 24 hours, becoming one of the day’s biggest crypto gainers. The rally followed news that Intercontinental Exchange (ICE), the parent company of the New York Stock Exchange, has invested in crypto exchange OKX at a $25 billion valuation and secured a board seat. The partnership plans to bring tokenized NYSE stocks and futures trading to OKX users by late 2026. Data from CoinGecko shows the move added roughly $640 million to OKB’s market value in one session, with analysts noting no signs of insider trading before the announcement.

Pudgy Penguins Sued Over Penguin Trademark

Pudgy Penguins Sued Over Penguin Trademark

The post Pudgy Penguins Sued Over Penguin Trademark appeared first on Coinpedia Fintech News

Pudgy Penguins is facing a trademark lawsuit from PEI Licensing, the company behind the Original Penguin clothing brand. The case was filed in a Florida federal court, accusing the NFT project of using and attempting to register penguin-related trademarks without permission. PEI Licensing claims the branding could confuse consumers and violates trademark and fair competition laws. Pudgy Penguins launched in 2021 as an Ethereum NFT collection and later grew into a major crypto brand. The project has since expanded with retail toys and a Solana-based culture coin called $PENGU.

Bitcoin Cash Price Prediction 2026, 2027 – 2030: Will BCH Hit $1000?

Bitcoin Cash Price Prediction

The post Bitcoin Cash Price Prediction 2026, 2027 – 2030: Will BCH Hit $1000? appeared first on Coinpedia Fintech News

Story Highlights

  • The live price of Bitcoin Cash is  $ 458.92294048
  • Bitcoin Cash price trades near $466, holding a critical demand zone around $440-$470.
  • If the market regains strength, BCH could expand toward the $1200 region by the end of 2026.
  • In a stronger long-term cycle, Bitcoin Cash may price closer to $3,000 by 2030.

Bitcoin Cash is currently trading around $466, positioning itself near an important support area that has held multiple times during the past year.

After experiencing a period of volatility, BCH has entered a broad consolidation phase, where buyers continue defending the $440–$470 demand zone. Each time BCH price approaches this range, selling pressure slows and market activity increases, suggesting that traders view this region as a fair value area.

From a broader perspective, Bitcoin Cash remains one of the most recognized Bitcoin forks. The network was originally designed to improve transaction speed and reduce fees, positioning itself as a practical alternative for everyday payments. While market attention often shifts toward newer blockchain projects, BCH continues to maintain relevance within the cryptocurrency ecosystem.

For investors and traders, the current phase appears to be less about survival and more about whether this consolidation can lead to the next expansion cycle.

Bitcoin Cash Price Today

Cryptocurrency Bitcoin Cash
Token BCH
Price $458.9229 down 0.00%
Market Cap$ 9,180,033,489.02
24h Volume$ 313,808,933.6508
Circulating Supply20,003,431.25
Total Supply20,003,431.25
All-Time High$ 4,355.6201 on 20 December 2017
All-Time Low$ 75.0753 on 15 December 2018

Coinpedia’s BCH Price Prediction 2026

Coinpedia’s price prediction highlights that Bitcoin Cash price is currently consolidating near a strong support region, which could serve as a foundation for future growth. If BCH successfully breaks above the $650–$700 resistance zone, the market could gradually move toward $1,200 by 2026.

Looking further ahead, sustained cryptocurrency adoption and renewed market momentum could support a long-term move toward $3,000 by 2030.

YearPotential Low ($)Potential Average ($)Potential High ($)
2026600.00850.001200.00

Bitcoin Cash (BCH) Price March 2026 Outlook

With March already underway, Bitcoin Cash continues to trade inside its established range. The $440–$470 region remains the most important level to watch in the short term. As long as BCH holds above this zone, the market structure remains stable.

However, buyers must eventually reclaim higher levels to confirm a stronger recovery. The first signal of momentum would be a move above $520, followed by a break toward the $650–$680 resistance band. If BCH gradually pushes through these barriers, the market could begin positioning for a broader recovery later in the year. For now, the focus remains on whether the asset can continue defending its current support while testing overhead resistance.

Bitcoin Cash (BCH) Price Prediction 2026

The Bitcoin Cash price prediction for 2026 depends largely on how the broader cryptocurrency market evolves during the next expansion phase. Historically, BCH has performed well when capital begins rotating from major assets into alternative networks with established infrastructure.

Bitcoin Cash (BCH) Price Prediction 2026

From a technical standpoint, the next structural shift would occur if BCH reclaims the $700 level. Clearing this barrier would break the long consolidation pattern that has defined the asset’s recent price movement.

If that happens, the market could quickly test $900 and $1,000, where previous liquidity zones exist. Under favorable market conditions, Bitcoin Cash could approach the $1,200 level by the end of 2026. Such a move would represent a strong recovery from current levels while still remaining within a realistic market expansion scenario.

Bitcoin Cash Price Targets 2026 – 2030

YearPotential Low ($)Potential Average ($Potential High ($)
2026600.00850.001200.00
2027820.001200.001600.00
20281100.001800.002100.00
20291500.002200.002500.00
20302000.002500.003000.00

BCH Price Prediction 2026

In 2026, Bitcoin Cash price could project a low price of $600.00, an average price of $850.00, and a high of $1200.00.

Bitcoin Cash Price Prediction 2027

As per the Bitcoin Cash price Prediction 2027, Bitcoin Cash  may see a potential low price of $820.00, The potential high for Bitcoin Cash price in 2027 is estimated to reach $1600.00

BCH Price Analysis 2028

In 2028, Bitcoin Cash price is forecasted to potentially reach a low price of $1100.00, and a high price of $2100.00

Bitcoin Cash Price Prediction 2029

Thereafter, the Bitcoin Cash (BCH) price for the year 2029 could range between $1500.00, and $2500.00

Bitcoin Cash Price Forecast 2030

Finally, in 2030, the price of Bitcoin Cash is predicted to maintain a steady and positive. It may trade between $2000.00 and $3000.00

Bitcoin Cash Price Prediction 2031, 2032, 2033, 2040, 2050

The long-term projection assumes Bitcoin Cash (BCH) sustains relevance in overall cryptocurrency adoption and the continued development of blockchain payment solutions, with growth moderating over time as the asset matures.

YearPotential Low ($)Potential Average ($)Potential High ($)
20312300.002900.003600.00
20322700.003500.004200.00
20333200.004200.005000.00
20408200.0010200.0012000.00
205018000.0024000.0028000.00

Bitcoin Cash (BCH) Price Forecast: Market Outlook?

Year202620272030
Changelly$800.00$1200.00$2000.00
CoinCodex$980.00$1320.00$2500.00
WalletInvestor$1100.00$1500.00$2400.00
Never Miss a Beat in the Crypto World!

Stay ahead with breaking news, expert analysis, and real-time updates on the latest trends in Bitcoin, altcoins, DeFi, NFTs, and more.

FAQs

What is the prediction for Bitcoin Cash in 2026?

Bitcoin Cash could trade between $600 and $1,200 in 2026, with an average around $850 if the market regains momentum and BCH breaks the key $650–$700 resistance zone.

How much will Bitcoin Cash be worth in 2030?

Bitcoin Cash could trade between $2,000 and $3,000 by 2030, depending on global crypto adoption, market cycles, and BCH’s role in digital payments.

What is the Bitcoin Cash price prediction for 2040?

Long-term projections suggest BCH could reach $8,200 to $12,000 by 2040 if blockchain payments grow and the network maintains strong adoption and relevance.

Can Bitcoin Cash grow beyond its current use case?

Yes, BCH could grow through wider merchant adoption, faster payments, and improved on-chain utility in real-world transactions.

Is Bitcoin Cash a good long-term investment?

BCH has long-term potential due to low fees, fast transactions, and growing merchant adoption, but price depends on broader crypto market trends.

Can Bitcoin Cash reach its all-time high again?

Revisiting previous highs is possible if BCH sees sustained adoption and a confirmed long-term trend reversal, though it’s not guaranteed.

BCH
BINANCE

Axie Infinity (AXS) Price Prediction 2026, 2027-2030: Technical Analysis and Future Price Targets

Axie Infinity Price Prediction

The post Axie Infinity (AXS) Price Prediction 2026, 2027-2030: Technical Analysis and Future Price Targets appeared first on Coinpedia Fintech News

Story Highlights

  • The live price of Axie Infinity crypto is  $ 1.21411549.
  • AXS price could trade as high as $2.20 in 2026.
  • Axie Infinity with a potential surge could hit $12.00 by 2032.

As we move into 2026, Axie Infinity (AXS) is no longer just a “play-to-earn” game infact it has evolved into a sophisticated, multi-layered gaming nation. Under the leadership of Sky Mavis, the ecosystem has undergone its most aggressive economic transformation since the 2021 peak, pivoting toward long-term sustainability and “risk-to-earn” mechanics.

The introduction of Bonded AXS (bAXS) in early 2026 and the total cessation of SLP emissions in Origins have effectively dismantled the “farm-and-dump” cycles of the past, replacing them with a reputation-based economy that rewards genuine players over automated bots. With the Ronin Network transitioning into a full-scale Ethereum Layer 2 and the highly anticipated Atia’s Legacy MMO on the horizon, the project is taking “bigger swings” to recapture its crown. 

In this Axie Infinity (AXS) Price Prediction 2026–2032 guide, we analyze whether these structural reforms can decouple AXS from speculative noise and drive a new era of value accrual for the original titan of GameFi.

Axie Infinity Price Today

Cryptocurrency Axie Infinity
Token AXS
Price $1.2141 up 0.74%
Market Cap$ 205,650,949.48
24h Volume$ 33,264,190.0804
Circulating Supply169,383,349.7382
Total Supply270,000,000.00
All-Time High$ 165.3691 on 06 November 2021
All-Time Low$ 0.1234 on 06 November 2020

Coinpedia’s Axie Infinity (AXS) Price Prediction 2026

AXS/USD is at a critical point after a decline, with support around $0.80 and resistance near $2.30. Currently forming a falling wedge pattern, AXS may break out towards $4.00 in 2026. However, if market conditions worsen, it could dip to $0.25, offering a strong buying opportunity.

Axie Infinity (AXS) Price Prediction March 2026

On the daily timeframe, AXS price is currently oscillating within a horizontal consolidation box. This range directly overlaps with the critical demand zone identified on the weekly chart, suggesting a period of high-stakes accumulation. 

After spent the most of January and February within these boundaries, AXS/USD market odds suggest that March will likely continue this sideways trend as the asset builds necessary liquidity for its next move.

Moreover, a daily candle flip above $1.40 would signal a shift in momentum, opening the door for Axie Infinity price to target the $1.70 and $2.20 resistance levels, respectively.

Conversely, if the psychological $1.00 floor is lost, we should anticipate a retest of the $0.80 macro support before the end of March.

Axie Infinity (AXS) Price Prediction March 2026

Axie Infinity (AXS) Price Prediction 2026

The long-term weekly chart for AXS/USD reveals a persistent declining trend that has finally reached a critical inflection point in early 2026. After hitting record lows near the $0.80 support level, the asset attempted a significant relief rally in Q1. However, this momentum was halted by the 50-week EMA band, which acted as a dynamic ceiling, forcing the price back into the primary demand zone. 

Currently, the corridor between $0.80 and $2.30 is solidifying as a major accumulation area, suggesting that internal ecosystem developments are beginning to provide a fundamental floor for the price action.

Technically, AXS price is navigating a massive falling wedge pattern, a structure typically associated with bullish reversals upon completion. The lower boundary of this wedge provides a “double confirmation” for the current accumulation phase. Throughout the remainder of 2026, we anticipate the Axie Infinity price will continue to build a base within this pattern. A successful breakout could see the price targeting the upper resistance border near $4.00. 

Conversely, if broader market stress persists, a final liquidity sweep toward the lower border at $0.25 remains a possibility, offering a deep-value entry point for long-term believers.

Axie Infinity (AXS) Price Prediction 2026

Axie Infinity (AXS) Price Prediction 2027 – 2032

YearMinimum Price ($)Maximum Price ($)Average Price ($)
20270.804.502.60
20281.205.903.50
20291.807.104.80
20302.208.905.50
20312.509.806.90
20323.0012.007.50

Axie Infinity (AXS) Price Prediction 2027

In 2027, AXS is expected to find a stable market floor at $0.80 as the Ronin ecosystem matures further. Increased adoption of “risk-to-earn” mechanics could drive the token to a maximum of $4.50, maintaining an annual average of $2.60.

Axie Infinity Price Prediction 2028

By 2028, scalability improvements are projected to push the minimum price to $1.20 during periods of market consolidation. Sustained gaming demand may ignite a rally toward a peak of $5.90, with the price likely hovering around a $3.50 average.

Axie Infinity Price Targets 2029

Entering 2029, the token is forecasted to show strong resilience with a decentralized bedrock established at $1.80. Market analysts anticipate a climb to visionary heights of $7.10, centering on a robust yearly average trading price of $4.80.

Axie Infinity Coin Price Prediction 2030

As Axie Infinity potentially becomes a linchpin of the crypto economy in 2030, the minimum price is expected to rise to $2.20. Growth in institutional gaming interest could propel AXS to a $8.90 zenith, with a projected average of $5.50.

AXS Price Prediction 2031

The 2031 outlook suggests a meticulous consolidation phase where AXS trades at a minimum of $2.50 even during bearish cycles. Optimistic projections set an impressive high of $9.80, with price stability expected to settle near the $6.90 mark.

Axie Infinity (AXS) Price Prediction 2032

Rounding out the decade, 2032 targets represent a significant milestone with a projected peak performance of $12.00. While volatility remains a factor, the asset is expected to average $7.50, supported by a long-term accumulation floor of $3.00.

Never Miss a Beat in the Crypto World!

Stay ahead with breaking news, expert analysis, and real-time updates on the latest trends in Bitcoin, altcoins, DeFi, NFTs, and more.

FAQs

What is the Axie Infinity (AXS) price prediction for 2026?

AXS could trade between $0.25 and $4.00 in 2026. A breakout from its falling wedge pattern may push prices higher if market sentiment and ecosystem growth improve.

How much will Avax be worth in 2030?

Market forecasts suggest AXS could trade between about $2.20 and $8.90 by 2030 if the Ronin network grows and GameFi adoption continues expanding.

What is the Axie Infinity (AXS) price prediction for 2040?

By 2040, AXS could potentially trade between $15 and $35 if blockchain gaming becomes mainstream and Axie Infinity maintains strong ecosystem growth.

What is the Axie Infinity price prediction for 2050?

Some long-term projections estimate AXS could range between $25 and $60 by 2050 if GameFi adoption accelerates and the ecosystem remains competitive.

How high can AXS price go in the future?

Long-term projections suggest AXS could reach around $12 by 2032 if GameFi adoption grows and the Ronin ecosystem continues expanding.

Best Crypto Presale 2026: Pepeto Beats DeepSnitch AI and BlockDAG as Trump Sides With Crypto in Trillion Dollar Stablecoin Battle

crypto-news-today (1)

The post Best Crypto Presale 2026: Pepeto Beats DeepSnitch AI and BlockDAG as Trump Sides With Crypto in Trillion Dollar Stablecoin Battle appeared first on Coinpedia Fintech News

President Trump just sided with the crypto industry against America’s biggest banks in a trillion dollar fight over stablecoin yields, Coinbase surged 15% on the news, and when the president of the United States publicly tells JPMorgan and Bank of America to make a deal with the crypto sector. 

It means the regulatory tailwind is about to push capital into digital assets faster than anything this market has seen before, which is why the best crypto presale is the one with real exchange infrastructure positioned to capture that wave right now.

Trump Sides With Crypto Against Banks as Coinbase Surges 15% on Stablecoin News

CNBC reported Trump posted on Truth Social that banks are undermining the GENIUS Act and need to make a deal with the crypto industry, while CoinDesk confirmed Coinbase surged 15% in midday trading as JPMorgan and Bank of America dipped. 

When the president backs crypto in a public fight with the biggest banks on the planet, the best crypto presale entries become the fastest path to the kind of returns that arrive once institutional capital floods in behind the regulatory shift.

Best Crypto Presale 2026: Which Token Has the Live Utility and the Math to Back a 100x Run?

Pepeto : The Best Crypto Presale That Keeps Topping Every Serious Trader’s List

If you are looking at the best crypto presale picks right now, Pepeto is the one that keeps coming up at the top of every serious conversation, because the exchange architecture has already crossed $7.5M raised while the entry price still sits at $0.000000186, and that kind of capital does not flow into hype alone.

The cross chain bridge connecting Ethereum, BNB Chain, and Solana routes liquidity across chains so you never miss an opportunity on another network, the zero tax trading engine eliminates fee bleed on every swap, the risk scoring system classifies every token on the market before you commit capital, and the portfolio dashboard brings bridging, trading, scoring, and management into one clean interface. That is the complete trading edge that serious investors have been paying institutional subscriptions for, now sitting inside one platform at a presale price that will not exist once the listing arrives.

pepeto-upgrade

Analysts tracking the space agree that Pepeto is setting the bar for what the best crypto presale with real exchange utility looks like in 2026, because the cofounder of the Pepe ecosystem who built a token to $7 billion leads the development, the SolidProof audit backs every contract, and the conviction accelerating into the presale every week proves this is real capital positioning for what comes next.

And 209% APY staking compounds every position daily, so the early holders are not just waiting for the listing, they are actively growing their bags every single hour while everyone else debates which presale to enter.

DeepSnitch AI Offers Analytics but No Exchange Infrastructure

DeepSnitch AI positions itself as an AI powered intelligence platform with five agents for contract auditing and sentiment analysis, having raised roughly $1.8M. But the value depends entirely on a narrow analytics niche with no exchange, no bridge, and no zero fee trading engine. 

The best crypto presale has always been the one with execution infrastructure, and Pepeto with a full exchange operates on a level DeepSnitch AI cannot reach.

BlockDAG Faces Post Launch Selling Pressure After $452M Raise

BlockDAG raised $452M and launched at $0.05 with early private investors at $0.00125, but post launch selling pressure from that 40x gap between private and public pricing is already building. 

Independent forecasts project $0.001 by year end, and the best crypto presale protects your entry at presale pricing, which is why Pepeto with a SolidProof audited exchange offers a fundamentally different risk profile.

The Bottom Line

There is a pattern that repeats every cycle: the president signals support, capital flows in, and the entries that were positioned before the news hit are the ones that produce generational returns. 

The early Pepe holders who bought before the $7 billion market cap understood this, and right now, with Trump publicly fighting banks on behalf of crypto and the exchange listing approaching, the same window is open inside Pepeto at a price that vanishes the moment trading begins. 

Stages are filling faster with every round, 209% APY staking is compounding in your wallet right now while you sit here reading, and six months from now this is either the story of how you caught the next Pepe before anyone else or the most expensive hesitation of your entire crypto career. 

Visit the Pepeto official website and enter the presale before this stage closes and the entry you see today disappears forever.

Click To Visit Pepeto Website To Enter The Presale

Dogwifhat Approaching $1.30, Correcting impending? Also, PEPETO

FAQs

What is the best crypto presale in 2026?

The best crypto presale in 2026 is Pepeto at $0.000000186 with $7.5M raised, 209% APY staking, and exchange infrastructure that delivers returns other presales cannot match. Visit the Pepeto official website.

How does Pepeto compare to DeepSnitch AI?

Pepeto builds a complete exchange with bridging, zero fee trading, and risk scoring, while DeepSnitch AI offers analytics tools without any exchange infrastructure behind them.

Why is Trump’s stablecoin stance bullish for presales?

Trump siding with crypto against banks signals massive regulatory support, and the best crypto presale captures the capital wave that follows before the listing reprices everything.

Ripple’s Prime Brokerage Now Offers XRP Futures Through Coinbase Platform

Ripple Prime Coinbase derivatives

The post Ripple’s Prime Brokerage Now Offers XRP Futures Through Coinbase Platform appeared first on Coinpedia Fintech News

Ripple Prime Opens the Door to Coinbase Derivatives

Ripple is pushing deeper into institutional markets by integrating derivatives trading from Coinbase directly into its Ripple Prime platform, as per reports. The move allows institutional clients to access Coinbase’s full range of crypto derivatives contracts while keeping clearing, financing, and risk management within Ripple’s brokerage framework.

Through this integration, Ripple Prime users can trade nano Bitcoin and nano Ethereum futures, along with contracts tied to XRP and Solana. These smaller-sized contracts are designed to give institutions greater flexibility when managing exposure, allowing traders to enter positions with more precise risk controls.

Moreover, the derivatives operate in a regulated environment overseen by the Commodity Futures Trading Commission, ensuring compliance while still enabling round-the-clock trading, a key feature for global crypto markets.

A New Seat at the Clearing Table

A major development behind the partnership is Ripple’s new position inside the clearing ecosystem. The company has officially become a clearing member of Nodal Clear, enabling its institutional clients to access Coinbase derivatives through the clearinghouse’s settlement and risk management infrastructure.

Paul Cusenza, Chairman and CEO of Nodal Clear, welcomed the collaboration, saying:

“We are pleased to welcome Ripple as a new clearing member of Nodal Clear. Through this relationship, Ripple’s clients can now efficiently access the full suite of Coinbase Derivatives contracts.”

From Coinbase’s perspective, the partnership reflects growing institutional demand for regulated crypto futures products. Boris Ilyevsky, Head of U.S. Futures Exchange at Coinbase, noted that the collaboration helps broaden market access while maintaining strong liquidity and regulatory safeguards.

Hidden Road Powers the Engine

The expansion is powered by Ripple’s earlier acquisition of Hidden Road Partners, which now operates under the Ripple Prime brand. Acting as a Futures Commission Merchant, the platform offers institutions services such as clearing, financing, and prime brokerage execution.

Ripple Prime has already become a major institutional trading hub, reportedly clearing more than $3 trillion in transactions last year.

Noel Kimmel, President of Ripple Prime, said the Coinbase integration strengthens Ripple’s ability to serve global institutions.

“Offering the full suite of Coinbase Derivatives contracts within Ripple Prime’s robust clearing framework underscores our commitment to delivering increased market access and efficiency to institutions globally,” he said.

So, What’s Cooking?

The Coinbase partnership is just one piece of Ripple’s broader push to build institutional crypto infrastructure.

Recently, Ripple Prime added on-chain derivatives access through Hyperliquid, marking its first connection to a decentralized trading venue. On the investment front, Ripple has also been expanding aggressively, participating in Crossover Markets’ $31 million Series B funding round and backing AI infrastructure startup t54 Labs in a $5 million seed round.

Meanwhile, Ripple is upgrading its payments ecosystem by combining custody, liquidity, and collections into a single unified platform while simplifying global fiat and stablecoin transfers.

Taken together, these developments signal Ripple’s growing ambition to become a key infrastructure provider for institutions entering the rapidly evolving crypto economy.

Never Miss a Beat in the Crypto World!

Stay ahead with breaking news, expert analysis, and real-time updates on the latest trends in Bitcoin, altcoins, DeFi, NFTs, and more.

FAQs

What is the new Ripple Prime and Coinbase derivatives integration?

Ripple Prime now lets institutional clients trade the full range of Coinbase Derivatives contracts—including nano Bitcoin, nano Ethereum, XRP, and Solana futures—directly inside its secure clearing and financing platform. Everything stays regulated by the CFTC with 24/7 trading for easier global access and precise risk control.

Why are institutional investors interested in crypto derivatives?

Institutions use crypto derivatives to hedge risk, manage exposure, and gain market access without directly holding digital assets, making trading strategies more flexible.

Can crypto derivatives impact the price of cryptocurrencies?

Yes. Large derivatives markets can influence price trends because institutional hedging, leverage, and speculation often affect overall market sentiment.

What role do prime brokerage platforms play in crypto markets?

Prime brokers provide institutions with trading execution, custody, financing, and clearing services, simplifying how large investors access crypto markets.

War Impacts Markets, Oil Prices Soar, and Stock Markets Fall—Crypto Mining Becomes a Stable Source Of Income

What-is-Crypto-Mining

The post War Impacts Markets, Oil Prices Soar, and Stock Markets Fall—Crypto Mining Becomes a Stable Source Of Income appeared first on Coinpedia Fintech News

Recently, global financial markets have been impacted by escalating geopolitical tensions. Oil prices surged as conflict risks increased, while major stock markets fell amid growing uncertainty. Investors are closely monitoring global developments as volatility spreads to traditional financial markets.

The cryptocurrency market has also reacted to the changing macroeconomic environment. Prices of Bitcoin and other major digital assets have fluctuated, with traders reacting to global news and shifting investor sentiment. During such times, many market participants are exploring alternative ways to participate in the crypto economy, beyond just short-term price speculation.

Market Changes, Mining Continues

While financial markets can fluctuate dramatically due to geopolitical events, blockchain networks operate 24/7. Cryptocurrency mining remains a vital component of the blockchain ecosystem, ensuring network security and verifying transactions while generating cryptocurrency rewards.

Therefore, a growing number of investors are turning their attention to mining as a long-term model for participating in the digital asset space. FORT Miner: A Simplified Cloud Mining Platform

Why Choose FORT Miner

1. No Hardware Required

Start mining instantly without purchasing expensive mining machines or managing complicated hardware.

2. Global Mining Infrastructure

FORT Miner operates professional mining facilities in multiple locations, providing stable and efficient computing power.

3. Secure Cloud Technology

Advanced encryption technology and secure data centers help protect user accounts and mining operations.

4. Automated Mining System

Mining operations run automatically, allowing users to earn crypto without technical management.

5. Multiple Cryptocurrency Options

Users can participate in mining several major cryptocurrencies through flexible cloud mining solutions.

6. Stable and Efficient Computing Power

Professional mining equipment and optimized infrastructure support consistent mining performance.

7. 24/7 Mining Operations

Blockchain networks run continuously, and FORT Miner provides around-the-clock mining services.

8. Simple and User-Friendly Platform

The platform is designed with an intuitive interface that allows users to start mining quickly and easily.

How to Join FORT Miner Cloud Mining

1. Visit http://fortminer.com to register. New users receive a $15 registration bonus.

2. Choose a suitable cloud mining contract based on your investment amount and preferred timeframe.

3. After contract confirmation, the system automatically allocates computing power; no technical operation is required.

4. Receive daily earnings according to the contract rules; data is fully traceable.

Contract Example: For additional details, please visit fortminer.com.

Experience Contract: Investment of $100, term of 2 days, daily return of $3.6, total return of $107.2 at maturity

Basic Level Mining Plan: Investment of $1200, term of 10 days, daily return of $17.04, total return of $1370.4 at maturity

Intermediate Mining Program: Investment of $5000, term of 20 days, daily return of $76.5, total return of $6530 at maturity

Advanced Mining Program: Investment of $30000, term of 25 days, daily return of $567, total return of $44175 at maturity

Flagship mining program: Investment of $100000, term of 30 days, daily return of $2150, total return of $164500 at maturity

After purchasing the contract, your earnings are guaranteed and automatically credited to your account every 24 hours. Your principal will be fully returned upon contract expiration. You can withdraw or reinvest at any time and enjoy compound interest.

As global markets continue to be influenced by geopolitical developments, many investors are exploring new ways to participate in the digital asset ecosystem.

For more information on products and participation, please visit the official FORT Miner website fortminer.com

Suspect Arrested for Alleged $46M Heist of Seized Crypto Assets

Google’s Quantum Computing Could Threaten Bitcoin Encryption, Warns NYDIG

The post Suspect Arrested for Alleged $46M Heist of Seized Crypto Assets appeared first on Coinpedia Fintech News

John Daghita, aka Lick, was arrested today by the Federal Bureau of Investigation (FBI) in the Caribbean for allegedly stealing $46 million worth of seized crypto assets from the US Marshals Service (USMS).

Suspect arrested for $46M grand crypto theft

The heist began in 2024, when Command Services & Support, Inc. (CMDSS), a technology company, was awarded a contract to handle asset disposal for the US Department of Justice (DoJ) and the Department of Defense (DoD). Dean Daghita was head of the company while his son John worked as an employee.

Per the ZachXBT (revealer of the Axiom insider trading) expose, John allegedly used his status to withdraw confiscated cryptocurrencies to his personal wallets.

He remained anonymous until January 23, 2026, when he decided to flaunt his success to another confessed thief by the name of Dritan Kapplani Jr. 

A recording of this interaction shows how John revealed his wallet address, which ZachXBT then linked to several scams and a US Government address from which digital assets had been siphoned in 2024.

11/ Threat actors only continue to showing off stolen funds in leaked recordings rather than simply just staying quiet after an alleged theft from the US Government.

In this case John was ragebaited by Dritan into going band for band and the proof of ownership for these wallets… pic.twitter.com/kXl5HDGUSP

— ZachXBT (@zachxbt) January 23, 2026

Shortly after ZachXBT publicized the investigation, John made changes to his Telegram account in a failed attempt to mask his identity. He also dusted the investigator’s account by sending him 0.0067 ETH. The CMDSS website, X, and LinkedIn accounts have since been deactivated.

A drop in the ocean

By mid-2025, stolen cryptocurrencies surpassed $2.17 billion (more than all of 2024), according to the Chainalysis 2025 Crypto Crime Report. Of these, $1.5 billion was related to the Bybit exchange hack.

Crypto assets stolen over the years

Source: Chainalysis

This year, Apple cautioned iOS users of the “Coruna” exploit, which hunts for crypto wallet seed phrases in phones running iOS 13.0 through 17.2.1, but not later (iOS 18+). The malware is estimated to have affected at least 42,000 devices.

More recently, South Korea’s tax agency mistakenly revealed its virtual asset wallet seed phrase online, leading to the loss of $4.8 million worth of tokens.

Bitcoin Miner Core Scientific Secures up to $1B Morgan Stanley Funding for AI Pivot

New Hampshire Crypto Mining Bill

The post Bitcoin Miner Core Scientific Secures up to $1B Morgan Stanley Funding for AI Pivot appeared first on Coinpedia Fintech News

On Thursday, Bitcoin mining company Core Scientific Inc. (Nasdaq: CORZ) announced that it had secured up to $1 billion from Morgan Stanley (NYSE: MS) to accelerate the shift of its Bitcoin mining facilities (all 10 sites) into AI data centers.

Per terms of the agreement, Core Scientific will receive an initial $500 million, 364-day loan. An accordion feature allows it to increase this amount to up to $500 million.

The firm will use the funding to purchase equipment, land, and cover the extra energy costs associated with high-density colocation for its AI clients.

Core Scientific stimulus loan to transition to AI

The recent development comes after Core Scientific reported missing Q4, 2025 revenue estimates by over $44 million. This happened as Bitcoin dropped from its 2025 all-time high of $126K to a 2025 low of $71K, with miners’ production costs at roughly $93K. At press time, Bitcoin was yet to escape this miner capitulation zone, trading at $71,086.

Ratio of Bitcoin mining costs to BTC price

Source: MacroMicro

To counter these negatives, Core Scientific recently dumped nearly all (2,537) of its Bitcoin holdings to fund AI infrastructure. The company is also in a $10 billion partnership with the AI cloud platform CoreWeave, where it provides the AI facilities necessary for CoreWeave’s graphical processing units (GPUs).

Pragmatic approach towards profitability

Core Scientific is one among many large-scale Bitcoin miners that have partially or fully transitioned into AI data centers. Others include Iris Energy, Cipher Mining, TeraWulf, and Hut 8 Corp.

The move is supported by their pre-existing electric grids and pre-allocated power capacity, in addition to physical infrastructure such as land, warehousing, and cooling facilities. 

Hosting AI will now generate up to 25X more revenue per kilowatt-hour than Bitcoin mining. This income will also be tied to the dollar, making it more stable than that tied to Bitcoin.

Core Scientific stock is yet to reflect this development, trading at $15.67 (-1.07% in 24h) at press time.

Core Scientific stock price chart

Source: MarketWatch

XRP Explosion Ahead? ETFs Hit $1B as Japan Launches New Payment Platform

XRP News Today David Schwartz Says Ripple’s DTCC Move “Seems Important” for Institutional Crypto

The post XRP Explosion Ahead? ETFs Hit $1B as Japan Launches New Payment Platform appeared first on Coinpedia Fintech News

The XRP ecosystem is making headlines as institutional interest rises, exchange-traded funds gain traction, and a Japanese fintech firm launches a new payment platform built on the XRP Ledger.

While recent price movements have been bearish, experts like Zach Rector say more developments are happening at the infrastructure level, where new financial tools and integrations are gradually strengthening the network’s long-term utility.

At the time of writing, XRP is trading above $1.40, down more than 3%,

Japanese Fintech Firm Launches XRP Ledger Payment Platform

One of the most recent developments comes from a Tokyo-based fintech startup, which has introduced a global trade finance payment platform powered by the XRP Ledger.

Founded in 2022, the company said its system uses multi-party decentralized consensus and escrow settlement mechanisms to facilitate trade finance transactions.

According to the company’s announcement, the platform aims to streamline settlement for letters of credit (LC) transactions, a process that traditionally requires multiple intermediaries and can take several days to complete.

With XRP Ledger technology, settlements can be finalized almost instantly once transaction conditions are met.

The company believes the blockchain-based escrow mechanism can remove one of the last sources of friction in traditional trade finance, allowing conditional payments to be processed automatically when contractual requirements are fulfilled.

Importantly, the integration appears to be independent of Ripple, highlighting how companies are increasingly choosing the XRP Ledger on their own for financial infrastructure solutions.

Asia-Pacific Continues to Drive XRP Adoption

Japan has long been considered one of the most crypto-friendly markets in the world, and the Asia-Pacific region continues to see steady adoption of blockchain-based payment technology.

Initiatives like the Viteup launch reflect growing interest among fintech firms looking to modernize cross-border payments and settlement processes.

Rather than relying on legacy financial rails that can take days to process transactions, blockchain platforms like the XRP Ledger offer near-instant settlement and lower transaction costs.

This efficiency has made XRP particularly appealing for companies involved in international payments and trade finance.

XRP ETFs Record Strong Activity

At the same time, institutional demand for XRP exposure is growing through exchange-traded funds.

Data from XRP ETF trackers shows that total assets under management across XRP-focused ETFs have reached roughly $1.1 billion, with more than 800 million XRP reportedly held in custody by these funds.

Daily trading activity has also been strong, with volumes recently reaching around $52 million in a single day.

Executives from investment firm Bitwise recently stated that their XRP ETF has become the largest such product in the United States, reporting roughly $10 million in inflows during the week.

The growing ETF market indicates that professional investors are increasingly viewing XRP as part of a broader digital asset portfolio.

Expanding Infrastructure for XRP Yield

Another trend is the development of yield-generating infrastructure for XRP holders.

Platforms focused on decentralized finance and institutional custody are beginning to introduce services that allow XRP liquidity to be used across multiple blockchain ecosystems.

For example, digital asset infrastructure provider Doppler has partnered with Hex Trust to build institutional custody and yield solutions for wrapped XRP, enabling the asset to participate in cross-chain liquidity markets.

The initiative could expand XRP’s role beyond payments by allowing it to be used in decentralized financial applications.

XRP Price Consolidates Under $1.5 — What Could Drive the Next Move to $2?

XRP Price Prediction 2026 What 3 AI Models Say About the Next Cycle

The post XRP Price Consolidates Under $1.5 — What Could Drive the Next Move to $2? appeared first on Coinpedia Fintech News

XRP price is facing renewed selling pressure after a brief recovery attempt toward $1.45, with the price slipping back below $1.40 as broader crypto markets weaken. The pullback follows mild declines in major assets like Bitcoin and Ethereum, which have slightly cooled the recent market momentum.

From a broader perspective, XRP has repeatedly failed to sustain moves above $1.48, keeping the critical $1.50 resistance level out of reach. With the token now trading below $1.40, the key question is whether XRP will continue consolidating under $1.45 or gather enough strength to challenge the $1.50 barrier in the coming sessions.

As seen in the chart, XRP continues to trade below the local resistance at $1.48, which has emerged as a key barrier for the bulls. The price is currently consolidating near $1.41 while the broader trend remains confined within a descending parallel channel, indicating that the overall market structure is still bearish.

xrp price

Within this structure, the $1.33 level acts as immediate support. A breakdown below this zone could accelerate the downside move, potentially dragging the price toward the lower boundary of the channel near $1.20–$1.15. 

From a momentum perspective, the Relative Strength Index (RSI) is gradually forming higher highs and higher lows, suggesting that buying pressure is slowly building. However, this momentum has not yet translated into a decisive price breakout. At the same time, the Accumulation/Distribution indicator continues to trend downward, signaling that capital inflows remain weak and that distribution pressure is still dominating the market.

For now, XRP remains at a critical technical junction.

  • A break and close above $1.48 could invalidate the short-term resistance and push the price toward $1.60, followed by $1.75 near the mid-channel resistance.
  • However, if the price loses the $1.33 support, XRP may extend the correction toward $1.20, with deeper support resting around $1.10–$1.05 near the lower trendline of the channel.

Until either level is decisively broken, XRP is likely to continue consolidating within the descending channel structure.

Bitcoin Price Prediction Targets $120,000 as VanEck CEO Calls Bottom While Pepeto Is The Best Crypto To Invest In Now

crypto-news (1)

The post Bitcoin Price Prediction Targets $120,000 as VanEck CEO Calls Bottom While Pepeto Is The Best Crypto To Invest In Now appeared first on Coinpedia Fintech News

VanEck CEO Jan van Eck just told CNBC that Bitcoin is forming a bottom as the four year halving cycle winds down, and when the most respected voice in institutional asset management says the floor is in, the next move higher is not a question of whether but when. The bitcoin price prediction for this cycle stretches from $110,000 to $200,000, and the presale window that exists right now is the kind that never returns once the crowd arrives.

Over $458 million poured into Bitcoin ETFs on March 3 alone, CoinDesk reported the highest single day inflow since early February, and CryptoQuant data shows long term holder selling has collapsed. This is definitively an accumulation phase, and from here rotation could carry presale tokens with real utility to multiples that no bitcoin price prediction can match, which is why Pepeto at $7.5M raised with a full exchange in development is where serious money flows right now.

Bitcoin Price Prediction Turns Bullish: Why Pepeto Is the Token to Invest In Right Now

What separates the people who build real wealth in crypto from everyone else usually comes down to timing. By the time most investors hear about a token, the opportunity has already priced in or the early window has closed permanently.

That is exactly why Pepeto is the best crypto to invest in now, built by the cofounder of the Pepe ecosystem who already took a token to a $7 billion market cap and knows precisely what infrastructure the market needs before anyone else sees it. The exchange architecture surfaces the entire crypto market through one platform before fragmentation eats every other trader alive.

Each feature of the exchange handles a critical function but they all work together as one complete system. The cross chain bridge connects Ethereum, BNB Chain, and Solana into one liquidity layer, the zero tax trading engine eliminates fee bleed on every trade, the risk scoring system classifies tokens and flags traps before you commit capital, and the portfolio dashboard brings everything into a single clean interface so you never trade blind again.

pepeto-upgrade

And as of the latest development milestone, the exchange interface is advancing faster than projected with a design built for speed and precision during high volume conditions.

Now in advanced presale stages, over $7.5M has been raised already, and the entry price sits at just $0.000000186. A $10,000 position earns roughly $20,900 in yearly staking rewards at 209% APY, about $1,741 per month compounding in your wallet while the listing approaches. Higher conviction means faster allocations, which means the presale reprices permanently the moment the listing drops.

With the bitcoin price prediction pointing to $120,000 and beyond, Pepeto is the sort of entry that looks too good to be true but the SolidProof audit, the $7.5M raised, and the exchange infrastructure already in development prove this is the real thing. Early holders are positioning now because they know this window closes the second trading goes live.

If there is a token to invest in right now while the bull run loads, this is it.

Bitcoin Holds Above $72,000 as Death Cross Signals Consolidation Before Expansion

A death cross formed on Bitcoin’s chart with the 50 day moving average crossing below the 200 day, but historically that pattern precedes consolidation before expansion. BTC trades above $72,000 after absorbing $458M in ETF inflows. 

btc-chart

Some forecasts see recovery toward $74,000 by mid March and $93,000 by December. But the bitcoin price prediction at these levels means BTC is already a $1.3 trillion asset, and the death cross dynamics signal consolidation not explosive returns, which is worth considering if you want life changing gains this cycle because those live at earlier stages.

The Bottom Line

Now the full picture comes together and every piece points in the same direction: the bitcoin price prediction turning bullish, VanEck calling the bottom, $458M in ETF inflows, and the exchange infrastructure that merged meme energy into real trading utility. 

Millions will be made this cycle by the people who acted fast. The only thing left is deciding, because six months from now this is either the story of your first million in crypto or the biggest regret you carry forward. Visit the Pepeto official website and decide which version belongs to you.

Click To Visit Pepeto Website To Enter The Presale

pepeto-presale

FAQs

What is the bitcoin price prediction for 2026?

The bitcoin price prediction for 2026 targets $110,000 to $200,000, but Pepeto at $0.000000186 with a full exchange offers multiplier potential that BTC at $72,000 cannot produce. Visit the Pepeto official website.

What is the best crypto presale right now?

The best crypto presale right now is Pepeto with $7.5M raised, 209% APY staking earning $1,741 per month on $10,000, and exchange infrastructure in development.

Is Bitcoin forming a bottom?

VanEck CEO says Bitcoin is forming a bottom as the halving cycle concludes, which historically precedes the next bull run that sends presale entries to multiples large caps cannot match.

A Token With 180,000 Holders Before Listing: Inside Playnance’s G Coin Economy

Altcoins to Buy Now: Raoul Pal Says These Three Chains Stand Out

The post A Token With 180,000 Holders Before Listing: Inside Playnance’s G Coin Economy appeared first on Coinpedia Fintech News

As the cryptocurrency industry continues to evolve, one of the most closely watched questions is how token economies can move beyond speculation and toward sustainable usage.

A growing number of Web3 infrastructure projects are experimenting with models where tokens are embedded directly into active platforms. One example is G Coin, the utility token powering the digital entertainment ecosystem built by Playnance.

Unlike many tokens that launch before real usage exists, G Coin was designed to function as the operational layer of the Playnance network. The platform focuses on blockchain-powered gaming, prediction markets, and interactive financial experiences, while keeping the user experience simple enough to resemble traditional Web2 entertainment platforms.

Within this environment, G Coin acts as the economic engine that powers activity across the ecosystem. Gameplay entries, prediction interactions, reward distribution, settlements, and platform mechanics all run through the token.

Playnance describes this architecture as a closed-loop economic system, where token demand is generated internally through platform participation rather than external speculation alone.

Every interaction inside the ecosystem, from spins and predictions to rewards and settlements, uses G Coin as the underlying transactional layer.

The platform’s activity metrics suggest that this system is already operating at scale. According to Playnance data, the ecosystem currently processes more than 1.5 million on-chain transactions per day, while supporting over 10,000 on-chain games and approximately 2.5 million live sports events annually.

The broader network also includes almost 3,000 social partner platforms, over 6,000 affiliate partners that have already earned more than $2M in real FIAT money. 

Across these environments, G Coin acts as the unified economic layer connecting players, platforms, and partners.

Another notable element of the token’s design is its supply structure. G Coin has a permanently fixed supply of 77 billion tokens, with no inflation or future minting. Instead of relying on token burning, the ecosystem uses time-based token lock mechanisms to manage circulating supply.

The idea is to align token demand with platform activity. As participation increases across the network, the number of token-based interactions increases as well, creating what Playnance describes as an activity-driven growth loop.

Interestingly, the token is still preparing for its public listing, yet the ecosystem is already showing measurable signs of adoption.

G Coin has surpassed 180,000 token holders, while the broader Playnance platform includes more than 300,000 accounts interacting with the ecosystem. The token has also reached a market capitalization of over $35 million.

For a token that has not yet reached full market availability, these metrics suggest that early adoption has been driven largely by participation inside the platform itself.

As Web3 infrastructure continues to mature, models that tie token demand directly to platform activity are becoming increasingly important. In the case of Playnance, G Coin represents an attempt to build a token economy where usage is not an afterthought, but the foundation of the system itself.

Cardano’s Charles Hoskinson Has One Question For XRP Community and It Might Be Worth Listening To

Charles Hoskinson Says XRP Would Be a Security Under Crypto Clarity Act

The post Cardano’s Charles Hoskinson Has One Question For XRP Community and It Might Be Worth Listening To appeared first on Coinpedia Fintech News

Cardano founder Charles Hoskinson has raised concerns about a proposed U.S. cryptocurrency bill, warning it could place several digital assets, including XRP,  under securities laws at launch.

Speaking about the Digital Asset Market Clarity Act of 2025, Hoskinson said the legislation could classify many blockchain tokens as securities by default, forcing projects to prove to regulators that they should later be treated as commodities.

The bill, formally known as H.R. 3633, has already passed the U.S. House of Representatives and is now under consideration in the Senate. It aims to create a clearer regulatory framework for cryptocurrencies by dividing oversight between the U.S. Securities and Exchange Commission and the Commodity Futures Trading Commission.

However, Hoskinson warned the structure of the bill could create new regulatory risks for the crypto industry.

XRP Would Likely Start as a Security

“Here’s a very simple question for the XRP community. This is a fact-based conversation based on the bill as written today. Reading the bill as it currently stands, would XRP have been considered a security at the time of its launch?” he asked.

According to Hoskinson, the legislation assumes that newly launched digital assets begin as securities if they are issued or distributed by a founding team to fund network development.

“Everything starts as a security,” he said while reviewing the bill. “XRP starts as a security. Cardano starts as a security. Ethereum starts as a security.”

Under the framework proposed in the Clarity Act, a token could later transition to commodity status only if the underlying blockchain becomes sufficiently decentralized. At that point, oversight would move from the SEC to the CFTC.

Hoskinson argued that when the XRP Ledger launched in 2012, its development and token distribution were heavily linked to its founding team, which later formed Ripple Labs. Because of that early structure, he believes the network would not have met the bill’s definition of a “mature blockchain system” at the time.

Concerns Over Regulatory Power

Hoskinson also warned that the legislation could allow regulators to delay or deny a project’s transition away from securities classification.

Under the proposal, crypto issuers would need to prove that their networks are decentralized and no longer reliant on the original developers. Hoskinson argued that this process could be heavily influenced by regulatory interpretation.

“You start as a security, and then you have to go to the SEC and say, ‘I don’t think I’m a security anymore,’” he said.

He said that the agency could impose additional disclosure requirements or procedural hurdles that might make it difficult for projects to meet the standard.

Some industry leaders, including Brad Garlinghouse, have argued that passing legislation — even if imperfect, is better than continuing under regulatory uncertainty. Hoskinson, however, said poorly designed rules could entrench regulatory power over crypto projects for years.

“This is what a bad bill means,” he said, warning that future rulemaking could make it difficult for new blockchain projects to escape securities classification.

Crypto Market Crash: Top Analyst Reveals What’s Next For Bitcoin, Ethereum and XRP

Bitcoin, Ethereum, and XRP Price Surge

The post Crypto Market Crash: Top Analyst Reveals What’s Next For Bitcoin, Ethereum and XRP appeared first on Coinpedia Fintech News

The recent volatility in the crypto market has left investors questioning whether the latest pullback means a deeper crash or just a temporary correction. While prices have struggled to maintain momentum, one market strategist believes the current setup could still lead to a short-term rally before any larger decline unfolds.

According to market strategist Gareth Soloway, the charts hint that major cryptocurrencies including Bitcoin, Ethereum, and XRP may be approaching a  breakout moment. However, he warns that the broader market structure still carries bearish risks in the longer term.

Bitcoin Could Rally Toward $80K–$85K

Soloway points to a technical pattern known as a bull flag, which has formed after Bitcoin’s recent surge followed by a period of consolidation.

According to his analysis, Bitcoin spent multiple trading sessions moving within a tight range after a strong upward move. This type of price action often signals that the market is digesting recent gains before another potential breakout.

If Bitcoin successfully breaks above the current consolidation level, Soloway says the next likely target could fall between $80,000 and $85,000.

In his view, the current rally could still be part of a larger bearish formation. Even if Bitcoin climbs toward the $80K range in the short term, the broader market structure may eventually lead to another wave of downside. In a more negative macro scenario, Bitcoin could revisit the low $50,000 range, and in extreme cases even move lower if broader financial markets weaken.

Ethereum Approaching Breakout Level

The outlook for Ethereum shows a similar setup. According to Soloway, Ethereum has been repeatedly testing a major trendline resistance.

If ETH manages to break and hold above this level, it could trigger a move toward $2,600 to $2,700, representing a notable recovery from recent lows.

Like Bitcoin, Ethereum has also formed a consolidation pattern with multiple “inside bars,” a technical signal that often precedes a strong directional move.

XRP and Altcoins Show Signs of Strength

Among other altcoins, XRP is also showing a constructive chart pattern.

Soloway says XRP appears to be forming a bull flag structure, which typically indicates the possibility of another upward move. The asset is currently approaching a resistance zone formed by previous price lows.

If XRP manages to break above its current level, the move could open the door for a larger rally. However, strong resistance remains ahead, meaning the market will need sustained buying momentum to continue higher.

Chainlink Price Gains Attention After Visa e-HKD Pilot and LINK Chart Signals Possible Breakout

Chainlink Price Targets $53 Could LINK Be the Next Blue Chip to Rally

The post Chainlink Price Gains Attention After Visa e-HKD Pilot and LINK Chart Signals Possible Breakout appeared first on Coinpedia Fintech News

The Chainlink price is suddenly back in the spotlight and not just because of a chart bounce. This time, the story comes straight from the intersection of crypto infrastructure and traditional finance.

A recent update revealed that a cross-border settlement pilot under Hong Kong’s e-HKD program has been completed. And yes, it involved some heavyweight names: Visa, ANZ, ChinaAMC, and Fidelity International. The connective tissue tying it all together? Chainlink crypto’s oracle network.

On paper, the initiative focused on enabling atomic and compliant transfers of tokenized funds. In simpler terms: programmable money moving across borders with reduced counterparty risk and near-real-time settlement. Visa’s interim report and Chainlink’s platform documentation detail how the infrastructure handled regulated asset transfers within the program.

That’s not just another blockchain experiment. It’s a test run of how financial institutions might actually move money in the tokenized future.

Traditional Finance Quietly Tests Chainlink

Let’s be honest crypto has promised to “revolutionize finance” for years. Most of the time, that claim lives somewhere between marketing hype and speculative optimism.

But occasionally, real infrastructure work appears.

Chainlink Price Gains Attention After Visa e-HKD Pilot and LINK Chart Signals Possible Breakout

This pilot under Hong Kong’s e-HKD program shows how programmable money might operate in the Asia-Pacific region. By linking financial institutions through Chainlink’s oracle network, the system demonstrated near-instant settlement for tokenized funds while reducing settlement risk.

In traditional finance, settlement delays can create exposure between parties. Programmable transactions remove that uncertainty by executing transfers atomically meaning they either complete entirely or not at all.

And here’s the most highlighting detail: it’s not just a theory anymore.Institutions are testing it.

Chainlink Price Chart Shows Recovery

While the institutional narrative unfolds, the Chainlink price chart is quietly showing signs of life.

A weekly chart shared online highlights how LINK recently bounced from a critical $9–$10 support zone after previous declines. That range appears to have acted as a foundation for a potential recovery.

Now the asset is trading inside a parallel range structure. If momentum continues upward, the first technical target sits around $15. Push beyond that, and the upper boundary of the range appears closer to $26.

Chainlink Price Gains Attention After Visa e-HKD Pilot and LINK Chart Signals Possible Breakout

Of course, markets rarely move in straight lines. Resistance zones tend to attract sellers, especially after sharp recoveries.

Still, for traders watching LINK/USD, the support rebound has become the key talking point behind the latest Chainlink price prediction circulating across the market.

Utility Narrative Meets Market Momentum

So what’s really happening here? Well, here’s the interesting part. Institutional experimentation with programmable money is happening at the same time the market structure for LINK is attempting a recovery.

Correlation doesn’t equal causation, obviously. But the combination tends to attract attention.

If price holds above the $9–$10 base and momentum continues building inside the range, the next move on the chart could determine whether the current rebound becomes a trend.

For now, both narratives first the infrastructure progress and second the technical setup are converging around the same topic: the direction of the Chainlink price.

Why is Bitcoin Price Going Down Today?

Why is Bitcoin Price Going Down Today

The post Why is Bitcoin Price Going Down Today? appeared first on Coinpedia Fintech News

The price of Bitcoin slipped on Thursday, falling around 2.3% in the past 24 hours to roughly $71,200, as the market cooled after failing to sustain a breakout above an important resistance zone.

The decline comes after Bitcoin briefly surged past $73,000 earlier this week, only to face strong selling pressure. Analysts say the pullback shows a combination of technical rejection, reduced trading momentum, and cautious sentiment across the broader crypto market.

Bitcoin Faces Rejection at Key Resistance

Bitcoin’s recent rally lost direction after encountering a major liquidity zone between $73,000 and $75,000, where sellers stepped in aggressively.

Market data shows that 24-hour trading volume dropped about 6.4%, indicating fading buying pressure following the earlier surge. Such declines in volume often signal that a rally is running out of steam, prompting short-term traders to lock in profits.

For now, the move appears to be a technical correction rather than a major trend reversal, as the asset consolidates after its latest rebound.

Broader Crypto Market Also Turns Lower

Bitcoin’s pullback coincides with weakness across the wider digital asset market. The total crypto market capitalization has slipped roughly 1.9% to about $2.42 trillion, reflecting softer risk appetite among investors.

Major cryptocurrencies including Ethereum and XRP also recorded modest losses, reinforcing the view that the decline is part of a broader market slowdown rather than a Bitcoin-specific event.

Without a fresh catalyst to extend the rally, traders appear to be adopting a wait-and-see approach.

Levels Traders Are Watching

From a technical standpoint, analysts are focusing on several important price levels that could determine Bitcoin’s next move.

  • $69,600 – Immediate support near the 50% Fibonacci retracement level
  • $71,800 – Short-term resistance if the price rebounds
  • $67,300 – Next major downside support if selling pressure increases

Holding above $69,600 could allow Bitcoin to stabilize and attempt another move higher. However, a decisive break below that level could open the door to deeper downside in the near term.

Macro Events Could Drive the Next Move

Investors are also closely monitoring the upcoming Federal Open Market Committee Meeting scheduled for March 18, where the Federal Reserve will provide its latest policy outlook.

Interest-rate expectations and macroeconomic signals from the Fed often influence risk assets, including cryptocurrencies.

Bitcoin Price Debate Ignites as Bull Trap Warning Clashes With On-Chain Data

AI Models Favor Bitcoin Over Fiat in New Study

The post Bitcoin Price Debate Ignites as Bull Trap Warning Clashes With On-Chain Data appeared first on Coinpedia Fintech News

The Bitcoin price is once again sitting in the middle of a classic crypto argument: bull trap or genuine recovery? One viral chart circulating on X claims the current rally perfectly mirrors the 2022 pattern and warns that BTC could crash to $45,000 within 12 days after a supposed bull trap near $73K.

That’s a dramatic call. But not everyone’s buying it. Because when you dig into the on-chain data, the story suddenly looks… a lot less catastrophic.

Bitcoin Price Bull Trap Or Reset?

Let’s start with derivatives markets. According to CryptoQuant data, more than 30,000 BTC flowed out of derivatives exchanges as price approached $72,900 in early March 2026.

That’s not small change. Large derivatives outflows often indicate short covering, that means traders closing bearish positions rather than doubling down on them. In other words, some of the selling pressure that previously dragged the Bitcoin price chart lower may already be fading.

And that matters. A lot. Because, if major players considered the $65K–$68K zone a local bottom, then the current move higher might be less about hype and more about repositioning.

Bitcoin Price Debate Ignites as Bull Trap Warning Clashes With On-Chain Data

Quiet Accumulation Behind The Scenes

Then there’s spot market behavior. On February 18, roughly 8,000 BTC left spot exchanges right at price lows.

Not sold. Withdrawn. That pattern is often described as “stealth accumulation.” Institutions and large holders buy during weakness and move coins to cold storage rather than leaving them on exchanges where they could be dumped.

For anyone obsessing over a Bitcoin price prediction, that kind of behavior usually signals confidence rather than panic.

Bitcoin Price Debate Ignites as Bull Trap Warning Clashes With On-Chain Data

Meanwhile, long-term holders, the so-called diamond hands haven’t flinched.

Wallets holding coins for more than five years remain almost completely unchanged despite the volatility. Even the 6-month to 12-month holder group is expanding, suggesting some investors who bought last year’s volatility have simply transitioned into longer-term holders.

Not exactly the behavior you’d expect before a massive collapse.

Bitcoin Price Debate Ignites as Bull Trap Warning Clashes With On-Chain Data

Structural Support Around $70K

Now here’s the part traders keep watching. Mining economics. According to Marathon Digital filings, the average mining cost in Q4 2025 sat around $70,027 per BTC. With Bitcoin/USD hovering near $73,000, the margin above that break-even point is only about $3,000.

That level effectively becomes a structural floor.

Historically, if price drops below mining costs, miners can capitulate and sell reserves. But there’s a twist this cycle. Some miners are pivoting toward AI data centers, which may reduce the urgency to liquidate holdings during downturns.

So, what’s next? Well, Sentiment has already shifted from extreme fear to optimism, yet on-chain indicators still show accumulation rather than distribution.

The Bitcoin price might not be heading straight to the moon. But the data doesn’t scream imminent collapse either.

For now, the $70,000 line remains the battlefield. And the next move on the Bitcoin price chart will likely decide which side of the debate wins.

❌