DASH price is sitting right at that uncomfortable edge where patience runs thin and volatility usually kicks the door in. After months of grinding lower since Q4 2025, the daily chart now shows a clear falling wedge structure, and it’s tightening fast. April’s price action isn’t subtle about it either; momentum is compressing, and something’s got to give.
But here’s the catch there’s a ceiling. And it’s not just any ceiling.
Falling Wedge Pressure Builds Toward Key Breakout Zone
The falling wedge has done what it’s supposed to do: squeeze price into a narrowing range while quietly building breakout pressure. Now, DASH price is pressing right into the upper boundary of that structure. Typically, that’s where reversals start to show up.
Except this time, there’s a second wall stacked right on top.
The 200-day EMA around $40 is sitting exactly where the wedge resistance lies. That’s not coincidence ina fact that’s confluence. And in markets, confluence tends to matter more than narratives.
So yeah, breaking $40 isn’t just another level. It’s the most key level right now.
Why $40 Is The Only Level That Matters
As the data suggest, if DASH price clears $40 cleanly meaning a proper breakout, not a weak wick then the structure flips. Simple as that. Now, what happens next depends on how aggressive that move is.
If price rips through $40 with strong momentum, then the $53–$61 resistance zone probably won’t slow things down much. That kind of breakout tends to ignore intermediate levels and go straight for expansion.
But markets aren’t always that generous. If DASH climbs slowly and stabilizes above $40, then $53 and $61 become real checkpoints. Not barriers, but tests. Fail those, and the breakout risks losing steam.
Decentralization Narrative Enters The Conversation Again
And then there’s the timing. While price structures are tightening, the broader crypto space is dealing with a different kind of pressure that’s trust and decentralization doubts.
With recent events involving asset freezes raising eyebrows across the industry, DASH crypto decided to step in with a not-so-subtle reminder. The network publicly stated that it is decentralized and cannot, and will not, censor or surveil users.
PUBLIC SERVICE ANNOUNCEMENT
The Dash network is decentralized and cannot, and will not, censor or surveil its users.
That’s not just PR it’s positioning in people minds that are in fear of assets freezing.
In a market where decentralization is suddenly being questioned again, that message isn’t random. It’s strategic. Whether it actually shifts investor sentiment, though, is a different story.
Robinhood Ventures Fund I has completed a $75 million investment in OpenAI on April 17, 2026. The fund, listed on the NYSE under ticker RVI since March 6, 2026, is Robinhood’s first closed-end vehicle aimed at giving retail investors access to private companies. Alongside OpenAI, it holds stakes in firms like Airwallex, Databricks, Stripe, and Revolut. The fund allows everyday investors to gain exposure to high-growth private tech markets through public trading access.
THORChain is showing a clear shift in momentum as RUNE price pushes higher with a near 10% gain, backed by a sharp rise in network activity. The move follows a prolonged consolidation phase, where price remained capped despite repeated attempts to break higher.
Now, with volume rising across both on-chain and derivatives markets, the breakout is not just a price move, it reflects growing participation and positioning. The current setup places RUNE in a phase where continuation becomes the focus, as structure and activity begin to align.
THORChain’s network data is reinforcing the recent move, with a noticeable increase in activity across key metrics. Daily swap volume surged to approximately $344.2 million, contributing to a broader $427 million in 24-hour volume, marking one of the strongest sessions in recent weeks.
Transaction count also picked up, reaching nearly 185,000 swaps, which signals a clear rise in user participation rather than isolated large trades. Protocol earnings climbed to around $503,000, reflecting strong fee generation and active liquidity usage across the network.
Despite the surge in activity, total value locked remains stable near $124 million, indicating that liquidity conditions have held steady while usage increased. This combination of rising volume and stable TVL suggests that the move is supported by genuine demand rather than short-term volatility.
THORChain (RUNE) Range Breakout Signals Transition Into Expansion
RUNE price has broken above the $0.42–$0.48 consolidation range that capped price for weeks, where repeated rejections confirmed strong supply. The current move shifts that structure, with price now trading near $0.49–$0.50 and holding above the range high, indicating that selling pressure in that zone has been absorbed.
The breakout is backed by a clear increase in volume, which adds strength to the move and reduces the chances of a false breakout. This kind of participation usually reflects active buying at resistance, rather than a slow drift higher.
A key technical shift is now visible, as the 20-day EMA has crossed above the 50-day EMA, confirming a short-term bullish crossover. This signal has been followed by a two-day rally surge, reinforcing that momentum is building rather than fading.
Now, RUNE is approaching the immediate resistance zone around $0.50–$0.52, which acts as the next decision area following the breakout. A sustained move above this region could open the path toward $0.60–$0.65, where previous supply zones exist.
On the downside, the breakout level between $0.46 and $0.48 becomes the key support range. Holding this zone is critical to maintain the current structure and confirm that the breakout remains valid.
Derivatives Data Confirms Fresh Positioning
Derivatives data is aligning with the price structure, showing a clear increase in participation. Trading volume has climbed approximately 45.38% to $132.32 million, while open interest has increased by 17.02% to $22.27 million.
This rise in both metrics indicates that new positions are being built alongside the breakout, rather than the move being driven by short covering alone. The token is seeing fresh capital entering, which typically supports continuation if price holds its structure. Funding rates remain relatively balanced, suggesting that positioning is not yet crowded on one side. This keeps the setup stable and reduces the risk of immediate liquidation-driven reversals.
Final Words
RUNE is now at a continuation point where structure and momentum are aligned. Holding above the $0.48 support keeps the breakout intact, while a push above $0.52 can open the path toward the $0.60–$0.65 zone. As long as price sustains above the reclaimed range, the bias remains tilted toward further upside rather than a return to consolidation.
The crypto market has turned highly volatile after a series of exploits this month, with nearly a dozen incidents shaking confidence across DeFi. The KelpDAO exploit and the sharp RAVE price crash have only deepened the uncertainty, leaving traders cautious. Amid this backdrop, Solana price saw a brief pullback but quickly bounced from local support, showing relative resilience.
However, the bigger test lies ahead. SOL is once again approaching the same resistance that has capped its upside for weeks, bringing it back to a familiar battleground. The question now is, can Solana finally break above $90, or will this become the 8th failed attempt at reclaiming the range?
Solana (SOL) Price Analysis
Solana has been locked in a well-defined range since February, with $89 acting as immediate resistance and $75–$78 as key support. While bulls have repeatedly pushed above $89, they have consistently failed to hold above the $92–$95 supply zone, where sell-side pressure quickly absorbs the move. This repeated rejection confirms that the area remains a strong distribution zone rather than a breakout level—at least for now.
Currently, SOL is once again approaching this resistance, but this attempt shows slightly improved strength. Volume has picked up compared to recent sessions, indicating rising participation. At the same time, RSI is trending upward toward the mid-50s, suggesting building momentum without being overbought, while MACD is turning positive, signaling a gradual shift in buying pressure.
However, the key issue remains a lack of conviction. Despite improving indicators, the price is still trading below the critical breakout zone, and previous attempts have failed at similar setups. This keeps the probability of another rejection very much alive.
A clean breakout and hold above $95–$98 is required to confirm strength. Without that, this remains a range-bound market with repeated sell-offs at resistance.
Wrapping it Up!
Solana is at a decision point, but not a confirmed breakout. If bulls manage to flip $95–$98 into support, the next move could extend toward $105–$115 this month. However, failure to break this zone may lead to another rejection, with the SOL price likely rotating back toward $82 and potentially $75 before any sustainable trend emerges.
Artificial Superintelligence Alliance’s price could hit a maximum trading price of $1 in 2026
With a potential surge, the FET price may record a high of $12.45 by 2030.
As artificial intelligence continues to dominate global headlines, blockchain-based AI infrastructure projects are once again attracting investor attention.
Among them, the Artificial Superintelligence Alliance (ASI) stands out as a strategic merger of major AI-focused blockchain entities.
Founded through the collaboration of Fetch.ai, SingularityNET, and later CUDOS, the alliance aims to create the largest open-source, decentralized ecosystem focused on Artificial General Intelligence (AGI).
The FET token, originally native to Fetch.ai and now central to the ASI ecosystem, serves as the utility, governance, and settlement layer across AI services.
So let’s dive straight into CoinPedia’s Artificial Superintelligence Alliance (FET) price prediction for 2026, 2027, and 2030.
Artificial Superintelligence Alliance (FET) Price Targets For April 2026
The Artificial Superintelligence Alliance (ASI) is expanding its AI agent marketplace, making it easier for users and applications to access various AI services.
If ASI successfully integrates its offerings, it will be able to host AI models on its network, facilitate communication and collaboration among AI agents, and enable users to pay for AI services directly on the blockchain. Additionally, ASI is working to establish partnerships with businesses interested in utilizing AI.
As more people begin to use AI on the network and the demand for computing power increases, this could drive up activity and potentially push the FET price towards $0.32 by late April to May of 2026. The price already reached $0.25 in mid-March, now approaching the 200-day EMA band. It has also found support in the green box, which aligns with a multi-year demand zone. If bearish pressure increases, the price could re-enter this support zone; however, if it continues on its upward trajectory, testing $0.32 could be within reach or even higher.
Unlike many AI tokens driven by hype, the Artificial Superintelligence Alliance (FET) is building a foundation in decentralized compute and autonomous agents. This shift from speculation to real-world utility suggests that FET’s value will increasingly mirror actual network usage. As companies adopt these decentralized services, the organic demand for the token could provide a structural floor for long-term growth.
Technically, FET’s 2026 outlook remains tied to key market cycles. A potential low of $0.0582 serves as a deep support zone during “risk-off” periods. However, as the ecosystem matures, an average price of $0.0913 is expected as it maintains a steady trend. In a bullish breakout scenario, FET could surge toward $0.3013, driven by high-volume demand for decentralized AI infrastructure.
FET Price Prediction 2026 – 2030
Year
Potential Low ($)
Potential Average ($)
Potential High ($)
2026
$0.0921
$0.340
$0.950
2027
$0.173
$0.820
$2.14
2028
$0.468
$1.938
$5.53
2029
$1.40
$4.30
$8.05
2030
$2.126
$6.78
$12.45
FET Price Prediction 2027
Growing wider adoption of autonomous AI agents in supply chains, logistics, and digital services could push FET near $2.14
FET Price Forecast 2028
By 2028, if decentralized AGI frameworks mature and institutional AI infrastructure adopts ASI tooling, FET may approach $5.53.
FET Coin Price Prediction 2029
In 2029, AGI research networks integrate token-based compute markets, and valuation expansion could drive FET toward $8.
What will Fetch AI be worth in 2030?
In a strong AI-dominant economy where decentralized compute markets compete with centralized cloud providers, FET could test $12.45
As per CoinPedia’s FET Price Prediction, the exponential growth observable in the field of artificial technologies will boost the value of AI tokens in the crypto world
If the alliance successfully aligns AI compute markets, decentralized agents, and open-source model hosting under one economic framework, FET could gradually reclaim the $0.950 range in 2026.
Year
Potential Low ($)
Potential Average ($)
Potential High ($)
2026
$0.0921
$0.340
$0.950
Never Miss a Beat in the Crypto World!
Stay ahead with breaking news, expert analysis, and real-time updates on the latest trends in Bitcoin, altcoins, DeFi, NFTs, and more.
FAQs
What is Artificial Superintelligence Alliance (FET)?
Artificial Superintelligence Alliance (FET) is a merged AI-blockchain ecosystem uniting Fetch.ai, SingularityNET, and CUDOS to power decentralized AI services.
What is the Artificial Superintelligence Alliance (FET) price prediction for 2026?
FET could trade between $0.09 and $0.95 in 2026, depending on AI adoption, network growth, and overall crypto market momentum.
What could FET be worth by 2030?
If decentralized AI scales globally, FET may test $12 by 2030, though long-term growth depends on real-world usage and regulation.
What Is the FET Price Prediction for 2040 and How High Can It Go?
By 2040, FET could trade between $25 and $40 if decentralized AI and AGI adoption expand globally with strong ecosystem growth.
What is the price prediction for FET in 2050?
By 2050, FET may exceed $60 in a mature AI economy, assuming sustained adoption, real utility, and stable crypto regulations.
Is FET a good long-term AI crypto investment?
FET offers exposure to decentralized AI infrastructure. Its long-term value relies on adoption, partnerships, and sustainable ecosystem growth.
Cronos coin price is expected to go as high as $0.3000 to $0.3500 in 2026.
CRO crypto may cross the $1 mark, with a potential high of $1.3190 by 2029.
Cronos (CRO) serves as the backbone of the Cronos Chain, a high-performance, open-source ecosystem engineered by Crypto.com. Designed to bridge the gap between traditional finance and Web3, CRO acts as a versatile utility token that facilitates instantaneous, low-cost global transactions while powering a vast suite of DeFi applications, perpetuals, and fiat-integrated markets.
Driven by institutional-grade infrastructure and a rapidly expanding global footprint, CRO’s market performance increasingly reflects a surge in investor confidence and real-world utility. As the network matures into 2026, its role in the next generation of digital asset exchange becomes even more pivotal.
In this analysis, we leverage advanced technical indicators and historical performance models to forecast the trajectory of Cronos. Whether you are a long-term holder or a strategic investor, this guide provides essential price projections for 2026 and through to 2035, helping you determine if CRO/USD is the missing piece for your portfolio.
Currently, the Cronos price is experiencing a period of consolidation on the daily chart, hovering around the key horizontal line at approximately $0.0777, which marks an important multi-year demand range (indicated in green). This phase indicates a decrease in momentum, and if this trend continues, we could observe its persistence into March.
On a more optimistic note, should the price successfully break above $0.1000, we can anticipate a robust move towards the 200-day EMA band, potentially reaching around $0.1200 by late April to may. However, if bearish factors come into play, we might see the price retreat to the lower end of the current demand range, possibly down to around $0.0600.
Recent Updates & Network News
On February 5, 2026, Cronos announced the development of a unified trading platform offering tokenized stocks, commodities, and prediction markets. This expansion is supported by a strategic integration with Fireblocks, providing the secure, institutional-grade custody infrastructure necessary for market makers to trade at scale.
Following this, a post on February 28 announced the Cronos v1.7 Network Upgrade is scheduled for March 10 at 07:00 GMT. This technical maintenance will involve approximately 30 minutes of downtime to align with recent SDK updates and implement RPC performance improvements to ensure long-term chain stability.
CRO Price Prediction for 2026
The weekly chart for CRO/USD reveals a persistent long-term structure defined by a well-established accumulation zone. Since late 2023, Cronos has consistently found a floor within the $0.0500 to $0.1000 demand area. This “buy zone” has historically triggered significant rallies, notably in late 2024 and mid-2025, where the price peaked at $0.3900.
As of early 2026, CRO has returned to this familiar base, setting the stage for its next major move.
The current weekly price action suggests a period of base-building. We are seeing a repeat of the historical pattern where CRO enters a deep consolidation phase before a vertical expansion.
Supply Zone: The primary target for a breakout lies between $0.3000 and $0.3500.
The Pivot Point: Simply hitting the supply zone isn’t enough; for a true trend reversal, CRO must flip this resistance into support to reclaim its 2022 highs.
Moreover, While the price remains flat, the underlying “engine” of the market (indicators) is starting to show signs of exhaustion from the bears:
In MACD for instance we are currently approaching a weekly bullish cross. Historically, this cross has served as the starting gun for intensified consolidation that eventually leads to a breakout at later stage.
CMF is the most encouraging sign. The CMF has bounced sharply from a low of -0.32. This move toward the zero line suggests that selling pressure is fading and capital is starting to stabilize within the ecosystem.
RSI & AO, Both indicate that the “cooling off” period is still in effect. This lack of a clear direction in RSI confirms we are in a neutral accumulation phase, which is often known as the quiet before the storm.
What Makes CRO Interesting in 2026?
In 2026, Cronos (CRO) stands out as a unique bridge between high-finance and retail utility. The landscape shifted dramatically in late august 2025 when Trump Media Group announced a $6.42 billion CRO Digital Asset Treasury strategy, signaling a massive institutional endorsement of the token’s scarcity.
Beyond the headlines, Cronos remains a technical powerhouse with zero downtime over four years. It currently supports 150M+ users via the Crypto.com ecosystem and powers payments for 10M+ merchants. While the broader market has cooled in Q1, Cronos maintains a healthy 100,000 daily transactions, proving its resilience. This blend of “battle-tested” infrastructure and “institutional-grade” liquidity makes it a critical pillar of the 2026 digital economy.
Cronos (CRO) Price Prediction for 2027-2035
Year
Minimum Price ($)
Maximum Price ($)
Average Trading Price ($)
2027
0.1690
0.3490
0.2490
2028
0.3570
0.6990
0.5090
2029
0.7100
1.3190
0.9890
2030
1.3490
2.4010
1.8210
2031
2.4200
4.1990
3.2350
2032
4.2210
7.1000
5.5290
2033
7.1090
11.5050
9.1650
2034
11.5910
18.4510
14.7650
2035
18.4290
28.7110
23.1990
Cronos Token Price Prediction for 2027
By 2027 Cronos token price is expected to trade between $0.1690 and $0.3490. The average expected trading cost is $0.2490.
CRO Price Prediction for 2028
In 2028, CRO price is expected to trade between $0.3570 and $0.6990. The average expected trading cost is $0.5090.
Cronos (CRO) Crypto Price Prediction for 2029
Experts expect Cronos crypto to trade between $0.7100 and $1.3190 in 2029. The average expected trading cost is $0.9890.
CRO Price Prediction for 2030
Based on technical CRO price analysis it is expected to trade between $1.3490 and $2.4010 in 2030. The average expected trading cost is $1.8210.
CRO/USD Price Prediction for 2031
Based on technical analysis by experts, in 2031 CRO/USD is expected to trade between $2.4200 and $4.1990. The average expected trading cost is $3.2350.
Cronos Price Prediction for 2032
Following 2031, in 2032, Cronos price is expected to trade between $4.2210 and $7.1000. The average expected trading cost is $5.5290.
CRO Token Price Prediction for 2033
In 2033, CRO token price is expected to trade between $7.1090 and $11.5050, with an average expected trading cost of $9.1650.Price Prediction for 2034
CRO Crypto Price Prediction for 2034
Based on technical analysis by cryptocurrency experts, in 2034 CRO crypto is expected to trade between $11.5910 and $18.4510. The average expected trading cost is $14.7650.
CRO Price Prediction for 2035
According to technical analysis by top specialists, the CRO price is projected to range from $18.4290 to $28.7110 by 2035. The anticipated average trading price is $23.1990.
Never Miss a Beat in the Crypto World!
Stay ahead with breaking news, expert analysis, and real-time updates on the latest trends in Bitcoin, altcoins, DeFi, NFTs, and more.
FAQs
What is the Cronos (CRO) price prediction for 2026?
CRO is expected to trade within the $0.05–$0.35 range in 2026, with a breakout above $0.30 needed to confirm a bullish reversal.
Can Cronos (CRO) reach $1 by 2030?
Based on long-term projections, CRO could trade between $1.34 and $2.40 by 2030 if adoption and momentum continue.
Is Cronos a good long-term investment through 2035?
Long-term forecasts suggest gradual growth toward higher ranges by 2035, but returns depend on adoption and market cycles.
What could drive CRO price growth in 2026?
Institutional integration, network upgrades, rising utility, and a confirmed bullish MACD cross could support upside momentum.
Coinbase’s Quantum Advisory Board has released a new report warning that quantum computing could one day affect crypto security. There is no immediate risk, but it says the industry should start preparing early.
The discussion over Quantum Risk has drawn criticism from Cardano founder Charles Hoskinson over Bitcoin’s chosen security path.
Coinbase Quantum Report Flags Future Risk to Crypto Security
In an X post, Coinbase CSO Philip Martin said that they have released their first detailed paper on how quantum computers could affect blockchain systems.
The board includes researchers from top institutions like Stanford, UT Austin, UC Santa Barbara, and Bar-Ilan University, along with experts from major crypto projects.
Experts say quantum computing is not an immediate threat right now, but it could become a real risk in the future. Today’s machines are not strong enough to break blockchain security, but this could change within the next decade.
Today we've published the first position paper from the Coinbase Independent Advisory Board on Quantum Computing and Blockchain, a group of leading researchers from Stanford, UT Austin, the Ethereum Foundation, and beyond.
The short version: your crypto is safe today. But a…
The main concern is not the blockchain itself, but user wallets. The system that proves ownership of funds could become weak, especially for wallets where key data is already public.
The council clearly says the industry should start preparing now, because waiting too long could make the problem much harder to fix.
What Is Actually at Risk?
Not all parts of crypto face the same risk. Bitcoin’s core system, like mining and transaction history, is mostly safe.
The main risk is at the wallet level. Around 6.9 million BTC could be exposed because their keys are already public. If quantum computers become powerful, they could break these signatures and access funds.
Proof-of-stake networks also have extra risk because of how validators work. So, the bigger issue is user security, not the blockchain itself.
Upgrading Crypto Will Be a Big Challenge
Solutions already exist.
Quantum-resistant cryptography has been in development for years, and new standards have already been approved.
But the real challenge is implementation.
Upgrading millions of wallets, networks, and systems will take years and coordination. These new systems are also heavier, which could affect speed and costs.
Coinbase says it is working with partners and developers to ensure systems are ready when the transition becomes necessary, stressing that no single company can solve this alone.
Charles Hoskinson Questions Bitcoin’s Strategy
When it comes to the quantum computing threat, Charles Hoskinson has raised strong concerns about Bitcoin’s approach. He recently criticized Adam Back’s approcehe of use of SPHINCS+, a quantum-safe signature system, calling it safe but too limited and inefficient.
Lol, let's use the least expressive and interesting PQS to solve the quantum issue. Never change Bitcoin https://t.co/2mcytWyb12
According to him, this approach solves the problem but does not improve Bitcoin’s overall capabilities. He believes a more advanced and adaptable solution should have been considered.
He also warned that once Bitcoin adopts a system, changing it later could take years.
However, quantum risk is not urgent, but ignoring it now could become a problem later.
Coinbase has launched a USDC-INR trading pair in India, allowing users to directly convert Indian Rupees into the USDC stablecoin within its platform. The rollout is part of Coinbase’s regulated re-entry into India after securing FIU-IND registration in 2025 under anti-money laundering rules. The new system reduces dependence on P2P and offshore channels by offering a compliant fiat-to-crypto gateway. It follows phased service expansion across Coinbase products after its return to the Indian market.
As Justin Sun’s lawsuit against World Liberty Financial moves through California federal court, an institutional investor in the Trump-backed platform has broken his silence and given Coinpedia the most detailed account yet of what WLFI says actually happened.
Syed Sameer, CEO of Sameer Group LLC, holds a significant stake in WLFI alongside UAE partners Aryam 1 and Aqua 1, a combined bloc of over $300 million.
Other Institutions Respected Their Lockups
“WLFI says other institutions respected their lockups,” Sameer told Coinpedia. “This arrangement was only granted to him based on that commitment.”
The issue started with an agreement made before the project launched. Sun was given something other investors did not get: early access to his tokens, sent directly to his wallet. According to Sameer, WLFI says the condition was simple — the tokens had to stay locked for one year, with no selling, transfers, or any actions that could hurt the project.
According to WLFI, what happened next broke that agreement. The company claims Sun promoted a 20% staking return for WLFI through Huobi channels, encouraging users to deposit tokens into exchange-linked wallets. WLFI further alleges that those tokens were later moved to other platforms, including Binance.
WLFI then made an even more serious allegation. According to the platform, just before launch, those tokens were used to sell WLFI tokens while a large short bet was opened against the project at the same time. WLFI describes it as a coordinated “dump-and-short” and says the evidence can be seen on-chain.
“This is also an allegation made by many people on X and other channels,” Sameer noted, “as well as a similar track record which he is infamous for.”
Why the Tokens Were Frozen
“WLFI says that is why it moved to lock the tokens in his wallet — not as an arbitrary action, but as a response to what it considered a breach of the original agreement.”
The freeze, Sameer was clear, was not arbitrary.
What is less widely known, according to Sameer, is that WLFI initially chose to stay quiet. The platform did not publicly share its allegations right away, as it wanted to avoid turning a private dispute into a public fight. Sameer says WLFI only responded on X after Sun started publicly challenging its version of events.
By then, the dispute had already spilled into public view. Sun had criticised a March governance vote, calling it rigged, with over 76% of participating tokens coming from just ten wallets. WLFI had fired back, calling Sun’s allegations baseless.
The lawsuit was the next step.
Litigation Will Not Work Out in Justin Sun’s Favor
“It is my personal view that litigation will not work out in Justin Sun’s favor,” he told Coinpedia. “Based on what I know, I believe that WLF will win that case, and it will also only further damage Justin Sun’s relationship and credibility with the WLF team, and even beyond.”
Sameer was candid about why he stepped forward and frank about what he thinks happens if Sun stays the course in court.
On Investor Rights
“As a major institutional investor, I strongly believe every token holder should be treated fairly and in accordance with the spirit of the original investment terms and blockchain principles of transparency,” he said. “However, I am not a lawyer and will not speculate on the legal merits of either side’s position. That is ultimately a matter for the courts or a negotiated settlement.”
Coinpedia also asked Sameer: Does he believe the token freeze violated Sun’s rights as an investor?
His focus is on finding a practical path forward, one that protects value for all stakeholders, not just the two parties in dispute.
Aave has been under intense pressure following the recent KelpDAO exploit, which exposed vulnerabilities across the broader DeFi ecosystem. The attacker reportedly used a bridge-related flaw to mint fake collateral, borrow real ETH from Aave, and leave behind bad debt estimated at nearly $280 million. The impact was immediate—AAVE price, which was struggling to hold above $115, dropped sharply toward the $85 zone.
Now, even as price attempts a recovery above $93, the underlying signals tell a different story. Capital flows, exchange reserves, and protocol-level activity are no longer aligning with a typical recovery phase, raising concerns about the strength of this bounce.
So the question is, is Aave price simply reacting to short-term fear after the exploit, or is the data pointing to something deeper—like distribution and rising sell pressure?
On-Chain and DeFi Data Reveal Weak Recovery Structure
After the initial price shock, a closer look at both on-chain and protocol-level data reveals that Aave’s recovery may not be as strong as it appears. Exchange flows and DeFi activity are beginning to diverge from what is typically seen during a healthy rebound, raising concerns about whether this move has real strength or is simply a temporary reaction.
Exchange Inflows Spike as Sell-Side Pressure Builds
The exchange reserve chart shows a sharp spike in AAVE balances, climbing to nearly 2.39 million tokens in a short span. This kind of inflow usually indicates that holders are moving assets onto exchanges, often with the intent to sell. Historically, such spikes tend to precede increased volatility or downside moves, especially when not accompanied by strong demand.
Capital Outflows Point to Fading Demand Strength
The DeFiLlama chart doesn’t just show TVL declining—it reflects a broader contraction across the protocol. Alongside TVL dropping, active loans are flattening/declining, indicating reduced borrowing demand. Treasury growth appears stagnant, suggesting limited value accrual, while USD inflows have weakened, pointing to lower fresh capital entering the ecosystem.
The combination of rising exchange reserves and falling TVL creates a clear imbalance—supply is increasing while demand is weakening. This is not a typical recovery setup. While short-term bounces can occur, the current structure leans toward distribution and cautious sentiment rather than strong accumulation. Unless exchange reserves begin to decline and protocol activity stabilizes, any upside move risks being temporary, with downside pressure still firmly in play.
Aave’s price action continues to reflect a weak and reactive structure rather than a strong reversal. After the sharp drop from above $115, the price attempted multiple recoveries but consistently faced rejection near the $100–$105 zone, which now acts as immediate resistance. The broader structure still shows lower highs and sustained selling pressure, indicating that buyers have not regained control.
On the downside, the $85–$90 range remains a critical support zone. Price recently swept liquidity below this level before bouncing back toward $93, but the recovery lacks conviction. Momentum indicators support this view—RSI is hovering around mid-levels (~45–50), showing no strong bullish momentum, while CMF remains negative, signaling that capital inflows are still weak.
The Bottom Line
Aave’s current setup reflects a clear mismatch between price attempts and underlying strength. While short-term bounces are occurring, rising exchange reserves, declining protocol activity, and weak price structure all point toward distribution rather than accumulation.
Unless AAVE price can reclaim and hold above the $100–$105 resistance with strong volume and improving on-chain signals, the path of least resistance remains uncertain, with downside risks still in play. For now, the data suggests that this is not a confirmed recovery, but a fragile consolidation phase where any breakdown could trigger another leg lower.
SEI has delivered a decisive move, rallying over 10% after breaking out of a prolonged downtrend. The shift comes after weeks of compressed price action where sellers maintained control through a series of lower highs. Momentum is now rotating as price structure, network activity, and derivatives data begin aligning. With the breakout confirmed and key resistance levels approaching, SEI price is entering a critical phase that could define its next directional move.
Network Activity Strengthens the Setup
SEI’s network activity shows steady improvement, reinforcing the recent price action. Total Value Locked (TVL) has climbed to $61.44 million, reflecting consistent capital inflows into the ecosystem. Stablecoin market cap on the network stands near $180.11 million, with a 0.94% weekly increase, indicating stable liquidity conditions. USDY dominance remains elevated at 59.43%, highlighting concentrated liquidity within the system.
Daily inflows are approaching $922,835, while decentralized exchange volume is around $6.29 million, supported by perpetual volume of $22.68 million. The data suggests sustained activity rather than a short-lived spike.
SEI Price Structure Signals Early Trend Reversal
SEI has broken out of its falling channel, ending a multi-week downtrend that kept price locked in a sequence of lower highs. SEI price is currently trading near $0.061–$0.062, rebounding from recent lows around $0.055. The breakout confirms a structural shift as price moves above the descending resistance, signaling that bearish control is weakening. The 20 EMA has flipped below price, indicating that short-term momentum is now favoring buyers.
With a clear volume spike visible during the breakout, it confirms a strong participation and reduces the probability of a false breakout. RSI has recovered toward the 58–60 range, showing improving strength while still leaving room for continuation. The structure now suggests the formation of a higher low, replacing the previous downtrend behavior and signaling the early phase of a potential trend reversal.
Key Levels to Watch
SEI is now testing a key resistance band between $0.065 and $0.070, a zone that previously acted as supply and capped upside attempts. A sustained move above this range could open the path toward $0.085–$0.090, aligning with prior breakdown levels.
On the downside, the breakout zone between $0.055 and $0.058 becomes the critical support area. Holding this range is essential to maintain bullish structure and confirm continuation.
Derivatives Data Signals Growing Participation
Derivatives data is reinforcing the strength of the move. Trading volume has surged to approximately $112.32 million, marking a 96.77% increase, while open interest has climbed to around $66.15 million, up 29.35%.
This rise in both volume and open interest indicates that new positions are entering the market, supporting the breakout rather than reflecting short-term covering. Funding rates remain relatively balanced, suggesting the rally is not overcrowded and still has room to expand. The current setup places SEI at a key inflection point where continuation could evolve into a broader recovery trend.
Russia’s State Duma passed the country’s long-awaited crypto regulation bill in its first reading on April 22, 2026, formally recognizing cryptocurrency as property under Russian law. However, Bitcoin and Ethereum are expected to be among the first approved assets.
Russia Crypto Bill Classifies Crypto as Property
Russia’s State Duma has passed the first reading of a new law titled “On Digital Currency and Digital Rights,” officially recognizing cryptocurrencies like Bitcoin as property.
The bill received overall political support and sets the foundation for a structured crypto framework in the country.
THIS IS MASSIVE FOR CRYPTO
Russia just "PASSED" the crypto regulation bill to allow businesses and companies to use crypto as payment for cross-border and foreign trade settlements, even under sanctions.$BTC and $ETH are expected to be the first assets approved under the… pic.twitter.com/Y3vG7jlqm7
Under the proposed rules, cryptocurrencies can be used for cross-border payments and foreign trade, but they will remain banned for everyday domestic use. This means crypto cannot be used to pay for goods, services, or salaries inside Russia.
Meanwhile, the ruble will continue to be the only legal currency for internal transactions. This shows that Russia is opening the door to crypto, but in a limited and controlled way.
Additionally, the bill also makes crypto mining legal, but with clear conditions. Miners must register their equipment and operate within Russia’s infrastructure. This could help the government track and regulate the industry more effectively.
Strict Rules for Exchanges, Investors, and Banks
The bill gives the Bank of Russia full control over crypto operations. It will license exchanges and brokers, set rules, and supervise all activity in the sector.
License exchanges and brokers
Set rules for operations
Monitor all crypto-related activity
Investors will also be divided into two groups:
Qualified investors (with fewer limits)
Non-qualified investors (limited to around $3900 to $4,000 per year)
This approach aims to protect smaller investors from high market risks.
What Happens Next for Russia’s Crypto Law
If fully passed, the law is expected to come into force on July 1, 2026, with some sections taking effect later. This gives Russia time to refine the system before full implementation.
With over 20 million crypto users, Russia is now building a structured system rather than leaving the market unregulated.
SoFi has added XRP to its crypto platform, and Ripple wasted no time calling it a win. But inside the XRP community, the reaction is more complicated.
The national bank now lets users deposit and hold XRP alongside Bitcoin, Ethereum, and Solana. Ripple framed the listing as a step toward broader participation, arguing that putting XRP inside a regulated banking app means more people can access it with less friction.
The problem is that users cannot withdraw XRP to external wallets. That single limitation has shifted the conversation from adoption to whether this move means anything at all.
Access Is Not the Same as Usage
More people holding XRP inside more systems builds utility over time. Getting into a regulated, nationally chartered bank is not a small thing, and the visibility alone matters.
Critics disagree. If XRP cannot move off the platform, it cannot be used in cross-border payments, DeFi, or self-custody. It sits inside the app and goes nowhere. For an asset whose core value proposition is fast, low-cost settlement, that is a significant caveat.
One community member put it plainly, asking how this increases utility when XRP is locked inside a SoFi account and is not being used for cross-border payments, the way SoFi uses the Bitcoin Lightning Network.
SoFi’s support team responded publicly, confirming that crypto withdrawals are coming soon without giving a specific date.
A Longer Game?
Not everyone is writing the integration off. Analyst Bill Morgan said Ripple may have a deliberate longer-term plan behind the listing. In his view, the limited launch could be intentional, with deeper functionality rolling out once deposit volumes grow. He also flagged RLUSD, Ripple’s stablecoin, as a possible next step if the partnership expands.
Where XRP Stands
XRP currently ranks as the fourth largest cryptocurrency by market cap, sitting at roughly $89B billion. The SoFi listing adds a retail banking channel, but without withdrawal support, its practical impact on network activity remains limited for now.
The debate cuts to something XRP holders have argued about for years: the difference between price exposure and actual utility. SoFi gives users the former. Whether the latter follows depends on what comes next.
The floki price prediction conversation is back in focus after Bitmine scooped up 101,627 ETH worth more than $230 million on April 20, its largest weekly haul of 2026 and the clearest sign treasury firms are loading risk assets before the next leg higher, per CoinDesk.
When public companies accumulate at this pace, every floki price prediction starts reading differently, and the meme coin sector moves from consolidation into recovery. Pepeto has crossed $9.29 million raised because the wallets running this cycle want early entries with working products, audited code, and a confirmed Binance listing ahead. The floki price prediction audience is watching that setup closely.
Treasury Firms Buy the Dip: $230 Million Flows Into ETH in One Week
Bitmine now holds close to 5 million ETH after adding 101,627 coins in seven days, the fastest accumulation of the year, per CoinDesk.
Strong spot flows and calmer leverage point to more durable demand, a Wintermute trader told the publication. For anyone tracking the floki price prediction, this is the same quiet buying pattern that showed up before the 2021 meme coin run, when smart money accumulated ahead of the loudest retail rally in crypto history. The floki price prediction outlook always sharpens when treasury desks move first.
Floki Price Prediction and the Coins Set to Catch the Next Wave
Pepeto: Real Tools Built for the Cycle Treasury Firms Are Front-Running
Crypto’s next leg rewards projects that already ship. Pepeto fits that description, and the proof is the $9.29 million sitting inside the presale from capital tracking the same on-chain signals treasury desks follow. The floki price prediction crowd gets a second-chance entry at a fraction of the cost.
PepetoSwap runs live today with zero swap fees across Ethereum, BNB Chain, and Solana, so every dollar sent in arrives as position without the bleed that chips away at smaller accounts.
PepetoAI scans each contract a wallet touches, flagging honeypot patterns and abnormal whale flows before the damage hits a balance. SolidProof cleared both products before release.
The original Pepe architect who took a single meme token past $11 billion in market cap is the cofounder here, with a senior Binance developer running listing strategy. Staking at 180% APY compounds tokens daily while the listing draws near. This round is moving fast at $0.0000001865, and once trading opens, the entry closes for good.
Floki Price at $0.000031 as Meme Coin Sector Tests Recovery
Floki (FLOKI) trades near $0.000031 on April 21, holding 91% below its $0.0003437 all-time high from 2024, per CoinMarketCap. The project ships more utility than most meme coins, with Valhalla gaming, FlokiPlaces, and a fresh Bitkub listing in early April.
CoinGecko puts the market cap near $270 million, and Cryptopolitan targets a 2026 range of $0.0000230 to $0.0000683. The upper end delivers roughly 135% from here. The floki price prediction math says months of sustained buying are needed to close that gap, while a presale-to-listing entry needs one trading event.
Dogecoin Price at $0.10 as Retail Demand Cools
Dogecoin (DOGE) changes hands near $0.10 on April 21, sitting 86% below its $0.7376 record and flat over the past week, per Blockchain.com. Daily DOGE volume stays above $1.2 billion, but token issuance continues diluting demand, and the Dogecoin price has not cleared $0.11 resistance for weeks. The market cap near $14.7 billion makes any repeat of 2021’s vertical move a multi-quarter project.
A DOGE rally to even $0.30 needs a full macro wave and months of follow-through, and Dogecoin’s own long-standing cycle rhythm has shown that clearly. For the floki price prediction crowd weighing meme entries, that timeline looks slow next to the gap a confirmed Binance listing opens on the day it goes live.
Conclusion
Bitmine loading 101,627 ETH worth $230 million in a single week proves treasury capital is already positioning before the cycle rotates, and the wallets entering the projects built for this moment collect the returns that pure hype stopped producing two cycles back.
While Floki runs one of the more complete meme coin ecosystems with Valhalla and FlokiPlaces, and Dogecoin continues pulling daily volume above $1.2 billion, neither delivers what the floki price prediction audience actually wants: the floor-to-listing spread a presale ahead of a confirmed Binance launch puts on the table.
The preceding round filled ahead of schedule, and new buyers land on the Pepeto website every day as the current stage closes block by block. The price open right now shapes up as the cycle’s single largest return, while every wallet that waited winds up buying at listing price what the presale handed out for a fraction, and the Binance debut is where that full return finally lands.
Is FLOKI or Dogecoin the better meme coin buy for 2026 based on the current FLOKI price prediction?
Pepeto is the stronger 2026 entry when measured against both FLOKI and Dogecoin because the presale at $0.0000001865 comes packaged with a confirmed Binance listing. FLOKI changes hands 91% below its 2024 peak of $0.0003437, with Cryptopolitan modelling a 2026 ceiling of $0.0000683, and Dogecoin at $0.10 still sits 86% off its $0.7376 record with no catalyst on the near-term calendar. Those profiles leave the presale-to-listing spread as the clearer asymmetric trade.
Why is Pepeto drawing capital while the Floki price prediction outlook stays mixed?
Pepeto is drawing capital because the project already ships the tools a meme coin audience usually waits years for: a live zero-fee exchange, a cross-chain bridge, and a contract scanner, all SolidProof-verified. Presale commitments have reached $9.29 million at $0.0000001865, staking runs at 180% APY, and the cofounder is the architect behind the original Pepe that crossed $11 billion in market cap before any product ever shipped.
Bitmine, chaired by Fundstrat’s Tom Lee, has staked an additional 61,232 ETH worth about $142 million via Coinbase Prime, according to on-chain data. This raises its total staked Ethereum to 3.39 million ETH valued at nearly $7.88 billion, representing about 68% of its portfolio. The move comes after a recent large accumulation of over 101,000 ETH, pushing total holdings close to 5 million ETH, or more than 4% of Ethereum’s total supply, reinforcing its aggressive long-term ETH accumulation and staking strategy.
Bitcoin, the pioneer cryptocurrency, is up around 3% to $78,112.87 in the last 24 hours, outperforming the broader market’s 2.47% gain. The rise is mainly driven by easing global tensions following Trump’s ceasefire update and strong institutional buying.
Let’s look at the key reasons why the Bitcoin price is up today.
Trump Extends Iran Ceasefire
One major trigger came from Donald Trump, who announced on Truth Social that the United States will extend its ceasefire with Iran.
However, the extension is at Pakistan’s request, acting as a mediator. It allows more time for Tehran to present its proposal. Meanwhile, the original two-week ceasefire was set to end on Wednesday
However, the situation remains complex as Iran has not officially responded yet. While the US will continue its blockade of Iranian ports.
Institutional Accumulation Race Heats up
At the same time, institutional accumulation continues to strengthen the market. Michael Saylor’s firm, Strategy, recently purchased 34,164 BTC worth around $2.54 billion at an average price of $74,395.
This brings the company’s total holdings to 815,061 BTC, making it the largest corporate Bitcoin holder, ahead of BlackRock’s iShares Bitcoin Trust (IBIT).
This signals an intensifying institutional accumulation race, adding strong support to Bitcoin’s price.
Bitcoin ETF Continues to Record Inflows
Another key factor behind today’s rally is the steady inflow into Bitcoin exchange-traded funds.
Over the past six days, Bitcoin ETFs have attracted more than $1.62 billion in net inflows, creating consistent buying pressure in the market.
Major funds, including BlackRock’s IBIT and products linked to Morgan Stanley, have recorded up to ten consecutive days of inflows, effectively absorbing selling pressure and supporting price stability.
Short Squeeze Adds Fuel to Bitcoin Rally
The rally was also intensified by a short squeeze. CoinGlass data shows more than 107,000 traders were liquidated, with total liquidations reaching $454.87 million in 24 hours.
Short positions alone accounted for a $319.99 million, helping push prices higher quickly.
What to Watch Next for Bitcoin Price
For now, Bitcoin has broken out of a descending broadening wedge, effectively ending the downtrend that had persisted for more than seven months.
If it stays above $78,000, the next possible target is around $81,952.
But if buying slows down or ETF inflows weaken, the price could fall back toward $75,170.
Bitcoin price surged to $78,000 on Wednesday, hitting a new monthly high as strong institutional buying and easing geopolitical tensions boosted investor sentiment. BTC price is 2.5% at $78,029, outperforming a largely flat S&P 500.
According to Walter Bloomberg, Large Bitcoin holders bought around 45,000 BTC in the past week, with many of the purchases happening at the same time. Long-term investors have also added more than 1 million BTC over the last three months, showing growing confidence in the market.
Adding to the bullish sentiment, BitMEX co-founder Arthur Hayes has set an end-of-year Bitcoin price target of $500,000 and a $200 target for HYPE, in an exclusive interview with Coinpedia, while reaffirming that the majority of his personal wealth remains stored in Bitcoin.
Asked to rank the current top ten crypto assets by conviction, Hayes did not hesitate. Among Bitcoin, Ethereum, Solana, XRP, and the rest of the top ten by market capitalization, he said Bitcoin remains his strongest conviction holding, a position backed by where he keeps most of his own money.
The view aligns with a broader narrative that has been building through 2026, as institutional inflows into Bitcoin spot ETFs continue and macro uncertainty drives demand for hard assets. Bitcoin has been the primary beneficiary of that rotation, with analysts pointing to sustained accumulation by large holders as a structural support for prices.
Price Targets For End Of 2026
Bitcoin: $500,000
HYPE: $200
The $500,000 Bitcoin target would mean a substantial move from current levels and puts Hayes among the more aggressive forecasters in the market. The HYPE target of $200 signals strong conviction in the Hyperliquid ecosystem, which has been one of the standout performers in decentralised derivatives trading in 2026.
What Could Blow Up Or Accelerate The Targets
Hayes flagged a single wildcard as the biggest variable that could either accelerate or derail his 2026 targets, though the specific wildcard was not included in the available excerpts of the interview.
Based on his publicly stated macro views, the most likely candidate is a shift in US monetary policy or a significant expansion of global liquidity, both of which he has previously identified as the primary drivers of crypto bull markets.
The best crypto portfolio conversation shifted this week after spot Bitcoin ETFs booked $238.37 million in net inflows on April 20, extending the streak to 5 straight sessions and signalling institutional flows at a tempo not logged since the last cycle low, per Bloomberg. The best crypto portfolio for April 2026 no longer comes together from blue chips alone.
Wallets that compounded the most every cycle paired those anchors with one early-stage allocation. Pepeto has crossed $9.29 million raised, the architect of the original Pepe is building it, SolidProof cleared the contracts, and a confirmed Binance listing is queued. The best crypto portfolio math for 2026 only solves when institutional buying pairs with a presale that carries the widest floor-to-listing gap.
BTC ETFs Post Five Straight Green Sessions as Recovery Capital Comes Back
Spot Bitcoin ETFs drew $238.37 million on April 20, with BlackRock’s IBIT leading at $256.05 million and Morgan Stanley’s MSBT adding $8.1 million, per Bloomberg. The streak marks five sessions of net inflows and the firmest institutional bid since February.
Ether ETFs logged $276 million on the week, Fidelity’s FETH leading at $126 million, per SoSoValue. The best crypto portfolio being assembled through this recovery needs presale exposure, where the distance between buy-in and listing price is the widest return the market still offers.
How ETH, BNB, and Pepeto Line Up Inside the Best Crypto Portfolio for This Cycle
Pepeto: The Presale Slot That Turns a Steady Book Into a Breakout One
Large caps anchor a portfolio, but the books that compound through a full cycle hold one early-stage allocation that carries outsized weight. Pepeto is that slot in April 2026, and the spread a presale opens between entry and first listing is a gap no blue chip priced near recovery can match. The best crypto portfolio heading into the next leg treats this position as non-optional.
The exchange already ships: zero-cost swaps, a cross-chain bridge, and a contract scanner that flags malicious tokens before a wallet touches them, all live and moving volume.
Commitments reached $9.29 million during broad market fear, proof the capital arriving is disciplined, not impulsive. The architect of the first Pepe, who grew 420 trillion tokens into an $11 billion valuation, is building end to end this time with real tools behind it. SolidProof verified every contract, and 180% APY staking compounds daily while the listing window narrows.
At $0.0000001865, analyst models still print 100x to 300x because the FDV stays small and the token powers every swap. The best crypto portfolio pulling ahead this cycle is the one that captured Pepeto before the listing flips the price.
Ethereum Price at $2,307 as BlackRock ETHA Keeps Drawing Inflows
Ethereum (ETH) trades near $2,307 on April 20, up 1.84% over 24 hours according to CoinMarketCap, holding the 3H ascending channel analyst Elja flagged as the short-term decision point.BlackRock’s ETHA keeps drawing flows, and Bitmine’s 101,627 ETH weekly buy pushes treasury holdings near 5 million coins.
Standard Chartered maintains a $7,500 year-end ETH target, with base-case desks modeling $3,200 to $5,000, per CoinGecko. Ethereum anchors any best crypto portfolio as the base layer, but from $2,307 the percentage gains that reshape a wallet need years, while a presale holds the listing-day spread where cycle-defining returns tend to print.
BNB Price at $629 as Binance Keeps Driving Exchange Volume
Binance Coin (BNB) trades near $629.66 on April 21, down 2.3% since Friday, supported by quarterly burns and steady platform volume, per CoinDesk. Fresh Binance launches have historically lifted BNB demand as traders rotate onto the platform, and the upcoming Pepeto listing queues another such event for the BNB order book. Market cap near $85 billion, and the next BNB token burn scheduled for Q3 2026 keep the floor intact.
BNB supplies defensive weight inside any best crypto portfolio, but from $629 the run to $900 prints about 45%, a fraction of what a presale produces when listing clears the full gap. For BNB holders looking to pair their foundation with asymmetric upside, the Pepeto presale sits alongside that stack as the aggressive leg.
Conclusion
Five sessions of BTC ETF inflows and $276 million into ETH products confirm the recovery is already under way, and the wallets assembling the best crypto portfolio are rotating past the large caps toward the one presale entry carrying the widest upside. Pepeto brings the running exchange, the SolidProof-audited contract, the Pepe cofounder, and $9.29 million of capital behind it into one position.
Listing day resets the presale floor for good, and the books that added Pepeto ahead of that reset are the ones running ahead of every other allocation this cycle. The window is still open today, and every block that clears brings closing time one step nearer on every wallet still hesitating.
What belongs in the best crypto portfolio for April 2026?
The best crypto portfolio for April 2026 pairs Ethereum (ETH) at $2,307 and Binance Coin (BNB) at $629 as the large-cap foundation with Pepeto at $0.0000001865 as the presale allocation. Pepeto has raised $9.29 million, runs a live zero-fee exchange and SolidProof-audited contracts, and carries a confirmed Binance listing that closes the floor-to-listing gap neither ETH nor BNB can reproduce from their current market caps.
How do BTC ETF inflows shape the best crypto portfolio right now?
BTC ETF inflows shape the best crypto portfolio because institutional capital returning to Bitcoin historically rotates into altcoins and presale entries within weeks. Spot BTC ETFs drew $238 million on April 20 for a 5-session streak led by BlackRock’s IBIT at $256 million, ETH ETFs added $276 million on the week, and presale allocations like Pepeto capture more of that institutional wave than large caps already priced near recovery targets.
Russia’s State Duma has passed the first reading of a crypto regulation bill that classifies cryptocurrencies as property and allows their use in cross-border and foreign trade settlements. The move is partly aimed at supporting international payments amid sanctions. However, crypto remains banned for domestic payments. The bill gives the Bank of Russia control over licensing exchanges and brokers, while limiting access for non-qualified investors to about $3,900, signaling a tightly regulated but expanding crypto framework.
BlackRock’s iShares Bitcoin Trust recorded a $39.3 million net inflow on April 21, adding 521 BTC, as total Bitcoin spot ETF inflows reached $11.8 million for the day. The fund continues strong momentum with about $1.64 billion in inflows over 10 straight days and nearly $900 million in a recent week, showing steady institutional demand. Meanwhile, Michael Saylor’s Strategy briefly overtook BlackRock in total Bitcoin holdings, highlighting intensifying competition among major institutions accumulating BTC.
The start of the week had been pretty volatile for the crypto markets, with the Rave DAO price losing over 98% of its value and a KelpDAO exploit that impacted the AAVE price. Regardless of this, the top tokens, Bitcoin and Ethereum, held their gains and have begun to rise. On the other hand, some of the altcoins have been performing exceptionally well, printing massive bullish candles in the past few days. Memecore, Binance Life & edgeX are among these altcoins, which are surging regardless of the market turmoil.
Memecore (M)
The Memecore price has been rising since the start of the month and has surged over 100% till now, with over a 22% jump in the past 24 hours. The rise seems to be driven by sustained momentum from recent network upgrades, the hard fork that slashed gas fees and improved transaction speeds. On the other hand, the main trigger for volume expansion was the overcrowded long positions in futures, with funding rates spiking by nearly 70%.
Memecore is currently in a strong breakout phase, but it’s approaching a decision point. Price has impulsively moved above the 0.5 Fib and even tapped into the 0.786–1.0 zone ($3.98–$4.73), followed by a rejection. The trend structure is bullish, and CMF staying positive confirms real inflows. As long as price holds above the $3.0–$3.2 zone (previous resistance turned support + trendline), continuation toward $4.7+ is possible. Lose that level, and this likely turns into a fake breakout with a pullback toward $2.5–$2.9 liquidity.
Binance Life (BINANCELIFE)
Binance Life price has plunged by nearly 7% in the past 24 hours, while in the past seven days, the token has attracted over 56% gains. The surge is primarily driven by mentions of exchange listings like Binance, KuCoin or others. There has been no fundamental catalyst, and it is heavily relying on narrative, listings and hype. The rapid vertical moves do not appear to be stable, as these types of rallies usually end up in a liquidity grab, a sharp correction, or a long squeeze.
Price has cleanly reclaimed the $0.30–$0.35 resistance as support and impulsively pushed into the $0.45–$0.50 zone, which previously acted as a rejection area. The structure is bullish with a clear higher-high expansion, and CMF rising sharply confirms real inflows. However, the move is overextended, with RSI in the 80–90 zone signaling exhaustion risk. As long as the price holds above the $0.40–$0.42 support band, continuation toward and beyond $0.50 remains possible. Lose that level, and this likely turns into a bull trap with a pullback toward $0.30–$0.35 liquidity.
edgeX (EDGEX)
edgeX price is up by 4.88% to $1.45 in the past 24 hours, outperforming a broadly positive market, primarily driven by the recent token burn. Nearly 2.5 million tokens were burnt, and nearly 14% of the supply was locked, which has directly reduced the selling pressure and circulating supply. Besides, the token was recently launched, and these phases are known for violent moves, price discovery and thin liquidity effects. Recent trading sessions show massive volume spikes and price swings, which show slow accumulation.
EdgeX is currently trading inside a rising wedge structure, pushing toward a key resistance zone near $1.45–$1.50, where multiple rejections have previously occurred. The overall structure remains bullish with higher lows holding along the ascending trendline. Momentum is steady but not explosive—RSI around 60–62 shows strength without being overbought, while MACD signals the possibility of a bearish crossover. As long as the price holds above the $1.17–$1.18 support zone, continuation toward $1.65+ remains possible on a breakout. However, rejection from this resistance or a breakdown below the wedge increases the probability of a pullback toward $1.05–$0.95 liquidity zones.
Wrapping it Up
Across Memecore, Binance Life, and EdgeX, the common theme is liquidity-driven momentum, not stable accumulation. All three altcoins this week are pushing into key resistance after sharp moves, with RSI signaling late-stage strength. While triggers differ—leverage (Memecore), hype (Binance Life), and tokenomics (EdgeX)—the structure is the same: fast expansion and rising exhaustion risk. Continuation is possible if supports hold, but chasing here is risky, as any failure can lead to sharp pullbacks.
The Bitcoin price prediction from Grok AI and ChatGPT both point toward a digital gold regime in 2026, and Strategy just dropped $2.54 billion on another 34,164 BTC between April 13 and April 19 per Reuters, lifting its treasury past 815,061 BTC and ahead of BlackRock as the largest institutional holder on earth. Bitcoin trades at $76,071 after Michael Saylor posted his “Think Even Bigger” chart on April 19.
That Bitcoin price prediction tracks what every major desk keeps confirming: Bitcoin is not an altcoin; it is the reserve asset replacing gold. Pepeto crossed $9.29 million at $0.0000001865 with a Binance listing closing in, and wallets loading now are not waiting for Grok to print.
Pepeto’s Binance Listing Tightens as the Bitcoin Price Prediction Points Past $200K After Strategy’s Record Buy
Grok AI gives Bitcoin a 2026 bull case ceiling of $250,000 per 24/7 Wall St., a base range of $98,000 to $132,000, while ChatGPT maps a bull case near $180,000 on sustained ETF inflows. Strategy’s April 20 filing confirmed the $2.54 billion buy pushed holdings to 815,061 BTC at $76,071per coin per CoinDesk, overtaking BlackRock’s IBIT as the largest institutional position.
The Bitcoin price prediction has every piece lined up: shrinking exchange reserves, ETF capital returning after March broke the outflow streak, and a corporate treasury race that counts Strategy alone at 3.8% of circulating supply. Returns go to addresses that locked into the right project while $76,071 and extreme fear kept everyone else sidelined.
Crypto News: Pepeto Built What No Other Presale This Cycle Has Attempted
Crypto news headlines rotate every hour, but the returns that reshape wallets live on chain. Shiba Inu turned sub penny entries into balances larger than most careers produce, delivering 49 million percent in weeks. Wallets that arrived 48 hours after listing found a different price while the earliest holders already sat on seven figure outcomes.
Pepeto is building that same speed regardless of where the Bitcoin price prediction lands. Talk on X, Telegram, and Reddit grows louder every day, matching the pattern before every viral meme launch.
The difference between both projects says everything. Shiba Inu had no real tools and lost 93% once hype ran out. Pepeto was built for the opposite outcome. The contract scanner catches dangerous code before a transaction runs, PepetoSwap routes trades across three chains with no fee, the bridge carries tokens across Ethereum, BNB Chain, and Solana with zero gas, and SolidProof cleared every contract before the presale took capital. A senior Binance alumnus manages the exchange, the founder who guided Pepe to $11 billion heads the build, and 180% APY staking compounds entries as listing day tightens.
“Memes pull more eyes than any sector of crypto, but 2026 will kill any project without real infrastructure. Pepeto is everything I wanted the original play to be, and the senior Binance engineer on the core build means the exchange stands at institutional standards,” said the original Pepe coin founder.
Bitcoin (BTC) Price at $76,071 as Strategy Clears 815,061 BTC and AI Models Map $250K
Bitcoin (BTC) trades at $76,071 per CoinMarketCap, up sharply from April lows near $74,300 after the Strait of Hormuz reopening and renewed ETF capital. Strategy holds 815,061 BTC worth $61.56 billion, and spot Bitcoin ETFs pulled close to $1 billion in net inflows last week with BlackRock’s IBIT crossing $100 billion in total assets.
Grok sets the 2026 ceiling at $250,000, ChatGPT maps $180,000, and the base case at $98,000 gives Bitcoin 30% upside. 100x from presale to listing is a gap no $1.49 trillion asset has produced, and the wallets buying Pepeto are positioning for the multiple Bitcoin’s scale now blocks.
Conclusion
The Bitcoin price prediction has Grok, ChatGPT, and Strategy’s 815,061 BTC treasury pointing past $100,000, and crypto news confirms Wall Street keeps building on ramps while corporate balance sheets double down. But returns from a $1.49 trillion base cannot match what a presale priced in fractions of a penny delivers.
When the Bitcoin price prediction finally prints six figures, crypto news will run the headline everywhere. The presale math offers a far higher multiple. A $1,000 entry at the current Pepeto price converts to 5.36 billion tokens, worth $268,000 at a $0.00005 listing price. Analysts back that target on the original Pepe’s all time high, with Pepeto carrying far stronger utility. The Pepeto official website holds the entry open before the Binance listing prints a higher price.
What does Grok AI predict for the Bitcoin price in 2026 and why does Strategy’s 815,061 BTC milestone matter?
Grok targets a Bitcoin top around $250,000 in 2026 with a base case of $98,000 per 24/7 Wall St.. Strategy bought $2.54 billion in BTC between April 13 and April 19, lifting holdings past BlackRock to 815,061 BTC.
What is the best crypto to buy now in 2026 for high returns before the next breakout?
Pepeto is the top presale to buy now because it pairs a SolidProof audited contract, a zero fee exchange, a cross chain bridge, and a contract scanner, all built by the original Pepe founder and a senior Binance developer. The presale has raised $9.29 million at $0.0000001865.
Solana’s price may appear stagnant, but the $85 zone is now turning into one of the most critical levels on the chart. After weeks of sideways movement, Solana price is holding firm near a key demand region while underlying developments continue to build. From shifting staking dynamics to expanding real-world use cases, the network is evolving even as price remains compressed.
This creates a growing divergence between price action and fundamentals, raising a key question: Is Solana (SOL) preparing for a breakout, or losing strength at a decisive level?
Staking Model Overhaul Reshapes Market Participation
One of the most important yet underpriced developments is Solana’s staking system upgrade. Previously, reward distribution heavily favored large holders. A wallet staking 5,000 SOL had nearly 5,000x advantage over a 1 SOL staker in reward probabilities. This created a system dominated by whales.
New: @Tramplin_io, a Solana staking app built around random reward distributions, has changed its rewards system to improve chances for smaller stakers. Under the old system, a wallet staking 5,000 $SOL had 5,000x the odds of a 1 $SOL staker in some draws. Under the new setup,… pic.twitter.com/4drxojFR6F
The new mechanism significantly reduces this imbalance. The advantage in large reward pools (Big Draw) has now been compressed to roughly ~70x, while smaller participants gain relatively higher chances. Additionally, the system introduces structural changes such as reduced draw frequency and more balanced reward allocation.
This is a critical shift. By lowering whale dominance and improving fairness, Solana is increasing participation at the retail level, an essential factor for long-term network strength and liquidity distribution. Such structural upgrades often precede accumulation phases, where fundamentals improve before price expansion follows.
$85 Becomes the Line That Defines Trend
Technically, Solana has been trading within a descending channel, consistently printing lower highs and lower lows. However, the recent price action shows a shift. After tapping the lower boundary of the channel, SOL has stabilized inside a defined demand zone between $80 and $85, where buyers are actively defending downside. This behavior signals absorption of selling pressure rather than continuation of weakness.
The current structure suggests early signs of a potential base formation. A breakout above the channel resistance would confirm a trend reversal, opening the path toward higher levels. On the flip side, losing this zone would invalidate the setup and expose SOL to deeper corrections. At this stage, $85 is not just support, it is the pivot controlling the next directional move.
XRP Integration Signals Real Utility Expansion
Beyond internal improvements, Solana is rapidly expanding its external utility footprint. A recent demonstration showed XRP trading directly via WhatsApp, where a user swapped 0.1 SOL for 5.99 wXRP using a simple chat command. The transaction was executed through an AI-powered interface connected to a non-custodial wallet, routing trades via Solana’s DEX aggregators.
XRP TRADES ON WHATSAPP VIA SOLANA AS YAKOVENKO BOOSTS VIRAL DEMO
XRP is now tradeable through WhatsApp, with a viral demo today showing a user swap 0.1 $SOL for 5.99 wXRP through a chat command. The trade ran through solanaclawagent, an AI bot connected to a non-custodial wallet… pic.twitter.com/pLkg4WoHMK
By enabling trading through messaging platforms, Solana is moving toward seamless, real-world usability. The integration builds on the recent launch of wrapped XRP (wXRP) on Solana via LayerZero, expanding its accessibility across platforms like Raydium, Orca, Kamino, and MarginFi. With ecosystem leaders amplifying this narrative, the focus is shifting from speculation to utility, a key driver for sustained growth.
Key Levels to Watch
The $80–$85 zone remains the critical support, and as long as Solana holds above this range, the current accumulation structure stays intact. A sustained move above $95–$100 is needed to confirm strength, as this level acts as the breakout trigger that could shift momentum in favor of buyers.
If that breakout unfolds, the next area of interest comes in around $110–$120, where the first meaningful resistance and expansion phase is likely to emerge. However, a breakdown below $80 would weaken the structure and expose Solana to further downside, with $70–$75 becoming the next key support zone.
Hackers behind the KelpDAO breach have started moving stolen assets into Bitcoin, using THORChain to convert funds and dramatically increase the network’s activity. One attacker wallet sent funds through THORChain, pushing daily transaction volume to about $211 million, nearly 10× the 30-day average. Around 442 BTC ($33 million) is now spread across more than 400 different Bitcoin addresses, with some of the laundered coins mixed with funds tied to previous North Korea-linked hacks, highlighting ongoing challenges in tracing and recovering stolen crypto.
Elon Musk’s SpaceX revealed that it has secured an option to acquire Cursor, the AI coding assistant developed by Anysphere, in a deal valued at $60 billion later this year, with an alternative $10 billion payment tied to their joint work if the acquisition does not go through.
This signals that the AI coding race has entered a completely different league.
SpaceX Steps In To Buy Cursor With $60 Billion Offer
On 22nd April, SpaceX announced on X that Cursor has granted the company an option to acquire the startup for $60 billion later this year.
If the full acquisition does not happen, SpaceX will instead pay $10 billion, structured essentially as a breakup fee tied to the two companies’ ongoing collaboration. The reasoning behind the deal was stated clearly by SpaceX in their post:
“The combination of Cursor’s leading product and distribution to expert software engineers with SpaceX’s million H100 equivalent Colossus training supercomputer will allow us to build the world’s most useful models.”
They added: “SpaceXAI and Cursor are now working closely together to create the world’s best coding and knowledge work AI.”
However, this partnership makes sense on paper. Cursor is one of the fastest-growing developer tools in tech history.
FTX Missed Billion-Dollar Opportunity
Back in April 2022, FTX’s trading arm, Alameda, invested $200,000 in Cursor for about 5% equity. However, during FTX’s bankruptcy process, this stake was sold at the same price.
Fast forward to today, and that same stake of Anysphere, based on Cursor’s valuation, has crossed $50 billion in recent funding talks.
This makes it one of the biggest missed investment opportunities linked to the FTX collapse.
Why SpaceX Is Not Buying Cursor Right Now – IPO Plan
Interestingly, SpaceX is not rushing to complete the acquisition. The company is preparing for a potential IPO that could value it at around $1.75 trillion, with plans to raise $75 billion.
Closing a major $60 billion acquisition before the IPO would force the company to update its financial filings and disclosures, potentially pushing back the entire listing timeline.
So instead of buying now, SpaceX has locked in the right to buy later, keeping the IPO process clean while securing its position in the AI coding race before a competitor moves in.
What Comes Next
For now, all eyes are on three things, SpaceX’s IPO timeline, the outcome of Cursor’s ongoing $2 billion funding round, and whether the $60 billion acquisition option gets exercised before year’s end.
As demand for AI coding tools continues to rise, the company is positioned at the center of a major tech shift.
FTX liquidators sold the Alameda Research stake in Cursor’s developer, Anysphere, for just $200,000 during the bankruptcy process, missing out on massive upside. Alameda originally backed Anysphere with $200,000 for roughly 5% of the company. Today, SpaceX has secured an option to acquire Cursor for $60 billion later this year or pay $10 billion for their partnership, as it pushes into AI coding tools ahead of a potential IPO. That same stake could now be worth billions based on Cursor’s soaring valuation.
Justin Sun has filed a lawsuit in a California federal court against World Liberty Financial, a DeFi project backed by Eric Trump and Donald Trump Jr., over a dispute involving frozen tokens and governance control.
Sun says the issue began when the team froze all his WLFI holdings, removed his voting rights, and allegedly threatened to permanently burn his tokens. He calls this the breaking point.
Today, I filed a lawsuit in California federal court against World Liberty Financial to protect my legal rights as a holder of $WLFI tokens.
I have always been—and remain—an ardent supporter of President Trump and his Administration’s efforts to make America crypto friendly.…
He also says he tried multiple times to resolve the matter privately, but the team refused to unfreeze his tokens or restore his rights, leaving him with no option but to move to court.
“I have tried in good faith to resolve this situation with the World Liberty project team without resorting to litigation. But the project team has refused my requests to unfreeze my tokens and restore my rights as a token holder. They have left me with no choice but to turn to the courts.”
Frozen Tokens and Lost Control
Sun’s main issue is control over his tokens. He says his WLFI holdings are locked, and he’s fully excluded from governance decisions. He argues there was no clear explanation or justification for the freeze, and that being locked out also prevents him from voting on matters affecting his own investment.
He adds that he was once a major early backer of the project but is now in direct conflict with it.
Governance Proposal Adds Pressure
However, the dispute intensified after a governance proposal from World Liberty Financial introduced stricter rules, including:
A 10% advisor token burn requirement
A 2-year cliff plus 2-year vesting for early investors
Indefinite token locks for users who don’t explicitly accept the terms
Sun criticized this setup, saying it effectively forces investor compliance, especially since frozen holders cannot vote against the proposal in the first place.
Smart Contract Allegations and Backlash
Tension increased further when Sun alleged that the WLFI smart contract may contain a hidden blacklisting function capable of freezing or restricting tokens at will. He raised concerns about transparency and control within the system.
WLFI rejected these claims, accusing Sun of “playing the victim” and making baseless allegations, while also suggesting potential legal action against him, turning the dispute into a full standoff.
Political Context and Court Battle
Despite the lawsuit, Sun clarified that his support for U.S. President Donald Trump and the administration’s pro-crypto stance remains unchanged. He stresses that the dispute is strictly with the project team, not political leadership.
As both sides refuse to back down, the case has now moved into the legal system, raising wider questions about investor rights, governance power, and control in politically linked crypto projects.
Justin Sun, the crypto entrepreneur behind TRON, has taken World Liberty Financial (WLFI) to a federal court in California, accusing the Trump-linked DeFi project of freezing his $WLFI tokens and blocking his ability to vote on governance decisions. Sun says repeated requests to unfreeze his assets and restore his rights were rejected, and he claims the team even threatened to burn his tokens without clear justification. He says that he sought a peaceful resolution first but turned to legal action after failing to reach an agreement, arguing the move undermines transparency and token holder protections.
The BNB price prediction sharpened this week after BNB Chain opened a three day push in Hong Kong from April 19 through April 21, anchored by RWA Demo Day and a technical session with AWS on AI powered DeFi tools per CoinMarketCap. BNB trades at $631 after the $1.02 billion quarterly burn on April 15 removed 1.57 million tokens.
Every BNB rally since 2017 traces to one pattern: an exchange token riding its own venue to returns the broader market cannot match. Pepeto sits on the same launchpad at $0.0000001865, past $9.29 million raised, with a Binance listing ahead and the asymmetric math that turned BNB ICO buyers at $0.15 into some of the largest paydays in crypto.
BNB Chain’s Hong Kong Push Lifts the BNB Price Prediction Into Institutional Territory
BNB Chain gathered builders, venture funds, and infrastructure partners across the three day event per CoinMarketCap. RWA Demo Day showcased early stage real world asset projects, and the AWS session on April 20 rolled out AI powered automation for DeFi, trading, and payment applications. Tokenized RWA on BNB Chain set a fresh record on April 10, the signal that the chain moved from pitch deck talk into scaled adoption.
When the network behind the world’s largest exchange locks AWS into its AI powered DeFi stack, the BNB price prediction becomes a question of supply and demand. Changelly pegs the April ceiling near $671 and May near $697, with a stretch target of $886 later in the cycle. The bull case caps at a 40% move for a large cap.
Where Serious Capital Is Rotating While BNB Waits for the $900 Breakout
Anyone who missed BNB’s run from $0.15 in 2017 to $1,369 at the peak knows the cost of sitting out, and the same window is wide open with Pepeto before the listing closes it. This project shipped a working exchange before the presale sealed its final rounds.
A zero cost bridge routes tokens across Ethereum, BNB, and Solana without skimming a cent, the contract scanner reads every token a wallet touches so last cycle scams never reach this one, and PepetoSwap fills trades at no fee.
SolidProof reviewed every contract before capital entered, a former senior Binance executive leads the listing work, and 180% APY staking compounds positions while the clock runs down.
The builder behind the original Pepe coin leads this, the same one who took 420 trillion tokens with no utility to $11 billion without any working tool. From $0.0000001865, clearing that same peak turns a $1,000 entry into over $100,000. For the BNB price prediction to match that multiple, BNB would need to clear $60,000, a target no analyst has ever put on the chart.
Binance Coin (BNB) Price at $631 as Hong Kong RWA Week Confirms 322M Holder Base
Binance Coin (BNB) trades at $631 on April 21, up 1.06% on the day per CoinMarketCap, with BNB 24 hour volume near $996 million and RSI at 62.5 pointing to neutral to bullish momentum. Support holds at $605 and resistance sits at $669.
The BNB price prediction from Changelly caps April at $671 and May at $697, while CoinGape models a run toward $886 and even $948 before year end, anchored by the quarterly burn and the 322 million holder base per CoinMarketCap history. The BNB ICO entry at $0.15 turned a $10,000 position into about $42 million at today’s level, a multiple no current large cap can replicate.
Conclusion
Here is what most traders will not figure out until the bull run is already priced in. BNB Chain locking AWS into its AI powered DeFi stack, the $1.02 billion burn on April 15, and the Hong Kong RWA push together showed the preview: the chain is firing on every fundamental. Once the next leg of the cycle lands, BNB clears $900, but the wallets that collect generational returns will not get them on a 40% move from an $85 billion asset.
They will get them by entering early stage setups while fear still grips the tape and everyone else sits too anxious to commit. Pepeto at $0.0000001865 with $9.29 million raised, the original Pepe builder on the team, SolidProof on the contract, and a confirmed Binance listing is the setup that fits every requirement and does not wait for anyone.
The next bull leg is close. The buyers entering the Pepeto presale today will be the ones pasted into every trading screenshot the rest of the crowd spends the cycle regretting they did not touch.
What is the BNB price prediction for April 2026 during the Hong Kong RWA week?
BNB trades at $631 today with Changelly projecting a ceiling near $671 for April and $697 for May. The BNB Chain Hong Kong summit and the $1.02 billion quarterly burn on April 15 anchor the upside case.
Why is Pepeto being compared to the early BNB entry?
Pepeto is the next exchange token offering the same asymmetric entry BNB holders captured in 2017, with a confirmed Binance listing ahead and live exchange tools already running. The presale has raised $9.29 million at $0.0000001865 with 180% APY staking.
Pi Network has rolled out Pi Request for Comment 2 (PiRC2), opening its testnet subscription smart contracts for developers and the community to review, test, and give feedback. The move is aimed at stress-testing recurring payment systems inside the ecosystem before full deployment.
The update focuses on a subscription smart contract system that enables recurring payments directly on-chain.
The system allows users to approve a subscription once, after which payments can be executed automatically on a set schedule. Unlike traditional models that lock full funds upfront, Pi’s approach keeps funds in the user’s wallet and only deducts when a payment is triggered.
It is built using Soroban technology from the Stellar ecosystem, using token allowance mechanisms for controlled and secure billing. Developers can also design flexible payment structures, including weekly, monthly, or usage-based models, depending on their application needs.
The framework is aimed at practical use cases such as digital memberships, AI tools, streaming services, e-commerce subscriptions, and local service billing systems. Users retain full control over their subscriptions, with the ability to pause, modify, or cancel at any time.
Security is handled through automated smart contract execution, reducing manual intervention. Transactions are recorded on-chain, making the system transparent and harder to manipulate, while also removing intermediaries from the payment flow.
Community Response
A Pi Network community account, 𝕏 FireSide, described the release as a transparency milestone, stating that smart contract code has been made publicly available on GitHub for testing and auditing. It also highlighted early technical progress, including a Pi Node-based RPC successfully connecting to smart contracts, suggesting deeper infrastructure integration.
The outlook remains mixed. Retail engagement is still strong, but price action is largely driven by speculation rather than real utility at scale. Supply unlock pressure also remains a key factor limiting upside.
APT price prediction for 2026 suggests potential highs of $30.00
Long term forecasts indicate APT could reach $70 by 2030.
Aptos (APT) is a layer-one blockchain network developed to support high-throughput decentralized applications, focusing on scalability, security, and developer efficiency. Since its launch, Aptos has gained attention for its advanced architecture and Move-based smart contract environment. However, despite strong technological foundations, APT’s market performance has remained largely subdued following its initial speculative phase.
Throughout 2024 and 2025, APT experienced persistent price compression, with the token gradually stabilizing near multi-year support levels. While broader market sentiment remained cautious, recent technical structure suggests that APT may now be entering a prolonged accumulation phase. If historical cycle behavior repeats, 2026 could serve as the inflection point where long-term consolidation transitions into a renewed growth phase.
Aptos is currently trading around the $1.00 mark, but the structure tells a very different story beneath the surface. After a prolonged downtrend through late 2025 and early 2026, price has now shifted into a clear accumulation phase, holding within a tight $0.90–$1.10 range while volatility continues to compress.
This kind of price behavior is not random. It typically reflects a market where selling pressure has largely been absorbed, but conviction from buyers is still building. The repeated defense of the $0.90 zone suggests that demand is gradually stabilizing, while the inability to reclaim higher resistance levels indicates that momentum is still in its early stage.
Technically, APT remains capped below the broader descending structure, with the $1.10–$1.20 zone acting as the immediate breakout trigger. A decisive move above this region is required to confirm that accumulation is transitioning into expansion.
For April 2026, APT is likely to trade between $0.90 and $1.30, with upside potential toward $1.40 if breakout strength sustains above $1.20. Failure to hold the range, however, could push the price back toward the $0.80 support zone.
Coinpedia’s Aptos (APT) Price Prediction 2026
As 2026 progresses, Aptos is not in a momentum phase yet, it is in a rebuilding phase, where the market is slowly trying to shift from weakness into stability. After months of decline, APT is now holding near the $0.90–$1.00 region, which is acting as a base. This zone matters because it is where selling pressure has started to fade, and buyers are quietly absorbing supply. These phases usually don’t look exciting, but they often set the foundation for the next big move.
For the structure to improve, the first real signal would be a move back above $1.30–$1.50. That’s the area where the last breakdown happened, so reclaiming it would indicate that the market is no longer in a purely bearish phase. If that happens, the next stretch comes around $2.20–$2.80, where price previously struggled to hold. This zone will likely act as the first real test, whether the move is just a bounce or the start of something bigger.
A stronger shift only comes into play if APT starts holding above $3–$5. That’s where the structure begins to look healthier, with higher lows forming and confidence returning gradually. Once this phase is established, the market typically moves faster, as sidelined buyers start stepping back in. In a broader bullish setup, especially if the overall crypto market supports risk assets, Aptos could extend its recovery toward the $10–$18 range by late 2026. This wouldn’t be a straight move, but rather a step-by-step reclaim of lost levels. On the flip side, if APT fails to hold the $0.90 zone, the recovery narrative weakens. In that case, the price could slip back toward $0.70–$0.80, delaying the entire rebuilding process.
Overall, 2026 for Aptos looks less like a breakout year and more like a year of structure repair, and how well it reclaims key levels will decide how far it can actually go.
Recent Developments / Catalysts For Aptos
Introduction of tokenomics adjustments, including fee burn mechanisms, aimed at improving long-term supply dynamics.
Expansion of institutional-grade trading access, increasing liquidity and broader market participation.
Continued ecosystem growth across DeFi and applications, supporting real network usage and on-chain activity.
Aptos Crypto Price Prediction 2026 – 2030
Year
Potential Low ($)
Potential Average ($
Potential High ($)
2026
10.00
18.00
30.00
2027
13.00
25.00
40.00
2028
20.00
35.00
50.00
2029
24.00
40.00
58.00
2030
36.00
50.00
60.00
Aptos (APT) Price Prediction 2026
The Aptos price range in 2026 is expected to be between $10.00 and $30.00.
Aptos Coin Price Prediction 2027
Aptos could trade between $13.00 and $40.00 in 2027
Aptos (APT) Price Prediction 2028
In 2028, Aptos is forecasted to potentially reach a low price of $20.00. and a high price of $50.00.
APT Price Prediction 2029
Thereafter, the Aptos price for the year 2029 could range between $24.00 and $58.00.
Aptos Price Prediction 2030
Finally, in 2030, the price of Aptos is predicted to maintain a steady positive. It may trade between $36.00 and $60.00.
Based on the historic data and trend analysis of the cryptocurrency along with the market sentiments, here are the possible Aptos price targets for the longer time frames.
Year
Potential Low ($)
Potential Average ($)
Potential High ($)
2031
40.00
60.00
80.00
2032
45.00
78.00
97.00
2033
52.00
88.00
120.00
2040
80.00
120.00
200.00
2050
150.00
250.00
400.00
Aptos Price Prediction: Market Analysis?
Year
2026
2027
2030
Changelly
$26.80
$44.00
$55.00
DigitalCoinPrice
$33.00
$56.00
$68.00
WalletInvestor
$30.00
$45.00
$50.00
Never Miss a Beat in the Crypto World!
Stay ahead with breaking news, expert analysis, and real-time updates on the latest trends in Bitcoin, altcoins, DeFi, NFTs, and more.
FAQs
What is Aptos (APT) and what makes it different from other blockchains?
Aptos is a Layer-1 blockchain built for speed and security, using the Move language to support scalable, low-latency decentralized applications.
What is the Aptos price prediction for 2026?
APT price forecasts for 2026 range between $10 and $30, depending on market conditions, adoption growth, and overall crypto cycle momentum.
Can Aptos (APT) reach $65 by 2030?
APT could approach $70 by 2030 if network usage grows steadily, developers continue building, and broader crypto markets remain supportive.
Is Aptos a good long-term investment?
Aptos shows long-term potential due to strong technology and scalability, but like all crypto assets, it carries risk and requires careful evaluation.
Why has Aptos price remained under pressure in recent years?
APT faced price pressure from early speculation cooling, token unlocks, and weak market sentiment, leading to prolonged consolidation phases.
The AVAX price prediction is flipping bullish as institutional money pours into Avalanche through the new Bitwise spot ETF, with combined Bitcoin and Ethereum funds pulling $791 million on April 17.
That kind of inflow tells you the bull cycle is real for major cap tokens, yet those valuations compound slowly, month by month, in single and double digit percentages rather than the multiples an early position can deliver. The sharpest wallets treat AVAX as the dip buy, ride the institutional ETF cycle, then funnel excess capital into earlier projects where real multipliers still live.
Floki ran the exact same playbook before its ticker was famous, and Pepeto is running it again today at $0.0000001865, with $9.29 million raised and the Binance listing approaching fast.
AVAX Price Prediction Backdrop as Bitwise ETF Capital Hits NYSE and Bitcoin Reclaims $75,000
Bitwise launched the spot Avalanche ETF (BAVA) on NYSE Arca on April 15 with the first month fee waived on the initial $500 million, according to Invezz. VanEck and Grayscale AVAX ETFs went live earlier in the year, and Bitcoin reclaimed $75,000 this week on ceasefire optimism around the Strait of Hormuz and rising ETF demand according to CoinDesk.
The setup is bullish from here, but the wallets compounding the biggest gains this cycle are not waiting for AVAX to grind from $9 back toward $20. They are entering presale stages most of the market still has not found.
AVAX Price Prediction and the Early Project That Could Outrun Every Large Cap Recovery
Avalanche (AVAX) Price Prediction at $9.20 as Three Spot ETFs Compete for Flow
The AVAX price prediction for 2026 stays constructive after the rejection at $13.50 earlier this month. Avalanche (AVAX) trades at $9.20 with RSI near 50 and price sitting inside a multi year descending triangle according to CoinMarketCap.
Analyst reports on Coingape flag a weekly bullish engulfing candle with a first target near $11.14 and longer dated potential back toward the $144.96 all time high. Daily network transactions climbed above 3.6 million this month, and on April 18 Circle launched the native USDC bridge on Avalanche C-Chain.
From $9.20, the $11 target is a 22% move over several months. Respectable for a portfolio leg, not the multiples a well positioned presale can turn.
Pepeto: The Wallet Pick Analysts Flag Before the Listing Opens
The AVAX price prediction may take the rest of the year to play out. $9 to $11 is a 22% path over several months. This is precisely why Pepeto fits a completely different equation.
Three pieces of infrastructure separate Pepeto from everything else in its bracket. PepetoSwap handles trades at zero cost. Cross-chain routing across Ethereum, BNB Chain, and Solana happens through a native bridge that does not chip into position size.
A contract risk scorer screens for exploit signatures before public money is exposed, and SolidProof signed off on every deployment. The team behind the build matters just as much. The same cofounder who grew the original Pepe into a $7 billion cap runs the project, a senior engineer out of Binance owns the exchange architecture, and 180% APY staking tightens float while the listing approaches.
This listing event could go massive, and the live utility guarantees Pepeto is not a single session wick but a venue traders end up using every day. AVAX from $9.20 does not produce this math. With $9.29 million committed and the Binance listing on the horizon, presale pricing is closing with every round that fills.
Conclusion
The AVAX price prediction is flipping decisively bullish and the dip is a buying window for Avalanche holders. The broader market confirms capital is rotating back into risk. But the wallets building the most aggressive portfolios of this cycle are simultaneously stacking presale positions in Pepeto right now, because a project with a live exchange, the original Pepe architect behind it, a Binance alum on the build, and surging demand at presale pricing is exactly the kind of setup that produced the legendary returns crypto generated in 2021.
Presale buyers who got into the original Pepe walked away with life-changing money, and nearly all of them wish their allocation had been bigger. Pepeto offers a near-identical entry with sharper tools, a clean audit, and a listing locked in. Entries are happening now through the Pepeto official website. 2026 is the year being early changes your life.
The AVAX price prediction for 2026 points to targets near $11.14 by mid year with longer dated potential back toward the $144.96 all time high if the market clears the $13.50 breakout line. Avalanche (AVAX) trades at $9.20 today, so the base case is a 22% move, not the multiples presale entries can produce.
Why is Pepeto the whale pick before the Binance listing?
Pepeto is the whale pick before the Binance listing because it pairs a live zero fee exchange across three chains with a SolidProof audit, 180% APY staking, and the same builder who launched the original Pepe leading the project. Presale price sits at $0.0000001865 with over $9.29 million raised on the Pepeto official website.
In a recent Onchain Economy episode, Michael Arrington doubled down on a long-standing belief that XRP has been misunderstood for years. He pointed out that critics labeling it a “banking coin” missed the bigger picture, arguing that XRP is actually a foundational part of the crypto ecosystem.
“Ripple and XRP have been completely misunderstood in the last decade. Skeptics of XRP would call it the corporate coin, the banking coin.”
Arrington also reflected on entering XRP early in 2017, during the ICO boom, when it traded between $0.03 and $0.05, well before most institutional narratives formed.
Ripple’s Execution Sets It Apart
A major theme in his analysis is Ripple’s consistency. He credited Chris Larson for the original vision and Brad Garlinghouse for executing it over time. Unlike most crypto projects that faded after the ICO era, Ripple continued building through acquisitions and product expansion.
He stresses that this mission-driven approach is what makes Ripple stand out in an industry where many projects have failed to deliver.
Stablecoin Push Could Fuel Growth
Arrington highlighted Ripple’s stablecoin strategy as a trigger catalyst. According to him, this move makes it “inevitable” that more startups will begin building within the XRP ecosystem, similar to how early internet infrastructure attracted developers.
This aligns closely with the earlier breakdown; both point to stablecoins as a growth driver rather than a threat to XRP’s relevance.
Fixing Crypto’s Infrastructure Gap
Another critical point is infrastructure. Arrington stressed that crypto still lacks the advanced tools available in traditional finance, especially for institutional players.
Ripple’s push into prime brokerage (Ripple Prime) was shown as a major step. He said that it was a missing backbone for crypto markets, something that exists in traditional finance but is still underdeveloped in crypto.
Validation: Same Narrative, Stronger Conviction
Overall, his views are focused on XRP’s misunderstood narrative, Ripple’s execution, and the importance of infrastructure and stablecoins.
Arrington concluded in a note that if Ripple continues executing, there may be no upper limit to how big the XRP ecosystem can become.
The Coinbase Independent Quantum Advisory Council has published a blockchain and quantum position paper, detailing the risks that quantum computers pose to cryptographic systems, as well as possible preventive measures ahead of Q-Day.
The board consists of researchers from the Ethereum Foundation, Stanford, UT Austin, Eigen Labs, Bar-Ilan University, and UC Santa Barbara.
The team acknowledges the current absence of a quantum computer, but that its existence may very well be a reality in the next decade.
For this reason, the team urges immediate preparation for quantum threats across all cryptographic ecosystems, including blockchains, exchanges, wallets, and even hardware:
“The time to start preparing is now, not when it’s urgent.”
Quantum risks to crypto
According to the team, cryptocurrencies are unequally vulnerable to quantum-computer breaches, with wallets bearing the greatest risk due to public key exposure.
While Bitcoin’s infrastructure is touted as “largely safe,” 6.9 million BTC fall in the above-mentioned wallet cohort.
Proof-of-stake chains’ weakness lies in their validator signature schemes, but Ethereum already has a roadmap to eliminate this issue.
Deployment challenges
After two decades of research, the US National Institute of Standards and Technology (NIST) has released several crypto-native quantum-resistant standards.
However, their adoption has proved challenging because quantum-safe signatures are inherently data-intensive. This increases transaction costs, reduces throughput, and demands higher storage.
A greater challenge is coordinating the migration of millions of wallets to quantum-proof systems.
An even greater challenge is promptly deciding what to do with the assets left behind during an upgrade. Will they be frozen, revoked, or just left at the mercy of quantum computers?
Current developments
At the moment, Bitcoin and Ethereum have proposed quantum-safe upgrades, with the latter’s plan also improving scalability.
Solana, Algorand, and Aptos are offering quantum-resistant options to users, and Layer 2 networks like Optimism have already announced deadlines for these transitions.
Meanwhile, Coinbase is developing flexible systems that can accommodate new cryptographic standards while fostering migration to the post-quantum era.
US Federal Reserve Chair nominee Kevin Warsh answered several questions today regarding cryptocurrencies, monetary policy, and the Fed’s independence during his Senate Banking Committee confirmation hearing.
Senate grills Warsh on cryptocurrencies
During the nearly 3-hour public session, pro-crypto Senator Cynthia Lummis questioned whether digital assets should be incorporated into the financial system to give Americans more investment options and consumer protections. Warsh’s response was this:
“Digital assets are already part of the fabric of our financial industry, so yes.”
This statement has widely been interpreted as crypto-advocacy rather than a hostile stance.
Aside from that, Warsh’s financial disclosures previously revealed a $100 million crypto portfolio. He has stakes in Solana, dYdX, Bitwise, Flashnet, and 20 other crypto projects.
On this point, senators raised concerns about potential conflicts of interest in crypto policy formation. His response was a commitment to divest the majority of his financial assets before being sworn in.
Fed independence
Senator Elizabeth Warren questioned Warsh regarding Fed independence, to which he emphasized that he would not be Trump’s “sock puppet,” despite receiving the President’s public endorsement for the position.
As for the Fed’s operations, he called for “a new and different inflation framework,” with less premature Fed commentary regarding interest rates.
What next?
Warsh now awaits written follow-up questions from senators, with his response due April 23.
Afterward, there will be a committee vote on advancing the nomination, followed by a full Senate vote. The timing of these last two events remains uncertain due to the prevailing Department of Justice (DoJ) probe into the Fed’s $2.5 billion headquarters renovation. They may, however, take place before the end of Jerome Powell’s 8-year term on May 15, 2026.
Crypto market reaction
Crypto markets experienced little downward pressure, with the overall market cap down 0.25% to $2.54 trillion. Bitcoin dropped 1% over the last 24 hours, trading at $75,451.
Crypto news today centers on two moves that reshape how traders think about timing. Strategy spent $2.54 billion on 34,164 Bitcoin in its third-largest purchase on record, while Solana crossed $1.1 trillion in quarterly economic activity for the first time ever. BTC trades at $75,742 on April 20.
SOL holds $85.58. But a sharper opportunity is forming below the large cap radar. Pepeto at $0.0000001865 does not need quarterly reports or corporate treasury timing because the Binance listing is the catalyst, not the calendar. The presale has pulled in $9.29 million.
Strategy Loads 34,164 BTC While Solana Breaks Its Own Records
Strategy funded the buy through STRC preferred stock and common equity, pushing its total Bitcoin position past 810,000 BTC. The purchase landed while BTC sat below $76,000 after a 2.5% pullback from U.S.-Iran tensions.
The crypto news today confirms the firm buys when headlines turn negative and holds through recovery.
Solana recorded $1.1 trillion in quarterly volume according to Artemis data. Weekly DEX activity on Solana hit $11.49 billion, passing Ethereum’s $7.62 billion in April for the first time.
Goldman Sachs holds $108 million in SOL ETFs, and total SOL fund assets sit above $1 billion. BTC ETFs added $996 million in weekly inflows. The crypto news today shows institutional capital flowing into both assets, but the largest percentage returns still sit at presale level.
Bitcoin, Solana, Pepeto, and the Crypto News Today That Points to Presale
Bitcoin (BTC) Price at $75,742 as Strategy Buys Third-Largest Haul
Bitcoin (BTC) trades at $75,742 after pulling back from a Friday high near $78,000 per CoinMarketCap. Support sits at $73,800 with resistance at $76,000 where the mid-March rally reversed.
Strategy now holds over 810,000 BTC worth more than $60 billion, making it the largest corporate holder of Bitcoin on the planet. BTC ETF inflows hit $996 million for the week, and the Fear and Greed Index flipped back toward greed for the first time since March.
A close above $76,000 opens $82,000 by end of April according to CoinDCX. But a 10% gain from here gives holders a single-digit monthly return, not the kind of math that rewrites portfolios.
Solana (SOL) Price at $85.58 as DEX Volume Tops Ethereum
Solana (SOL) holds $85.58, up 3% weekly as DEX volume and ETF inflows both climbed. The Alpenglow upgrade targeting 150-millisecond finality stays on track for late 2026, which would make Solana the first blockchain to match Visa’s authorization speed.
Stablecoin supply on the network grew 15 times since January 2025 to $3.8 billion. Resistance sits at $97, and a confirmed close above opens $116 according to Coinpedia.
Analysts project 2x to 3x for Solana this cycle, strong for a $49 billion market cap but far from the multiples that early presale entry creates. The crypto news today makes that gap between large cap returns and presale returns impossible to ignore.
Pepeto Presale Crosses $9.29 Million With Working Tools
A different entry is forming while corporate treasuries move billions into established coins. Pepeto crossed $9.29 million with a full exchange taking shape across Ethereum, BNB Chain, and Solana. PepetoSwap handles trades at zero fees so nothing is lost to platform costs on any swap.
The cross-chain bridge sends tokens between networks without gas charges, delivering every dollar whole. The AI contract scanner reads each token for risks before a buyer puts a single dollar in.
Staking at 180% APY grows positions daily while the window stays open. SolidProof completed the audit, and a cofounder who helped build the original Pepe to $7 billion leads alongside a former Binance executive.
The CoinMarketCap preview page went live, the step that has come right before every major listing since 2021. SHIB went from fractions of a cent to a $40 billion peak while institutions debated Bitcoin’s direction. Pepeto at $0.0000001865 with verified tools and a confirmed Binance listing follows that same pattern.
Conclusion
The crypto news today shows Strategy buying Bitcoin by the billions and Solana printing its strongest quarter ever, but neither gives a new buyer the return that presale positioning creates before a listing fires.
Pepeto at $0.0000001865 with $9.29 million raised, 180% staking, three working products, and a confirmed Binance listing sits where DOGE and SHIB sat before they delivered life-changing returns, and the stages that remain open today are the last chance to lock in this price before the exchange goes live and this entry becomes a number people share with regret.
What is the biggest crypto news today about Bitcoin and Strategy?
Strategy bought 34,164 Bitcoin for $2.54 billion in its third-largest single purchase, pushing total holdings past 810,000 BTC. Bitcoin trades at $75,742 on April 20 with $996 million in weekly ETF inflows supporting the price.
What is Pepeto, and why does it stand out in the crypto news today?
Pepeto is a meme coin presale at $0.0000001865 that raised $9.29 million with a zero-fee exchange, cross-chain bridge, AI contract scanner, and 180% APY staking already running. SolidProof audited the contracts and a Pepe ecosystem cofounder leads the project toward a confirmed Binance listing.
Ethereum price is trading at $2,307 with a modest rise of only 0.17% in the past 24 hours, while the volume decreases by nearly 19.5%, dropping below $16 billion. The second-largest token is showing some signs of recovery, but the underlying data raises caution. While price has rebounded from recent lows and is attempting to push higher, on-chain activity remains inconsistent, raising questions about the strength of the current move.
This creates a divergence between ETH price action and network demand, often a key signal of a fragile trend.
Ethereum Active Addresses Show No Real Growth
Active addresses are one of the important indicators that measure the growth of the platform. On-chain data from Cryptoquant reveals that Ethereum’s active addresses remain volatile without a clear upward trend. While there are periodic spikes in activity, these surges fail to sustain, indicating that user engagement is not expanding meaningfully.
This divergence is pretty vital, as strong upswings are usually backed by consistent growth in network activity, but not isolated spikes. The current data suggests that while the network is stable, it is not attracting enough new demand to justify a sustained uptrend. In simple terms, usage is holding—but not growing.
ETH Price Faces Resistance Within Rising Channel
From a technical perspective, Ethereum is trading within an ascending channel, forming higher lows but struggling near key resistance. The price has repeatedly tested the upper boundary around the $2,400 region, where selling pressure continues to emerge.
The recent push higher lacks follow-through, suggesting that buyers are not aggressively stepping in at higher levels. This keeps the move in the category of a relief rally rather than a confirmed breakout, with the broader structure still in a corrective phase.
Momentum indicators also hint at slowing strength, with MACD heading for a bearish crossover, while the Gaussian channel remains bullish. This is a key divergence signal where the price is attempting to move higher without on-chain demand or technical confirmation. Therefore, the Ethereum price rally appears to be driven by liquidity rather than real accumulation, where the breakouts are not considered sustainable.
Key Price Levels That May Define the Next Move
Ethereum price is sitting at a critical turning point where structure, momentum, and demand are all misaligned, making the next move highly reactive to key levels. If ETH manages to reclaim and hold above the $2,400–$2,450 resistance zone with strong follow-through, it opens the path toward $2,750 and potentially a retest of $3,000, where broader trend continuation can take shape.
However, failure to break this region keeps the move corrective, and a rejection here increases the probability of a pullback toward $2,100, with a deeper sweep into the $1,900–$2,000 demand zone if selling pressure accelerates. Until resistance is flipped into support with conviction, the structure favors a fragile upside with downside risk still firmly in play.
The BNB price stands at $627 while $13.21 billion drained from DeFi lending protocols in 48 hours, and exchange tokens backed by real infrastructure held better than the platforms that froze withdrawals over the weekend.
But a sharper opportunity is forming at presale level. BTC needs months to reach $85,000, and BNB needs a full bull cycle for $1,000. Pepeto with $9.29M raised and a confirmed Binance listing can grow by multiples from one event.
DeFi TVL Crashes $13.21 Billion in 48 Hours While BNB Chain Prepares Osaka Hard Fork for April 28
CoinDesk reported that total DeFi value locked fell from $99.5 billion to $86.3 billion following the Kelp DAO exploit, with Aave alone losing $8.45 billion as depositors fled. Yahoo Finance confirmed BNB Chain’s Osaka/Mendel hard fork activates on April 28 with nine protocol upgrades targeting faster finality.
When DeFi crumbles and BNB Chain keeps building, the BNB price benefits from crypto’s strongest exchange network, but presale entries capture returns that $627 tokens cannot deliver.
BNB Price, Pepeto, and the Top Altcoins During the DeFi Reset
Pepeto: Where Exchange Infrastructure Already Runs While DeFi Rebuilds
Institutions buy the safest assets first, which caps the explosive gains early investors once captured. That is why $9.29M entered Pepeto at presale pricing while DeFi platforms froze markets.
The cross-chain bridge connecting Ethereum, BNB Chain, and Solana moves assets without gas fees and without the bridge layers that just cost DeFi $13 billion. The zero-fee engine protects every position from trading costs, and the contract scanner checks tokens for hidden dangers before capital commits.
SolidProof audited every contract before the presale opened, and the cofounder who built Pepe from zero to $11 billion leads the team alongside a former Binance executive. The CoinMarketCap preview page is live, following the same sequence that came before every recent Binance debut. Staking pays 180% APY on positions that grow daily while BNB price holders wait for $1,000.
Bitcoin (BTC) Price at $75,600 as Strategy Holds 780,897 BTC
Bitcoin (BTC) holds near $75,600 according to CoinMarketCap with Strategy adding $1 billion in purchases last week, total holdings at 780,897 BTC. Resistance sits at $77,000 with support at $71,500.
At $1.4 trillion market cap, $85,000 is 15% that takes months, and the BNB price tracks Bitcoin closely enough that both need patience.
BNB (BNB) Price at $627 as Osaka Hard Fork Targets Faster Finality
BNB (BNB) trades at $627 according to CoinMarketCap, down 55% from its October 2025 all-time high of $1,370 but holding $600 support. The 35th quarterly burn removed 1.57 million BNB worth over $1 billion on April 15, cutting supply to 134.79 million.
The BNB price needs the Osaka/Mendel fork on April 28 and broader recovery before $1,000 becomes realistic, while Pepeto targets 100x from one listing.
Cardano (ADA) Price at $0.47 as Protocol v11 Approaches
Cardano (ADA) trades near $0.47 with CME Futures interest building and Protocol v11 approaching.
Even $1.00 is 113% needing multiple catalysts, and ADA spent most of 2026 stuck in a range while the BNB price moved on stronger fundamentals.
Solana (SOL) Price at $85 as Stablecoin Volume Grows 15x
Solana (SOL) trades at $85 according to CoinMarketCap, down 58% from its cycle high despite stablecoin volume growing 15 times to $3.8 billion.
ETF inflows passed $1 billion, but SOL needs Bitcoin to recover first, and $200 is 141% that depends on rotation timing.
Conclusion
Bitcoin holds $75,600 with Strategy still buying, but 15% returns take months at that market cap. The BNB price at $627 has the Osaka fork and quarterly burns working in its favour, but needs a full cycle to touch $1,000. Cardano at $0.47 waits for catalysts that keep getting pushed back. Solana at $85 needs Bitcoin to move first.
The BNB price at $627 carries strong fundamentals, but the story people forget is what happened to wallets that bought BNB during the original Binance presale at $0.15 in 2017. A $1,000 position at presale turned into over $9 million at the all-time high, and that return came from one exchange listing followed by the growth of the platform underneath. The BNB price history proved that presale entries on exchange tokens produce the kind of wealth that post-listing buyers spend years chasing from prices ten thousand percent higher.
Pepeto follows the same exchange model at an even earlier stage. The presale sits at $0.0000001865 with $9.29M raised, a SolidProof audit, 180% staking yield, a working zero-fee exchange, and a confirmed Binance listing that needs one event to reprice everything. The cofounder who built Pepe to $11 billion and a former Binance executive are building the infrastructure, and the wallets entering now are positioning for the same return that turned BNB presale buyers into millionaires. Every stage that fills is supply post-listing buyers will never access at this price, and the listing date could arrive any day.
What is the BNB price prediction after the Osaka hard fork?
BNB (BNB) trades at $627 with the Osaka/Mendel hard fork activating on April 28 to improve network speed and finality. The 35th quarterly burn removed over $1 billion in supply, supporting long-term price growth toward the $1,000 level.
Why is Pepeto considered a better entry than large cap coins during this market?
Pepeto is a presale at $0.0000001865 with a confirmed Binance listing, live exchange tools, SolidProof audit, and 180% APY that targets 100x from one event. Large caps like BNB, BTC, and SOL need months of recovery for returns Pepeto can deliver from a single listing.
The XRP price gained 7.15% this week and turned April into the strongest month for Ripple holders since September 2025, beating Bitcoin and Ethereum while the broader market stayed flat. Ripple’s partnership with Kyobo Life to pilot Korea’s first tokenized government bond settlement added real demand behind the numbers, and the rally brought XRP back above $1.43 after months of testing lower levels.
A different opportunity is building below the large cap radar. Pepeto crossed $9.29M raised at presale pricing that the open market will never offer again, and the confirmed Binance listing turns every dollar entered today into a position that analysts say could return 50x to 100x, returns the XRP price cannot produce from $1.43.
Ripple (XRP) Posts Best Weekly Rally of 2026 as Kyobo Life Tokenized Bond Deal Goes Live
Yahoo Finance reported that April 2026 is shaping up as XRP’s best month since September 2025, with the token gaining roughly 7.15% in one week while outpacing every major cryptocurrency.
CoinDesk confirmed that Ripple partnered with Kyobo Life on April 15 to launch Korea’s first tokenized government bond settlement through Ripple Custody, opening stablecoin payment rails for the country’s largest life insurer.
When the XRP price breaks through resistance on real partnership news and record ETF inflows, every presale entry with a confirmed exchange listing benefits from the same wave of capital rotating into crypto.
XRP Price, Pepeto, and the Presale Entry That Outpaces Large Cap Returns
Pepeto Presale Crosses $9.29M as Exchange Tools Process Live Volume
Ripple’s rally proves that crypto still rewards patient holders, but the XRP price at $80 billion market value needs months to deliver returns that presale entries can produce from a single listing. Pepeto already collected $9.29M from wallets that entered at $0.0000001865, a price point six decimal places away from where meme coins trade after their first exchange day.
The team behind this presale includes the cofounder who built the original Pepe token from nothing to an $11 billion market cap, and a former Binance executive who shaped the exchange listing process from the inside. SolidProof ran a full independent audit on every contract before the presale opened, and every line of code passed without findings. PepetoSwap already processes trades across Ethereum, BNB Chain, and Solana with zero fees, meaning the exchange does not take a cut from your position when you move between chains.
The AI contract scanner grades any token for hidden risks before your capital touches it. Both tools run on a live platform today, and 420 trillion tokens match the supply structure that powered Pepe from zero to billions. The CoinMarketCap preview page went live, confirming the listing path that preceded every major Binance debut.
Holders who staked before the listing earn 180% annual yield on positions that keep growing while the XRP price needs $2.80 just to double. The Binance listing date could drop any day, and once it does, six decimal zeros turn into a price that early wallets calculated months ago. The presale adds capital faster each round because the wallets inside are not guessing, they ran the numbers, and the math only works at this entry.
Ripple (XRP) Price at $1.43 as April Rally Tests $1.45 Resistance
Ripple (XRP) trades at $1.43 according to CoinMarketCap, up 7.15% on the week and pressing against the $1.45 resistance that rejected every rally in 2026.
Around 36.8 billion XRP sits at a $1.44 cost basis, which means millions of wallets are waiting to sell into any break above that level. Kyobo Life and Rakuten partnerships add real use, but Standard Chartered cut its 2026 XRP price target from $8 to $2.80, and even that number needs months of patience and clean macro conditions.
The XRP price at $85 billion market cap needs $8 just to return 5.6x over the full year, while Pepeto at presale pricing targets 100x from one confirmed exchange event.
Conclusion
The XRP price rally confirms that April 2026 is delivering for holders who waited through six straight losing months, and the Kyobo Life partnership brings Ripple closer to the payment rails it promised for years. But the XRP price path from $1.43 to $2.80 is measured in quarters, not days.
Pepeto at $0.0000001865 with $9.29M raised, a SolidProof audit, 180% staking yield, and a confirmed Binance listing offers the kind of entry where one event changes the math completely, and the presale rounds are filling faster because the wallets inside already know that the XRP price recovery and presale timing are not the same trade.
Ripple (XRP) trades at $1.43 and faces strong resistance at $1.45 where 36.8 billion tokens sit at breakeven. Standard Chartered targets $2.80 for 2026, down from a previous $8 forecast.
Why is Pepeto considered a stronger entry than large cap coins right now?
Pepeto is a presale at $0.0000001865 with a confirmed Binance listing, SolidProof audit, and 180% staking APY that targets 100x from one exchange event. The presale raised $9.29M and rounds close faster each stage.
The Pepe coin price prediction is heating up after Canary Capital filed the first spot PEPE ETF with the SEC on April 8, a move that brought institutional eyes to a meme token at a level never seen before, according to The Block. But the filing alone did not move the price, and that gap between attention and action tells you everything about where PEPE sits right now.
The builder who turned Pepe from a joke into an $11 billion token on 420 trillion coins is now behind Pepeto with a former Binance executive steering the launch, the same supply count, the same viral energy, and a live exchange the original never shipped. The earliest Pepe wallets from April 2023 turned $1,000 into six figures as the token ripped over 7,000% in 30 days on pure meme force.
Pepe Coin Price Prediction Stalls as ETF Buzz Fades and Sellers Take Over
The PEPE ETF filing landed flat. PEPE dropped 4.58% the next day and has not recovered, sitting at $0.0000037 with a market cap around $1.58 billion according to CoinMarketCap. On-chain data shows $2.73 million in PEPE sold in 24 hours while whale wallets stacked 1.23 trillion tokens, a mixed signal that keeps traders guessing.
Even if the SEC approves it, Dogecoin’s example shows meme ETFs bring tiny inflows. Grayscale’s DOGE ETF pulled just $1.4 million on day one against expectations of $12 million. The Pepe coin price prediction runs into the same wall: a token at $1.58 billion with no revenue and a recovery path that caps out around 7x to the all-time high.
Pepe Coin, Pepeto, and the Builder Behind Both Tokens
Pepeto: The Exchange Presale From the Builder Who Already Hit $11 Billion
Pepeto is not another meme presale riding hype into a listing. It is the presale backed by the deepest product build from a founder who already proved what happens when meme energy meets the right moment, and this time real tools sit behind the launch.
The exchange runs on Ethereum with a risk scoring engine that flags bad contracts before your wallet connects, catching hidden ownership traps and liquidity pulls that most traders only spot after the damage is done. PepetoSwap handles every trade at zero cost, and the cross-chain bridge links ETH, BNB, and Solana without charging a cent.
Over $9.29 million raised with wallet counts climbing every round, a former Binance executive guiding the listing path, and SolidProof verifying every contract before the presale took its first dollar. Staking at 181% APY already grows positions while everyone else watches Pepe coin price prediction charts, waiting for a bounce that keeps stalling.
At $0.0000001865 with the same 420 trillion supply, reaching what Pepe hit with nothing equals over 150x, and the exchange turns that peak into a floor. But this window closes the moment the Binance listing arrives, and each round sells out faster than the one before.
Pepe (PEPE) Price at $0.0000037 as ETF Filing Fails to Spark Recovery
PEPE trades near $0.0000037 according to CoinMarketCap, roughly 86% below its December 2024 all-time high of $0.00002803, holding a $1.58 billion market cap. The 50-day EMA sits near $0.0000040, about 3% above spot.
Reaching the all-time high works out to roughly 7.2x, a decent hold but not the kind of return that reshapes a portfolio. At $0.0000037 targeting $0.00002803 over years, the Pepe coin price prediction math pales next to Pepeto at 150x from presale to that same peak.
Final Takeaway
The Pepe coin price prediction proved what the data already showed: PEPE delivered its biggest returns years ago when it climbed past $11 billion on pure meme force with nothing built underneath, and the ETF filing changed the headline but not the chart.
The same builder now runs Pepeto with that same energy, only this time a working exchange backs every token, and in a cycle where crypto draws record institutional capital, this presale carries every reason to push further than the original.
Whale wallets see it, which is why they keep entering while the rest of the market debates the Pepe coin price prediction and waits for a recovery that keeps fading. Not entering Pepeto at the presale most likely means buying after the listing at whatever level those whales decide to sell, the same pattern that turned late PEPE and Shiba Inu arrivals into spectators who spent the remainder of that run regretting they waited too long.
What does the Pepe coin price prediction for 2026 look like compared to Pepeto?
PEPE at $0.0000037 needs a full recovery to its all-time high to deliver 7.2x. Pepeto at presale entry carries over 150x to that same market cap with a working exchange and confirmed Binance listing.
What is Pepeto and why are whale wallets buying it during the PEPE ETF hype?
Pepeto is a zero-fee exchange presale built by the same founder who created the original Pepe coin. Whales enter because $0.0000001865 offers 150x to a market cap that builder already reached.
XRP price is up 1.33% over the past 24 hours, trading near $1.44, largely tracking the broader market move and showing strong positive beta with Bitcoin. However, this upside remains reactive rather than structural, with price continuing to respect key resistance levels. Since the start of the month, XRP has largely moved sideways, failing to establish higher highs despite multiple attempts to break out.
This lack of follow-through highlights a market driven by external momentum rather than internal strength. Buyers are active, but not aggressive enough to reclaim supply zones, keeping the price capped below resistance. As a result, XRP remains in a range-bound structure with a bearish tilt, where rallies are being sold into rather than sustained.
Is XRP Price Losing the Momentum?
The daily chart highlights a clear range-bound structure, with XRP price trading between a well-defined resistance near $1.45 and support around $1.05. Price action has repeatedly tested the upper boundary but failed to sustain a breakout, reinforcing this zone as a strong supply area where sellers continue to dominate. The price continues to respect the descending trendline near the $1.48–$1.50 region, while the lower boundary is gradually rising from the $1.12 lows, creating a squeeze in price action.
From a structural standpoint, the XRP price is trading below the 0.236 Fibonacci level around $1.42, which is acting as immediate resistance. The inability to reclaim this level keeps the upside capped, while repeated rejections from the descending trendline reinforce seller dominance. Momentum indicators remain neutral to slightly weak, with RSI hovering near mid-levels and CMF showing limited inflows, indicating a lack of strong buying pressure.
This type of compression typically leads to expansion. However, given the prevailing trend and repeated resistance rejections, the probability currently leans toward a downside break. A loss of the rising support could accelerate the move toward the $1.12 region, while only a clean breakout above the descending resistance would invalidate the bearish bias and shift momentum in favor of the bulls.
Wrapping it Up—XRP at a Key Turning Point
XRP’s recent strength lacks conviction, with upside moves appearing reactive rather than driven by sustained demand. Until buyers show clear follow-through, the market remains vulnerable to another downside rotation. Hence, keeping the path below $1.20 active while a rise above $1.50 could push the price above $1.61.
Coinbase has suspended trading on 25 perpetual futures contracts and automatically settled all remaining open positions, citing an effort to maintain higher standards across its derivatives marketplace.
The affected contracts span a wide range of tokens including ENS, ORDI, RAY, STX, SNX, TRB, XTZ, 1000FLOKI and others. Each position was settled at a final price calculated as the average index price over the 60 minutes prior to suspension.
Selected settlement prices include ENS at $6.03 USDC, ORDI at $4.663 USDC, RAY at $0.665 USDC, STX at $0.2248 USDC and SNX at $0.29246 USDC. Smaller cap tokens settled at significantly lower values, with NEIRO settling at $0.0000827 USDC and BEAM at $0.001987 USDC.
Why Coinbase Is Cutting These Markets
Coinbase framed the suspensions as part of an ongoing quality control effort rather than a reaction to any specific market event.
“These suspensions reflect our ongoing effort to maintain high-quality derivatives markets by focusing on products that consistently meet our liquidity and market-quality standards,” the exchange said in a statement.
The platform added that streamlining the perpetual futures lineup allows it to focus resources on the contracts that see the most genuine usage while also accelerating its ability to bring new, higher-quality derivatives to market. Coinbase said it would be improving its listing speed over coming months by streamlining internal processes and using advanced evaluation frameworks.
“By maintaining these standards, we ensure our listings maintain price integrity, and provide users with deeper liquidity and better trading experiences,” they said.
The suspensions affect traders who held open positions across these contracts, all of which were closed automatically at the final settlement prices. Traders with positions in any of the 25 affected contracts should verify their settlement prices directly through their Coinbase account history.
Most beginners enter crypto because price moves look exciting. The problem starts when they trade without understanding risk. Perpetuals can move fast, and small mistakes get expensive quickly.
That is why readers who scan the best crypto presales often start asking better questions. They want to know how execution works, how losses are managed, and whether the platform gives users more control. TradeView enters that discussion as a top presale crypto project tied to an actual trading system, not just presale crypto tokens alone.
How Crypto Perps Work When You Focus On Safety First
Crypto perps let traders take long or short positions without owning the asset directly. That sounds simple, but the real challenge is controlling risk once leverage enters the trade. Position size, margin, liquidation level, and stop placement all matter before a trade is opened.
Safe trading usually starts with smaller leverage, clear entry rules, and a plan for exit. That matters when readers compare best crypto presales and other crypto coins on presale. A platform becomes easier to judge when it explains how traders can manage exposure instead of just highlighting speed or access. That is where structure matters most.
What TradeView’s Risk Controls Try To Address
TradeView places attention on execution visibility and risk control. It presents trading activity on-chain, which helps users see more of what happens between placing an order and seeing it settle. That matters because many traders worry less about tools and more about hidden execution once markets turn volatile.
The platform also frames itself around reducing blind spots in trading. For readers comparing presale tokens crypto, that makes a practical difference. A platform with clearer execution flow, visible order handling, and user-controlled custody is easier to study than one that only sells the story of a next 100x presale cryptocurrency without showing how trading actually works.
Latest TVX Presale Data for Liquidity and Market Growth
TVX is priced at $0.015 per token right now. The next stage increases that price to $0.02. These price points matter because presale tokens crypto usually move through phases, and each phase gives readers a clearer sense of timing.
TradeView also reports $180,173 raised in USDT so far. During this stage, 12,011,533 TVX tokens have been sold. For readers asking where to buy presale crypto, that offers a direct snapshot. It helps place the project within the wider field of best crypto presales in 2026. Clear sale data does not answer every question, but it gives the round a visible pace.
That makes this presale ICO crypto project easier to compare with other crypto coins on presale and other top presale coin launches in the current market. It also helps new readers understand whether the sale is still early or already moving into a later phase now.
How Risk Management And Execution Fit Together
Safe perp trading depends on more than a stop-loss. It depends on how clearly a platform shows exposure, how quickly orders move, and whether users keep control of their own assets. TradeView tries to frame all three together through on-chain settlement, visible trade flow, and non-custodial design.
That matters because many traders lose money through avoidable confusion, not just bad market calls. If margin levels, liquidation points, and order handling are easier to follow, the user has a better chance of making calm decisions.
It also gives more context than broad marketing language. In a market filled with presale crypto tokens and crypto coins on presale, useful execution details often say more than hype. They show how the platform behaves when pressure rises.
Final Thoughts On Safer Perp Trading
Trading crypto perps safely starts with understanding the system, not chasing speed. TradeView becomes easier to assess when readers focus on its execution model, visible trade flow, and risk-related structure. That matters when comparing best crypto presales, top presale crypto launches, presale tokens crypto, and other crypto coins on presale.
For users building a crypto presale list or researching a next big crypto presale, safety usually begins with transparency. In that sense, TradeView is most useful when studied as a platform first and a token second for new users.
Arthur Hayes does not waste words when he disagrees with a narrative. Asked whether crypto is becoming the backbone of a parallel financial system, given reports of Iran charging crypto tolls on oil tankers, Bitcoin entering nation-state financial conversations and XRP being discussed as cross-border settlement infrastructure, he gave a single sentence in response.
“When I see on-chain evidence that an institution is using XRP at scale then I will believe Ripple supporters,” he said in an interview with Coinpedia. On the Bitcoin toll specifically, Hayes applied the same standard. “I’ll believe Iran is charging a toll in Bitcoin when I see a transaction linked to a vessel’s toll payment,” he wrote on X. “Otherwise it’s just the IRGC trolling the western filthy fiat financial system.”
What the Financial Times Reported
The toll system, as described by Hamid Hosseini, a spokesman for Iran’s Oil, Gas and Petrochemical Products Exporters’ Union, requires tankers to email Iranian authorities with cargo details in advance. Once cleared, a toll of $1 per barrel is assessed, with empty tankers allowed free passage.
Payments must be made within seconds using Bitcoin, specifically chosen to avoid tracking or confiscation under international sanctions. The system is designed to remain functional regardless of what the traditional financial infrastructure does or does not permit.
Whether those transactions are actually occurring at scale and whether they are visible on-chain is precisely the question Hayes is asking.
The Broader Context
The question carries real weight given what is happening in global markets. Jim Rickards, who helped construct the petrodollar system in the 1970s, recently listed Ripple alongside Bitcoin and Tether as plausible currencies for Iran’s reported Strait of Hormuz toll collections.
The parallel financial system narrative is one of the most powerful long-term stories in crypto. Hayes is simply waiting for the ledger to confirm it.
Someone just gave the five most powerful AI models on earth one single task – predict what Bitcoin does next. The results were not what he expected.
YouTube analyst Jesse Eckel ran the experiment this week, asking Claude Opus 4.7, ChatGPT Pro, Grok Heavy, Gemini DeepThink and Grok 4.3 beta, a model locked behind a $300 per month subscription that most users cannot access, to each predict Bitcoin’s price at 30 days, 6 months and one year out.
Four Out of Five Think Bitcoin Goes Higher From Here
Only one model, Gemini DeepThink, predicted Bitcoin would be lower in six months, placing it at $65,000 by October. Every other model predicted either sideways or higher.
Grok Heavy, which checked 893 different sources in under two minutes to compile its answer, predicted $92,000 in six months and $118,000 by April 2027.
ChatGPT Pro was the most cautious of the group – $76,000 in 30 days, $80,000 in six months and $84,900 in one year.
Claude Opus 4.7 sat in the middle – $77,800 in 30 days and $98,000 in one year.
Then There Was Grok 4.3
Grok 4.3 beta, an entirely new pre-trained model, not a fine-tune of previous versions, was the outlier. Its one-year prediction was $210,000.
Its six-month prediction alone was $135,000. To be clear, that would mean Bitcoin nearly doubling from today’s price by October 2026.
Eckel noted that Grok 4.3 requires the highest subscription tier on Grok and was only released to early access users last week.
Average all five predictions and something interesting emerges.
Consensus: 30 days $77,000. Six months $91,000. One year $119,000.
That is a 55% move from today’s price by April 2027 and it comes from models that disagree significantly on the path to get there.
Eckel also shared his own Hidden State Engine model – a deep structural state model he says has had an “eerily good track record” over the past two months. Its one-year prediction: $128,000.
What This Means for Bitcoin Today
Most of these models reject the four-year cycle bear case – the thesis that Bitcoin should hit 30K to 40K lows by October 2026 before recovering.
Only Gemini’s prediction aligns with that view.
Whether AI can reliably predict crypto prices remains genuinely unknown. Eckel himself acknowledged that every model he has ever built has eventually failed. But when five of the most powerful systems on earth are pointed at the same question and four of them say the same thing – that is worth paying attention to.
Bitcoin is currently trading at $76,467, up 1.52% over the last 24 hours.
On April 20, Japan’s biggest financial institutions launched a trial to put Japanese Government Bonds on a blockchain.
Japan Securities Clearing Corporation, Mizuho Financial Group, Nomura Holdings and Digital Asset Holdings launched a proof-of-concept trial on the Canton Network on April 20 to test JGBs as digital collateral. The initiative was selected by Japan’s Financial Services Agency under its Payment Innovation Project in February 2026.
The goal is straightforward but significant. JGBs are among the highest quality collateral assets held by institutional investors globally. Right now they cannot move outside business hours. This trial tests whether that changes – 24/7 real-time collateral transfers, cross-border settlement, and full legal compatibility under Japan’s Book-Entry Transfer Act and Financial Instruments and Exchange Act.
“We believe that maintaining and strengthening the availability and liquidity of JGBs in the digital space is essential to the development of financial markets and the improvement of investor convenience,” JSCC said in its official statement.
JSCC and DTCC Both Chose the Same Blockchain
This is where the story gets bigger than Japan.
DTCC announced plans in December 2025 to tokenize US Treasuries on Canton – with production rollout targeted for 2026. JPMorgan announced in January 2026 that its JPM Coin deposit token will be issued natively on Canton.
And the JSCC-DTCC relationship is not new – in 2024 JSCC was the first institution to adopt DTCC’s Digital Launchpad for this exact collateral use case.
This is two of the world’s largest sovereign bond markets.
$26.4 Billion RWA Market Just Got Its Biggest Validation Yet
Tokenized US Treasuries already represent $12.88 billion on-chain as of early April 2026. The broader real-world asset market stands at $26.4 billion – up 380% from 2022. JGBs are not yet meaningfully represented in those figures.
This trial is the beginning of that changing.
If successful, the four participants said the outcome could significantly reduce administrative burdens around posting and substituting collateral – lowering costs for financial institutions and strengthening the international competitiveness of Japan’s financial markets.
No commercial rollout timeline has been announced. This is still a proof of concept.
But the direction is clear. Traditional finance is not experimenting with blockchain anymore. It is building the rails. And for the first time, the world’s two largest sovereign bond markets are pointing in the same direction.
TRON price looks bullish based on social feeds and rising stablecoins data, yet the chart just… shrugs. While headlines scream about rising stablecoin supply and Justin Sun’s decentralization claims, TRON price action is barely reacting, and honestly, that disconnect is getting hard to ignore. Because under the surface, things aren’t as clean as they seem.
TRON Price Ignores Bullish Narrative
Let’s start with the supposed bullish driver. The total supply of USDT on the TRON network just hit a fresh all-time high of $86.7 billion. On-chain logic says that’s a good thing more stablecoins usually mean more liquidity, more activity, more upside.
In theory. But here’s the kicker, TRON price hasn’t exactly taken off. Yes, buy volume is rising, and sure, the network looks active, but price isn’t reflecting that enthusiasm in any meaningful way. It’s moving up, but not with conviction. More like a cautious grind than a breakout.
And that usually tells you one thing: the market isn’t fully buying the narrative.
Security Moves Spark Debate Around Decentralization Claims
Now layer in the broader market context. The Arbitrum Security Council announced that they froze 30,766 ETH linked to an exploit, moving the funds to a secure intermediary wallet with governance control. The move was coordinated with law enforcement and executed without affecting users or chain state.
Efficient? Yes. Decentralized? Well… move raises doubts. Justin Sun raised voice on this and this is where things get spicy. In response, TRON’s founder doubled down, claiming TRON is the “most decentralized blockchain in the world.” Bold statement, especially when the market is actively watching how different chains handle crises.
Overbought Indicators Flash Warning For TRON Price
And right now, TRON price is sending mixed signals. On one hand, the Chaikin Money Flow (CMF) sits at 0.27, suggesting steady capital inflow. That’s not bearish. Not at all.
But then you look at the RSI hovering around 72.22 and suddenly things look a bit stretched. That’s firmly in overbought territory. Historically, that doesn’t end with immediate continuation. It ends with cooling.
Maybe even a pullback. So yeah, rising buy volume is there. Momentum is building. But the technicals are quietly hinting that this move might be running a little too hot, a little too fast.
TRON Price Faces Reality Beyond Bullish Headlines
So, what’s next? SInce TRON price isn’t weak, but it’s not convincing either. Not yet. The bullish narrative from USDT supply growth is real, but it hasn’t translated into explosive price action. At the same time, overbought indicators are flashing caution.
That’s not a breakout setup. That’s a hesitation phase. Until TRON price shows a decisive move backed by sustained momentum not just headlines alone, till then the market’s likely to stay skeptical. And in crypto, skepticism usually wins… at least in the short term.
Bitcoin isn’t breaking out. It’s stalling and dragging the entire altcoin market into a slow, frustrating freeze. While traders keep staring at sleepy charts or instance LINK stuck near $10, ALGO hovering around $0.15, SEI barely breathing at $0.05 and other altcoins are not doing any good either but the bigger story is unfolding quietly: a textbook Bitcoin bear flag tightening its grip. And, it’s not the kind of setup alt holders want to ignore.
Bitcoin Bear Flag Keeps Altcoins Completely Frozen
The first Bitcoin bear flag formed right after the explosive move to the $124k all-time high. Price peaked, rolled over hard followed by another flag, and now its in third flag that has been consolidating inside a rising channel since early Q1. Now here’s where it gets interesting.
In First flag the rejection came near $92k price hit the upper trendline, failed, and dumped all the way to $62k. Then came second flag. A bounce from $62k pushed price back toward $80k… only to get rejected again at the same resistance.
So yeah, we’re now staring at the third touch. And markets love symmetry and perhaps a fall may come again.
Third Rejection Could Trigger Altcoin Capitulation
Well, here’s the detail bear flags don’t usually end with fireworks. They end with continuation. That means if this third rejection plays out like the last two, downside isn’t just possible, it’s expected.
Measured move? Somewhere in the $52k to $56k range. And altcoins? They don’t get a free pass. Historically, every rejection in this structure has translated into sharp losses across majors. This time, projections suggest a potential 20% to 40% drop, with broader sentiment hinting at even deeper bleeding up to 50% in some weaker names. Not exactly the “altseason” everyone keeps tweeting about.
Breakout Or Breakdown Only Two Outcomes Remain
But let’s be fair it’s not all doom. There is another path. If all people are right and bulls do manage to defend current fall and top dog Bitcoin price breaks above the flag’s upper trendline with a strong daily close with no wicks, no fakeouts then the bearish structure may have the chance to get invalidated. That’s the trigger. That’s when things flip. And that’s when altcoins finally get breathing room after months of underperformance.
Simple, right? Well, not really. Because so far, every attempt to reclaim that resistance has failed. Cleanly. So, what’s next?
Bittensor may be entering one of its most important phases, yet the market is barely paying attention. While TAO continues to trade nearly 60% below its peak, a combination of institutional infrastructure, tightening supply, and shifting market structure is beginning to reshape its positioning. Price is no longer falling, sentiment remains muted, and capital is starting to move quietly beneath the surface.
The real question now isn’t why TAO price is down, it’s whether this quiet phase is where the next expansion is being built.
Institutional Access Expands With BitGo Integration
The latest shift comes from BitGo’s partnership with Yuma, introducing institutional-grade access to Bittensor subnet tokens. This allows clients to stake and trade subnet assets through a secure, unified platform, removing a major barrier for institutional capital.
A big moment for subnet tokens and meaningful step forward for institutional participation in Bittensor $TAOhttps://t.co/APcziR00g3
The significance lies in timing. Infrastructure is being built while TAO remains deeply discounted, suggesting early positioning rather than reactive participation. Historically, this sequence, where access improves before price, has often preceded capital inflows. At the same time, Bittensor’s subnet ecosystem continues to expand, approaching $1.5 billion in cumulative value. This steady growth highlights that network activity is progressing independently of price volatility.
TAO Price Holds Discount Zone as Structure Begins to Shift
TAO’s current structure reflects a transition rather than continued decline. After peaking near $767, the asset is now trading around $240–$250, holding firmly within the $236–$258 demand zone. This level has consistently absorbed selling pressure, indicating that downside momentum is weakening. Instead of trending lower, token price is stabilizing, suggesting that accumulation is gradually replacing distribution.
Momentum indicators support this shift. The Stochastic RSI remains in oversold territory, historically associated with accumulation phases. At the same time, moving averages are compressing, signaling reduced volatility and the potential for a directional move ahead. This is typically the phase where early capital positions, long before momentum becomes obvious.
However, confirmation remains critical. The $320–$383 range acts as the structural pivot. A breakout above this zone would signal a shift in market control and open the path toward higher levels.
Derivatives Data Signals Positioning Reset
Derivative metrics reinforce the same narrative. Funding rates remain low, reflecting the absence of aggressive long positioning, while open interest has stabilized after prior volatility.
This indicates that leverage has reset and speculative pressure has eased. Rather than chasing momentum, market participants appear to be rebuilding positions gradually. Such conditions often emerge during early-cycle phases, where positioning occurs quietly before broader participation returns.
Bittensor’s Fundamentals Strengthen the Narrative
Bittensor’s fundamental backdrop is evolving alongside its market structure. The first TAO halving has reduced block rewards by 50%, tightening supply dynamics at a time when price is already in a discount zone. The introduction of Dynamic TAO (dTAO) adds another layer of utility, enabling subnet-specific tokens and integrated liquidity mechanisms. This expands the network’s functionality and strengthens long-term demand drivers.
Institutional signals are also emerging. Exposure within AI-focused funds is increasing, while discussions around a potential ETF later in 2026 add a forward-looking catalyst. Notably, nearly 70% of TAO supply remains staked despite the drawdown, reflecting strong holder conviction and reinforcing the ongoing accumulation phase.
Outlook
TAO is not yet in a confirmed uptrend, but the conditions around it have clearly shifted. TAO price has stabilized, leverage has reset, and institutional infrastructure is expanding at a time when sentiment remains subdued. If TAO reclaims the $320–$383 zone, the structure transitions from accumulation to expansion. Until then, the current phase remains critical, where positioning builds quietly before the market begins to react.
While retail investors were panic-selling through one of the worst sentiment quarters in years, Bitcoin’s wealthiest holders were doing something very different. They were buying more.
Data from Xapo Bank’s Q1 2026 Digital Wealth Report shows average Bitcoin holdings per member rose 18.5% quarter-over-quarter. Of those members, typically high-net-worth individuals, 78.4% actively added to their positions.
This was not reactive dip buying. It was deliberate.
Why Bitcoin’s Richest Investors Traded Less But Spent More in Q1 2026
Trading volume among Xapo members actually fell 20% quarter-on-quarter. But average buy orders grew 26.1% in size and sell orders 42.5%. Fewer moves, each one larger and more calculated.
To understand why that matters, you need to understand what Q1 2026 actually looked like and why retail was doing the absolute opposite.
Robinhood crypto volumes fell 57% year-on-year in January. The first 72 hours of the US-Iran-Israel war alone triggered $128 billion in crypto liquidations. The Fear and Greed Index spent 46 consecutive days in extreme fear territory – below the readings recorded during FTX and Terra/Luna.
“The first quarter of 2026 paints a steadier picture of more deliberate capital deployment and increasingly structured use of liquidity tools,” Xapo said.
The Liquidity Strategy That Lets Them Hold Through Any Crash
Here is the part most coverage missed. Active loans at Xapo rose 8.9% from Q4 2025. More than half of all loans issued since launch carry a 365-day term. Among borrowers, 60% of Bitcoin holdings were pledged as collateral.
These investors are not selling their Bitcoin when they need cash. They are borrowing against it – preserving their position while accessing liquidity.
Xapo calls this pattern “liquidity without liquidation.” You only do this if you believe the asset goes higher.
Investors Who Have Seen 2018, 2020 and 2022 Are Not Scared of 2026
Gen X and Baby Boomers hold the majority of Bitcoin AUM among Xapo’s members. These are investors who have lived through 2018, 2020 and 2022. They have seen what extreme fear looks like, and they have seen what comes after it.
Xapo says Bitcoin wealth is concentrated “among cohorts more likely to treat Bitcoin as long-term capital,” which “helps explain the quarter’s more measured pattern of accumulation, lower trading intensity and growing use of liquidity tools.”
Strategy, the largest corporate holder of Bitcoin, has now surpassed BlackRock IBIT Fund in Bitcoin holdings, which holds 802,823 BTC. The company now controls more than 4% of Bitcoin’s entire supply, with an estimated unrealized profit of $242 million returning to the books.
This indicates rising institutional competition and stronger long-term conviction in Bitcoin.
Strategy Surpasses BlackRock With 815,061 BTC Holding
Bitcoin advocate Michael Saylor has been buying Bitcoin with strong conviction, even when many on Wall Street doubted him. Now, that bet is starting to pay off in a big way.
With its latest purchase of 34,164 BTC, Strategy has crossed a major milestone since it began accumulating Bitcoin in August 2020. The company bought this batch for about $2.54 billion at an average price of $74,395 per BTC, achieving a 9.5% BTC yield in 2026 so far.
Strategy has acquired 34,164 BTC for ~$2.54 billion at ~$74,395 per bitcoin and has achieved BTC Yield of 9.5% YTD 2026. As of 4/19/2026, we hodl 815,061 $BTC acquired for ~$61.56 billion at ~$75,527 per bitcoin. $MSTR$STRChttps://t.co/NYkkvObeb4
Meanwhile, this is not just another routine buy. This acquisition ranks as Strategy’s third-largest Bitcoin purchase ever and its biggest single buy since November 2024.
Over time, its average purchase price has reached around $75,527, which is now close to the current market price.
Strategy now holds 815,061 BTC, making it the largest corporate Bitcoin holder in the world, surpassing BlackRock’s IBIT ETF, which holds 802,823 BTC and manages around $64.63 billion in assets.
Strategy Now Hold 4% Total Supply
At 815,061 BTC, Strategy now controls just over 4% of Bitcoin’s total supply, inching closer to Saylor’s long-stated goal of holding between 5% and 7% of all Bitcoin that will ever exist.
According to Bitcoin Treasuries, the company is currently on track to hit the 1 million BTC milestone by November 2026, a number that once sounded like fantasy and now looks increasingly like a scheduled appointment.
This kind of accumulation reduces available supply in the market, which can support prices over time.
Institutional Demand For BTC ETF Rising Again
This move is not happening in isolation.
Bitcoin ETFs recently recorded nearly $1.44 billion in weekly inflows, marking one of the strongest weeks of 2026. This shows that institutional interest is picking up again after a slow period earlier in the year.
The competition between firms like Strategy and BlackRock highlights a bigger trend: large players are racing to secure Bitcoin positions.
As of now, Bitcoin is trading around $76,486, reflecting a drop of $1.53 trillion.
The live price of the MANA crypto token is $ 0.08904400.
Price predictions for 2026 range from $0.247 – $0.40.
By 2030, the MANA price could surge toward $4.90 due to growing trader activity.
Decentraland (MANA) is one of the earliest and most recognizable names in the metaverse sector. Built on Ethereum, Decentraland allows users to own virtual land, create experiences, and participate in a digital space using its native token, MANA.
While the overall metaverse narrative has cooled since its 2021 peak, Decentraland continues to maintain an active ecosystem focused on virtual events, social experiences, and creator-led development.
If you’re curious about Decentraland’s future and wondering whether MANA is a good investment, this MANA price prediction 2026–2030 will walk you through its potential growth and long-term outlook.
The MANA price has recently retraced to a significant multi-year demand zone in the first quarter 2026, demonstrating a consolidation phase on the price chart that indicates a potential exhaustion of long-standing selling pressure. As we entered the second quarter in April, this consolidation continues.
However, should a favorable catalyst arise, we could see the price ascend toward the upper boundary of this demand zone at $0.125. Conversely, if such a catalyst does not materialize, we may experience an extension of this consolidation throughout April.
Decentraland (MANA) Price Prediction 2026
MANA crypto’s multi-year performance chart reflects a dramatic 98% decline since the FTX crash in 2022, leading many enthusiasts and investors to speculate about the project’s potential end.
This sharp price depreciation has instilled fear among investors, who have witnessed continuous negative price action for years. However, it is essential to consider the historical support level that has been in place since early 2021, which warrants attention despite the recent stagnation in price movement.
Although the project has experienced considerable setbacks over the past half-decade, there still remain arguments for a potential revival. The primary argument is the avoidance of delisting from several exchanges, indicating that MANA/USD continues to pursue efforts aimed at market recovery and still retains decent liquidity in a project with an over $250 million market cap.
Thus, the current retest of this support level is particularly noteworthy. A reversal at this juncture could result in substantial upward momentum. Conversely, if this support range is breached, it would likely reinforce perceptions of MANA crypto as a failing venture.
That said, it is crucial to closely monitor the $0.35 level. Should MANA successfully breach this level and maintain above it with a weekly close, this would signify a significant “Change of Character” for the price dynamic. Under such circumstances, a conservative target of $1.00 for the year may be warranted.
Price Prediction
Potential Low ($)
Average Price ($)
Potential High ($)
2026
0.95
1.45
1.95
MANA On-Chain Analysis
On-chain metrics for Decentraland (MANA) as of mid-March 2026, the asset is exhibiting a notable shift in market sentiment and trader behavior. Over the past 30 days, Open Interest (OI) has trended upward, peaking recently near the $7.14 million mark.
This climb in OI, coupled with funding rates that are stabilizing or turning positive (reaching approximately 0.01%), suggests that new capital is entering the market and traders are increasingly willing to pay a premium to hold long positions.
The profitability profile of short-term holders has also undergone a significant transformation. The 30-day MVRV Ratio has flipped above the zero line, currently sitting at approximately 2.39%. This transition into positive territory indicates that the average address that acquired MANA within the last month is now seeing “green” on their investment.
While this signals a return of bullish momentum, it also suggests that the asset has moved out of the “opportunity zone” and into a phase where some traders might begin to consider taking profits.
Furthermore, the supply distribution data reinforces this narrative of accumulation by larger stakeholders. Throughout March, addresses holding between 10,000 and 10 million MANA have seen a synchronized rise in their percentage of the total supply.
Specifically, the mid-tier “whale” and “shark” brackets (the 100k–1M and 1M–10M cohorts) have recovered from their late-February lows, signaling that significant players are positioning themselves for further upside. This collective accumulation by influential wallet tiers often serves as a foundational support for sustained price action.
Decentraland MANA Price Prediction 2026 – 2030
Price Prediction Years
Potential Low ($)
Average Price ($)
Potential High ($)
Decentraland (MANA) Price Forecast 2026
0.95
1.45
1.95
MANA Token Price Forecast 2027
1.55
2.15
2.85
Decentraland Price Analysis 2028
2.45
3.05
3.65
Decentraland Price Prediction 2029
3.55
3.95
4.35
MANA Price Prediction 2030
4.15
4.65
5.15
Decentraland (MANA) Price Forecast 2026
According to forecast prices and technical analysis, Decentraland’s price is projected to reach a minimum of $0.95 in 2026. The maximum price could hit $1.95, with an average trading price of around $1.45.
MANA Token Price Forecast 2027
Looking forward to 2027, MANA’s price is expected to reach a low of $1.55, with a high of $2.85 and an average forecast price of $2.15.
Decentraland Price Analysis 2028
In 2028, the price of a single Decentraland is anticipated to reach a minimum of $2.45, with a maximum of $3.65 and an average price of $3.05.
Decentraland Price Prediction 2029
By 2029, Decentraland’s price is predicted to reach a minimum of $3.55, with the potential to hit a maximum of $4.35 and an average of $3.95.
Decentraland (MANA) Price Prediction 2029
In 2030, the MANA coin price is predicted to touch its lowest price at $4.15, hitting a high of $5.15 and an average price of $4.65.
What Does The Market Say?
Year
2026
2027
2030
CoinCodex
$0.26
$0.39
$0.67
Tokenmetrics
$0.78
$1.41
$2.11
DigitalCoinPrice
$0.33
$0.61
$3.32
Never Miss a Beat in the Crypto World!
Stay ahead with breaking news, expert analysis, and real-time updates on the latest trends in Bitcoin, altcoins, DeFi, NFTs, and more.
FAQs
What is Decentraland (MANA) and how does it work?
Decentraland is a virtual world on Ethereum where users buy land, create experiences, and trade using the MANA token.
What is the predicted price of MANA in 2026?
MANA could trade between $0.247 and $0.40 in 2026, with potential upside if it maintains key support and adoption grows.
What is Decentraland’s price prediction for 2030?
By 2030, MANA could reach a high of $4.92, a low of $4.15, and an average price of $4.65, reflecting adoption and growing metaverse use.
How high could MANA price go in 2040?
Over the long term, MANA may see substantial growth if adoption and virtual land demand expand, potentially reaching a high of $12–$15 by 2040.
What drives the price of MANA?
MANA’s price is influenced by virtual land demand, user growth, creator tools, and on-chain activity in Decentraland.
Can Decentraland compete with other metaverse projects?
Yes, if Decentraland expands events, gaming, and creator tools, it could attract more users and remain a top metaverse platform.
Altcoins have largely underperformed since the start of the year, failing to match the relative strength seen in Bitcoin and Ethereum. While BTC and ETH prices have managed to hold key levels and attract steady capital inflows, most altcoins remain stuck in range-bound structures, showing little follow-through on upside attempts.
This divergence highlights a market tilted toward majors, where liquidity continues to favor Bitcoin and Ethereum, leaving altcoins like LINK, SOL, ALGO, SEI, and TAO struggling to break past critical resistance levels.
Bitcoin at a Decision Point: Breakdown or Invalidation
The Bitcoin price is compressing within a bear flag, and the next move decides everything for altcoins. The structure shows repeated failures near $92K and $78K, keeping the trend tilted to the downside. This is not neutral—this is a setup waiting for resolution.
Scenario 1 (Bearish Continuation):
If Bitcoin breaks below the flag support, the structure confirms a continuation. This is where the real risk lies—historically, such breakdowns trigger 50% to 60% drawdowns across altcoins, as liquidity exits and risk collapses. In this case, LINK, SOL, ALGO, SEI, and TAO won’t just stay range-bound—they will likely see sharp downside expansion.
Scenario 2 (Bullish Invalidation):
The only shift comes if Bitcoin breaks out of the flag and reclaims the lost levels. A move above the range highs would invalidate the bearish setup and open the door for a broader market recovery. This is the trigger altcoins need—without it, they remain suppressed.
Altcoin Market Structure Hints at a Breakout
The broader altcoin market cap is compressing within a descending broadening wedge, a structure that typically precedes a bullish reversal. Currently, ETH/BTC is consolidating along the resistance of the wedge, hence indicating a critical shift where the price is no longer in a passive phase.
A clean breakout above the resistance triggers expansion across altcoins, while a failure here leads to rejection and likely another move toward the lows. This is not accumulation at the bottom but building pressure at the resistance. Therefore, a breakout from here may initiate a strong altcoin run that may probably transform into an AltSeason.
Conclusion: Altcoins at Resistance — Breakout or Another Leg Down
Altcoins are not recovering yet, but they are testing resistance. The broader structure remains fragile, and until a confirmed breakout occurs, the market stays tilted to the downside. Bitcoin’s bear flag adds to the risk, where a breakdown could trigger 50–60% declines across altcoins, reinforcing the current weakness.
At the same time, underlying data show early signs of accumulation, with rising user activity and institutional exposure building quietly. This creates a split market: weak price action vs. strengthening fundamentals.
The trigger is clear: if Bitcoin breaks down, altcoins likely follow with sharp losses, or if it invalidates the structure, altcoins can expand rapidly. Until that confirmation comes, this is not a recovery phase—it’s a decision zone.
Japan has launched a blockchain pilot to modernize its $7.5 trillion Japanese Government Bond (JGB) collateral system. The Japan Securities Clearing Corporation, Mizuho Financial Group, and Nomura Holdings are working with Digital Asset Holdings on the Canton Network. The project enables real-time, 24/7 cross-border movement of JGBs while preserving their legal status under Japanese law. Backed by the Financial Services Agency, it aims to reduce costs, improve efficiency, and align Japan’s financial infrastructure with global tokenization trends without using public crypto.
Aave is sitting on up to $230 million in bad debt from the Kelp DAO exploit. The Umbrella safety reserve holds $80 to $100 million, according to analyst estimates. That gap has to come from somewhere, and right now, the options on the table are ugly for everyone involved.
Depositors could take a haircut. stkAAVE stakers could get slashed. Or Kelp DAO could collapse entirely trying to absorb the loss at once.
How do users get their money back?
The Official Plan: Umbrella, Treasury and Unnamed Commitments
Aave’s own service providers are already moving. A formal incident report published on the Aave governance forum on April 20 confirmed the DAO treasury holds $181 million and that indicative commitments from unnamed ecosystem participants are already in place to address the shortfall.
The Umbrella safety reserve, Aave’s built-in backstop, may also be deployed, though it holds an estimated $80 to $100 million, leaving a potential gap if bad debt reaches the worst-case $230 million scenario.
If Umbrella falls short, the next layer is stkAAVE stakers – users who locked their tokens as a protocol backstop and could face slashing to cover residual losses.
Intergovernmental blockchain advisor and analyst Anndy Lian thinks there is a better way.
Lian’s proposal centres on a Recovery Token he calls $kRecovery. Instead of forcing an immediate writedown, Kelp DAO would issue $kRecovery to Aave as a structured debt instrument – essentially a promise to repay backed by future protocol revenue.
“Instead of a permanent haircut, Kelp DAO could issue a Recovery Token or Debt IOUs to Aave to cover the $123M–$230M gap,” Lian wrote. “Aave users are made whole over time, and Kelp DAO avoids a total collapse of its token price by financing the debt rather than realizing it all at once.”
Three Ways Kelp Could Actually Pay This Back
This is where the proposal gets specific and credible.
First, Kelp DAO could mint new KELP governance tokens to buy back $kRecovery. It dilutes existing holders but compresses the repayment timeline from decades to one to two years. Lian calls it a “bail-in by the DAO’s shareholders.”
Second, the Arbitrum Security Council has already recovered $71 million. Every dollar recovered accelerates repayment.
Third, and most interesting, is KUSD, Kelp’s stablecoin targeting a 9% yield from institutional finance. If KUSD scales to $500 million in TVL, annual revenue jumps from $4 million to over $20 million. At that rate, even the worst-case $230 million debt clears in under five years from protocol earnings alone.
Why This Matters Beyond Kelp
Lian closes simply: “I have suggested this because I do not want to see retail users get hurt.”
If it works, this is not just a Kelp solution. It is a DeFi precedent – a structured recovery path that keeps protocols alive and users whole instead of choosing who takes the loss.
The crypto market has slipped into green today, with Bitcoin trading around $75,900, up over 2% in the last 24 hours. The total market cap has climbed to roughly $2.5 trillion.
Despite the upside, the market is still in a “Bitcoin season,” with the Altcoin Season Index sitting below 40, meaning most altcoins are still lagging behind BTC’s performance.
Amid this, analysts at Our Crypto Talk dropped a solid watchlist this week:
Kaspa — Event Buzz + Upgrade Catalyst
Kaspa is front and centre at the Hong Kong Web3 Festival this week. KEF is serving as a VIP Lounge Sponsor and featured speaker, while Junny Ho joins the tokenisation panel. On the tech side, the Toccata testnet restart is expected imminently following a recent feature freeze, a critical step toward bringing Kaspa’s Covenants++ upgrade to mainnet.
Fair launch (no presale/pre-mine), fully community-driven
~$940M market cap, still ~84% below ATH
Render Network — AI Demand Surging
Render’s biggest fundamental catalyst in months landed this week. RenderCon 2026 just wrapped in Hollywood (Apr 16–17) with keynotes from NVIDIA, WME, and Stability AI.
Salad subnet adds ~60K GPUs (RNP-023 approved)
AI jobs now 35–40% of usage; $210M workload spike
Token burns up 279% YoY; price testing $1.70 support
Ondo Finance — Leading RWA Narrative
Ondo Finance is a crucial player in the RWA narrative at the Hong Kong Web3 Festival, with Min Lin sharing the stage alongside BlackRock and J.P. Morgan. Even though the token is still 88% below its ATH, its TVL has hit a record $3.6B, with steady growth driven by rising institutional interest.
Franklin Templeton ETF tokenisation + EU expansion
Major overhang: 4.67B tokens still locked
Bittensor TAO — Strong Fundamentals, Weak Sentiment
Despite recent selling pressure, Bittensor remains strong. Jacob Steeves is set to speak at Imperial College London on April 24, breaking down decentralized AI, how Bittensor rewards useful work, and how new users can get started.
128 subnets generated $43M revenue (Q1 2026)
72B parameter AI model trained on the network
~20% drop due to developer exit, not fundamentals
LayerZero— Unlock Pressure, Big Institutional Play
LayerZero faces short-term selling but long-term strength. LayerZero faces maximum short-term pressure, a 25.7M token unlock (2.4% of total supply) hit on April 20, released to core contributors and strategic partners. Price dropped sharply.
Live on Canton Network (handles $350B daily volume)
Access to $8T monthly RWAs + 750+ apps
Backed by major institutions; new “Zero” L1 in works
QUBIC — A feeless Layer 1 focused on AI + compute.
Qubic had a strong week on the tech side. Its QBridge went live on Ethereum, bringing QUBIC to Uniswap v4 as wQUBIC with real trading volume already. At the same time, DOGE mining Phase 2 is ramping up with record hashrate, and the network is now ranked #3 globally by 7-day TPS.
QBridge ETH live volume — Ethereum bridge recording strong early transactions
DOGE mining Phase 2 ramping — record hashrate (15.81 TH/s peak on Apr 16)
Home3 — High-Risk Micro-Cap
Home3 is a blockchain-based real estate platform focused on making property deals more transparent and efficient. This month, it’s rolling out Home3 2.0, featuring an AI-powered realtor experience called Prop3.
Qatar regulatory progress + cross-chain expansion
~$370K market cap, very low liquidity
Down 96% from ATH → highly volatile
SUI — A high-speed Layer 1 is getting serious institutional traction.
SUI is gaining strong institutional traction this week. CME Group plans to launch SUI futures on May 4, while the 21Shares SUI ETF is already live on Nasdaq, giving institutions two ways to gain exposure.
The Reddit XRP community is divided over whether a proposed U.S. crypto bill could change the outlook for XRP. One Reddit user started the discussion if the bill actually changes anything for XRP adoption or if it’s more of a symbolic thing?
The draft law, called the “Clarity Act,” aims to set clear rules for digital assets. Supporters say this could reduce uncertainty that has kept banks and large institutions away from the sector.
“Banks are super paranoid about anything that’s legally unclear,” said a Reddit user
According to the user, even small areas of uncertainty can lead institutions to avoid a product entirely. This caution has limited interest in XRP despite its focus on cross-border payments, a use case often cited by its supporters.
XRP has faced years of legal questions, including a case brought by the U.S. Securities and Exchange Commission. While parts of that dispute have been settled, uncertainty has lingered.
Several investors said banks have so far avoided XRP mainly due to unclear rules.
“Banks are super paranoid about anything that’s legally unclear,” one investor said, describing how compliance teams tend to reject anything that falls into a grey area.
Some believe that if the law removes that uncertainty, banks could at least begin to explore XRP’s use in cross-border payments.
“Why would a bank suddenly invest in XRP? They don’t need to hold it,” one commenter said.
Not all investors agree that clarity would lead to adoption.
One Reddit user challenged the assumption directly: “Why of all things would a bank suddenly invest in XRP? They don’t need to hold it.”
The argument is that banks may use blockchain-based systems without relying on a volatile token, reducing the need for XRP even in a cleaner regulatory environment.
Will the Clarity Act Trigger XRP Sell-off?
However, others warned that the bill itself could become a point for profit-taking rather than long-term growth.
“The Clarity Act would actually be the event that sends XRP down,” one redditor wrote, arguing that new buyers could enter the market while long-time holders exit.
Several commenters said banks are more likely to favour stablecoins, which are designed to maintain a steady value.
“Banks will never use erratic coins … when they can just launch their own stable coins,” one investor said, pointing to the perceived risk of price swings in tokens like XRP.
Limited adoption so far cited as evidence
Investors also pointed to existing partnerships as a reality check. Japan’s SBI Holdings, a long-time backer of Ripple, has held a stake for years but has used XRP mainly through its subsidiary SBI Remit for a small number of remittance corridors.
The group is now promoting broader payment services and stablecoin initiatives with Ripple through SBI Ripple Asia, but adoption remains limited.
Slow pace expected even if the rules are clear
Even those optimistic about the bill said any shift would take time.
“They take forever to make decisions on stuff like this,” one investor said, adding that adoption would likely be gradual rather than immediate.
The discussion highlights a broader divide in crypto markets: whether regulatory clarity will lead to real-world use of assets like XRP, or simply mark a turning point for investors already holding them.
Arbitrum has moved quickly to contain fallout from the KelpDAO exploit, freezing over 30,766 ETH, but the real story is unfolding in the market reaction. Instead of breaking lower, ARB price is holding steady near its base, hinting that selling pressure may already be exhausted. With derivatives positioning shifting and price structure stabilizing, the current setup raises a key question: Is ARB preparing for a reversal while sentiment remains cautious?
Arbitrum Contains Exploit, Limits Market Fallout
In a coordinated emergency response, Arbitrum’s Security Council confirmed the freeze of 30,766 ETH tied to the exploit, acting in collaboration with law enforcement and internal technical teams. The funds have been moved to a secure intermediary wallet, effectively removing access from the exploiter.
The Arbitrum Security Council has taken emergency action to freeze the 30,766 ETH being held in the address on Arbitrum One that is connected to the KelpDAO exploit. The Security Council acted with input from law enforcement as to the exploiter’s identity, and, at all times,…
Importantly, the intervention was executed without impacting users or applications on the network, reinforcing that the issue remained isolated. The move reflects a controlled containment strategy, reducing the risk of broader contagion across the ecosystem. At the same time, it highlights how governance mechanisms are increasingly being used to manage high-impact on-chain events.
ARB Price Hold Gains, Early Accumulation Emerging
Despite the negative trigger, ARB has not extended its downtrend. Instead, ARB price action is stabilizing within a defined accumulation range between $0.10 and $0.12, where consistent demand has absorbed selling pressure.
The structure shows repeated demand absorption at these lows, suggesting that sellers are losing momentum. More notably, the short-term moving averages have begun to turn upward, with a bullish crossover signaling early momentum recovery.
However, the larger trend remains capped under a descending resistance zone near $0.18–$0.20. Until that level is reclaimed, the current move remains a base-building phase rather than a confirmed breakout.
For Arbitrum, the next move will likely be dictated by a breakout from this structure. A sustained push above the $0.14–$0.15 region could open upside toward the $0.18–$0.20 resistance zone. On the downside, the $0.10 level remains critical. A breakdown below this base would invalidate the current accumulation narrative and expose ARB to further weakness.
Liquidation Data Signals Shift in Market Dynamics
Derivative data reinforces the evolving setup. During the downtrend, long liquidations dominated, reflecting forced exits and weak positioning. That dynamic is now changing.
Recent sessions show an increase in short liquidations, indicating that bearish positions are being squeezed as price stabilizes. This shift typically marks the early phase of a sentiment reset, where downside conviction begins to weaken. Meanwhile, open interest and trading volume remain stable, suggesting that new positions are being built gradually rather than driven by short-term speculation
Final Words
Arbitrum’s rapid response to the exploit has contained immediate risks, but the real signal lies in the market’s reaction. With price holding steady, accumulation forming, and short pressure easing, ARB appears to be transitioning out of its weakest phase.
If momentum continues to build and resistance levels are reclaimed, this phase could evolve into a broader reversal. For now, ARB remains in a critical zone, where stability could turn into strength, or hesitation could invite another leg down.
A Reddit post has sparked debate inside the XRP community after a user spent two to three hours running XRP’s investment thesis through both Claude and DeepSeek, prompted by a German finance analyst setting a $9 mid-term price target for the token.
What the AI returned was not reassurance. It was a list of structural concerns.
The RLUSD Question
Banks hate volatility. XRP’s original use case was as a bridge currency providing liquidity between fiat pairs via a brief token hop. But Ripple now offers RLUSD, a dollar-pegged stablecoin running on its own infrastructure.
“Ripple is pushing its own stablecoin (RLUSD). Banks hate volatility. Why would they voluntarily take on the price risk of XRP for their transactions when they could just use Ripple’s software to send a price-stable RLUSD? Doesn’t this mean the XRP token loses its most important institutional use case, or am I missing something here?”
If banks can settle transactions using Ripple’s software with a stable asset, why would they voluntarily absorb XRP’s price risk? The post argued this potentially removes XRP’s most important institutional use case by design, replaced by a product Ripple itself created.
The SWIFT and Chainlink Alternative
The AI raised a competing thesis. SWIFT serves over 11,000 institutions globally and is increasingly connecting to blockchains through Chainlink’s oracle infrastructure rather than replacing its existing rails. Analysts cited in the discussion put LINK’s five-year target at $100 to $150 from a current $9 price, with the mathematical argument being that a 10 to 15x move requires significantly less capital than XRP reaching $9.
The AI also flagged heavy sell pressure clustered between $2.40 and $3.00 from long-term holders, making a clean breakout structurally difficult.
The post concluded by framing this as two competing philosophies for global financial settlement, with the implicit suggestion that only one model will ultimately dominate. Ripple is building the rails and the asset, and SWIFT is evolving through Chainlink integration while keeping its existing infrastructure intact.
The KelpDAO exploiter moved 75,700 ETH (approximately $175 million) across two new wallet addresses on April 21, 2026. This happened just hours after Arbitrum’s Security Council announced that froze 30,766 ETH linked to the same hack.
Meanwhile, this suggests the attacker is actively trying to stay ahead of recovery efforts.
KelpDAO Exploiter Moves $175M ETH to New Wallets
Arbitrum’s Security Council had hardly finished celebrating their freezing of 30,766 ETH (worth $70 million) when the exploiter made their next move.
According to blockchain security firm PeckShieldAlert, the KelpDAO attacker transferred a total of 75,700 ETH to two brand new wallet addresses.
On-chain data confirms the transfers are clearly split into two parts.
Firstly, around 25,000 ETH ($57.93M) were sent to address 0xF980…15910.
Secondly, around 50,700 ETH ($117.48M) were sent to the address 0xABc8…36FAD.
Meanwhile, both transactions were flagged, and the source wallet is labeled Kelp DAO Exploiter 1 on-chain trackers.
Umbra Cash and THORChain: A Two-Layer Escape Route
What makes this situation more serious is not just how fast the funds are moving, but where they are going.
Small ETH transfers have already gone through Umbra Cash, which hides transaction traces using one-time addresses.
But the movement didn’t stop there.
Blockchain security firm CertiK reports that the attacker is also shifting funds to Bitcoin using THORChain, a system that allows assets to move between blockchains without a central exchange.
Together, these tools help the attacker first hide the trail on Ethereum and then move funds completely out of the network into Bitcoin, making recovery much harder.
Old Wallet Nearly Empty, Not Even Gas Fees Left
The original wallet has now been almost completely drained. Only about 0.768 ETH remains, not enough to cover future transaction fees. This clearly shows the attacker has exited the address and shifted operations to new wallets.
That freeze clearly triggered an immediate response from the exploiter, who wasted no time scattering the remaining funds.
What Comes Next?
For now, the situation is still tense. All attention is on whether Arbitrum’s Security Council, law enforcement, and blockchain trackers can act quickly enough to follow the new wallet movements.
The 30,766 ETH that was frozen earlier is still safely locked. However, the 75,700 ETH now sitting in two new wallets is not secured, making the next steps very important.
At the same time, security teams are now closely watching these new addresses. Any further movement could give clues about the attacker’s next step.
Imagine your grandmother puts her life savings into Aave – one of the biggest DeFi protocols on the planet. Then on Monday morning she tries to withdraw and cannot.
Not because Aave was hacked. Aave says it is operating as intended. Not because rsETH was hacked. rsETH says all code is safe. Not because LayerZero was hacked. LayerZero says everything is working fine.
She just cannot get her money out.
That scenario played out for real depositors this past weekend. And now Michael Egorov, the founder of Curve Finance, one of DeFi’s most battle-tested protocols, has had enough.
Egorov’s argument cuts deeper than the rsETH exploit itself. His point is that $606 million in DeFi losses in April alone – led by the $292 million Kelp DAO drain and the $285 million Drift exploit – and over $750 million in 2026 so far, is not bad luck.
It is the predictable result of an industry that keeps adding centralized single points of failure without thinking through what happens when they break.
“All issues like this should be prevented BEFORE they happen, not AFTER,” he wrote. “Number of single points of failure should be reduced, not increased. When these points of failure are unavoidable – trust should be split.”
That last line matters. He is not calling for DeFi to become TradFi. He is calling for DeFi to take its own architecture seriously.
Egorov Wants the Ethereum and Solana Foundations to Step Up
Egorov specifically called on the Ethereum Foundation and Solana Foundation to bring ecosystem projects together and develop shared safety principles – covering how to build safely, how to verify safety, and how to properly configure infrastructure that other protocols rely on.
He also suggested the industry could learn something from traditional finance, which has long dealt with centralized points of failure and developed frameworks around protecting them.
When one follower asked whether Curve itself would share its own principles and risk management practices first, Egorov replied:“Need to formalize the set of rules but yes, possible.”
That means Curve Finance may be among the first major DeFi protocols to publish its own security standards – a concrete first step toward the industry-wide framework Egorov is calling for.
DeFi Will Win, But Only If It Grows Up
He closed his post with three words: “DeFi will win.”
The conviction is still there. But after a month that has exposed exactly how fragile the ecosystem’s trust assumptions are, winning is going to require building differently.
The Arbitrum Security Council has taken emergency action to freeze 30,766 ETH (worth $70 million) connected to the KelpDAO exploit. The action was taken to block attacker access and protect user funds, but it has also raised concerns over decentralization in crypto systems.
Arbitrum Freezes 30,766 ETH After KelpDAO Exploit
Today on X, the Arbitrum Security Council announced that it has frozen 30,766 ETH linked to the KelpDAO exploit and moved it to a secure wallet after a major hack.
The council carefully considered the decision before taking action. Out of 12 council members, nine voted in favor of freezing the assets. The move came after close coordination with law enforcement, who shared information about the exploiter’s identity.
“The Security Council identified and executed a technical approach to move funds to safety without affecting any other chain state or Arbitrum users.”
The team ran deep technical checks to ensure the transfer did not affect any users or applications.
Threat researcher Vladimir S. praised the decision, saying, “Arbitrum just froze $70M in ETH hacked by DPRK-associated attackers in a recent KelpDAO incident. Nicely done!”
WLFI is accused of wrongfully freezing user assets, while ARB froze stolen funds linked to DPRK hackers. One is ethically accepted, the other is criticized but both prove the same point.
When it matters most, governance overrides decentralization.
The frozen funds will stay locked until Arbitrum governance, in coordination with relevant legal authorities, decides the next course of action.
A Major Hack, A Fast Response
It started on April 18, 2026. Attackers exploited a weakness in Kelp DAO’s LayerZero-powered bridge and walked away with 116,500 rsETH, a liquid restaking token issued by Kelp DAO.
The exploit targeted compromised verifier infrastructure, giving the attackers a clean entry point to drain funds worth an estimated $292 million.
Two days later, Arbitrum moved. And instead of reversing the chain or affecting other users, the council used a targeted approach. It secured only the affected funds without disrupting the broader network.
This helped recover roughly a quarter of the stolen assets, making it one of the more effective responses to a major DeFi exploit.
Debate Over Decentralization and Control
Not everyone is happy with this move. Community members argue that freezing funds goes against the core idea of decentralization.
One X user questioned, “So a council can just freeze 30k ETH, and we’re still calling this decentralized?”
Leonidas, creator of the DOG memecoin, went further, stating,
“Decentralized has become a marketing term. Only Bitcoin is actually decentralized.”
Another user drew a sharp comparison: “WLFI is accused of wrongfully freezing user assets, while ARB froze stolen funds linked to DPRK hackers. One is ethically accepted, the other is criticized — but both prove the same point.”
A user named monerify raised a deeper concern, asking whether a compromised council could theoretically control all on-chain funds.
No. They can make the chain claim that they did whatever they want to all of the funds on chain. But they cannot compel anyone to listen to those claims. Everyone else can make different claims and choose which set of claims to honor.
Ripple CTO David Schwartz stepped in to clarify: “They can make the chain claim that they did whatever they want to all of the funds on the chain. But they cannot compel anyone to listen to those claims. Everyone else can make different claims and choose which set of claims to honor.”
What Next?
For now, the funds will remain frozen. Arbitrum governance now controls the stolen ETH, keeping it locked in a secure wallet.
No timeline has been set for the final decision, but the process will involve coordination with law enforcement, given the suspected DPRK-linked attackers behind the exploit.
For Kelp DAO users, the recovery of even a quarter of the stolen funds is a big relief.
The Dogecoin price has been tightly consolidating below a pivotal resistance level since the start of the year, after breaking down from a structure. This could signal a potential bearish set-up, promoting more downside action, but in the long-term, potential remains bullish. New wallet addresses are still emerging, and institutional exposure, reflected in rising ETF balances, continues to build steadily.
This divergence suggests that while the short-term trend remains bearish, accumulation may be quietly taking place beneath the surface, setting up a potential shift in market dynamics if supported by stronger price confirmation.
Dogecoin price continues to trade under pressure as the weekly chart confirms a clear shift from bullish momentum to a sustained downtrend. The price broke the head and shoulder pattern and is yet to mark a bottom, which is somewhere around $0.4. Momentum indicators add to the downside bias. The Chaikin Money Flow (CMF) remains in negative territory, pointing to persistent capital outflows, while the RSI hovers below the neutral zone, reflecting weak buying strength.
Historically, similar breakdowns have resulted in sharp corrections of over 70%, and the current setup appears to mirror that pattern. If selling pressure continues, Dogecoin price could revisit the $0.07 level, with a deeper decline toward the $0.03–$0.04 range, levels last seen in early 2021, remaining a realistic scenario.
From a trader’s perspective, the structure remains bearish unless a clear shift occurs. A sustained reclaim above the $0.18 resistance zone, supported by rising volume and a move in RSI above 50, would be required to invalidate the current downtrend. Until then, rallies are likely to face selling pressure, keeping the broader outlook tilted toward further downside.
Top 2 Reasons Why Dogecoin Price Could Turn Bullish Despite Weak Structure
Dogecoin may be showing weakness on the charts, but the underlying data suggests a different story. Despite the downtrend, on-chain activity and institutional flows point toward quiet accumulation. This divergence raises the possibility that a bullish shift could emerge once the price structure begins to align.
Rising New Addresses Signal Fresh Demand Building
On-chain data shows periodic spikes in new Dogecoin addresses, indicating that new users continue to enter the network even during a downtrend. This is a critical early signal. Historically, phases where user growth persists despite falling prices often point to silent accumulation cycles, where smart money positions ahead of a trend reversal. While the price has yet to respond, sustained growth in new addresses suggests that underlying demand is not fading—and could eventually translate into upward momentum once selling pressure weakens.
Institutional Accumulation Through ETF Balances Is Increasing
Another strong bullish signal comes from the steady rise in Dogecoin holdings within US spot ETF structures. Despite the prolonged price decline, ETF balances continue to climb, reflecting consistent institutional accumulation. This divergence between price and accumulation is important: institutions typically build positions during weakness, not strength. If this trend continues, it could create a supply squeeze over time, supporting a stronger recovery once market sentiment shifts.
What This Means for DOGE Price
While the current price action remains bearish, these two factors highlight a growing underlying bid for Dogecoin. The market is showing early signs of accumulation beneath the surface, even as the chart structure lags. A shift in momentum, such as a breakout above key resistance, could quickly align DOGE price with these bullish on-chain signals, potentially triggering a stronger recovery phase.
Ethereum (ETH) still appears range-bound on the chart, but the underlying data is starting to diverge in a meaningful way. Over the past week, more than 101,000 ETH has been accumulated, pushing large holdings close to 5 million ETH, while spot ETF inflows have now crossed $12 billion, with consistent capital entering the market. At the same time, Ethereum continues to hold firmly above the $2,300 level, showing sustained demand despite the absence of a breakout.
This kind of disconnect between price action and underlying flows rarely persists for long. When accumulation and institutional demand build while price remains compressed, it typically signals positioning ahead of expansion, not after it. If this divergence continues to develop, Ethereum’s next rally may not start with a visible trigger, it may already be forming beneath the surface.
Trend Structure Shifts as SuperTrend Flips Bullish
Ethereum’s broader trend structure has begun to turn, supported by a key technical signal. The SuperTrend indicator has flipped bullish on the daily timeframe for the first time in over a year, marking a shift in directional bias after a prolonged corrective phase. This transition is occurring while ETH is still trading below major resistance, which makes it structurally significant rather than reactive.
Such early trend reversals typically indicate that downside pressure has weakened and the market is entering a transition phase. When combined with stable price behavior, it often reflects the beginning of a new cycle rather than the end of the previous one.
Accumulation Expands as Large Holders Position Early
On-chain and treasury data show that accumulation is not only present but accelerating. BitMine added 101,627 ETH within a single week, pushing its total holdings to approximately 4.976 million ETH. This marks one of the largest accumulation phases recorded in recent months and reflects a clear increase in exposure from large players.
BITMINE ADDS 101,627 ETH IN ONE WEEK
BitMine’s total $ETH holdings have reached 4.976 MILLION after the latest accumulation. One of its biggest weekly accumulation since December 15, 2025. pic.twitter.com/aPJHAtsm9y
Accumulation is taking place while Ethereum remains within a defined range, rather than during a breakout. This indicates that buying is driven by positioning at current levels, not by momentum. Such behavior is typically associated with early-stage accumulation, where capital enters before broader market participation.
ETF Inflows Show Consistent Institutional Demand
Institutional flows are reinforcing the same trend observed in accumulation data. Ethereum spot ETFs have now recorded $12.01 billion in cumulative inflows, with recent sessions showing steady capital entry. On April 20 alone, inflows reached $67.77 million, continuing a sequence of positive net flows following earlier volatility.
Total net assets have climbed toward $13.7 billion, reflecting sustained allocation rather than short-term interest. The shift from mixed flows to consistent inflows suggests that institutions are gradually increasing exposure under stable market conditions. This type of demand typically supports longer-term price structure rather than short-lived movements.
Ethereum Price Analysis: Structure Builds After Sharp Reset
Ethereum’s recent price action reflects a clear shift from distribution to accumulation following a sharp downside reset. After failing near the $4,000–$4,500 resistance zone, ETH saw a strong breakdown that pushed price toward the $2,200–$2,000 region, where demand has now started to stabilize the structure.
Since the drop, ETH price has moved into a consolidation phase, holding above this base while forming a short-term range. However, during the consolidation, volume buildup indicates that participation is increasing even without a breakout. This type of behavior typically reflects absorption rather than selling pressure.
At the same time, the ETH/USDT price chart shows a developing “follow-on buying” zone, where higher lows are beginning to form after the initial rebound. This suggests that buyers are stepping in progressively, not aggressively, which is consistent with early-stage accumulation rather than late-stage momentum.
On the upside, the immediate level to watch sits near $2,800, which acts as a key resistance. A sustained move above this level would confirm strength and open the path toward $3,300, where the next supply zone is positioned. On the downside, the $2,200–$2,300 range remains critical. A breakdown below this zone would weaken the current structure and indicate that accumulation has not fully stabilized yet.
Overall, Ethereum is no longer in a corrective phase, but it has not transitioned into expansion either. The current structure reflects a base-building phase, where demand is gradually returning before any directional move unfolds.
Price predictions for 2026 range from $0.70 to $1.20.
ARB could extend toward $6 by 2030, if recovery structure holds.
Arbitrum (ARB), one of the leading Layer-2 scaling solutions on Ethereum, is currently navigating a phase where strong ecosystem relevance contrasts with prolonged price weakness. While the network continues to play a key role in DeFi and Layer-2 infrastructure, its price action has remained under sustained pressure.
Following an extended downtrend, ARB is now stabilizing near lower demand zones, suggesting that selling momentum may be gradually easing. However, the absence of strong upside movement indicates that the market remains in a transitional phase rather than a confirmed recovery.
This creates a critical question: is Arbitrum forming a long-term base after capitulation, or does the structure still reflect weak demand? With 2026 already underway, attention now shifts to whether ARB can reclaim key resistance levels and transition into a recovery phase. Read on as we break down Arbitrum’s April outlook and full-year price trajectory.
The broader outlook for Arbitrum in 2026 suggests a market transitioning from a prolonged downtrend into a potential recovery phase, with scope for a significant structural shift if key levels are reclaimed. Following its earlier cycle highs, ARB entered a sustained bearish phase throughout 2025, marked by a descending resistance structure and consistent lower highs. This trend extended into early 2026, eventually pushing the price into a deep value zone where it is now attempting to stabilize.
At present, ARB is forming a base near its lower demand region, indicating that downside pressure is gradually weakening. This phase typically reflects early accumulation, where long-term participants begin positioning ahead of a potential trend reversal.
Looking ahead, the primary objective for ARB is to reclaim its immediate resistance near $0.12, followed by stronger structural levels around $0.18 and $0.20. A breakout above these zones would signal a shift in market structure, opening the path for a broader recovery. If this recovery phase gains traction, supported by renewed liquidity, Layer-2 adoption, and ecosystem growth, ARB could gradually move toward the $0.70 to $1.20 range, representing a return toward higher valuation bands seen in previous cycles.
However, such a move would require sustained strength and confirmation across multiple resistance levels. Until then, the asset remains in a rebuilding phase, where failure to hold the $0.08 support could delay recovery and extend consolidation.
Arbitrum (ARB) News Update
The Arbitrum Security Council has taken emergency action to freeze the 30,766 ETH being held in the address on Arbitrum One that is connected to the KelpDAO exploit. The Security Council acted with input from law enforcement as to the exploiter’s identity, and, at all times,…
Based on the historic data and trend analysis of the cryptocurrency along with the market sentiments, here are the possible Arbitrum price targets for the longer time frames.
Year
Potential Low ($)
Potential Average ($)
Potential High ($)
2031
4.00
5.80
8.00
2032
5.00
7.30
9.80
2033
6.50
8.20
11.00
2040
9.00
13.00
20.00
2050
13.00
22.00
32.00
Arbitrum (ARB) Price Prediction: Market Analysis?
Year
2026
2027
2030
Changelly
$1.20
$2.40
$6.00
DigitalCoinPrice
$1.90
$2.60
$5.70
WalletInvestor
$25.60
$1.00
$5.20
Never Miss a Beat in the Crypto World!
Stay ahead with breaking news, expert analysis, and real-time updates on the latest trends in Bitcoin, altcoins, DeFi, NFTs, and more.
FAQs
What is the Arbitrum (ARB) price prediction for 2026?
In 2026, ARB is expected to trade between $0.70 and $1.20 if it holds key support and confirms a long-term recovery trend.
What is the ARB price prediction for 2030?
ARB price prediction for 2030 suggests a potential range between $4.60 and $7.00, assuming sustained adoption and market growth.
What is the Arbitrum price prediction for 2040?
Arbitrum price prediction for 2040 indicates a possible range of $9 to $20 if Ethereum scaling demand remains strong long term.
What is the Arbitrum price prediction for 2050?
Arbitrum price prediction for 2040 indicates a possible range of $9 to $20 if Ethereum scaling demand remains strong long term.
What could impact Arbitrum’s price the most?
ARB price is influenced by Ethereum activity, Layer-2 adoption, overall crypto market trends, and broader investor sentiment.
Is Arbitrum a good long-term investment?
Arbitrum shows long-term potential due to Ethereum adoption, but ARB remains volatile and best suited for investors with risk tolerance.
The Arbitrum Security Council has frozen 30,766 ETH, worth about $71 million, linked to the KelpDAO exploit on Arbitrum One. The funds were moved to a secure wallet requiring governance approval for release, with no impact on other users. The April 18 attack drained $292 million in rsETH through a compromised LayerZero bridge, reportedly tied to North Korea’s Lazarus Group. Meanwhile, Aave paused markets to review up to $230 million in potential bad debt. Read Complete Story
Rave DAO’s collapse from around $28 to nearly $0.50 sent shockwaves across the crypto market. Concerns intensified after ZachXBT flagged extreme token concentration, likely fueling the token’s explosive 11,000% rally in under two weeks. The surge quickly unravelled, with RAVE plunging over 98% and erasing nearly $6 billion in market value as whales exited, triggering heavy selling pressure.
However, the price has since staged a sharp rebound. After closing above $1.20, RAVE price surged nearly 130% to an intraday high of $2.58, before settling around $1.65 at the time of writing.
Social Metrics Signal Speculative Activity
RAVE price action reflects a classic hype-driven cycle, in which a sharp surge toward the $28 level coincided with a spike in social mentions and engagement. Data from Lunar Crush shows mentions climbing above 422K, while sentiment remains relatively elevated at around 58%, even after the crash. This divergence suggests that while the price collapsed rapidly, market attention has not faded at the same pace. Such conditions typically indicate retail-driven momentum rather than strong fundamental backing, increasing the likelihood of volatile price swings.
Despite the steep decline, continued social activity is fueling short-term rebounds in RAVE price. Elevated engagement and persistent chatter often act as a catalyst for short squeezes and relief rallies, rather than sustainable uptrends. The current structure points to speculative participation dominating the market, with traders reacting to volatility instead of long-term conviction.
Unless supported by stronger demand and improved market structure, the ongoing rebound risks losing momentum, reinforcing concerns of a potential dead cat bounce.
The daily chart shows RAVE attempting a recovery after a near-vertical breakdown, but the structure remains fragile. The price has rebounded toward the $2–$2.50 zone, which now acts as immediate resistance after the sharp rejection from higher levels. This area aligns with the post-crash consolidation range, making it a critical supply zone. A failure to reclaim and hold above this region suggests the current move is more of a relief rally than a confirmed trend reversal.
Momentum indicators also signal weakening strength. The RSI has cooled off from overbought conditions and is now hovering below the bullish threshold, indicating fading buying pressure. Meanwhile, the MACD shows a bearish crossover with declining histogram bars, reflecting a slowdown in upward momentum. If RAVE fails to sustain above $1.20, the downside could extend toward the $0.70–$0.50 support zone. On the flip side, a strong reclaim above $2.50 with volume could invalidate the bearish outlook and open the door for a short-term push higher.
Conclusion: Dead Cat Bounce Likely—But Key Levels Decide What Comes Next
The current RAVE price action still leans toward a dead cat bounce rather than a true recovery. The rebound has been sharp, but it lacks structural strength and clear accumulation. The rejection near the $2.50 zone and weakening momentum indicators suggest the move is being driven by short-term liquidity rather than sustained demand.
However, the bearish setup is not absolute. It will be invalidated if Rave DAO reclaims and sustains above $2.50 with strong volume, signaling genuine buying interest rather than a short squeeze. A higher high formation above this level could shift the structure toward a short-term bullish reversal, opening the path toward the $3.50–$5 range. Until that confirmation appears, the current bounce remains fragile and vulnerable to another leg down.
The fate of the U.S. crypto market structure bill, known as the CLARITY Act, hangs in the balance as lawmakers run out of time to advance it in the Senate.
The legislation, which passed the House of Representatives in July 2025 with bipartisan support, has yet to clear a key procedural step. With no date set for a Senate Banking Committee review, concerns are growing that the bill could stall.
Republican Senator Tim Scott has warned that without a markup, the bill cannot move forward.
“No markup means no committee approval, and no committee approval means no Senate floor vote,” he said.
Unresolved issues slow progress
Lawmakers are still negotiating several sticking points, including rules governing stablecoins, protections for developers working on decentralized finance (DeFi), and broader political alignment within the Senate.
New concerns from law enforcement agencies over DeFi-related provisions have added to the delays, according to people familiar with the discussions.
Time is emerging as the main challenge rather than political support.
Lawmakers face an informal deadline in late May, after which the congressional calendar is expected to shift toward election priorities.
Senator Bernie Moreno said the bill risks being sidelined if it does not reach the Senate floor soon. Senator Cynthia Lummis has warned that delays could stretch much further if momentum is lost.
Clarity Act Polymarket Prediction
Expectations around the bill are already shifting. On the prediction platform Polymarket, the perceived likelihood of the bill passing this year has declined in recent weeks, reflecting growing uncertainty.
Industry watches closely
Financial institutions, including JPMorgan, have said clearer rules could encourage greater institutional participation in digital assets.
If the legislation fails to advance, the U.S. crypto sector could remain without a unified regulatory framework, leaving companies and investors navigating existing rules.
For now, attention is on whether the Senate Banking Committee schedules a markup in the coming days. Without that step, the bill’s path forward this year appears increasingly uncertain. Concern over the slowdown.
BlackRock’s iShares Bitcoin Trust (IBIT) purchased another $256 million worth of Bitcoin on April 21, continuing its aggressive accumulation strategy. The move follows recent buys of 3,672 BTC and 3,899 BTC earlier in the week. With total holdings now valued at over $61 billion at around $76,000 per Bitcoin, IBIT remains the largest spot Bitcoin ETF. Strong weekly inflows of more than $600 million highlight rising institutional interest as major players steadily accumulate during market pullbacks.
Ice Open Network has confirmed a security breach involving its identity database, shaking user confidence while highlighting growing risks tied to third-party service providers in crypto.
The April 15 breach came from four former partners tied to a third-party service provider, who leaked user data like emails and 2FA phone numbers after accessing an external server.
Ice Open Network, which runs the $ION token and Online+ on BNB Chain, made it clear this wasn’t a system hack but an insider misuse from outsourced operations, not a failure of the core protocol.
Funds Safe, Core System Intact
Even though the breach sounds serious, the team says funds are safe, no private keys, no wallets touched. The core blockchain wasn’t hacked either, and activity on the network is still stable, so no direct money impact.
Emails, phone numbers, and identity-linked data got exposed, which raises privacy concerns. The team is now telling users to quickly update their 2FA to stay safe.
Legal Action, Migration, and What’s Next
The company has already filed complaints with the Information Commissioner’s Office and is pursuing legal action against those responsible. A technical migration scheduled for April 21 aims to strengthen security, though temporary disruptions on the Online+ platform are expected.
From Price Crash to Full Restructure
This comes just weeks after the $ION 93% crash on April 7 from $0.003 to $0.00024. The CEO pinned it on a long-term service provider dumping tokens, calling it a funding shock, but didn’t share proof. Back then, the team admitted they had spent $18M, were burning $400K monthly, and were close to shutting down.
But things flipped fast. Within 48 hours, they slashed costs by 89% to around $45K/month, cut the team down to core devs, and rolled out a fresh 8-week roadmap, now aiming for a long-shot comeback toward a $1B valuation.
This breach also comes amid a surge in crypto security incidents, with over $606 million lost across protocols in just the first half of April 2026.
If demand for decentralized GPU infrastructure expands, RNDR could climb toward $18 by 2026.
With sustained growth in AI computing and Web3 infrastructure, Render could potentially reach $100 by 2030.
Render (RNDR), a leading decentralized GPU rendering network, is emerging as a key infrastructure layer in the rapidly expanding AI and digital content economy. Initially built to power distributed rendering for creators and studios, the network is now evolving into a broader compute marketplace, enabling scalable GPU access for AI workloads, 3D rendering, and real-time applications.
The recent transition to Render Network on Solana has significantly improved transaction efficiency and scalability, positioning the protocol to handle higher demand from both developers and enterprise users. At the same time, growing interest in AI-driven applications and GPU-intensive workloads is strengthening Render’s long-term utility narrative.
As demand for decentralized compute continues to rise, the focus for 2026 shifts toward adoption and network utilization. The key question remains whether Render can convert this expanding use case into sustained growth and price momentum, as the market increasingly values real-world infrastructure over speculative narratives.
This article delves into Render’s 2026 outlook and long-term price prediction, analyzing whether these catalysts can translate into a sustained breakout. Explore this Render price prediction 2026 and beyond, filled with expert insights and ambitious forecasts.
The short-term outlook for Render (RNDR) in April 2026 suggests a consolidation phase, where price action is stabilizing following recent volatility while attempting to build momentum for a broader breakout. Recent projections indicate that RNDR is likely to trade within a moderate range during April, with short-term targets clustered between the $2.0 and $2.50 zone, reflecting a period of base formation rather than aggressive expansion.
Render appears to be holding above key support levels, while gradually forming higher lows, an early indication of strengthening market structure. This suggests that selling pressure is easing, even as buyers remain selective. If RNDR manages to reclaim immediate resistance near the $3 level with sustained volume, it could trigger a short-term momentum shift toward the $4–$5 range, aligning with early-stage trend reversal conditions. However, failure to break above resistance may keep the price confined within a consolidation band, delaying further upside expansion.
Overall, Render is expected to trade within the $2 to $2.40 range, with breakout confirmation dependent on sustained strength above the $2 resistance zone.
Coinpedia Render (RENDER) Price Prediction 2026
The broader outlook for Render (RNDR) in 2026 reflects a transition phase, where the asset is attempting to rebuild momentum after a prolonged correction from its previous highs. Following its peak near the $13–$14 region, RNDR entered a consolidation structure, with price stabilizing around lower demand zones.
As 2026 progresses, the structure appears to be gradually shifting. RNDR is forming a base above key support zones, while improving fundamentals, particularly rising demand for GPU compute and AI workloads, are strengthening its long-term narrative. This suggests that the current phase may represent a foundation for the next major upward move.
If buyers continue to defend the accumulation range and push the price above critical resistance levels near $5–$7, it could trigger a broader trend reversal. In such a scenario, momentum expansion could accelerate toward the $10–$14 range, with a potential extension toward $16–$18 under a strong bullish cycle. However, failure to sustain above key breakout zones may delay this trajectory, keeping RNDR within a prolonged consolidation phase before a confirmed expansion.
Overall, Render is likely to trade between $5 and $18 this year, with upside dependent on sustained AI-driven demand, network adoption, and successful breakout above macro resistance levels.
RENDER News and Catalysts
AI Narrative Regains Momentum, Driving RNDR Rotation: Render is seeing renewed attention as capital rotates back into AI-linked crypto assets, with GPU infrastructure narratives gaining traction across the market, supporting RNDR’s positioning as a core decentralized compute layer.
Network Activity Stabilizes Alongside Developer Progress: Recent data points to steady development activity and consistent network usage, indicating that underlying adoption remains intact even as speculative interest cools, often a precursor to more sustainable price expansion.
Render (RENDER) On-Chain Analysis
Render’s on-chain data reflects a constructive setup, where underlying network strength is stabilizing while speculative excess resets. Active addresses (7D) remain relatively steady despite recent price fluctuations, indicating that core network usage continues to hold. This consistency suggests that demand for Render’s GPU infrastructure is not purely speculative, but supported by ongoing utilization.
At the same time, development activity shows periodic spikes, highlighting continued protocol-level progress and active ecosystem development. Sustained builder engagement is a critical signal, particularly for infrastructure-focused projects where long-term value is driven by adoption and technological advancement.
Meanwhile, social dominance has trended lower compared to previous peaks, reflecting reduced hype-driven participation. This decline often marks the unwinding of speculative interest, creating conditions for more sustainable, fundamentally driven growth.
The combination of stable network usage, ongoing development momentum, and cooling social hype points toward a reset phase that typically precedes stronger, more sustainable expansion cycles.
Render appears to be transitioning from a hype-driven phase into a utility-backed growth cycle, where continued adoption and real-world demand for decentralized GPU compute could act as the primary drivers of its next upward move.
The long-term projection assumes Render sustains relevance in enterprise blockchain use cases, with growth moderating over time as the asset matures.
Year
Potential Low ($)
Potential Average ($)
Potential High ($)
2031
90
100
130
2032
120
170
200
2033
180
240
300
2040
250
360
450
2050
500
670
750
RNDR Price Prediction: Market Analysis?
Year
2026
2027
2030
Changelly
$6.20
$9.50
$18.00
CoinCodex
$10.00
$18.00
$22.00
Binance
$14.00
$20.00
$30.00
Never Miss a Beat in the Crypto World!
Stay ahead with breaking news, expert analysis, and real-time updates on the latest trends in Bitcoin, altcoins, DeFi, NFTs, and more.
FAQs
What is Render (RNDR) used for?
Render is a decentralized GPU network that lets creators and developers access distributed computing power for AI workloads, 3D rendering, gaming, and visual computing.
What is the Render (RNDR) price prediction for 2026?
Render could trade between $5 and $18 by 2026 if adoption of decentralized GPU computing and AI infrastructure continues expanding across blockchain and tech industries.
How much will Render be worth in 2030?
Render could trade between $62 and $100 by 2030 if decentralized GPU networks gain adoption and demand for AI computing infrastructure continues rising.
What is the RENDER Token price prediction for 2050?
By 2050, Render could potentially reach $500–$750 if decentralized GPU marketplaces remain relevant in AI, cloud computing, and Web3 infrastructure.
Is Render (RNDR) a good long-term crypto project?
Render is considered a strong infrastructure project because it connects unused GPUs with users needing computing power for AI, graphics, and metaverse development.
What factors could drive Render price growth?
RNDR price growth may depend on AI adoption, GPU demand, Web3 infrastructure expansion, and broader crypto market cycles increasing usage of decentralized computing.
Tron’s price 2026 target is $1.20, if breakout structure confirms above $0.50.
TRX’s 2030 projection toward $4 is possible, under a strong ecosystem and stablecoin growth.
TRON’s position in the current market cycle is increasingly being shaped by its dominance in real transactional activity, particularly as a primary settlement layer for stablecoins like USDT. With consistent on-chain demand, strong network revenue, and expanding global usage, TRON continues to stand out as one of the few networks where utility directly supports price stability. At the same time, its price structure is beginning to reflect that strength.
After an extended period of gradual upside, TRX is now holding near the $0.32–$0.33 range, consolidating just below recent highs rather than correcting sharply. This creates a setup where fundamentals and price action are starting to align. As TRON continues to benefit from strong network activity and steady demand, the focus now shifts to whether this consolidation phase can translate into further expansion.
With the market already progressing through 2026, the focus now shifts to whether TRON can sustain its network dominance while translating usage into continued price expansion. Read on as we break down TRON’s April outlook and TRX price prediction 2026-30.
TRON’s short-term structure reflects a steady consolidation phase, with the price holding firm after its recent upward move. Currently trading near the $0.31 region, TRX is maintaining support above key levels while testing resistance near the $0.34–$0.36 zone. This range remains critical in defining the next directional move. The formation of higher lows indicates underlying strength, suggesting that selling pressure is being absorbed.
A sustained breakout above $0.36 could open the path toward the $0.40–$0.45 range, signaling continuation of the broader trend. On the downside, failure to reclaim resistance may lead to extended consolidation, with support expected near $0.28–$0.30.
Coinpedia’s TRX Price Prediction 2026
TRON’s broader trajectory in 2026 is increasingly supported by a combination of sustained network activity and a price structure that continues to hold firm at higher levels. Unlike many altcoins that rely heavily on speculative cycles, TRX is being underpinned by consistent demand through stablecoin settlements, rising transaction volumes, and steady protocol revenue.
TRX price continues to consolidate near highs rather than retracing deeply, suggesting that buyers are actively defending higher levels while absorbing supply. This behavior typically precedes continuation, especially when supported by real usage rather than short-term sentiment.
The key progression now depends on how TRX expands from this base. A sustained move above the $0.35–$0.40 region would likely accelerate momentum, opening the path toward the $0.60–$0.80 range as the next phase of expansion. As higher levels begin to hold and participation increases, the structure can gradually transition into a stronger trending environment.
Under a sustained growth scenario, TRON could advance toward the $0.80–$1.20 range by the end of 2026, driven by continued network dominance, stablecoin activity, and increasing market participation.
Recent Catalysts for Tron (TRX)
TRON continues to lead in USDT transaction volume, reinforcing its role as a core settlement layer in the crypto economy.
Listing expansion and improved accessibility in regulated markets are gradually increasing institutional visibility and liquidity.
Strong on-chain revenue and rising user activity are highlighting TRON’s position as one of the few networks generating consistent real usage, not just narrative-driven demand.
TRX Long-Term Price Prediction 2026-2030
Year
Potential Low ($)
Potential Average ($
Potential High ($)
2026
0.80
1.00
1.20
2027
1.10
1.50
1.90
2028
1.80
2.30
2.80
2029
2.50
3.20
3.70
2030
3.20
3.60
4.00
TRON Coin Price Projection 2027
As per the Tron Price Prediction 2027, Tron may see a potential low price of $1.10. The potential high for Tron price in 2027 is estimated to reach $1.90.
TRON Crypto Price Forecast 2028
In 2028, the Tron price is forecasted to potentially reach a low price of $1.80 and a high price of $2.80
TRON Token Price Action 2029
Thereafter, the Tron (Tron) price for the year 2029 could range between $2.50 and $3.70.
TRON (TRX) Price Prediction 2030
Finally, in 2030, the price of Tron is predicted to maintain a steady positive. It may trade between $3.20 and $4.00.
Tron Price Prediction 2031, 2032, 2033, 2040, 2050
The long-term projection assumes Tron sustains relevance in enterprise blockchain use cases, with growth moderating over time as the asset matures.
Year
Potential Low ($)
Potential Average ($)
Potential High ($)
2031
3.50
4.30
5.20
2032
4.50
6.00
7.00
2033
9.00
11.00
15.00
2040
20.00
28.00
38.00
2050
80.00
110.00
150.00
Tron (TRX) Price Prediction: Market Analysis?
Year
2026
2027
2030
Changelly
$0.95
$1.50
$2.20
CoinCodex
$1.00
$1.80
$3.00
WalletInvestor
$1.50
$2.00
$3.50
Never Miss a Beat in the Crypto World!
Stay ahead with breaking news, expert analysis, and real-time updates on the latest trends in Bitcoin, altcoins, DeFi, NFTs, and more.
FAQs
What is the TRX price prediction for 2026?
TRX could trade between $0.80 and $1.20 in 2026 if it breaks above $0.50 and maintains strong stablecoin settlement growth.
What is the TRX Coin price prediction for 2027?
In 2027, TRX could trade between $1.10 and $1.90 if network growth continues and broader crypto market conditions remain favorable.
What is the TRX price prediction for 2028?
TRX may reach $0.94–$2.07 in 2028, with an average price of $1.50, driven by growing network usage and stablecoin dominance.
How high can TRX price go by 2030?
TRX may reach up to $4.00 by 2030 under strong ecosystem expansion, stablecoin dominance, and sustained crypto market growth.
What is the TRX price prediction for 2040?
By 2040, TRX could trade between $20 and $38 if global blockchain adoption expands and TRON remains a major settlement network.
What is the Tron price prediction for 2050?
In a strong long-term adoption scenario, Tron may range between $80 and $150 by 2050, assuming sustained utility and ecosystem growth.
Is TRX a good investment for the future?
TRX shows strong long-term potential, with projected growth through 2030, backed by real-world use in payments, stablecoins, and global adoption.
Can TRON (TRX) reach $1 in the next bull cycle?
Yes, TRX reaching $1 is possible if resistance flips to support and network activity, especially USDT transfers, keeps expanding.
The Bitcoin price prediction just entered the accumulation band patient buyers wait years to see. BTC slipped to $73,753 on April 19 after Iran walked away from a second round of US peace talks per Bitcoin.com News, erasing roughly $83 billion from the wider crypto market in one risk-off session.
Red tape this deep is the starting line every cycle winner came out of. From the March 2020 crash to the late 2022 floor, the biggest returns printed for buyers who stepped in while sentiment was broken.
Pepeto just topped $9.29 million raised at $0.0000001865 with 181% APY staking paying daily, and the Binance listing shuts this entry price the day trading opens. Why this is shaping into the defining trade of 2026 is laid out below.
Iran Pulls Out Of Second Round Of US Talks And BTC Prints The Deepest Fear Of 2026
Iran’s state-run Islamic Republic News Agency confirmed on April 19 that Tehran pulled out of a second negotiating session with Washington, citing contradictory positions and excessive US demands per Bitcoin.com News. The Strait of Hormuz, handling 20% of seaborne oil trade, stayed shut while thirteen tankers turned back mid-route per Yahoo Finance.
Risk markets flipped inside hours and Bitcoin broke out of the $75,000 to $77,000 range it held all month, with total crypto market cap shedding about $83 billion per CryptoBriefing. None of this breaks the cycle. It compressed the window for the next leg higher.
Inside that compressed window, the presales with real products and low entry prices are the ones that hand out the cycle’s biggest returns, and Pepeto carries the clearest setup of any presale heading into 2026.
Bitcoin Price Prediction Points To Pepeto As The 2026 Presale Holding The Most Upside
Pepeto sits at the front of this cycle’s presale pack with $9.29 million already secured while Bitcoin holds near $75,270 per MEXC. Every BTC fear flush on record has kicked off an altcoin rotation that lifts presale entries into return brackets no large cap can reach.
The friction Pepeto removes is simple. Traders flip between five platforms to swap a token, bridge cross-chain, screen a contract, and track a portfolio, losing fees at every step. PepetoSwap folds that full stack into one dashboard.
Users shift assets across Ethereum, BNB Chain, and Solana at zero cost, run any smart contract through the risk scanner before deploying capital, and handle every position from one screen. The bridge, scanner, classifier, and portfolio tool all ride on contracts cleared by a full SolidProof audit.
At $0.0000001865, a $10,000 presale position earns roughly $18,100 yearly at 181% APY, about $1,508 into the wallet each month as the Binance listing nears. The original Pepe architect behind the $11 billion debut designed Pepeto for this cycle turn, paired with a former Binance engineer on the exchange build. Buying presales while panic runs the tape is the pattern behind every generational crypto win, and the confirmed Binance listing shuts this price the day trading flips live.
Bitcoin (BTC) Price At $75,270 After Iran Rejection Flushes Risk-Off Wave
Bitcoin (BTC) trades near $75,270 per CoinmarketCap after sliding from a $77,000 ceiling to touch $73,753 on Saturday per Bitcoin.com News, down 1.33% on the day. Support sits at $70,500 with $68,000 below, the zone Arthur Hayes of BitMEX flagged as the probable floor once the macro shock fades. Resistance stacks at $76,000 and $78,000, the level capping BTC earlier this month.
The RSI reset into oversold on the 4-hour chart and spot volume dried up, a setup that has preceded sharp rebounds every time prior macro fear unwound. Every Bitcoin price prediction from Bitwise to Bernstein still targets fresh all-time highs this year, but BTC has to roughly double from here while six-zero presale entries grab multipliers large caps cannot produce.
The Bottom Line
The Bitcoin price prediction has not flipped bearish, it has handed patient buyers the precise window that builds generational returns. BTC sits inside the accumulation band the largest funds have loaded every cycle, Strategy still holds 766,970 BTC through 2026’s deepest fear print, and Pepeto sits at the level where portfolios go from five figures to seven.
Think of every retail trader who watched a presale launch and promised to get in next time. This is that next time. The biggest crypto returns on record never came from chasing green candles in majors, they came from wallets that stepped in ahead of the listing and held. Pepeto is that setup this cycle, and the entry on the screen today vanishes the second trading flips live.
What is the Bitcoin price prediction for 2026 after BTC dropped below $75,000 on the Iran headline?
The Bitcoin price prediction still targets a fresh all-time high before year-end per Bitwise and Bernstein, even after BTC touched $73,753 on April 19. Pepeto at $0.0000001865 with a confirmed Binance listing targets return multiples BTC cannot deliver from $75,270.
Why is Pepeto the standout presale next to the Bitcoin price prediction right now?
Pepeto is leading this cycle because it pairs a SolidProof audit, 181% APY staking, and a zero-fee exchange with a confirmed Binance listing. The project has $9.29 million raised and is led by the original Pepe architect behind the $11 billion debut alongside a former Binance engineer.
Something is clearly shifting inside the U.S. Securities and Exchange Commission, and Ripple CEO Brad Garlinghouse isn’t staying quiet about it. Responding to recent comments from Paul Atkins, he described the new direction as a long-overdue reset, especially after what he sees as a difficult period for the crypto industry under earlier leadership.
From “War on Crypto” to a Reset
Garlinghouse directly contrasted Atkins’ approach with former SEC Chair Gary Gensler, saying the agency had drifted away from its core mission of protecting investors. Instead, he argues, it leaned heavily into enforcement, creating confusion and pushing innovation out of the U.S.
In his view, that period felt like a “war on technology,” with courts eventually stepping in to challenge parts of the SEC’s stance. Now, he sees things moving in a very different direction.
Moreover, this includes better coordination with the Commodity Futures Trading Commission and clearer distinctions between securities and commodities. The goal is simple: reduce confusion and make the U.S. competitive again in crypto.
Having said that, even before Atkins was officially confirmed, signs of change were already visible. Under interim leadership, the SEC launched a crypto task force led by Hester Peirce and began dropping major enforcement actions, including cases against Coinbase.
In the last 12 months, the agency has also approved multiple crypto ETFs and eased its stance on classifying most cryptocurrencies as securities, a major crypto win.
What Atkins Is Actually Changing
During his interview with CNBC’s Squawk Box, Atkins laid out a clearer roadmap, and this is where the tone really takes a fresh turn. He says the SEC is moving away from that enforcement-first style and into something more structured, what he calls the ACT strategy: Advance, Clarify, Transform.
“And so, basically, we’re instituting a strategy. That I’m calling our ACT strategy, advance, clarify, and transform.”
“Advance” means embracing new tech like crypto instead of pushing it away. “Clarify” is about finally giving the market clear rules, something the industry has been asking for years. And “Transform” focuses on updating outdated systems so markets, including IPOs, can actually keep up with modern finance.
Why This Matters Now
What makes this stand out is how aligned it feels with what the crypto industry has been pushing for: clear rules, less guesswork, and room to innovate. Garlinghouse summed it up by calling Atkins a “breath of fresh air,” which says a lot given the tension between regulators and crypto over the past few years.
Instead of pushing crypto out, the SEC now seems to be trying to bring it back in, with clearer guidelines and a more open approach. If that continues, it could finally give the industry the stability it’s been waiting for.
P2P crypto trading in the CIS has “worked” for years. Loosely. Hidden spreads, frozen accounts, USDT of unknown origin, banks asking uncomfortable questions months later. Cifra Markets was built to replace all of that with something closer to a regulated brokerage than a grey market workaround. This review breaks down what Cifra actually does, who it’s built for, and where it falls short — based on direct platform experience.
What Is Cifra Markets?
Cifra Markets is a licensed crypto broker registered in the Republic of Belarus, operating under the High-Tech Park (HTP) — Belarus’s regulatory framework for crypto since 2017. Not an exchange. Not a P2P marketplace. As a broker, Cifra sits between you and the market with full legal accountability. Every transaction has a paper trail. Every deposit has a verified source.
The platform runs through Tradernet.BY, an in-house trading interface built for beginners and experienced traders alike.
Quick Overview
Website: cifra.by/en
Sector: Regulated Crypto Broker
Jurisdiction: Republic of Belarus, licensed under HTP
AML Verification: Yes — Elliptic, Shyft, and proprietary checks
Trading Platform: Tradernet.BY
Market Coverage: CIS, Asia, Middle East — 20+ countries
Why the CIS P2P Problem Is Real
P2P platforms don’t verify the source of funds. Online exchangers bake a spread into the rate and call it “no fees.” Offline dealers hand you a receipt, not a transaction history. The consequences show up later — a bank asks where your USDT came from, there’s no official counterparty, no documentation, and no clean answer.
Cifra’s entire value proposition is built around eliminating exactly this scenario.
Core Features of Cifra Markets
AML-Verified, Clean Cryptocurrency
Every deposit runs through three-layer AML verification — Elliptic, Shyft, and proprietary checks — after funds reach the external wallet perimeter. Flagged wallets get their funds automatically returned to the original blockchain address. Nothing dirty enters the internal system. Outgoing withdrawals go through the same process. This is the feature that matters most for anyone who’s had banking friction tied to crypto.
Transparent Order Book Pricing
The fiat-to-USDT rate is set by participants placing orders in the order book — not by Cifra. No hidden spread, no rate adjusted at the moment of conversion. For large transactions, an OTC desk is available.
Legal Fiat On-Ramp and Off-Ramp
Deposits and withdrawals run through partner banks across the CIS in USD, EUR, RUB and Belarusian rubles (BYN). Direct integrations, not routed through payment processors. For anyone who’s had a P2P fiat transfer flagged, the difference is felt immediately.
300+ Cryptocurrencies + Tokenized US Stocks
Major and mid-cap coins covered. Tokenized US stocks — Apple, Google, Nvidia, Amazon, Robinhood, Circle — available with fractional share support. For CIS users without easy access to US equity markets, that’s genuinely useful, not just a marketing line.
Spot and Margin Trading
Spot trading for all users. Margin trading up to 5x for experienced traders. Both run through Tradernet 24/7 — no weekends off, no holiday downtime.
Official Documentation for Every Transaction
After completing transactions, both individuals and legal entities can download official broker account statements. These hold up for accounting and tax reporting purposes. For businesses and anyone managing larger volumes, this is the part that makes crypto operationally viable rather than a compliance headache.
Partner Program
Cifra runs a one-level affiliate program for bloggers, financial consultants, miners, and B2B service companies.
Personal dashboard for tracking referrals and performance
Monthly payouts up to the 25ᵗʰ of the following month
All terms fixed in an official partnership agreement
Open to financial intermediaries, asset managers, IT and mining suppliers
100+ active partners, presence in 20+ countries
Mining Solution — Sell and Convert Without the Hassle
Most brokers don’t build this. Cifra’s dedicated mining solution lets miners sell BTC and convert directly to fiat — legally, fast, documented.
Same-day fiat withdrawal if the order is submitted in the first half of the day
Withdrawals via CIS partner bank transfers
Custody and security under the same HTP framework
Minimum volume from 0.1 BTC, no upper cap
Full paper trail on every conversion
Official Documentation for Every Transaction
After completing transactions, both individuals and legal entities can download official broker account statements. These hold up for accounting and tax reporting purposes. For businesses and anyone managing larger volumes, this is the part that makes crypto operationally viable rather than a compliance headache.
Fees and Commissions
Competitive for a regulated broker. Everything is publicly listed — no surprises.
Trading Tariff — Consulting Plan (Entry Level)
Crypto-crypto pairs (e.g. BTC/USDT): 0.50% per trade
Crypto-fiat pairs (e.g. USDT/BYN): 1.10% per trade
Monthly account maintenance: 0
Transaction fees charged in rubles only
Fiat Withdrawal — Non-Residents of Belarus
BYN: minimum 30 BYN, flat 2 BYN commission
USD via SWIFT from Belarusian banks: minimum 1,000 USD — 0.5% (floor $200, ceiling $700)
USD via foreign partner bank: minimum 1,000 USD — free until May 31, 2026; 0.75% (min $25) from June 1, 2026
Offshore-registered entities: 20% of withdrawn amount — regulatory requirement, not a platform fee
Fiat Withdrawal — Residents of Belarus
BYN: minimum 30 BYN, flat 2 BYN commission
Foreign currency withdrawal: not available for Belarusian residents
Two things worth flagging. The USD SWIFT floor of $200 on a $1,000 minimum means small withdrawals are disproportionately expensive — don’t move small amounts this way. And the free foreign partner bank transfer window closes May 31, 2026. If you’re a non-resident planning USD withdrawals, calendar that date.
Onboarding: What to Expect
Not frictionless. It shouldn’t be. Phone verification, citizenship and tax residency details, SMS-signed service agreement, KYC — around 10–15 minutes total. Slower than Binance. Also why your bank won’t ask uncomfortable questions later. The Tradernet interface is clean and accessible. Closer to a traditional brokerage in feel than a crypto exchange.
Pros and Cons
Pros
Full HTP regulatory compliance — real legal protection
Three-layer AML verification on every transaction, both directions
Transparent order book pricing, no hidden spread
Downloadable official broker statements for accounting and tax use
300+ coins plus tokenized US stocks with fractional access
Direct fiat on/off-ramp through CIS partner banks
24/7 trading, no holiday or weekend restrictions
Margin trading up to 5x
OTC desk for large volume
Mining solution with same-day fiat withdrawal from 0.1 BTC
0.50% crypto-crypto, 1.10% crypto-fiat — zero monthly maintenance
Free USD foreign partner bank withdrawals until May 31, 2026
Partner program with monthly payouts
10+ year institutional track record, 300,000+ clients
Cons
25,000 USDT AML cap before income documentation kicks in
USD SWIFT withdrawal floor of $200 on a $1,000 minimum — expensive for small amounts
Foreign partner bank USD transfers move to 0.75% after May 31, 2026
CIS-focused banking — limited fiat options for users outside the region
Coin catalog narrower than Binance or OKX — low-cap new listings won’t be here
No anonymity — documentation is the product, not a feature you can skip
Who Is Cifra Markets Best Suited For?
P2P burn victims. Frozen accounts, flagged USDT, bank queries with no clean answer — Cifra fixes the root cause, not just the symptom.
Miners selling BTC to fiat. Same-day withdrawal, from 0.1 BTC, full documentation. A direct upgrade over informal OTC.
Businesses and legal entities. Official counterparty, downloadable statements, regulated framework that satisfies auditors. P2P can’t offer any of this at a corporate level.
Beginners. Deposit fiat, buy crypto, hold. No wallets, no gas fees, no network selection required upfront. The KYC is more involved but the actual trading experience is accessible.
High-volume traders and institutions. OTC desk, 5x margin, official statements. Functional at scale in a way P2P simply isn’t.
Less relevant for: users hunting low-cap new listings, anyone needing global fiat rails outside the CIS, or traders who prioritize speed of onboarding above everything else.
Final Verdict
Cifra doesn’t compete with Binance on variety. That’s not the fight. The real competition is the grey market — P2P platforms, unregulated exchangers, informal OTC — and on that comparison Cifra Markets wins on every metric that matters when real money is involved.
Fees are competitive. The AML friction protects you more than it costs you. The mining solution fills a gap that’s been ignored too long. The free USD withdrawal window closes May 2026 — worth using before it does.
If you’ve been tolerating the grey market because you thought it was the only option, it isn’t anymore.
ASTEROID’s extraordinary run changed the conversation. A token that sat at a $50,000 market cap before Elon Musk replied to a girl’s SpaceX mascot request briefly touched a $20 million market cap within hours and posted a 68,428% weekly gain according to CoinGecko data before pulling back roughly 40%.
The question traders are now asking is if ASTEROID can do that, what moves next? Two tokens are being mentioned with increasing frequency in memecoin communities: Amaterasu Omikami (OMIKAMI) and RyuJin (RYU).
The Case for OMIKAMI and RyuJin
One expert who has covered OMIKAMI over three years pointed to the ASTEROID move as evidence that the memecoin supercycle has further to run. His conviction is rooted in the longevity of both projects rather than short-term momentum.
Both tokens have been active for nearly two years with what the analyst describes as organic community growth rather than manufactured hype. The ecosystem is allegedly connected to Ryoshi, the pseudonymous figure behind Shiba Inu, though that attribution remains unverified and disputed within parts of the community.
OMIKAMI currently trades at approximately $0.007112 with a market cap of $6.73 million. RyuJin sits at $0.000000002961 with a $2.85 million market cap. Both the tokens are up by more than 13%.
The ASTEROID Parallel
The analyst drew a direct comparison between OMIKAMI’s current position and where ASTEROID sat before its viral moment. Both had a story. Both had a community. ASTEROID had a single external catalyst that lit the fuse.
The structural difference is the nature of that catalyst. ASTEROID moved because of a verifiable two-word reply from one of the world’s most followed public figures. OMIKAMI’s anticipated catalyst is expected to come from within the ecosystem itself, potentially a new communication from Ryoshi or a product announcement tied to a planned blockchain and debit card infrastructure the project has been developing.
The Broader Macro Setup
The analyst also said that the broader market context is constructive for memecoin activity. Bitcoin is retesting a breakout level on the four-hour chart and Ethereum is approaching key resistance. Both are approaching moves that have historically preceded altcoin and memecoin cycles.
The CLARITY Act, a potential new Fed chair and stablecoin yield legislation are all cited as macro catalysts that could inject significant fresh liquidity into crypto broadly.
Pi Network co-founder Nicolas Kokkalis is set to speak at Consensus 2026 in Miami on May 7, joining a panel titled “How to Prove You’re Human in an AI World Without Doxing Yourself” at the Convergence Stage from 10:15 to 10:45 AM EDT.
The session addresses what Pi’s core team describes as one of the most urgent problems facing the internet: verifying real human identity online as AI systems become capable of generating convincing fake profiles and bot interactions at scale. The challenge is doing that without requiring users to expose private identity data in the process.
The Consensus appearance arrives at a moment when Pi’s development momentum is arguably stronger than at any point in the project’s history.
Five Promises, Five Deliveries
Analyst Dr. Altcoin, reviewing only official sources, documented five important execution milestones Pi has hit in the first four months of 2026 alone.
Protocol modernisation has been the foundation. Pi upgraded through multiple protocol versions, with all major nodes now running Protocol 20. Protocol 21 is rolling out with a security hard fork deployed on April 6. A publicly scheduled roadmap takes the mainnet blockchain to Protocol 26 by end of June 2026, an acceleration rather than a slowdown.
Smart contracts shipped on testnet on April 17. The first contract was deliberately focused on recurring subscriptions, designed for real businesses running streaming, e-commerce and software billing. Subscribers approve a defined budget once without resigning every billing event. The contract is under external audit and published as PRC2 on GitHub. An RPC server giving developers direct access to the blockchain shipped ten days earlier.
Mainnet migration has passed 16.5 million verified pioneers with over 119,000 completing second migrations including referral mining bonuses. Two-factor authentication is now mandatory across the network.
KYC validator rewards were distributed on April 3, paying 0.0504 Pi per validation, approximately 21 times the current base mining rate. The Pi Foundation contributed 10 million Pi to the reward pool. The distribution demonstrated at global scale that Pi can coordinate, measure and pay over one million KYC-verified humans in native token, a capability no other blockchain has demonstrated at this scale.
Ecosystem tooling is advancing with Pi App Studio moving to mainnet with live payments, Pi Launchpad live on testnet and Kraken, a tier-one regulated exchange, integrating support for PI through the KYB verification process
Under the 2012 STOCK (Stop Trading on Congressional Knowledge) Act, congressional members and other government employees are mandated to report stocks, bonds, and cryptocurrency trades of over $1,000 within 45 days of executing them.
Here is a compilation of the top 5 crypto choices, and a few little-known extra choices:
Top 5 crypto choices in the US Congress
The first is Bitcoin (BTC), the most widely held asset among legislators. Wyoming Senator (Sen.) Cynthia Lummis, a prominent speaker on crypto policy, disclosed her first Bitcoin purchase in 2013. Others who have made BTC purchases include Sen. Ted Cruz and Representatives (Rep.) Byron Donalds and Guy Reschenthaler, with reports of individual holdings worth up to $250,000.
Other lawmakers, such as Rep. Sheri Biggs and Sen. Dave McCormick, have Bitcoin exposure through ETFs from Valkyrie, VanEck, and Ether. Meanwhile, a couple of others, such as Sen. Sheldon Whitehouse, have invested in Bitcoin-related companies, including PayPal, BlackRock, and The Block (formerly Square).
The second is Ethereum (ETH), held by members of Congress such as Reps. Mike Collins and Barry Moore, with the former holding up to $60,000 in ETH. Rep. Marjorie Taylor Greene and Sen. Dave McCormick have invested in Ethereum ETFs.
Third is Solana (SOL) and fourth is XRP, both reported by Rep. Guy Reschenthaler, and each valued at up to $15,000. Fifth is Cardano (ADA), disclosed by Reps. Barry Moore and Mike Collins, with the former holding a portion worth up to $45,000.
Little-known coins
While the above constitute the top 12 crypto coins by market cap, policymakers have also made some outlier investments. Rep. Mike Collins purchased the Ski Mask Dog (SKI), while Rep. Madison Cawthorn held and promoted the LGB Coin.
Other coins in this category include The Graph (GRT), Velodrome (VELO), and Aerodrome Finance (AERO).
In the past 24 hours, all these cryptocurrencies have gained between 1.8% and 4% following shifts in the geopolitical and macroeconomic environment.
Leading asset manager Grayscale has now updated its HYPE ETF (ticker: GHYP) filing with the US Securities and Exchange Commission (SEC) to designate Anchorage Digital as its custodian, replacing Coinbase.
HYPE ETF: Why Grayscale has replaced Coinbase with Anchorage Digital
Notably, Grayscale has decided to replace Coinbase with Anchorage Digital, mainly for competition, concentration, and regulatory reasons.
In terms of competition, Hyperliquid (the protocol behind the HYPE token) has become a prominent rival to Coinbase. The decentralized exchange recorded about $2.6 trillion in notional derivatives volume for 2025/early 2026. Meanwhile, Coinbase reported $1.4 trillion over the same period. These two, being opponents, therefore create a conflict of interest in the contract.
Secondly, regulators and issuers are continuously pushing for the diversification of custodians to prevent market monopoly and the associated financial risks. Coinbase is already custodian to about 80% of the US spot crypto ETF market.
Thirdly, Anchorage Digital stands out for its compliance, as it is the only federally chartered crypto bank in the US. In contrast, Coinbase remains state-regulated.
Another reason for the shift is risk reduction, which has also led BlackRock to choose Anchorage as its secondary custodian for its Bitcoin and Ethereum trusts.
Furthermore, Anchorage offers robust institutional staking services. This aligns with Grayscale’s plans to offer staking rewards for the ETF product, pending regulatory approval.
Competitor’s action and HYPE price
Grayscale competitors like 21Shares and Bitwise have made the same change for the same reasons.
At press time, the HYPE token had suffered a minor 0.23% pullback to $41.03 amid heightened sell pressure.
However, institutional interest and token burns are seen as major fundamental positives for the ecosystem. The community also greatly anticipates the upcoming HIP-4 upgrade for prediction markets, which is expected to catalyze HYPE’s price to higher levels.
Ripple has today published a roadmap to quantum-proof the XRP Ledger (XRPL) by 2028. This is in response to Google’s initial warning that quantum security threats could breach cryptographic systems by 2032, with even fewer resources (about 500,000 physical qubits) than initially estimated.
Phases leading to a quantum-resilient Ripple and XRP
According to Ripple’s blog, the plan begins with preparing contingency plans in the event Q-day (Quantum-Day) arrives earlier than expected. In such a scenario, Ripple intends to execute a “hard shift.” This would disable account access via public keys while enabling funds migration to post-quantum-secure accounts.
The second phase, scheduled for the first half of 2026, involves testing NIST-recommended quantum-secure cryptography standards in partnership with Project Eleven.
This evaluation will provide insight into the effects of post-quantum implementations on XRPL, including transaction speed, costs, and storage requirements. Ripple can then use this information to implement architectural changes designed to mitigate the limitations posed by post-quantum computing (PQC) technology.
The third phase, scheduled for the second half of 2026, involves implementing the above schemes on Devnet. This will allow developers to review usability and performance without affecting the prevailing network.
Concurrently, Ripple will explore the use of PQC technology to enhance privacy for entities tokenizing real-world assets.
Finally, Ripple will propose its tested PQC amendments, targeting full-scale transition following community approval.
Advantage over Bitcoin and Ethereum
Compared to Bitcoin and Ethereum, Ripple boasts native key rotation. In the event of a quantum security threat, this feature allows users to change their cryptographic keys without moving their funds to new addresses.
Additionally, XRPL’s average block time is just 3-5 seconds. This greatly minimizes the time a user’s public key is visible to quantum computers during transaction processing. In comparison, Ethereum and Bitcoin’s average block times are 12 seconds and 10 minutes, respectively.
At press time, XRP was trading at $1.43, up 0.95% in the day. Cardano’s Charles Hoskinson has alleged that Cardano’s underperformance is partly due to Ripple selling XRP to advance its own business.
While April has been one of the turbulent months for the crypto markets, it has been one of the stronger months for Bitcoin. The monthly returns of the star crypto have exceeded 10% for the first time in the past 10 months, mainly after undergoing 5 straight bearish months followed by a rebound in March. This time is no different. Despite a turbulent backdrop marked by DeFi exploits, including disruptions across AAVE, RAVE, and other protocols, the BTC price has continued to move higher.
Price has rebounded sharply from recent lows near $65,000, climbing back toward the $75,000–$78,000 range, signaling underlying strength even as broader market sentiment remains fragile. What stands out is not just the recovery but the timing. Bitcoin often sees stabilization after a weak Q1, with momentum building into April and beyond.
The key question now isn’t whether Bitcoin has recovered but whether this strength can extend into the coming weeks or if the current move is simply another phase within a broader volatile cycle.
Bullish Scenario for the Bitcoin Price Rally
Bitcoin is beginning to show signs of structural recovery after weeks of volatility. Following a sharp decline toward the $65,000 region, the price has steadily rebounded, now consolidating near the $75,000 zone. The chart highlights a clear shift from downside pressure to early recovery, but not a confirmed uptrend yet.
Bitcoin has printed a rounded base near the $63K–$65K region, followed by another higher low, indicating buyers are stepping in earlier on each dip. The price is holding above the range between $74,000 and $75,000 that has previously acted as support and resistance at different intervals. Besides, the rally has risen above the Gaussian channel, which is believed to flip bullish if it holds above the range. Moreover, the RSI remains incremental, which backs the bullish claim with an aim to reach $85,000 in the coming weeks.
Bearish Scenario for the Bitcoin Price Rally
The Bitcoin price is moving within a rising channel, yet the recent rejection near the upper boundary signals exhaustion rather than strength, especially as momentum begins to fade. The MACD is curling toward a bearish crossover, suggesting that buying pressure is weakening, while the inability to decisively break above the $78,000 resistance reinforces the risk of a lower high forming within a broader downtrend.
Besides, the Chaikin Money Flow (CMF) remains only marginally positive and lacks strong expansion, indicating that capital inflows are weak and not convincingly supporting the rally.
If this channel breaks to the downside, particularly with a move below the $72,000–$70,000 region, it would invalidate the recovery structure and likely trigger a deeper correction back toward the $65,000 zone. The current setup, therefore, leans less toward continuation and more toward a potential breakdown scenario, where the rising channel acts as a temporary relief rally rather than the start of a sustained uptrend.
What’s Next for the Bitcoin (BTC) Price Rally?
Bitcoin’s performance this month reflects a market that has absorbed significant stress yet continues to hold strength, with April’s historical trend still playing out. The rebound from $65,000 to the $75,000–$78,000 range highlights resilience, but the price structure suggests the move is still being tested rather than confirmed. The recovery has pushed BTC back into a key range, where upside attempts are now meeting visible resistance.
At the same time, the rising channel structure indicates that the current move could still be corrective rather than impulsive. Repeated hesitation near the upper boundary shows that buyers are not yet in full control, keeping the risk of a pullback intact. If the BTC price fails to sustain above the $75,000 region, the structure could weaken quickly, opening the door for a move back toward lower support levels near $70,000 and even $65,000.
Charles Hoskinson has delivered one of his most pointed critiques of Ripple and XRP’s tokenomic structure, arguing that nothing in Ripple’s business model creates organic buy demand for the XRP token and that holders are essentially funding a private company with no obligation to return value to them.
“There is nothing in the Ripple network that creates buy demand for the XRP token,” Hoskinson said during a recent discussion. “Nothing.”
The Argument
Hoskinson’s critique centres on a fundamental structural distinction between tokens that create circular economies and tokens that primarily serve as fundraising instruments for the companies behind them.
His comparison point is Hyperliquid. When users interact with the Hyperliquid ecosystem, activity generates fees that are used to buy back the underlying token. Network usage directly creates token demand. Value flows to holders as the network grows.
XRP, he argues, works differently. Ripple is a private company with independent investors and shareholders. When Ripple generates revenue, it does not buy back XRP. It sells XRP, converts the proceeds to cash and uses that cash to acquire assets for the company. The prime broker, the custody platform, the treasury management tools — all of that value sits on Ripple’s balance sheet, not in the hands of XRP holders.
“When they do make revenue and profit, there are no buybacks,” he said. “The Ripple company is not going and buying back XRP. They sell the XRP.”
The Regulatory Game Behind It All
Hoskinson extended his critique beyond tokenomics into regulatory strategy, arguing that Ripple’s aggressive push to classify all new crypto projects as securities by default is designed to cement incumbent advantages permanently.
Bitcoin, Ethereum, XRP and Cardano are all grandfathered in as commodities under existing frameworks. Every new project that launches faces security classification by default, which means it cannot get listed, cannot access liquidity and cannot broaden its ownership base enough to ever qualify as a mature blockchain commodity.
“The incumbents basically get a monopoly, an oligarchy, and they’re grandfathered in,” Hoskinson said. “The new projects never get anything. That feels like Wall Street.”
The argument is that regulatory clarity, as currently being pushed by established players, is not a rising tide that lifts all boats. It is a drawbridge being pulled up behind the projects that are already across.
Bitcoin crossed $78,000 on April 17 for the first time since early February, but Arthur Hayes is not ready to call it a recovery. The BitMEX co-founder and Maelstrom chief investment officer told Coinpedia that the market is in a relief rally and that sustained upside requires one specific catalyst that has not arrived yet.
“We are going to chop around $60,000 to $90,000 until we get an enormous increase in the pace of central bank money printing, led by the Fed,” Hayes said.
Why the Fed Is the Only Catalyst That Matters
Hayes laid out two scenarios that would force the Fed’s hand. The first is consumer credit deterioration driven by AI-related job losses among knowledge workers, which would create impaired assets on bank balance sheets requiring a bailout.
The second is rising government spending tied to wartime financing needs that the market cannot absorb without printed money.
Until one of those two things happens, Hayes sees limited upside regardless of how the geopolitical situation develops.
“I believe this is a relief rally,” he said when asked whether Bitcoin’s test of important resistance was the beginning of a sustained move. “Until we get a large increase in central bank money printing, there is limited upside, even if the worst of the US-Iran war is over.”
The framing is consistent with his broader thesis that Bitcoin’s price is determined by the quantity of money in the system rather than interest rates or risk sentiment. A relief rally can push prices toward the upper end of the range. Only a genuine expansion of the money supply changes the range itself.
Highest Conviction: Still Bitcoin
Asked which asset in the current top ten commands his highest conviction, Hayes said, “The majority of my wealth is still stored in Bitcoin,” he said. “Out of the top ten, I have the highest conviction in Bitcoin.”
He did not elaborate on his views for Ethereum, Solana or XRP beyond placing Bitcoin clearly at the top of his hierarchy. His long-running position in Hyperliquid, which sits outside the top ten, remains his most notable non-Bitcoin allocation.
Hence, as for now, Bitcoin is up from its February lows and testing resistance for the first time in months. Hayes is watching one number above all others, not the Bitcoin price, but the Fed’s balance sheet.
ZEC price isn’t quietly trending but it’s stepping into a full-blown liquidity war. After months of suffocating under a descending triangle, ZEC price finally snapped the structure in early April, and yeah, it didn’t tiptoe either. The breakout shoved price action toward $400, effectively flipping the script on a long-term bearish trend that had been in control since late 2025.
But don’t get too comfortable on this rally. This isn’t a clean rally it’s messy, crowded, and very clearly dominated by whales.
ZEC Breakout Ends Months of Downtrend Pressure
The daily chart tells a straightforward story at first glance: a decisive breakout from a descending triangle, followed by a strong push higher. That move alone was enough to neutralize months of downward pressure. Easy narrative, right?
Well, price didn’t just keep running. It stalled. Instead of continuation, ZEC/USD slipped into a choppy range between $300 and $400. That’s not random. That’s where the real players showed up.
Whale Clusters Define Critical Support and Resistance
Zoom into the data, and things get interesting fast. Around the $300 level, there’s a heavy concentration of large buy orders with massive green clusters showing consistent whale accumulation. These aren’t casual trades. They’re deliberate, repeated entries, signaling that big players see $300 as a key re-entry zone.
In other words, it’s not just support it’s defended territory, at least it looks intact for now.
Now flip the script. Up near $400, the tone changes completely. Red clusters dominate, showing aggressive sell-side activity. Add to that the presence of large, persistent sell orders sitting at $410 and $430 for over ten days, and it’s clear: whales aren’t just taking profits they’re building a wall.
Order Book Reveals Where Next Volatility Hits
And then there’s the deeper layer the order book. Multiple pending orders exceeding $500,000 are scattered across key levels, with notable buy interest sitting around $290 and even as low as $175. These aren’t decorative numbers; they’re potential magnets for price.
So, what does that mean? If ZEC price dips and fills those $290 buy orders while open interest climbs, it likely signals fresh long positioning. That’s fuel. Real fuel. The kind that could drive a second leg higher, possibly toward the $636 macro target marked on the chart.
But let’s be real none of that matters if $300 support zone breaks cleanly.
ZEC Price Hinges on Whale Commitment at $300
Right now, Zcash price is hovering just above short-term moving averages, sitting dangerously close to that $300 cluster. This is where conviction gets tested. If the buy-side pressure holds and absorbs the sell orders stacked above, the structure leans bullish.
If not? Those lower liquidity pockets start looking very attractive. So, what’s next? Watch the whales. Not the headlines, not the hype but the actual orders. Because in this ZEC price setup, they’re not just participating in the market… they’re controlling it.
CHZ price just woke up with a sharp 10% intraday spike has pushed the token back into trader conversations, and this time, it’s not just technical noise. There’s a narrative building, and like always in crypto, that’s half the battle. The trigger? A clear push toward the U.S. sports market.
U.S. Expansion Narrative Fuels CHZ Price Momentum
Chiliz isn’t playing small anymore. After generating over $700 million for the sports industry through Fan Tokens, the project is now setting its sights on the United States. That’s not a casual move because it’s kind of a statement.
We have generated over $700M+ for the sports industry through Fan Tokens.
70+ top-tier clubs including FC Barcelona, Arsenal, Manchester City, PSG, Atlético Madrid, AC Milan, and Juventus have already launched their Fan Tokens.
— Chiliz – The Sports Blockchain (@Chiliz) April 19, 2026
And they’ve got the resume to back it. More than 70 top-tier clubs as they say including giants like FC Barcelona, Arsenal, Manchester City, PSG, Atlético Madrid, AC Milan, and Juventus have already launched Fan Tokens. That’s a serious footprint in global sports.
Now the pitch is simple: replicate that success in the U.S. Naturally if succeeds, CHZ prices will react. Fast.
SportFi Vision Expands Beyond Basic Fan Tokens
But here’s where things get interesting. Chiliz isn’t just selling tokens anymore they’re framing an entire category. “SportFi.”
According to the latest post, the chain isn’t trying to be a general-purpose network. It’s positioning itself as the global settlement layer for sports-based finance. Fan Tokens? Just the entry point.
We didn’t build a general-purpose chain. We built the global settlement layer for SportFi.
And Fan Tokens are the entry point to SportFi.
Next up: Fan Token Play. A new layer where on-pitch results meet tokenomics.@bitget breaks it down https://t.co/9m6JmpHaqD
— Chiliz – The Sports Blockchain (@Chiliz) April 20, 2026
And then comes the next layer: Fan Token Play. That’s where things shift from passive holding to active engagement where on-pitch results directly tie into tokenomics. It’s a bold concept, blending real-world sports outcomes with blockchain incentives. Whether it sticks… well, that’s another story.
Technical Indicators Align With Uptrend Structure
Now let’s talk charts, because hype alone doesn’t move markets but structure does.
CHZ price is currently climbing along an upward trendline, and so far, it’s respecting it. That’s a good sign for bulls, at least in the short term.
Volume data shows a fairly balanced fight: around 16.42 million in sell volume versus 15.79 million in buy volume. Not a runaway rally but not weak either.
Meanwhile, the Whale vs Retail Delta is sitting positive at 19.020, suggesting larger players are leaning slightly bullish. That’s usually where momentum starts to build.
Indicators aren’t asleep either. CMF is hovering around -0.11 still slightly negative, but not collapsing. RSI sits near 61.9, which puts CHZ in a “healthy but not overheated” zone. There’s room to run… if buyers stay interested.
CHZ Price Riding Narrative But Needs Follow-Through
So, this move is being driven by narrative and momentum working together. That’s powerful… but also fragile.
If the U.S. expansion story gains traction and SportFi actually delivers something tangible, CHZ price could keep grinding higher along that trendline.
But let’s be real if momentum fades, this could just as easily stall out. For now, CHZ price is moving up, backed by both headlines and technical structure.
Two days after the largest DeFi hack of 2026 drained $292 million from a bridge and sent $6.6 billion fleeing from Aave, Vitalik Buterin took the stage in Hong Kong and made the case for why Ethereum was built the way it was.
The timing was not lost on anyone in the room.
Vitalik’s Message Is Clear: Security Over Speed
Speaking at the opening ceremony of the 2026 Hong Kong Web3 Carnival, Buterin described Ethereum as a “world computer” – not a payments network competing on transactions per second, but a platform for verifiable data and shared digital assets where users control their own security.
That framing is a direct answer to the criticism Ethereum has faced for years. While Solana and other chains chase throughput, Buterin is doubling down on something different: trustworthiness.
Inside Ethereum’s Roadmap
Buterin laid out a three-layer plan.
In the short term, Ethereum is focused on scaling the gas limit, rolling out zkEVM, and beginning preparation for the post-quantum era. zkEVM allows Ethereum to perform more complex computations while keeping on-chain information verifiable – scaling without sacrificing transparency.
In the mid term, the goal is reducing transaction finality to between 10 and 20 seconds. Today that process takes roughly 16 minutes.
The long-term vision is the most ambitious: full quantum resistance, formal verification of the entire protocol, and maximised decentralisation. Buterin wants Ethereum to be verifiable by anyone on any device.
“zkVM allows you to verify the chain without relying on a large computer to run all operations yourself,” he said. “Everyone should verify the chain before you trust it; even your phone and IoT devices should verify the chain.”
The $292M Hack That Made Vitalik’s Argument For Him
The rsETH exploit on April 18 exposed exactly the kind of cross-chain bridge complexity Ethereum has historically been cautious about. An attacker used a single-verifier configuration on a LayerZero bridge to mint 116,500 unbacked rsETH tokens, deposit them on Aave as collateral, and walk away with real ETH. The fallout froze markets, trapped depositors, and raised uncomfortable questions about DeFi’s composability risk.
Buterin did not address the hack directly. He did not need to.
A roadmap built around security, decentralisation, and verifiability is the answer. The critics who say Ethereum moves too slowly might want to ask how a faster, less decentralised Ethereum would have handled Saturday.
Pi Network’s Protocol 22 upgrade deadline is just days away, and millions of Pi holders are hoping that Pi coin price will see a pump before the deadline.
As of now, Pi Coin (PI) is currently trading around $0.17, showing only a small gain as rising US–Iran tensions continue to hurt investor sentiment and keep trading cautious.
Pi Network Protocol 22 Upgrade Deadline Approaches April 27
According to the official confirmation from Pi Network developers, all node operators must complete the mandatory upgrade to Protocol 22.1 by April 27, 2026.
Nodes that fail to transition from version 21.2 will face automatic disconnection from the network.
This is more than just a routine update. It prepares the network for the upcoming Protocol 23 upgrade in May, which is expected to introduce full smart contract functionality.
Geopolitical Tensions Are Keeping PI Price Suppressed For Now
Despite the upgrade excitement, Pi Coin’s price is still under pressure due to global market weakness. Rising US–Iran tensions, especially around the Strait of Hormuz, have triggered a broader risk-off sentiment.
The situation worsened after Iran refused to resume peace talks unless the US lifts its blockade, followed by the US seizure of an Iranian-flagged cargo ship. This has added more uncertainty to the markets.
This “risk-off” environment is limiting buying activity in smaller tokens like Pi, and even Bitcoin is struggling to break above $76K.
Will Pi Network Coin Price Pump?
Historically, major network upgrades have acted as short-term price catalysts for the Pi token. At the time of the second migration event on March 28 triggered a 3.8% rally, and ahead of Pi Day, the token surged nearly 15%.
With the upgrade deadline now closed, similar pre-event buying activity could return. In fact, early signs are already visible.
A large outflow of over 1.7 million PI tokens from OKX suggests that some holders are moving their coins off exchanges, often seen as a sign that they are not planning to sell anytime soon.
Any bullish rally will test Pi day’s high price of $0.22, which will set the stage for further rally.
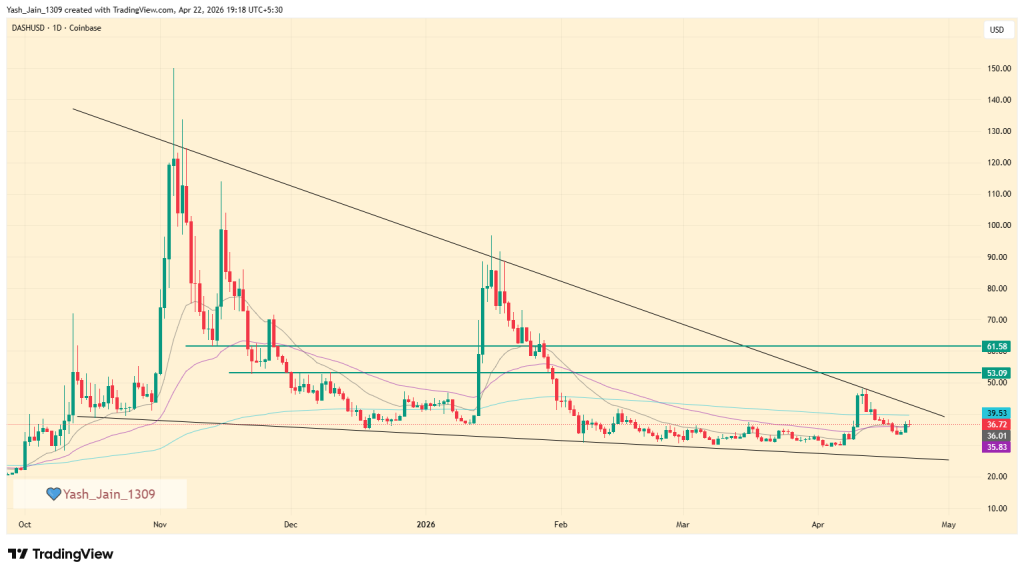


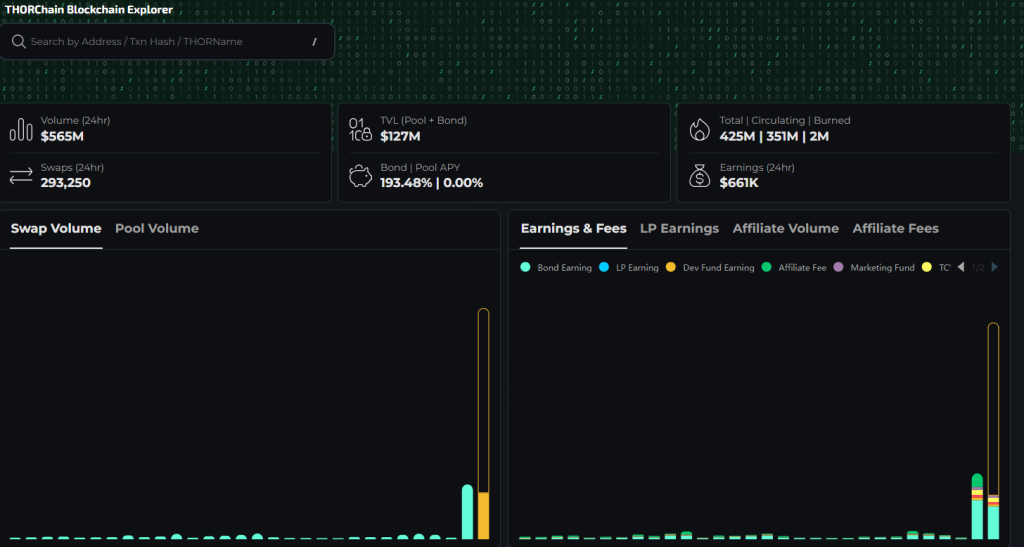
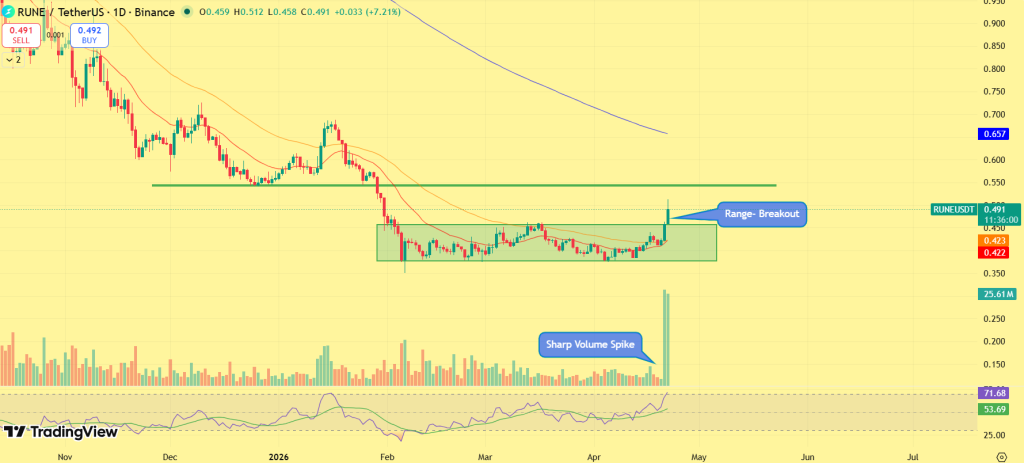
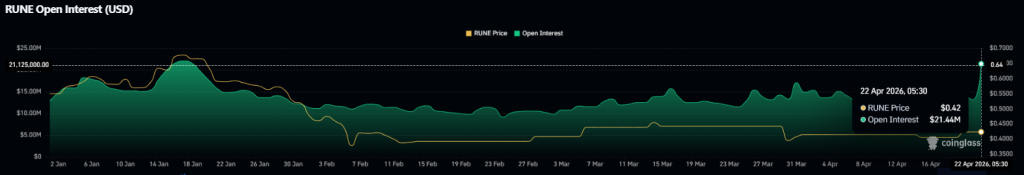
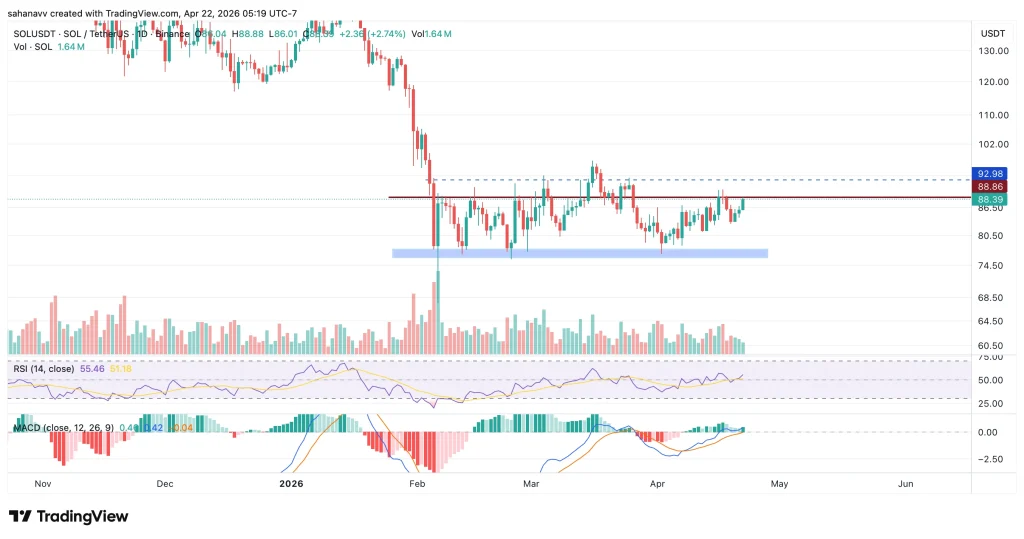

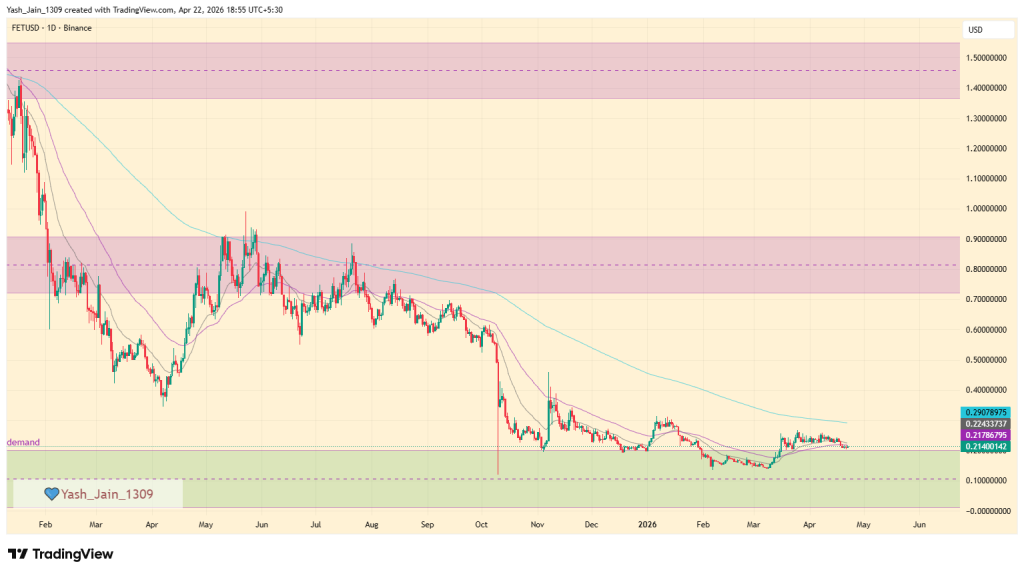
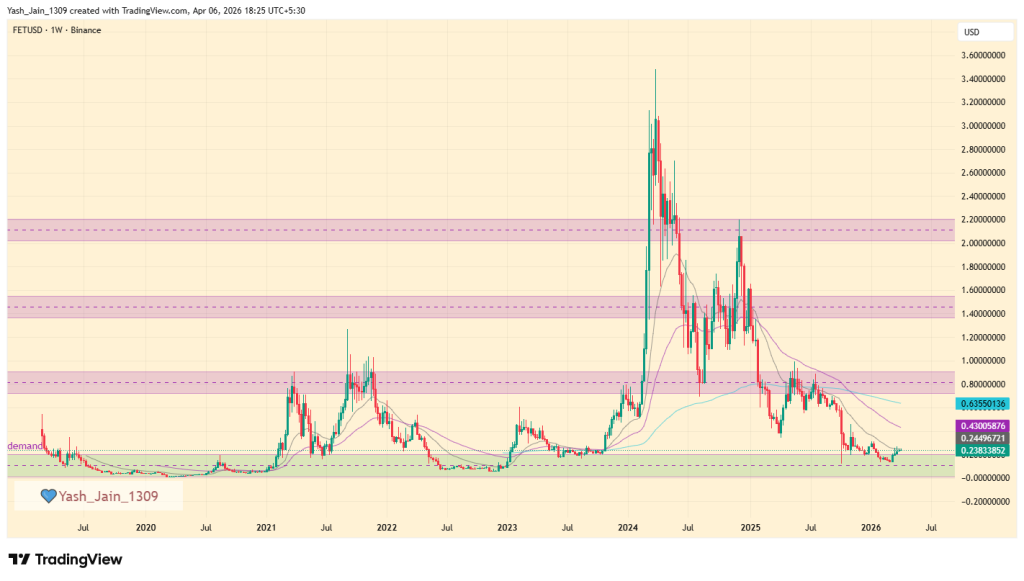
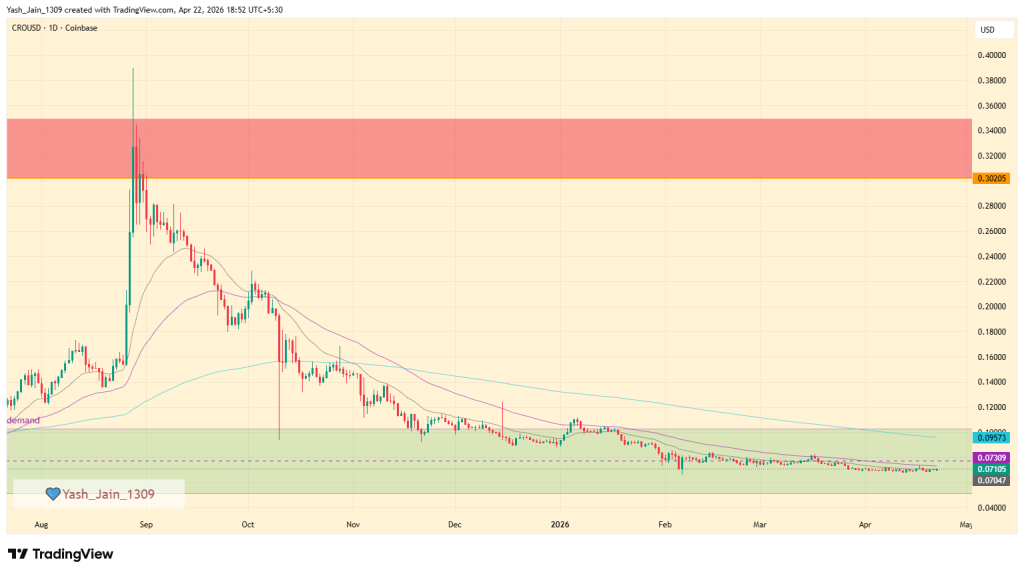
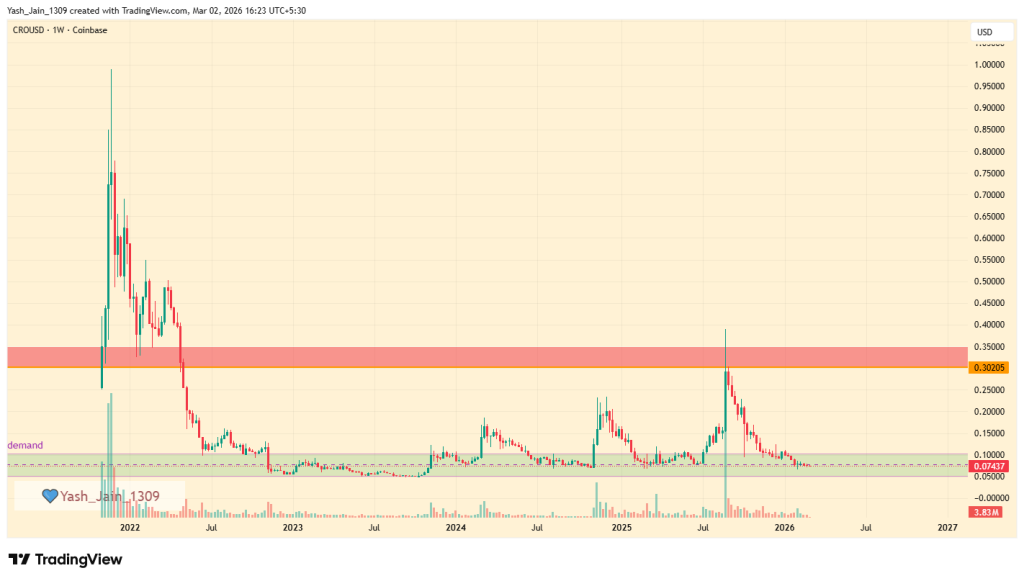
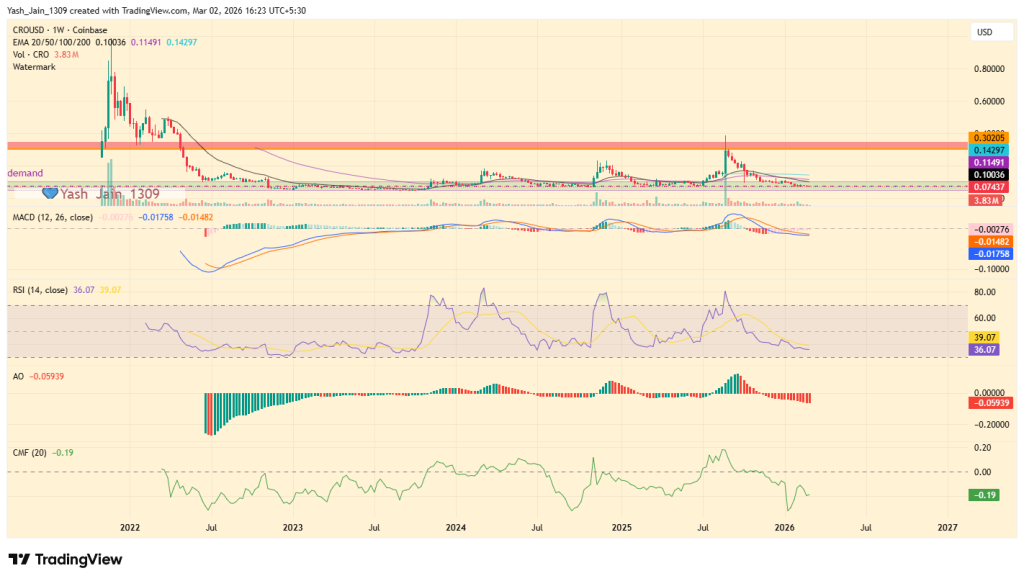
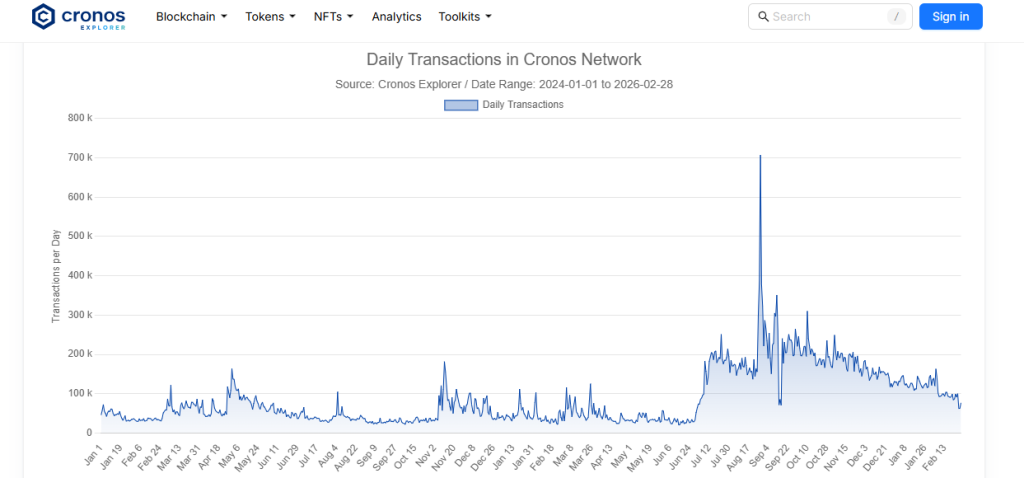


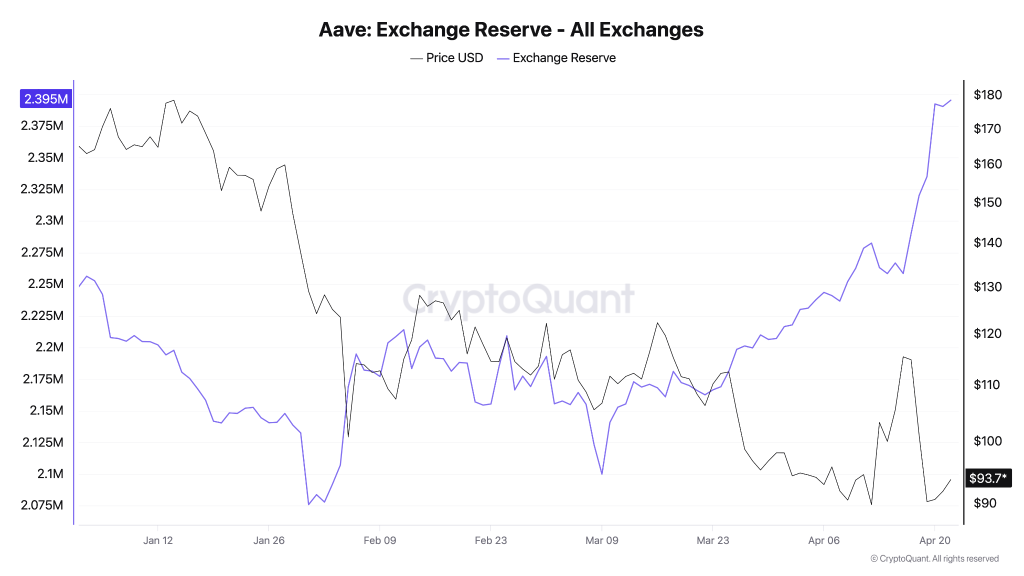
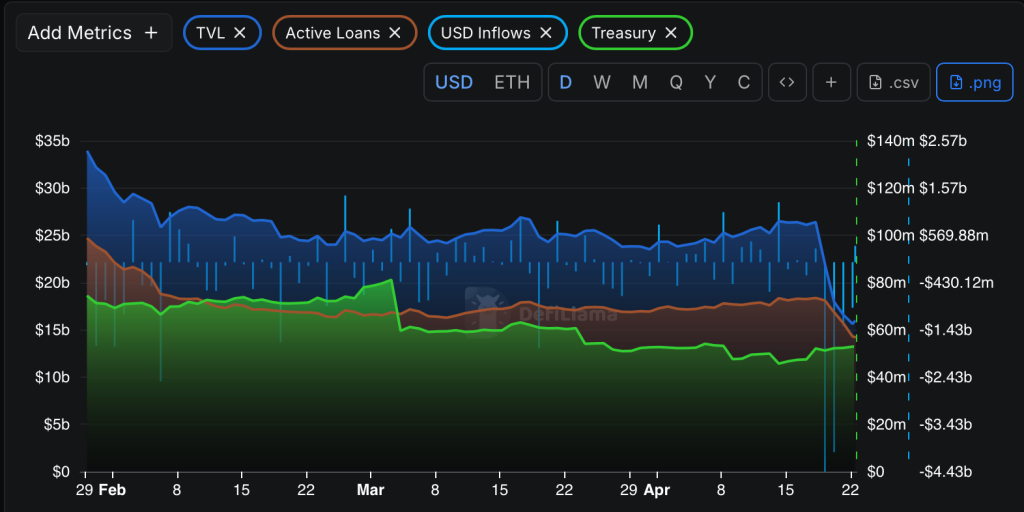
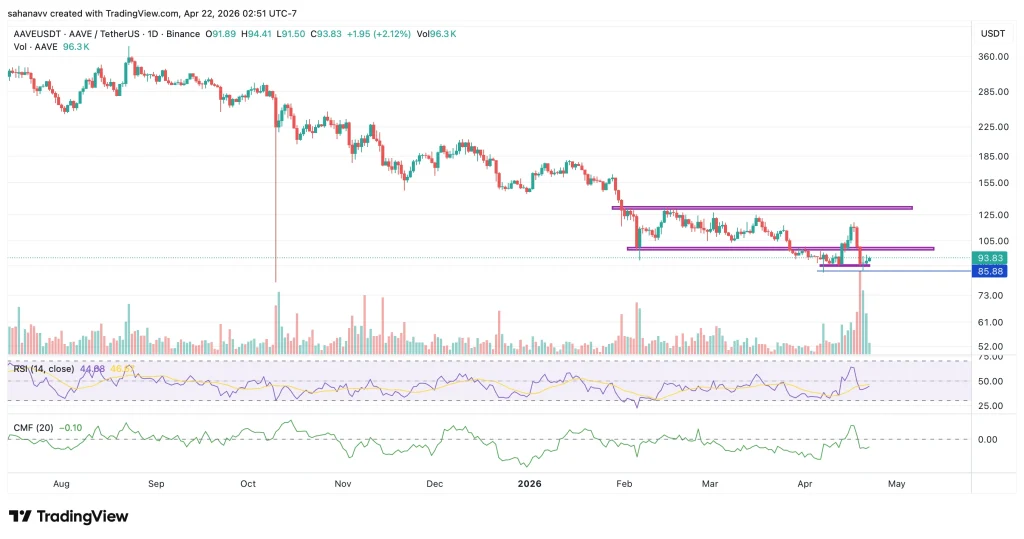

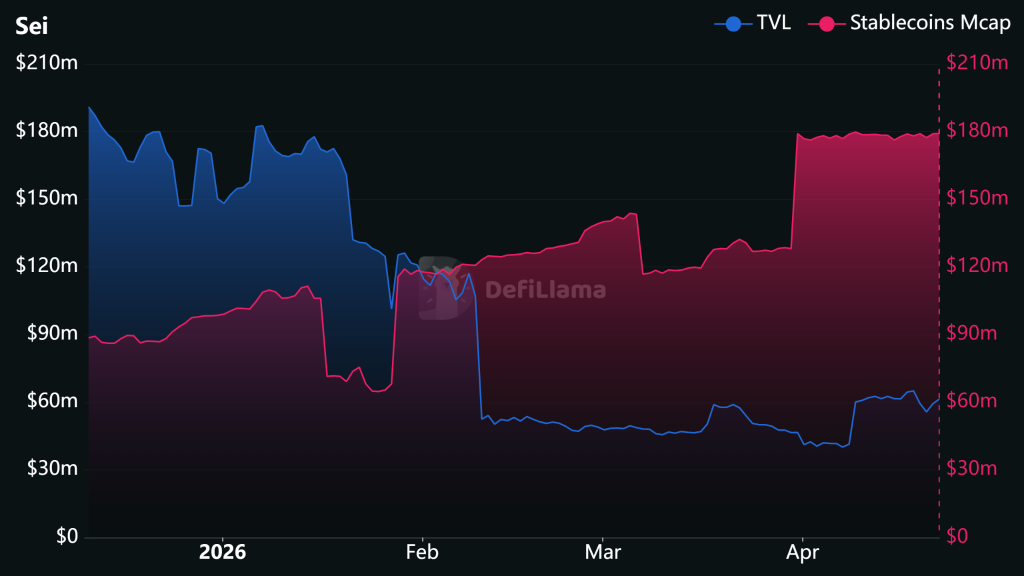
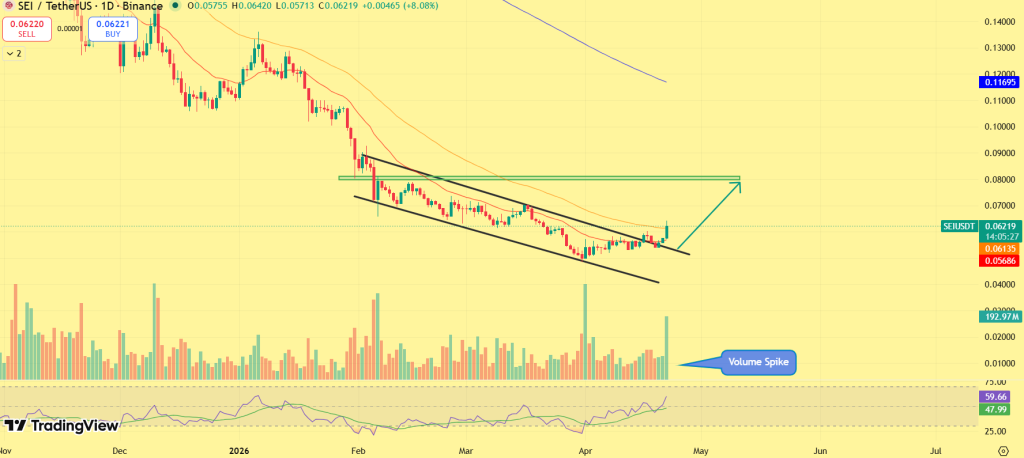
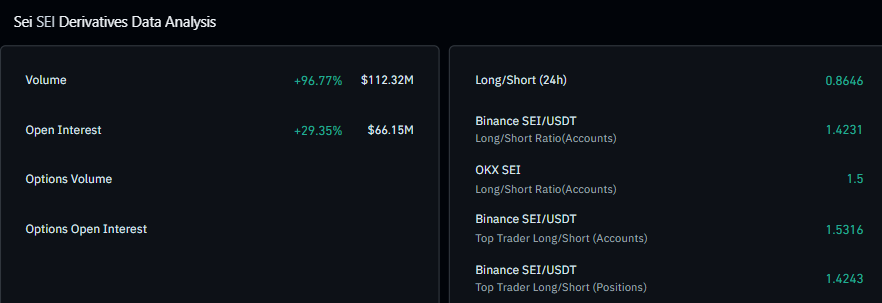

 Russia just "PASSED" the crypto regulation bill to allow businesses and companies to use crypto as payment for cross-border and foreign trade settlements, even under sanctions.
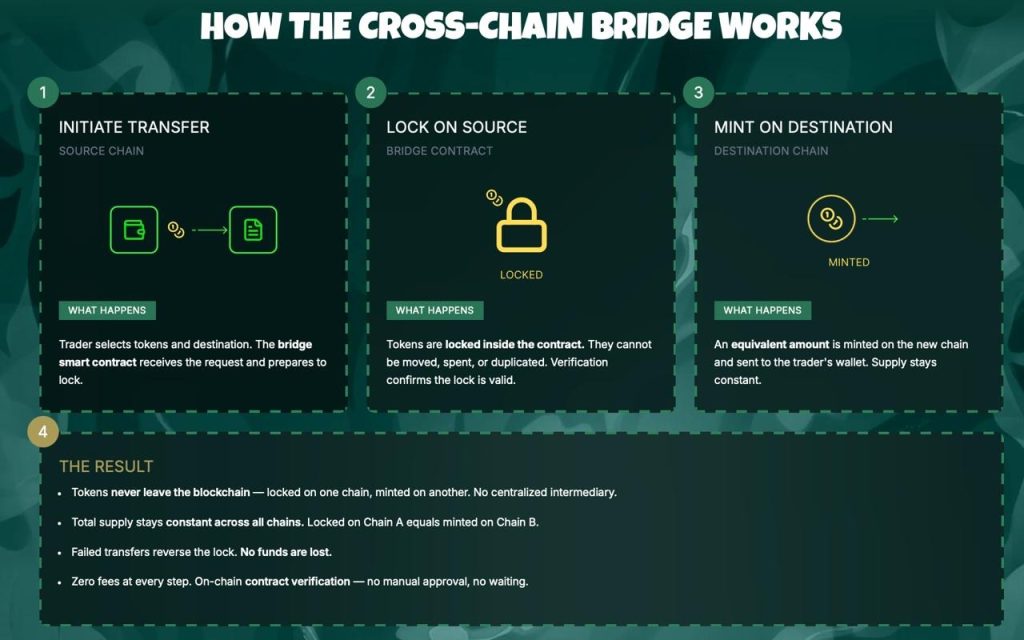
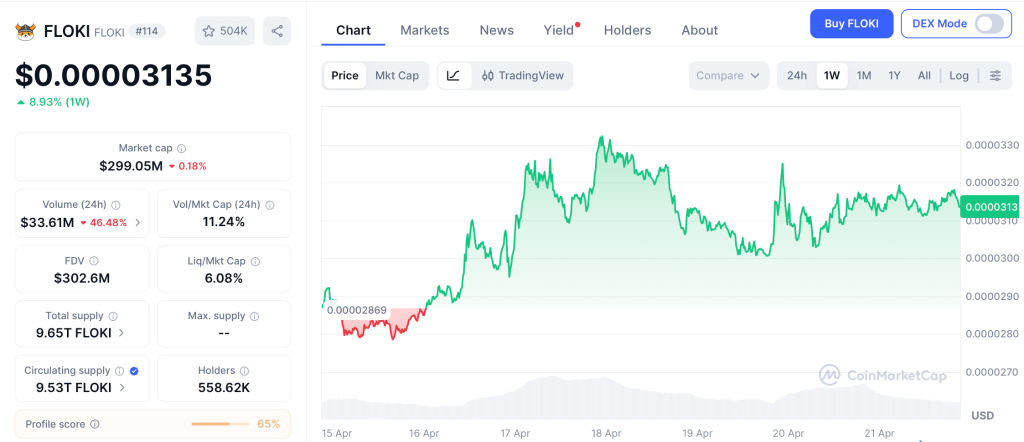

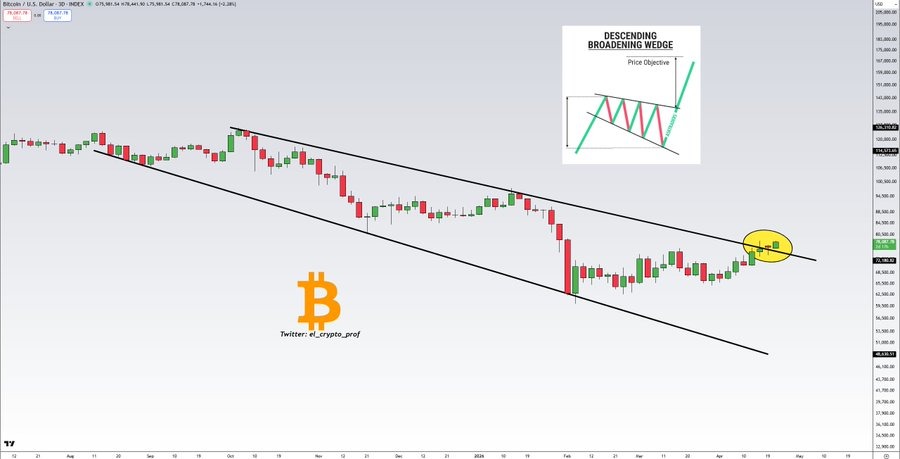


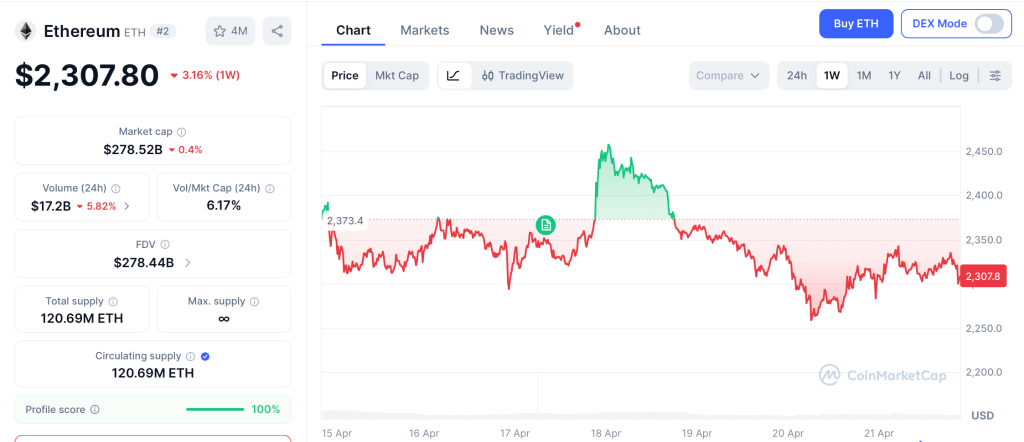


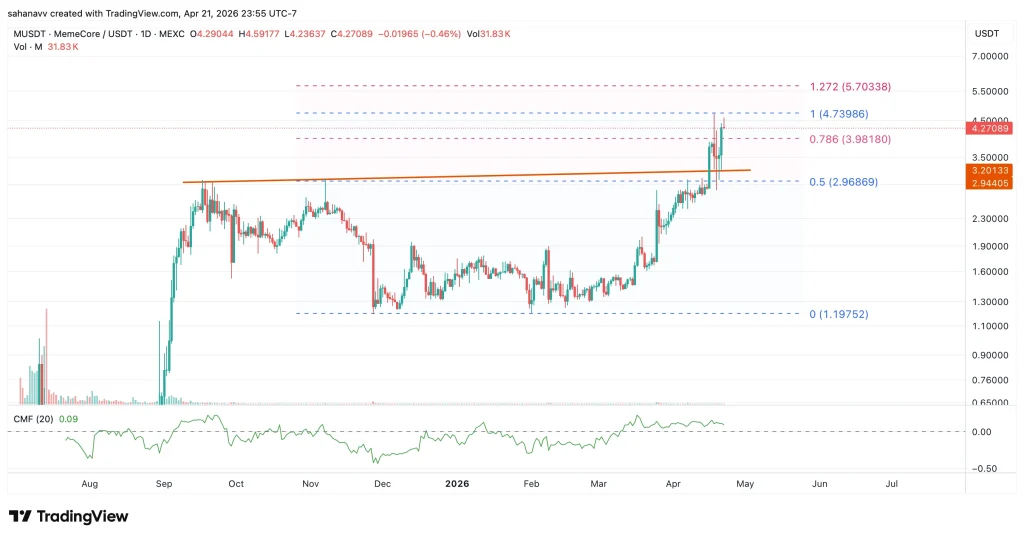
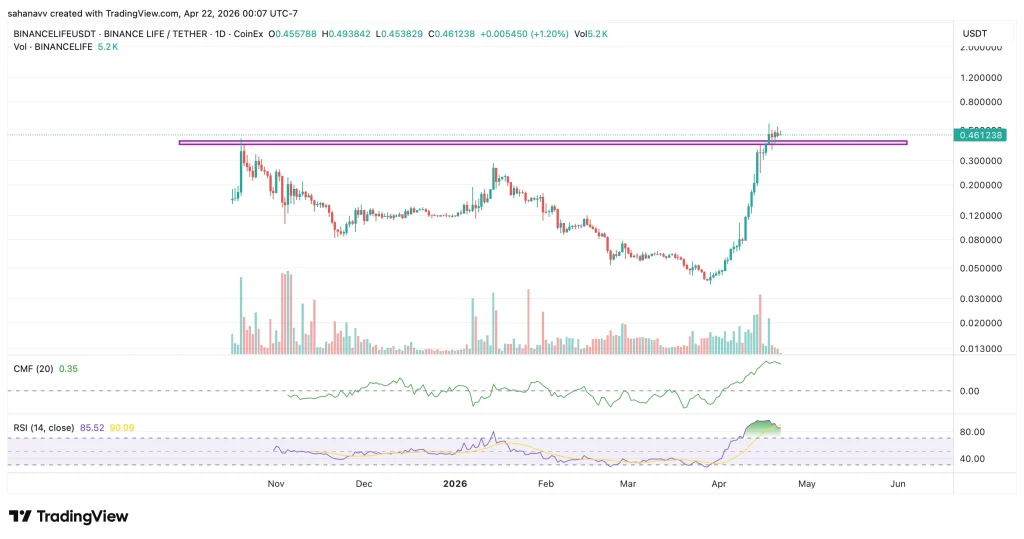
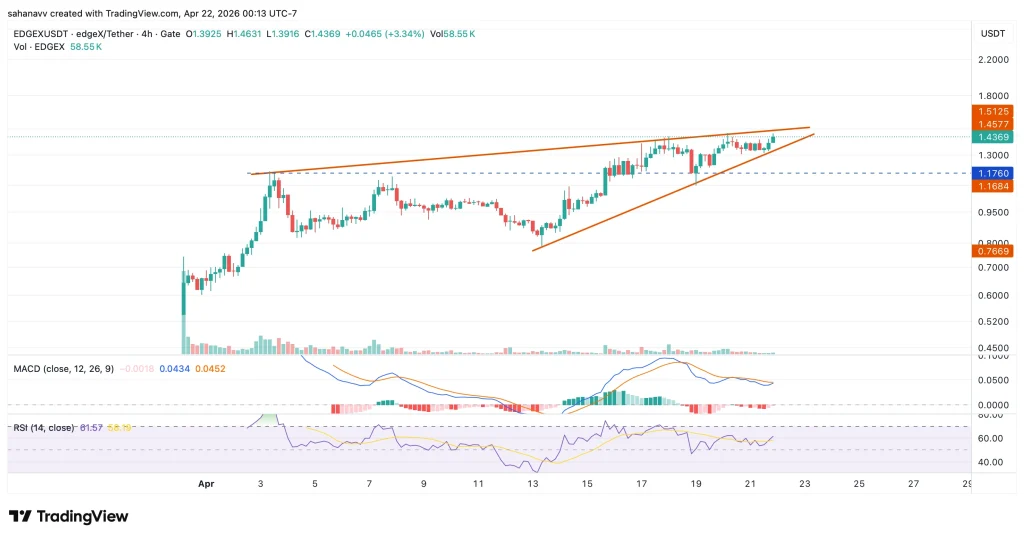
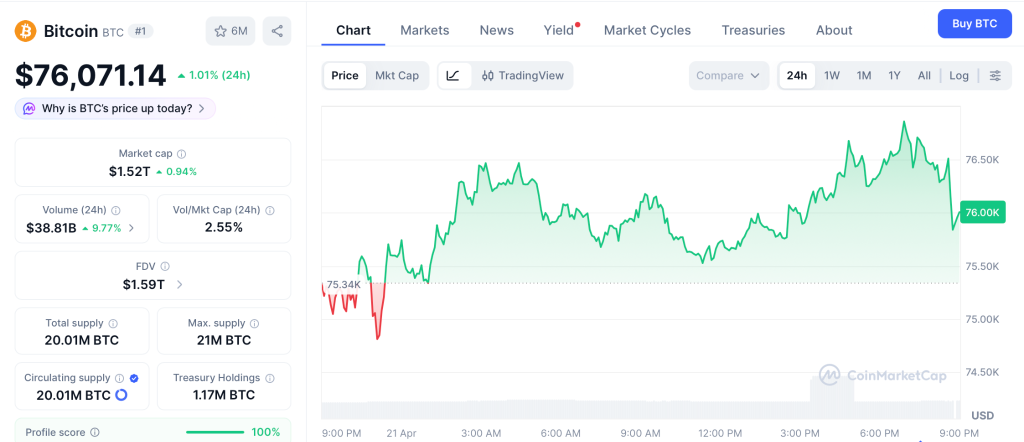

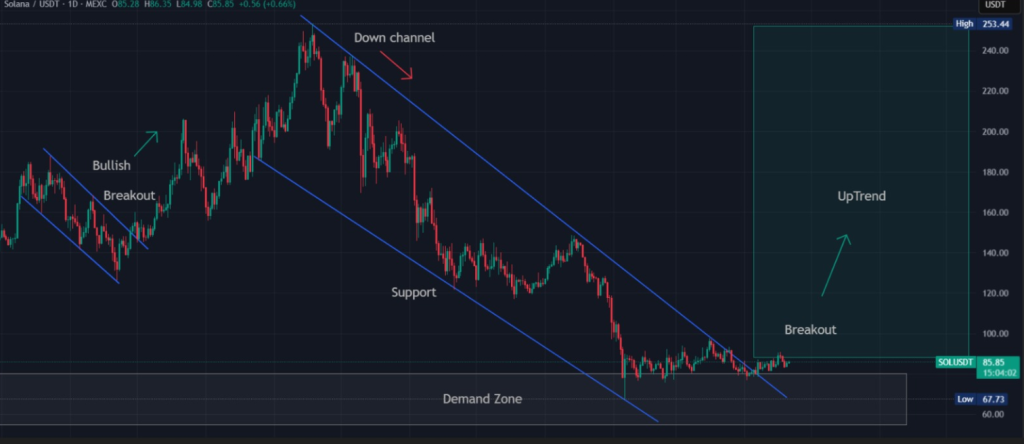


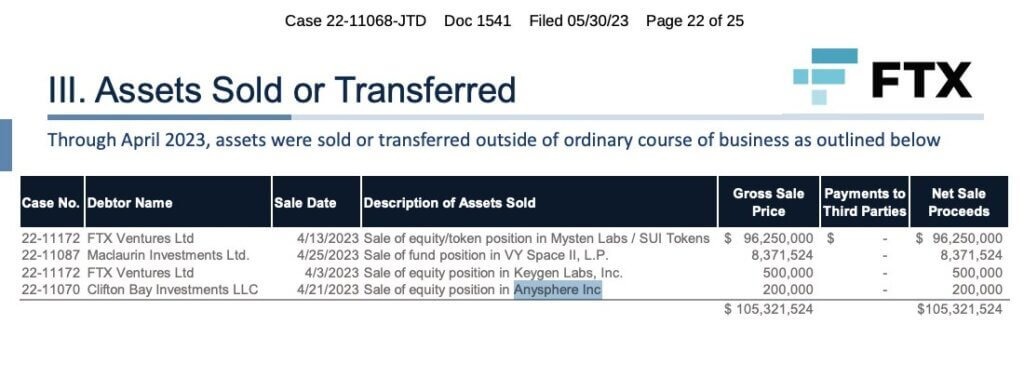


 (@justinsuntron)

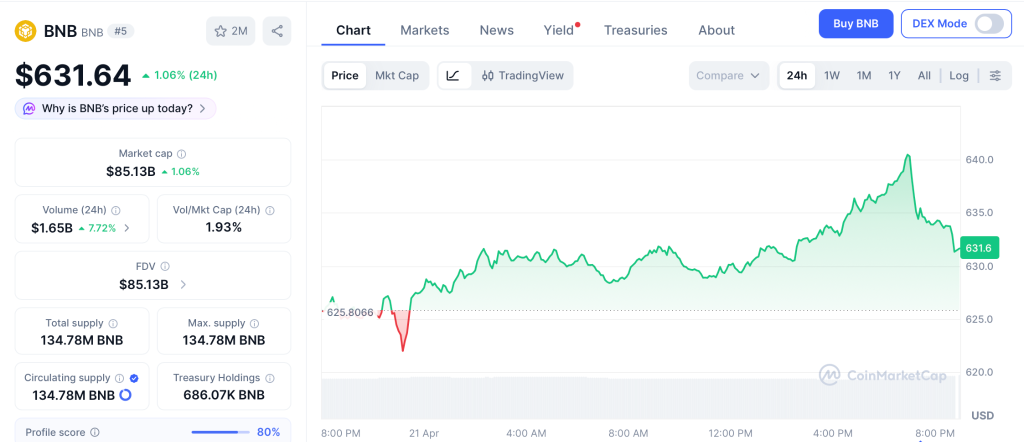

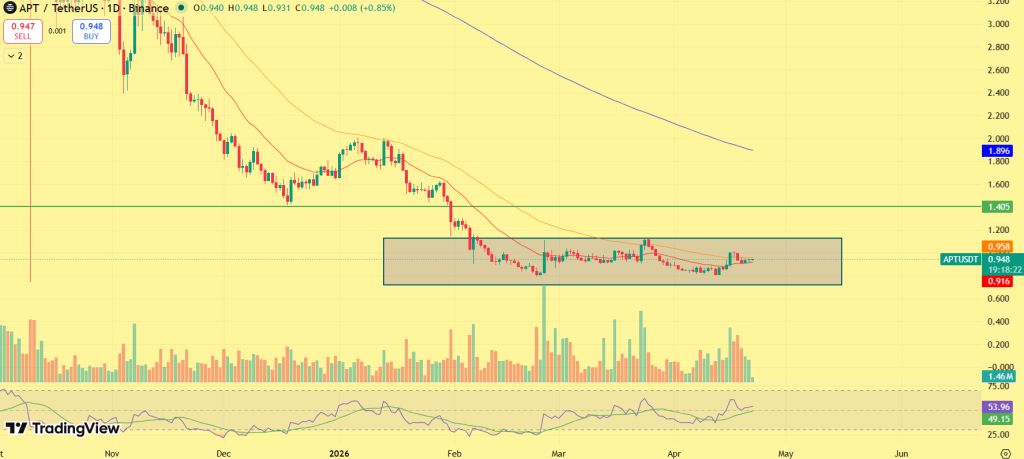
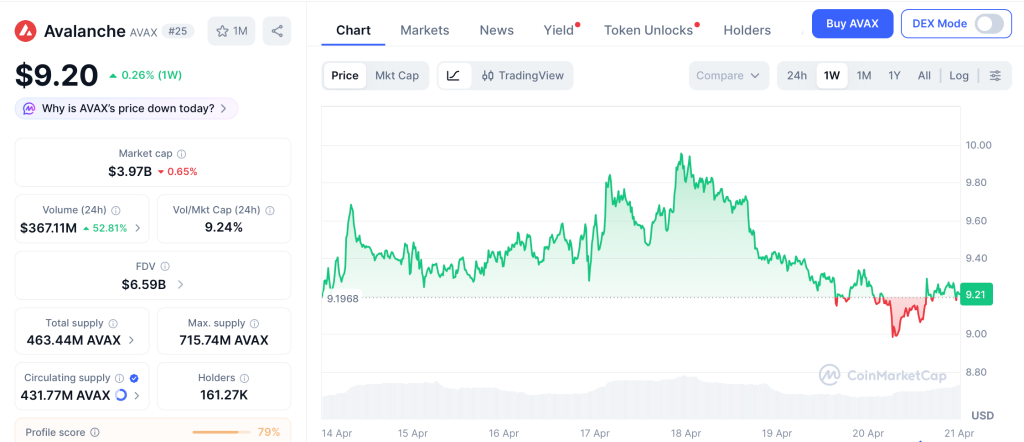


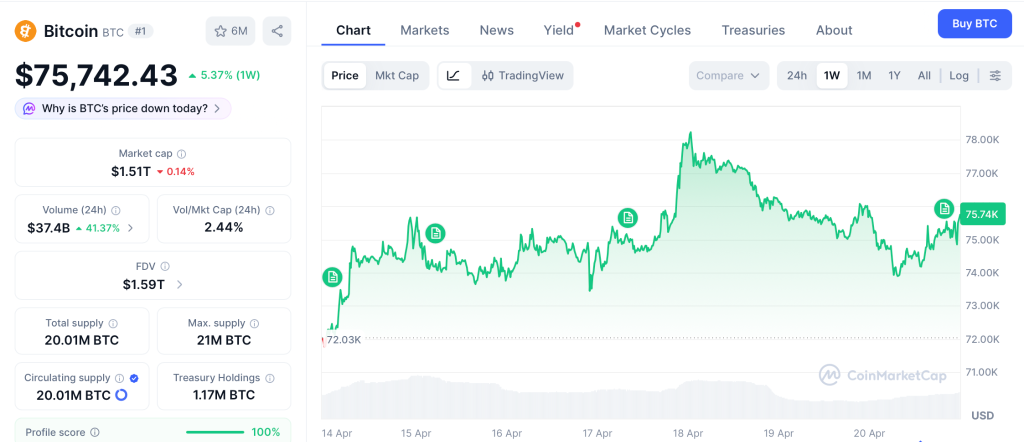
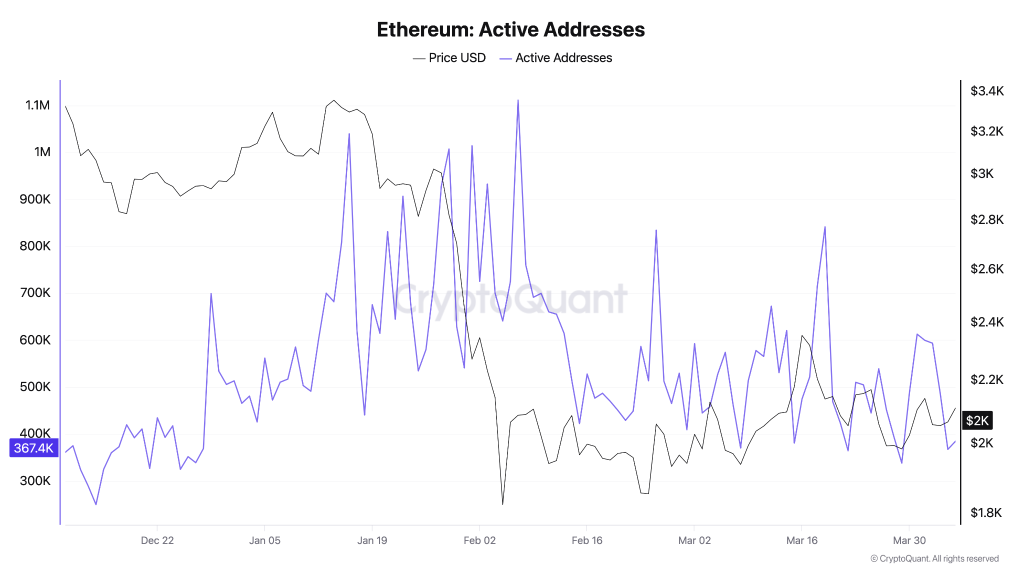
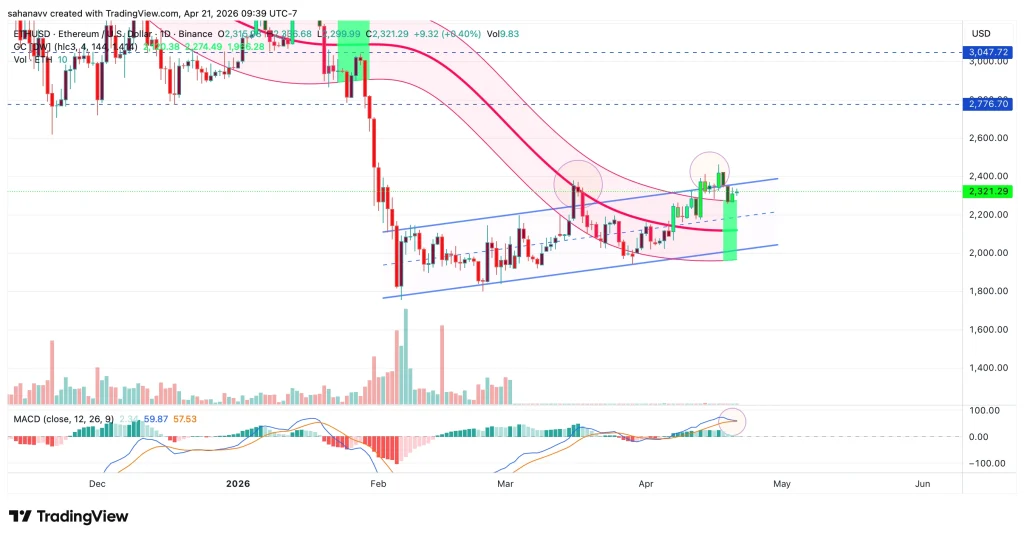
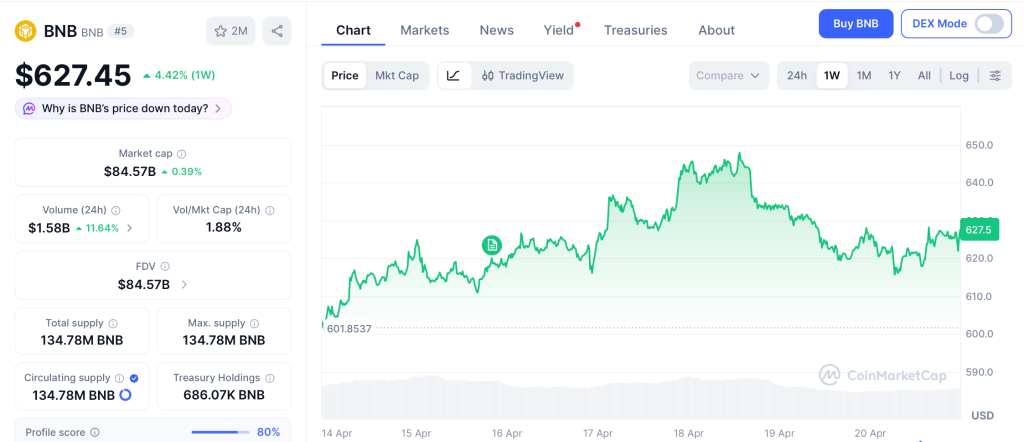

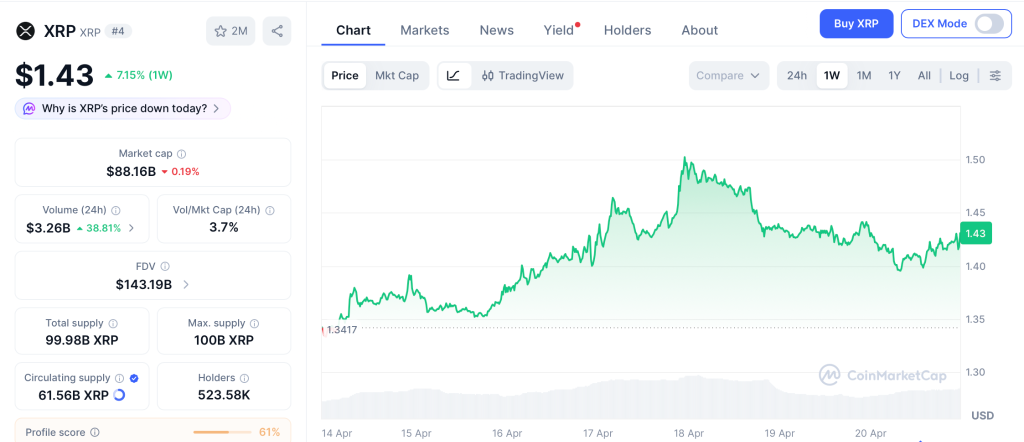

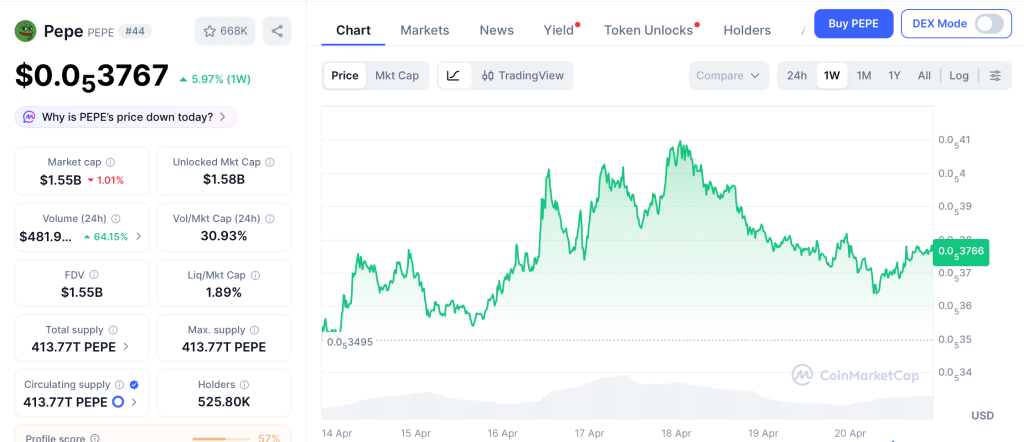
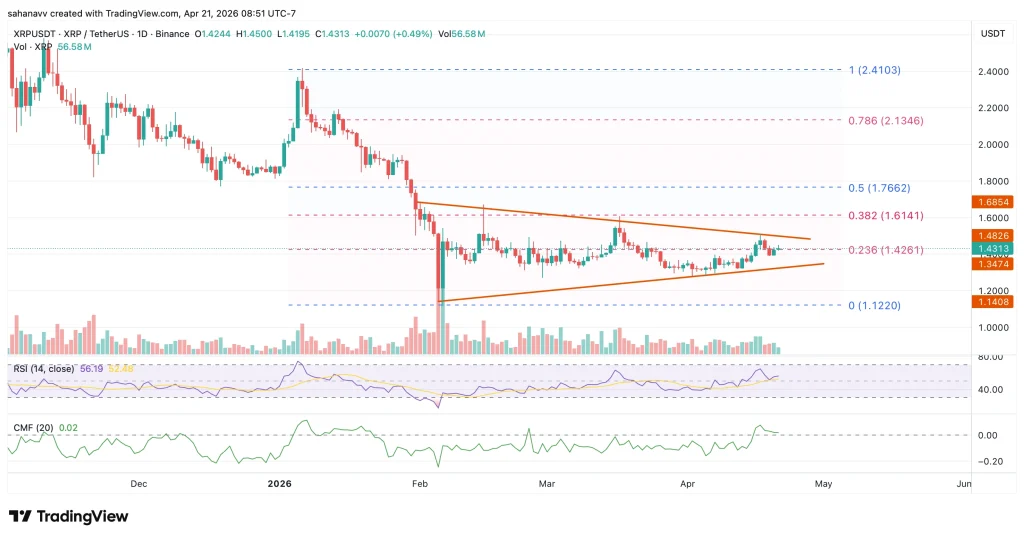


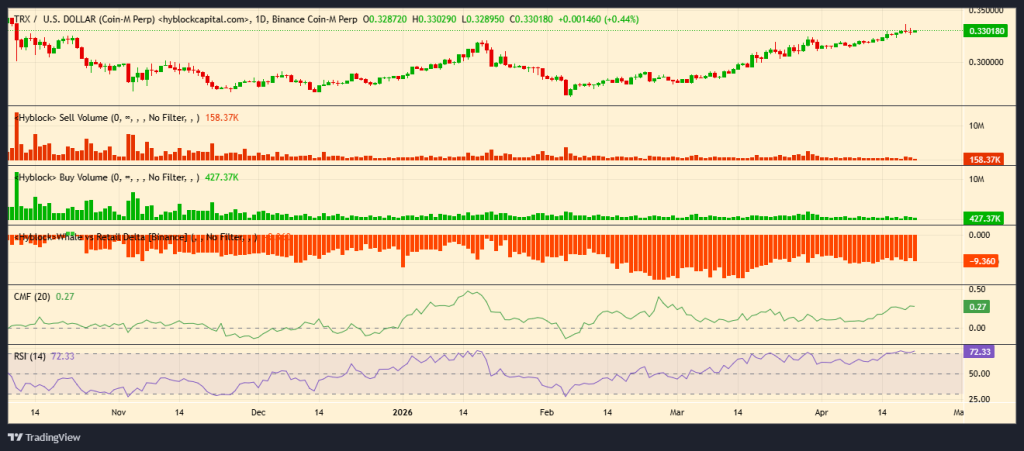

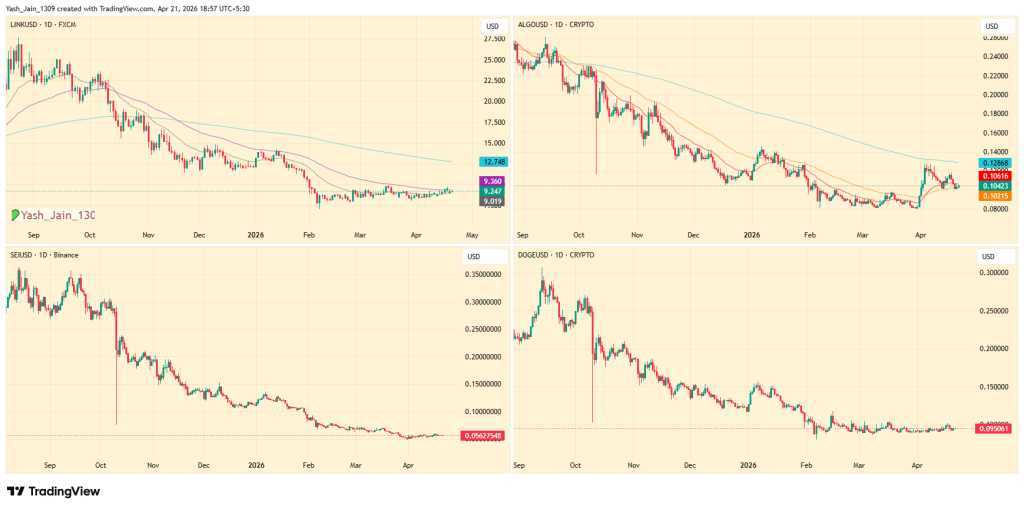
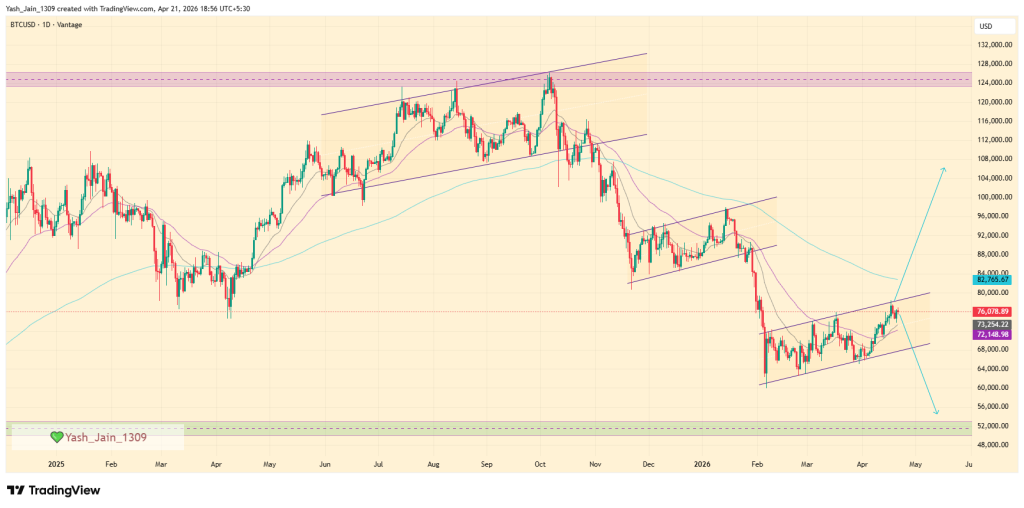
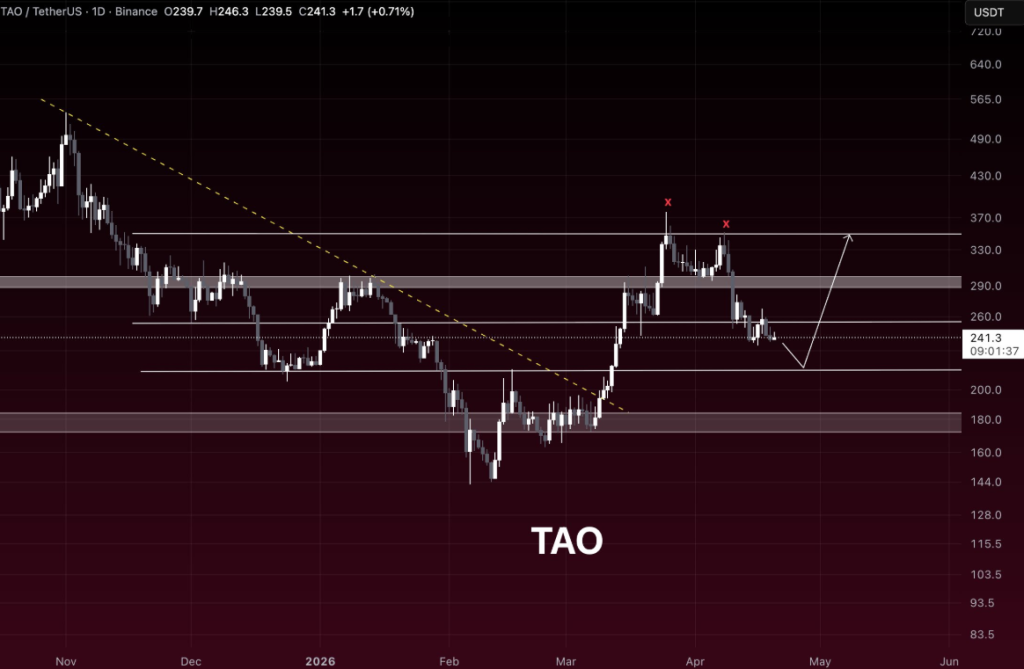
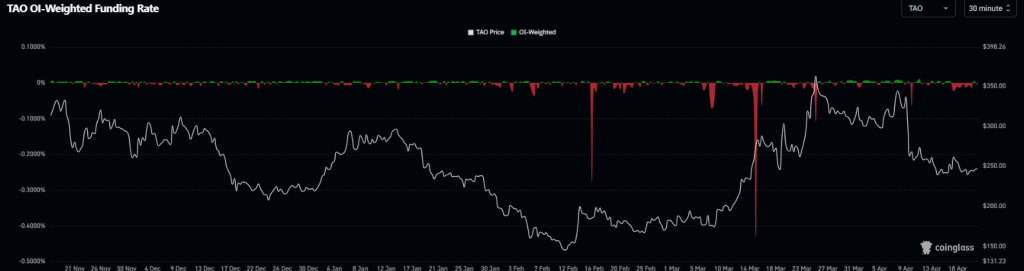


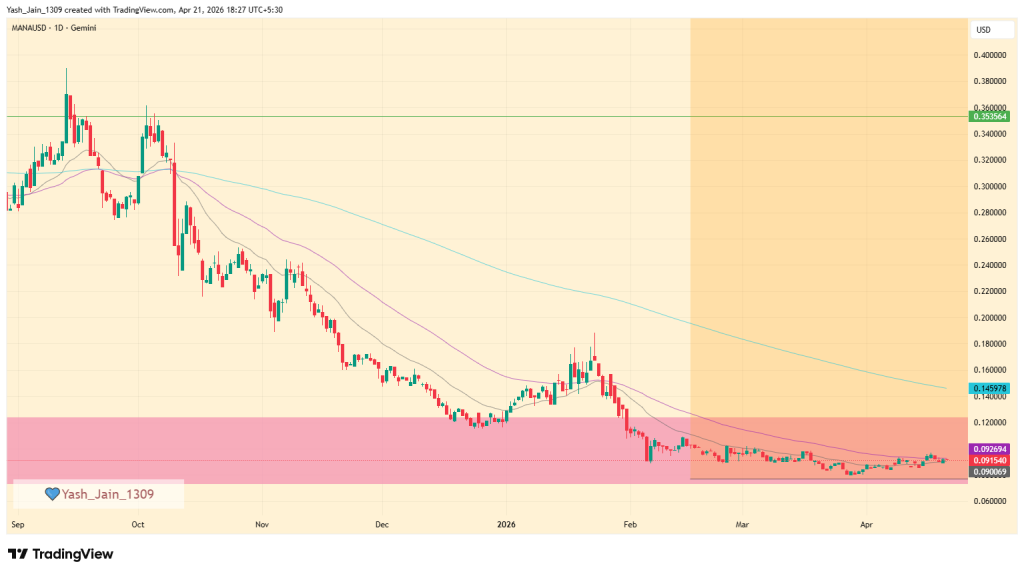
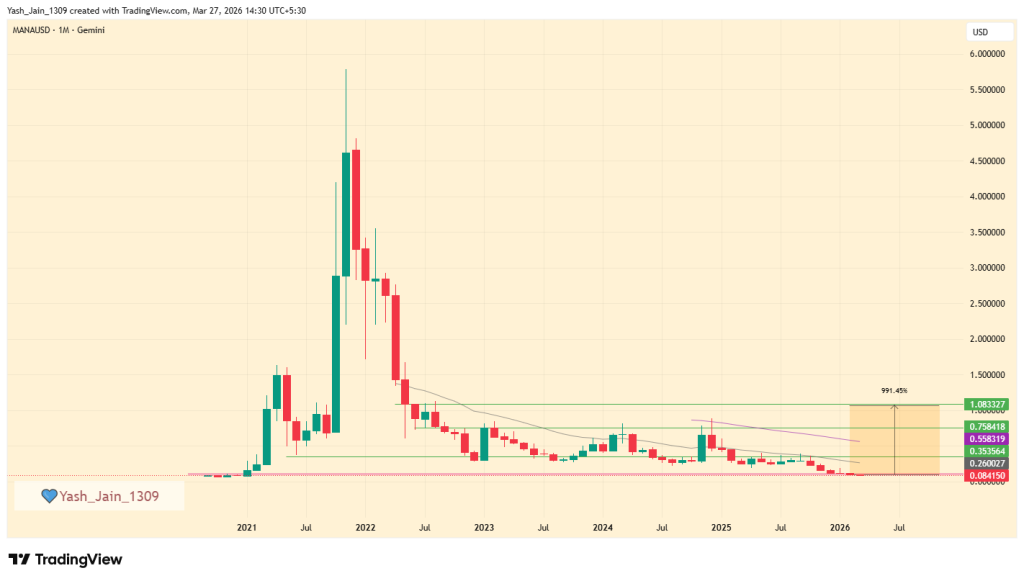
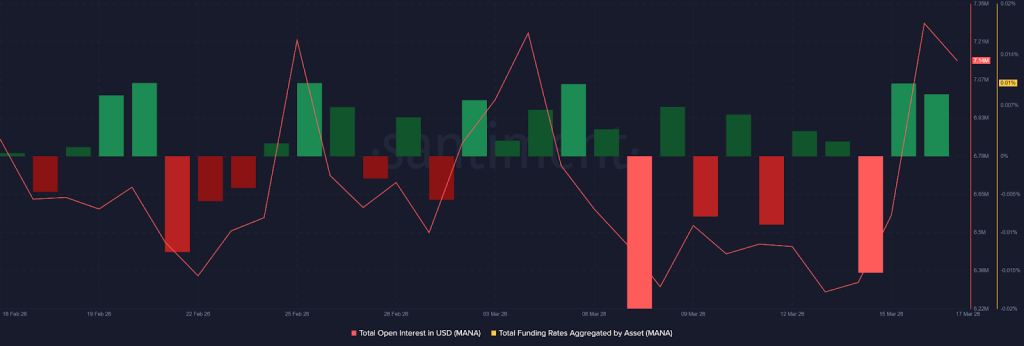
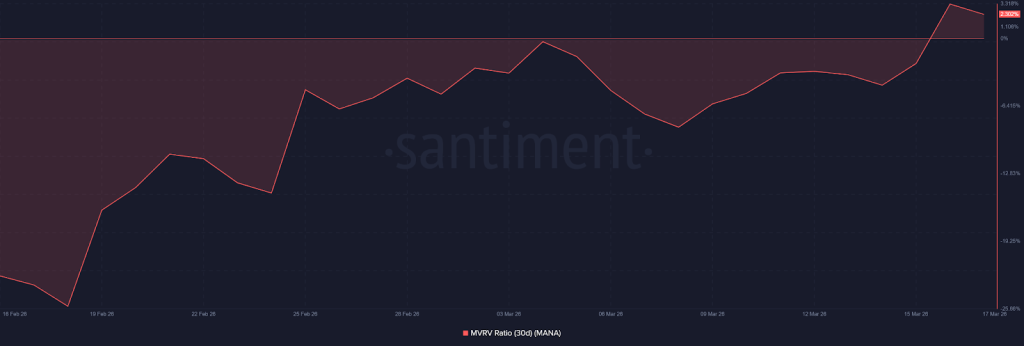
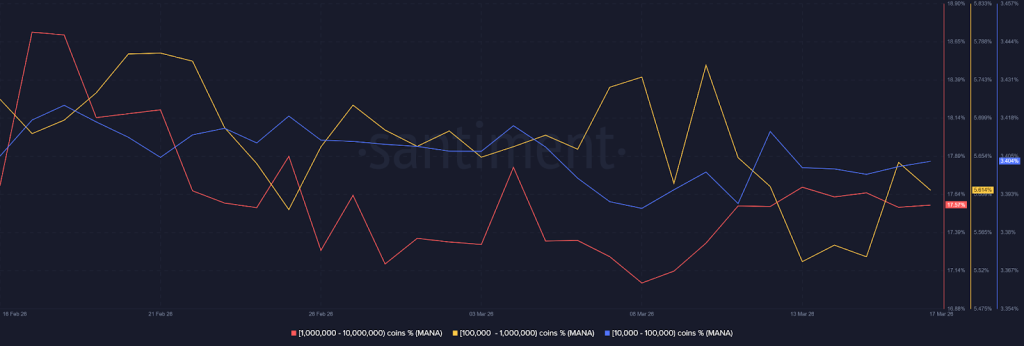

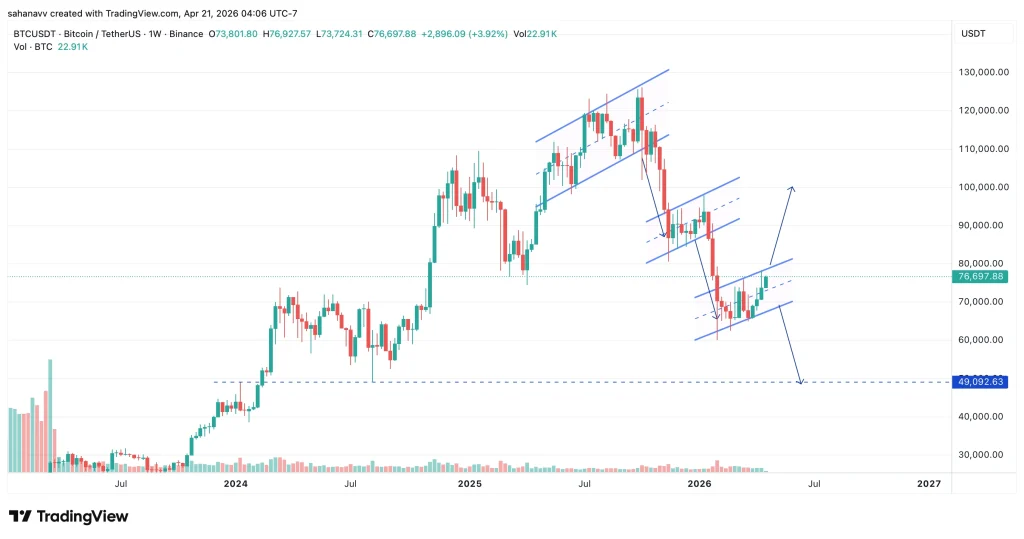
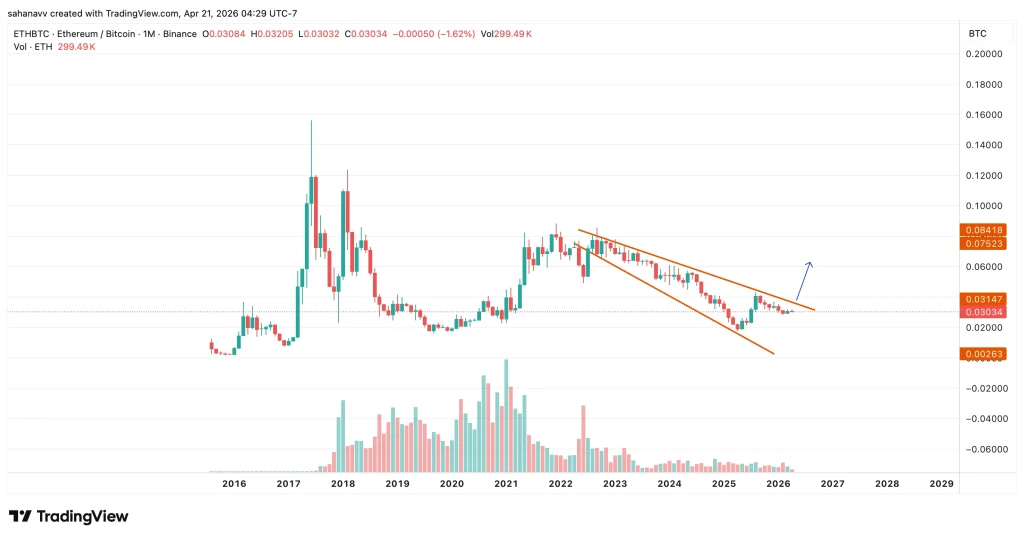

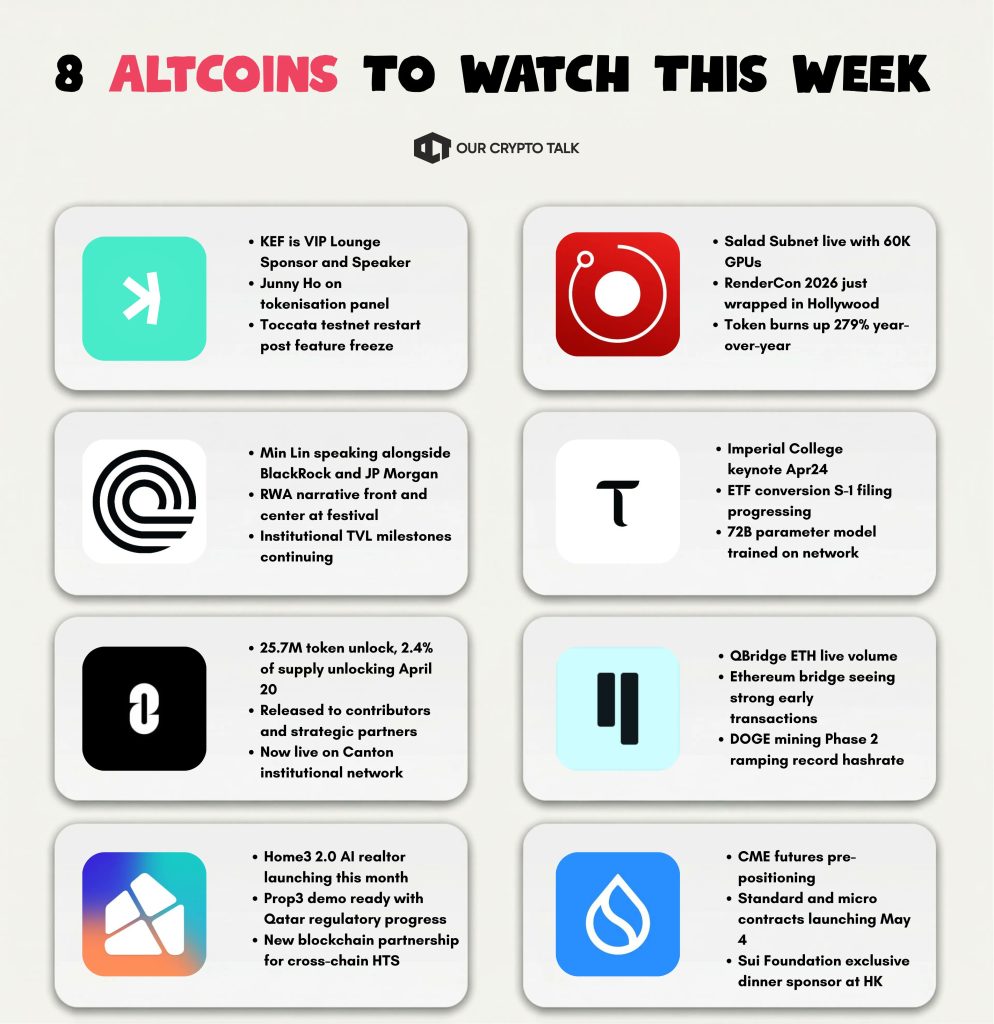
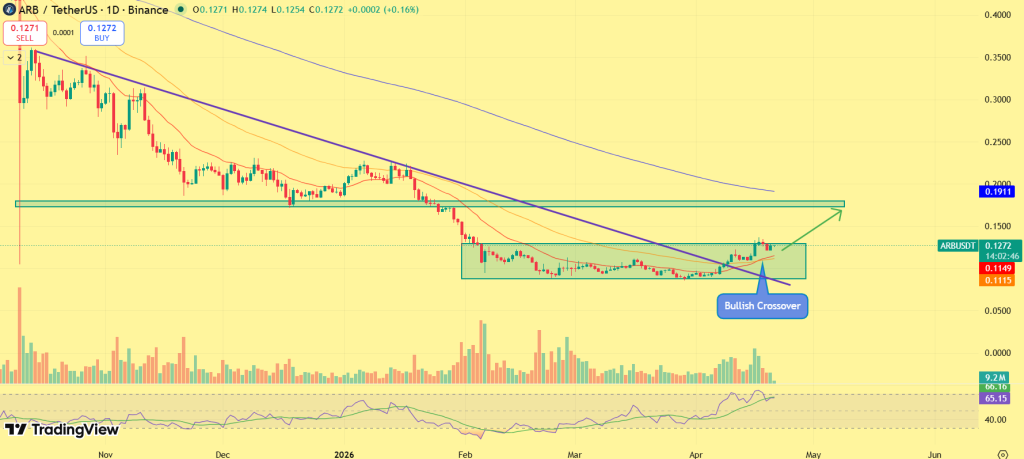
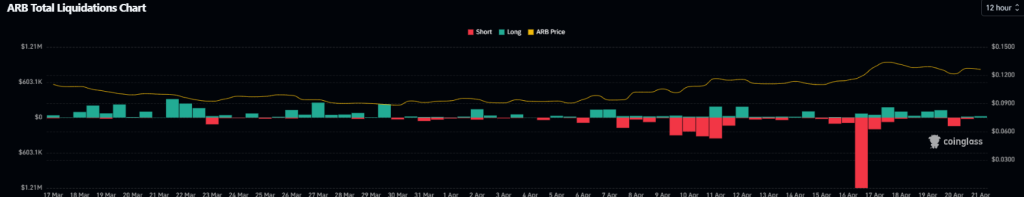

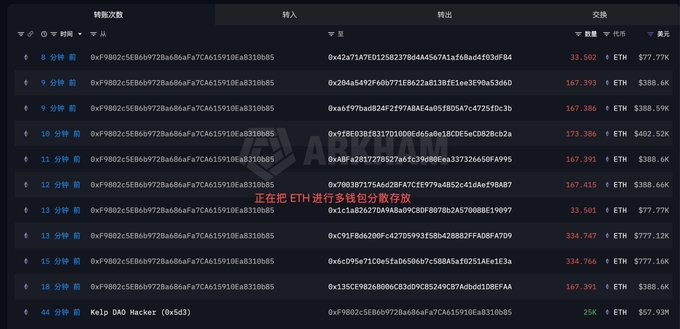
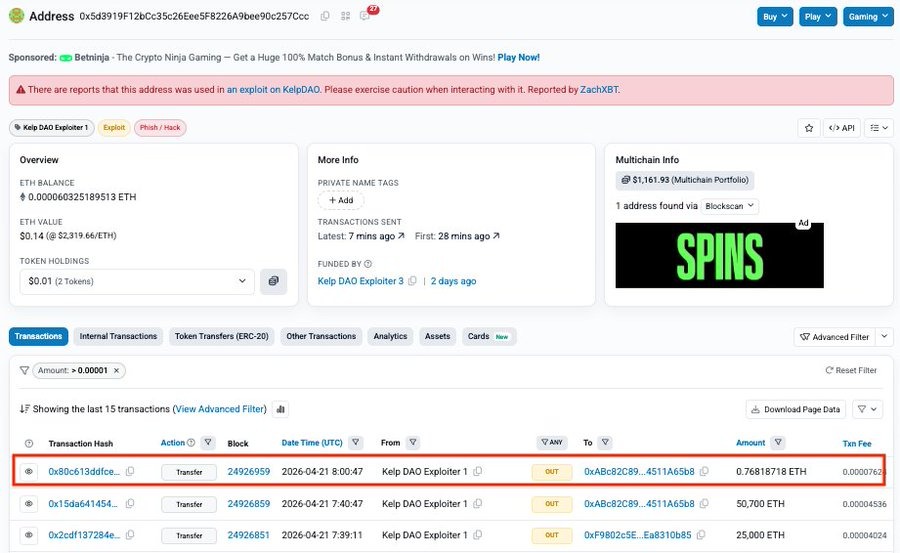


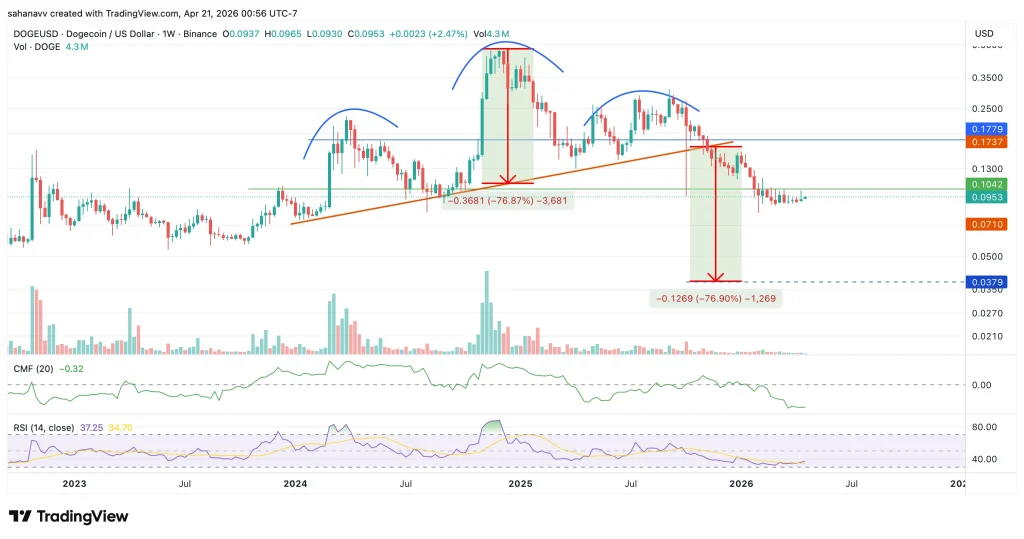
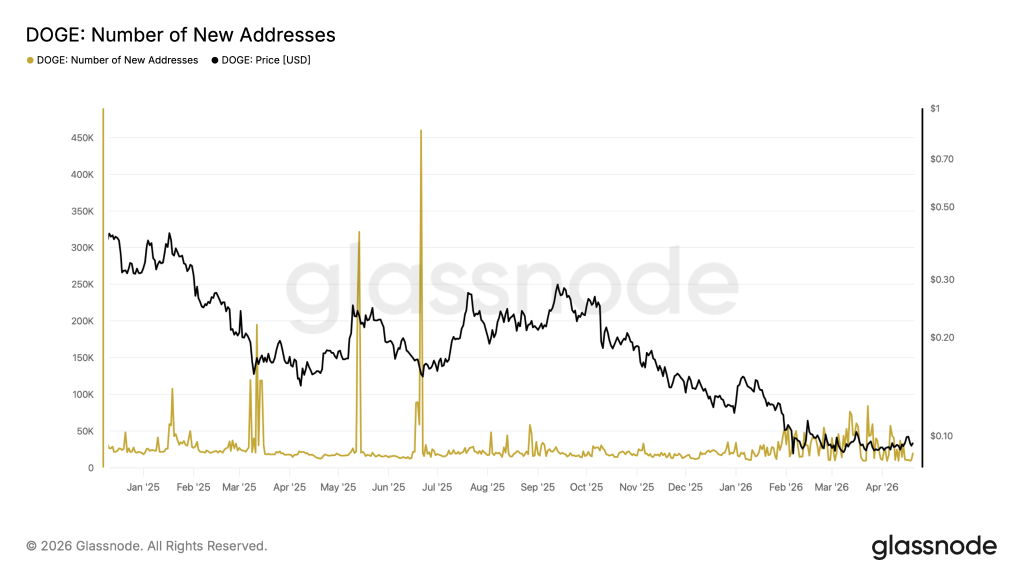
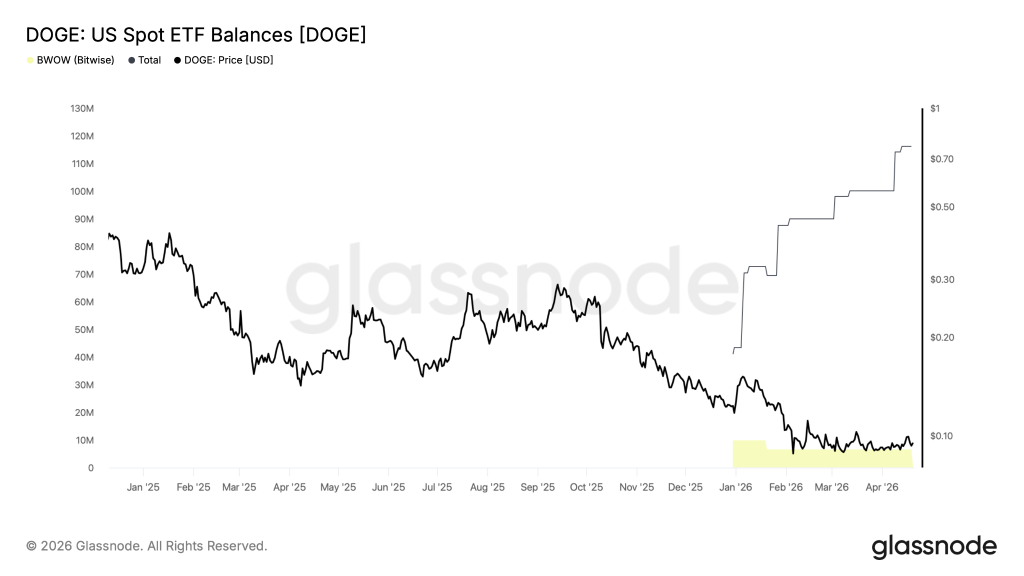
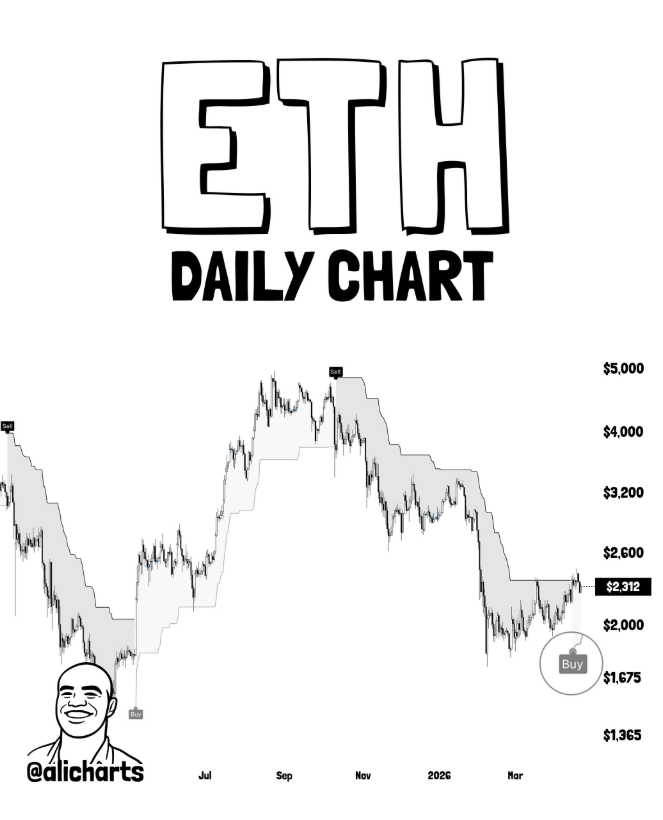
 BITMINE ADDS 101,627 ETH IN ONE WEEK
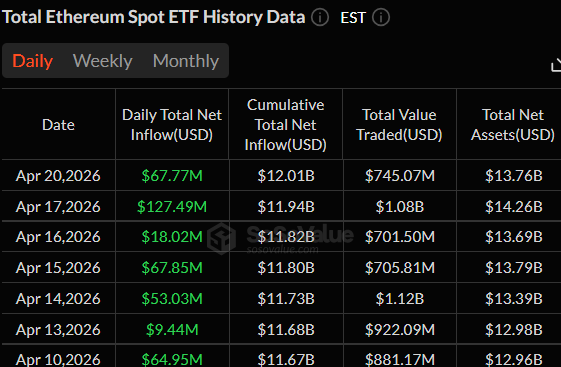
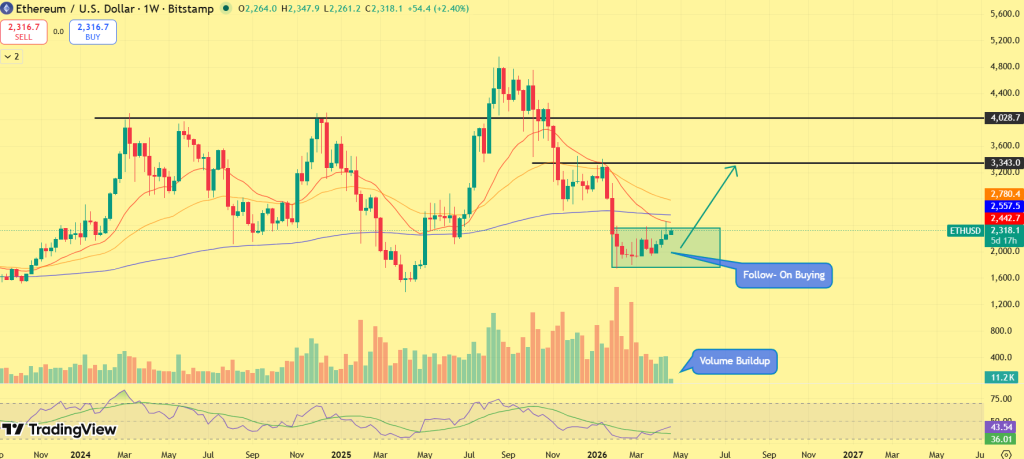
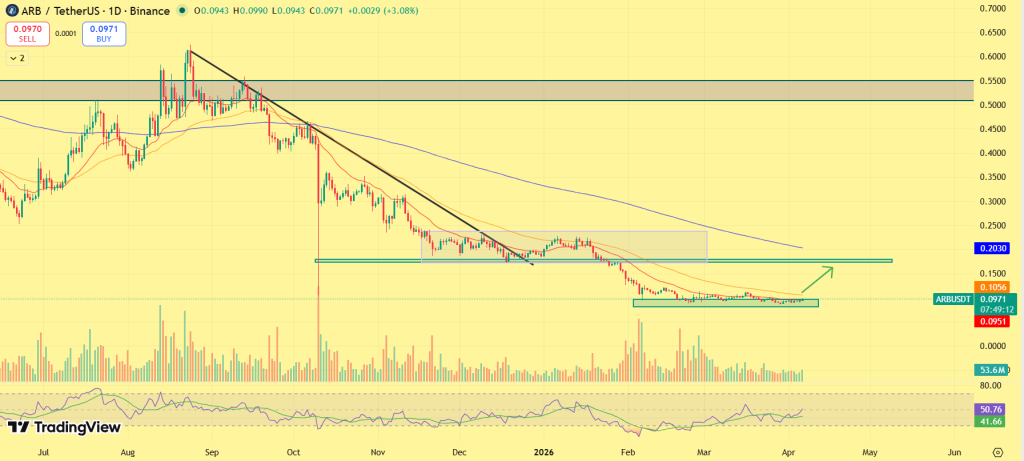

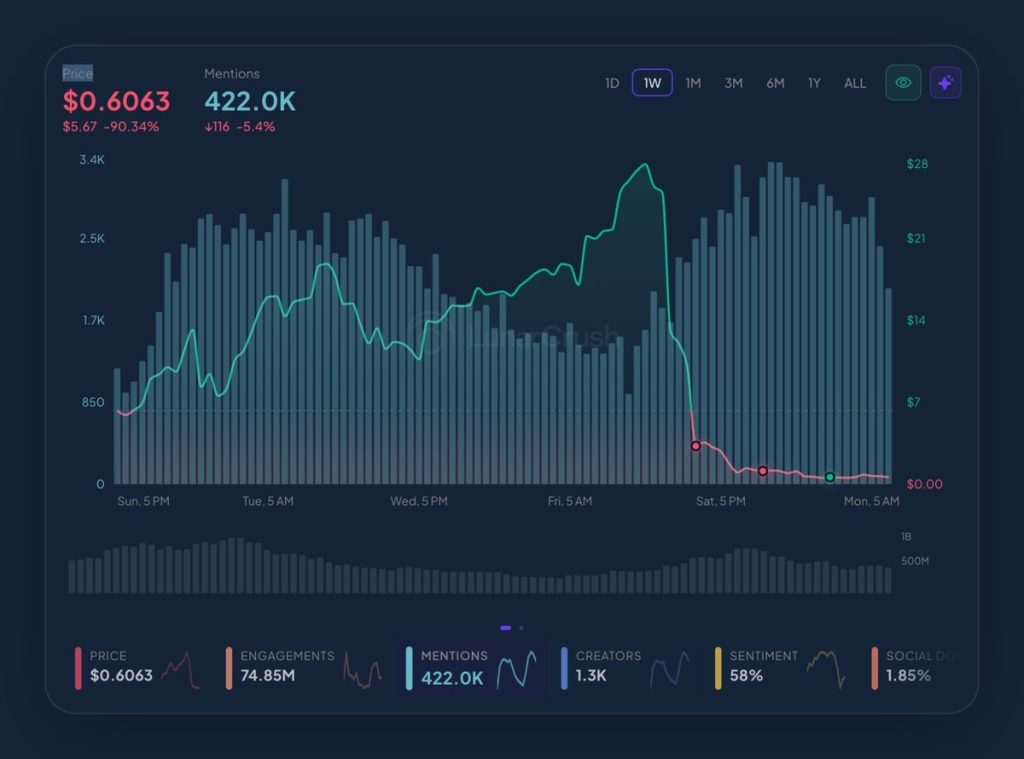
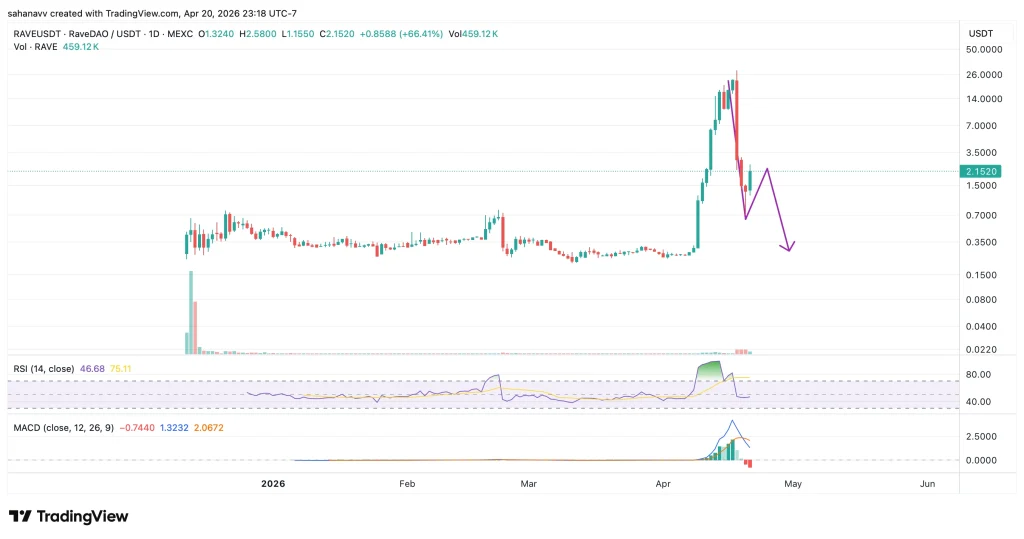

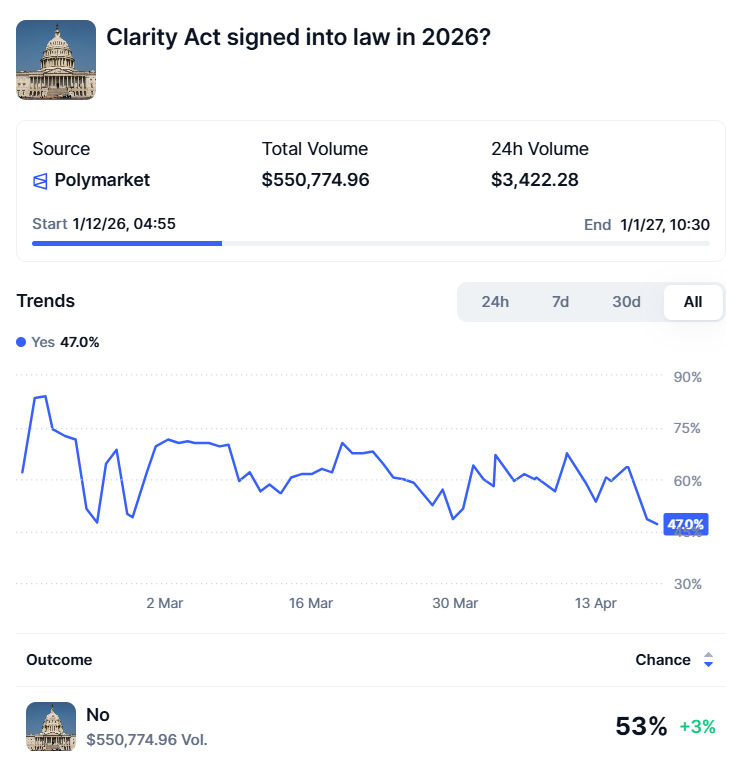

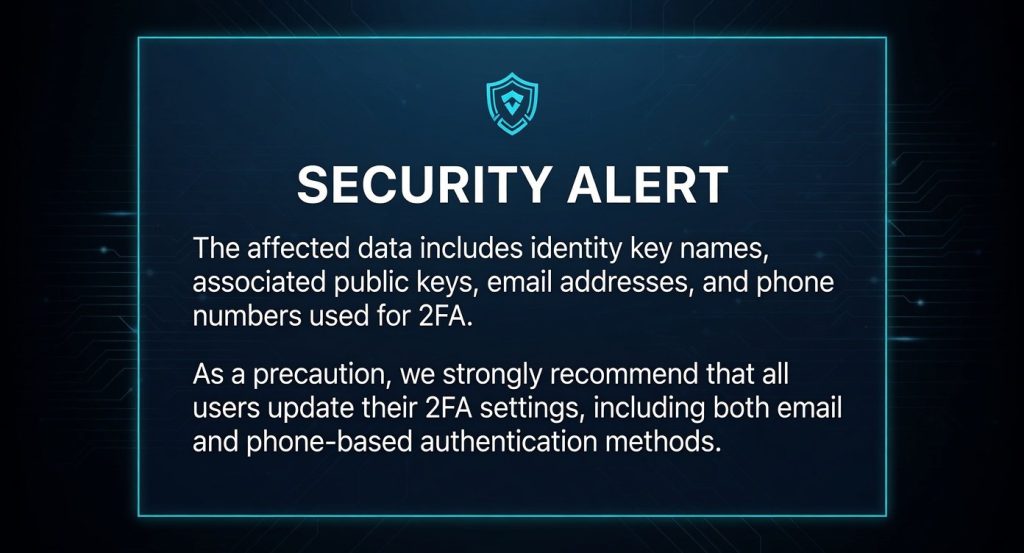
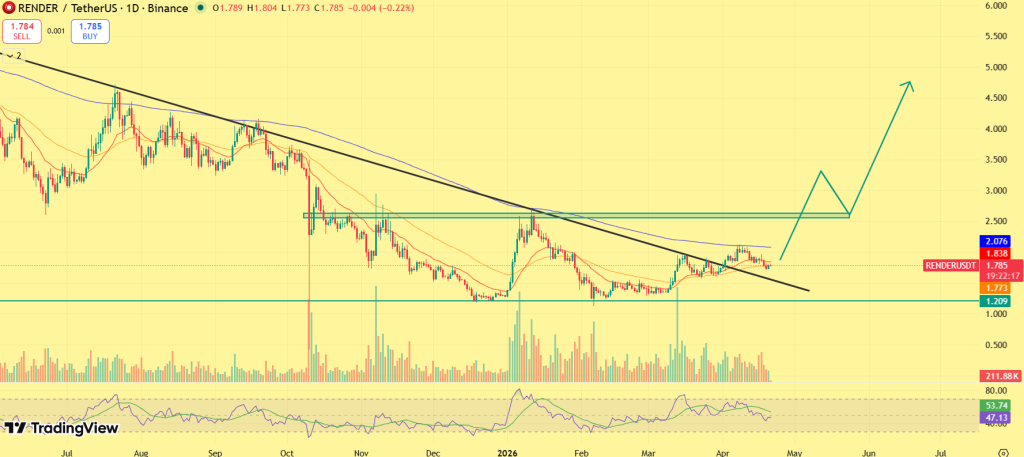
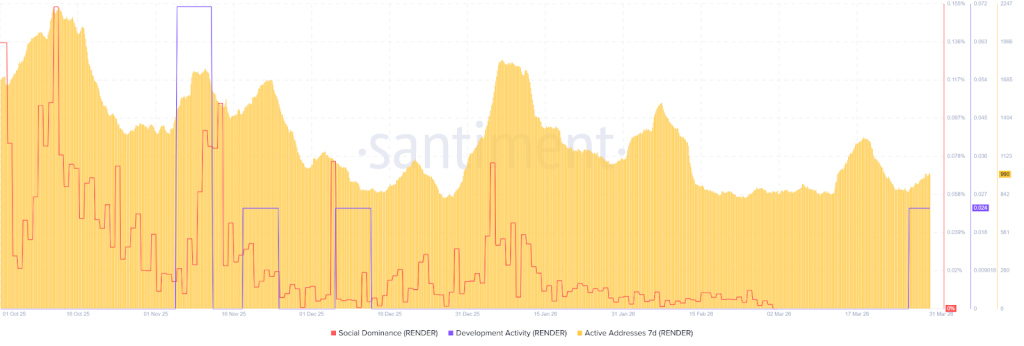
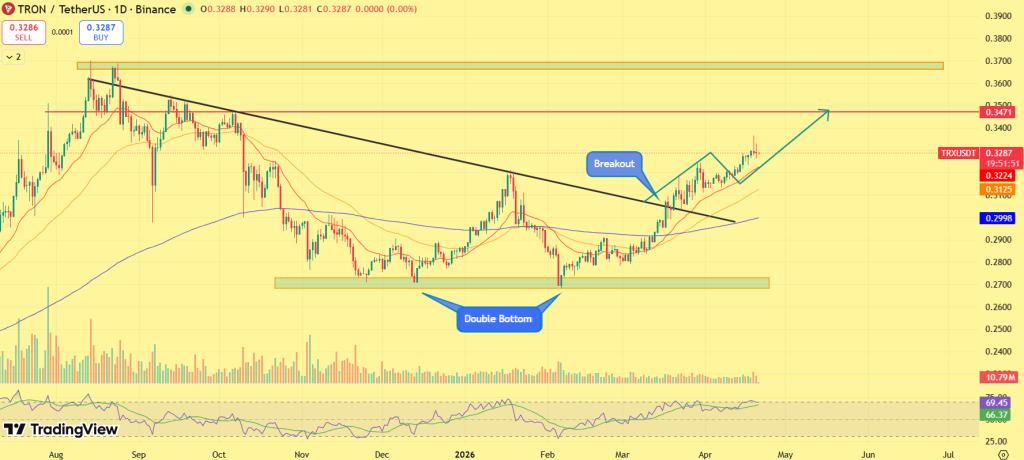

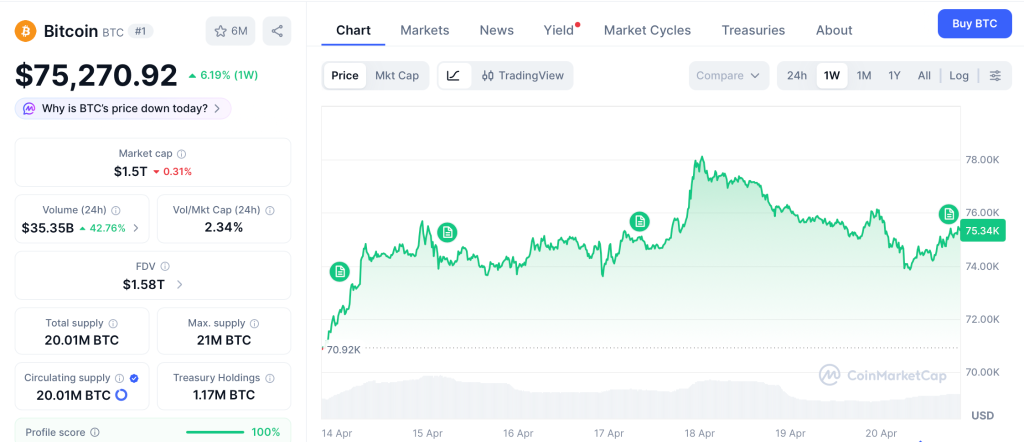

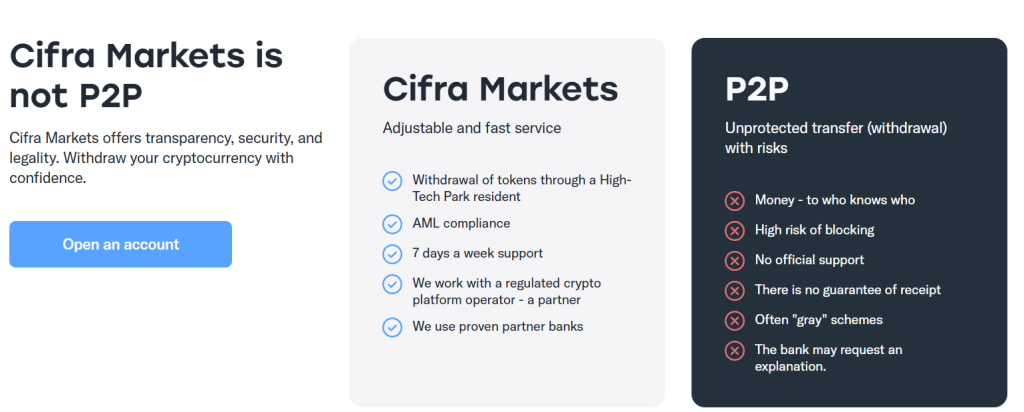
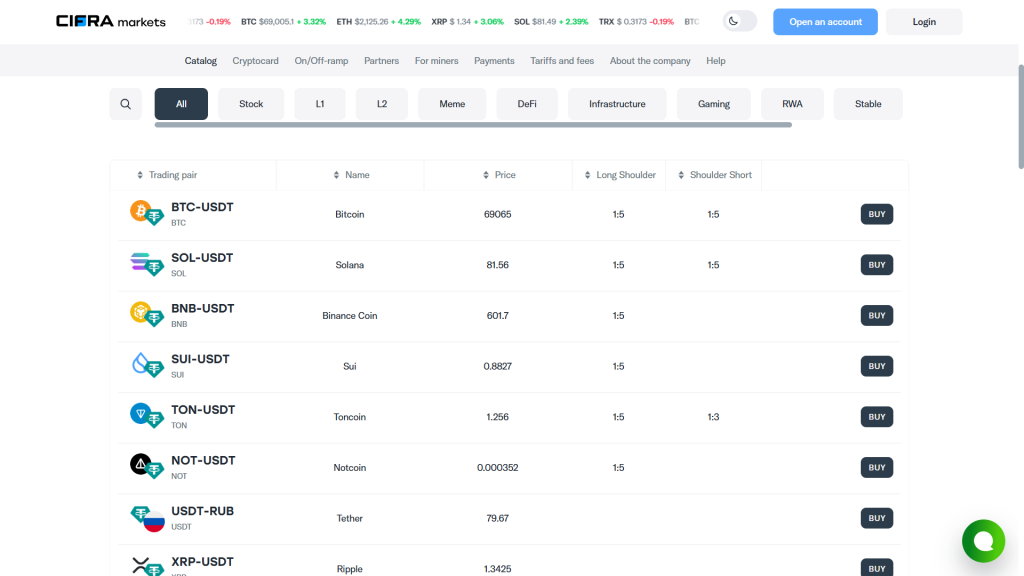
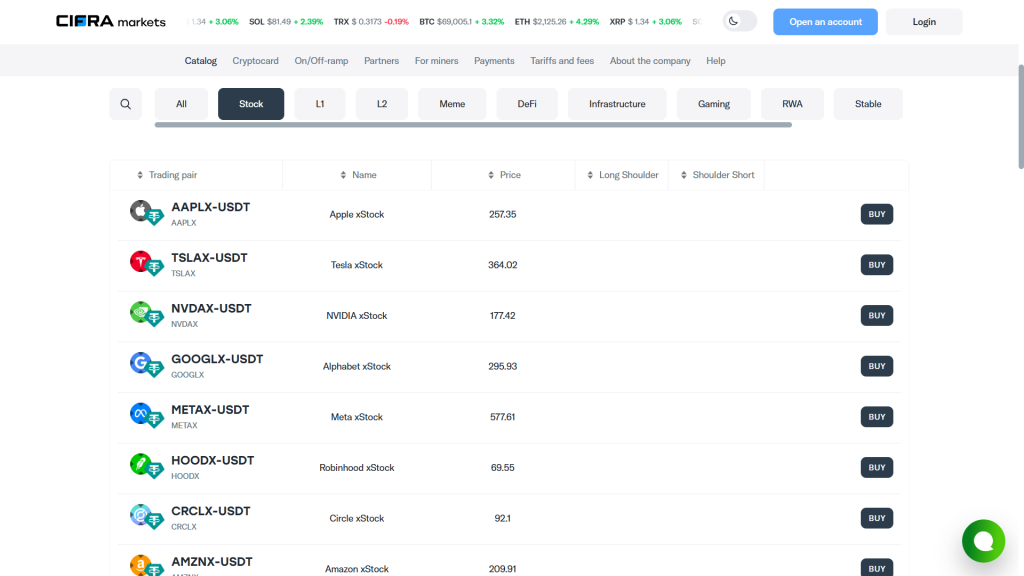

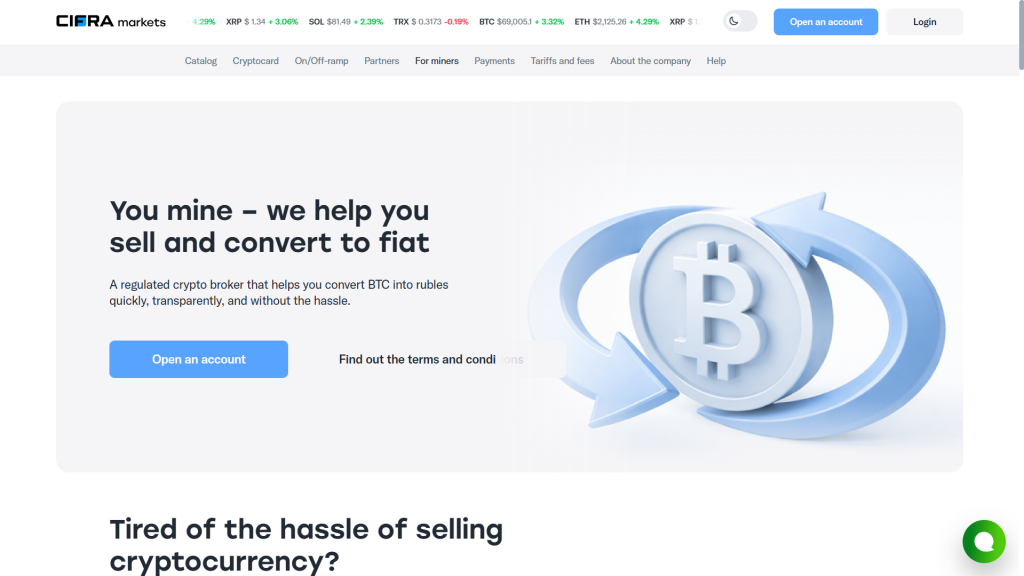

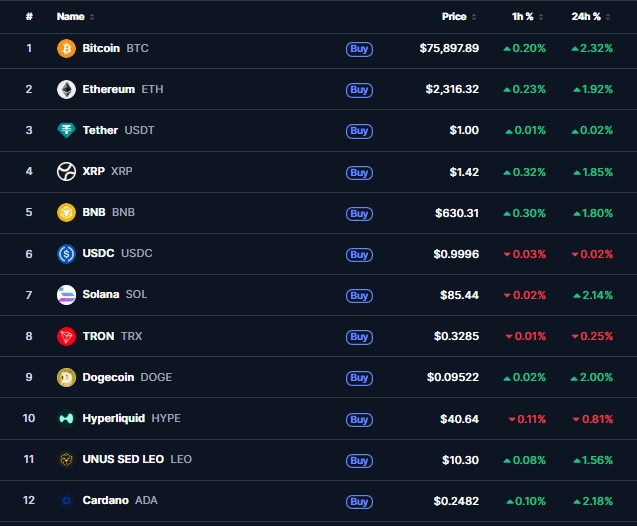
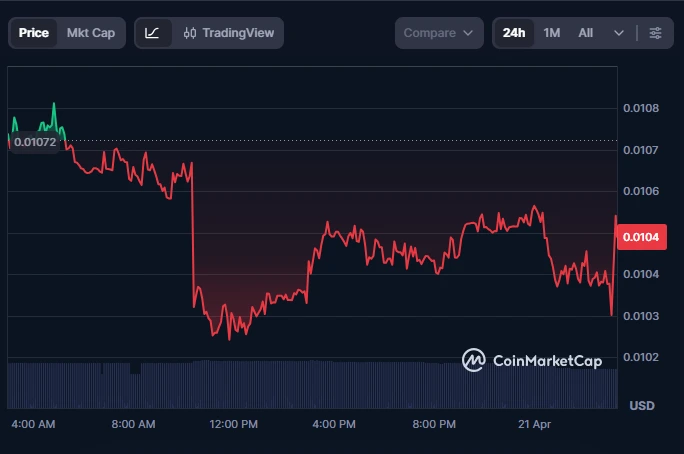

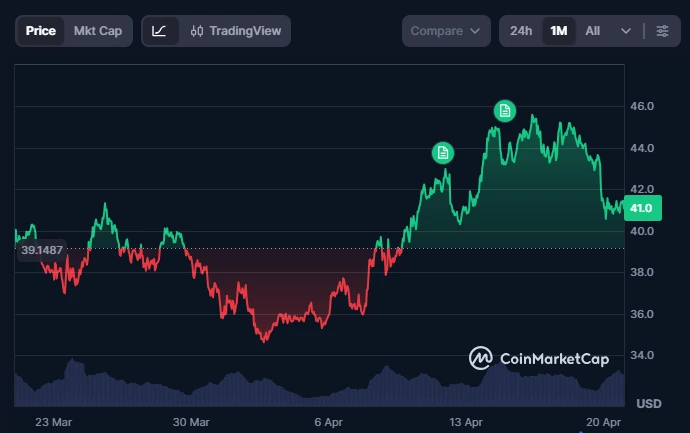
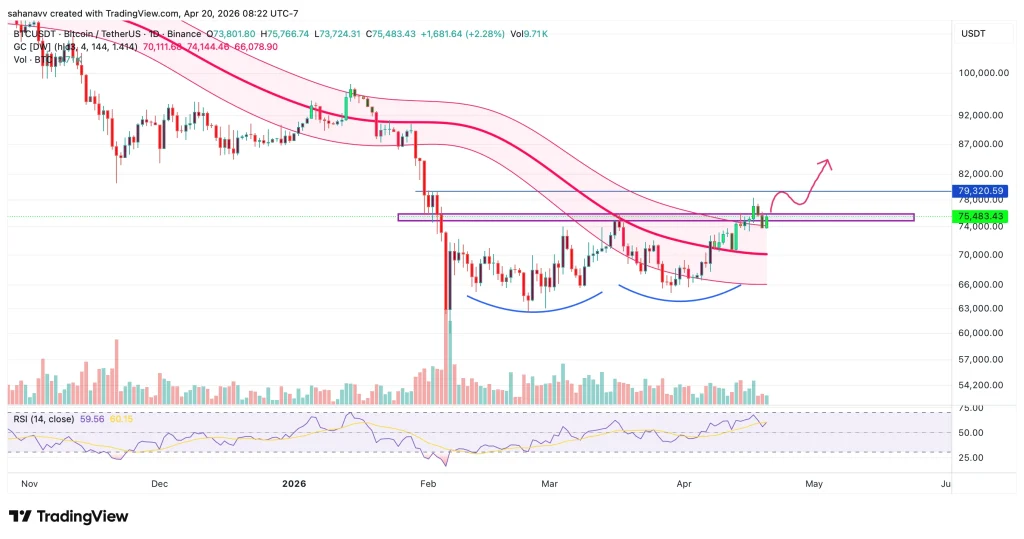
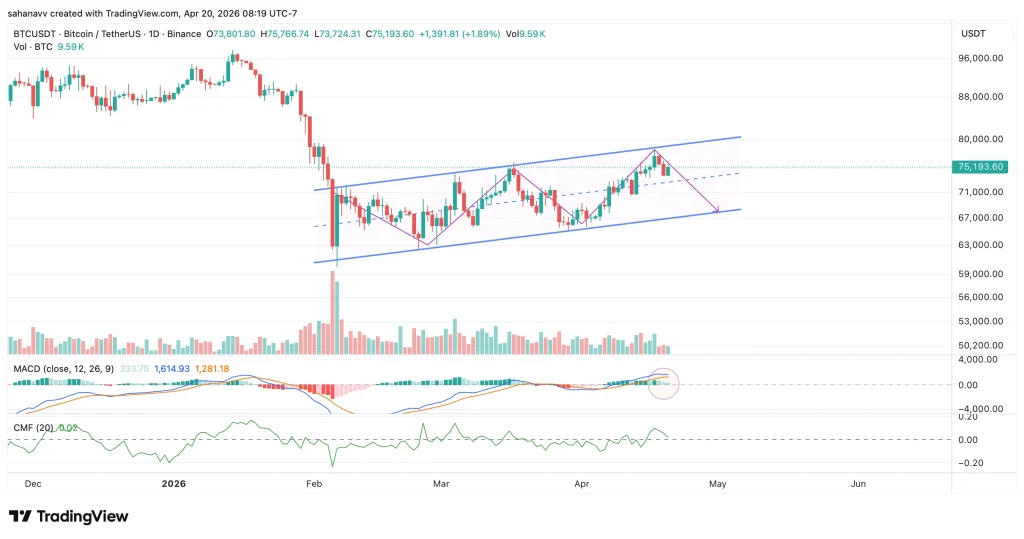

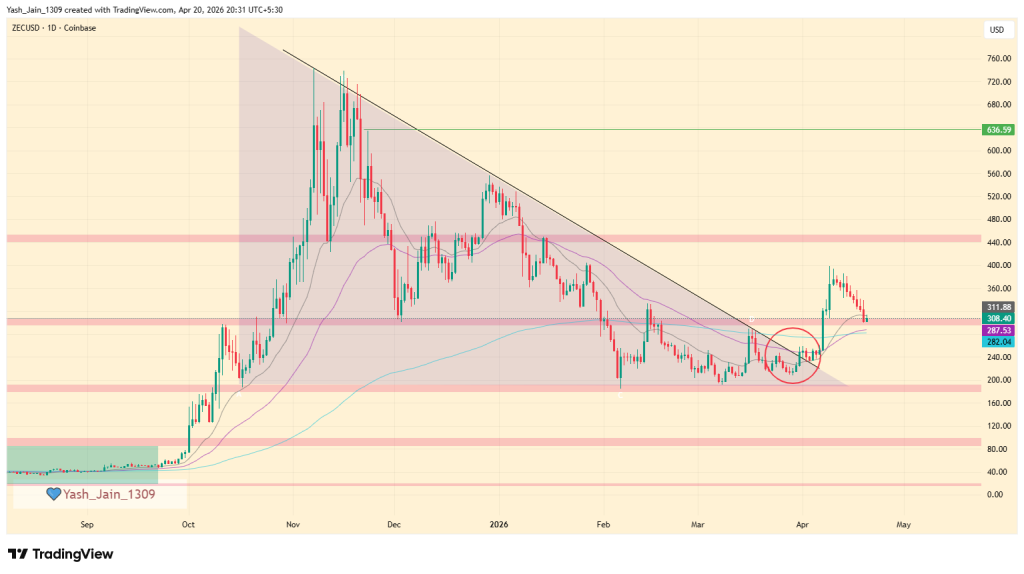
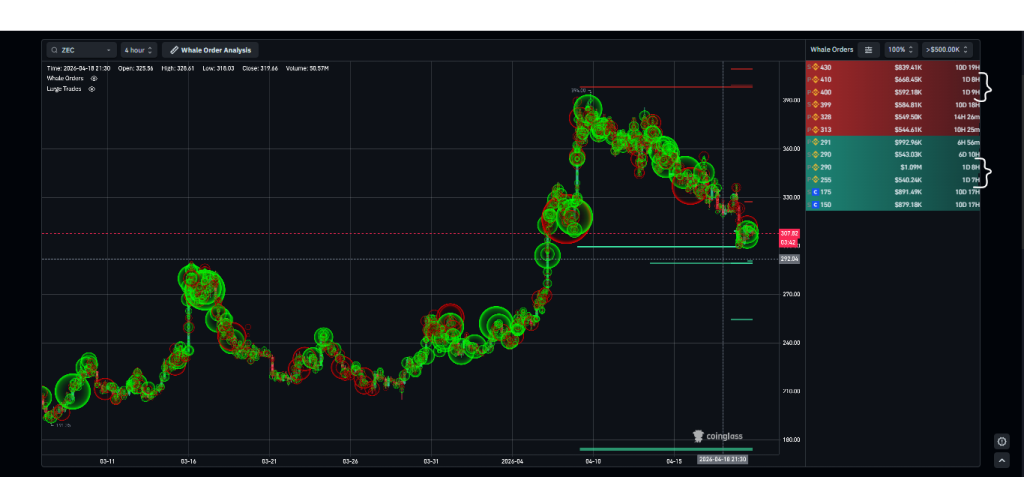
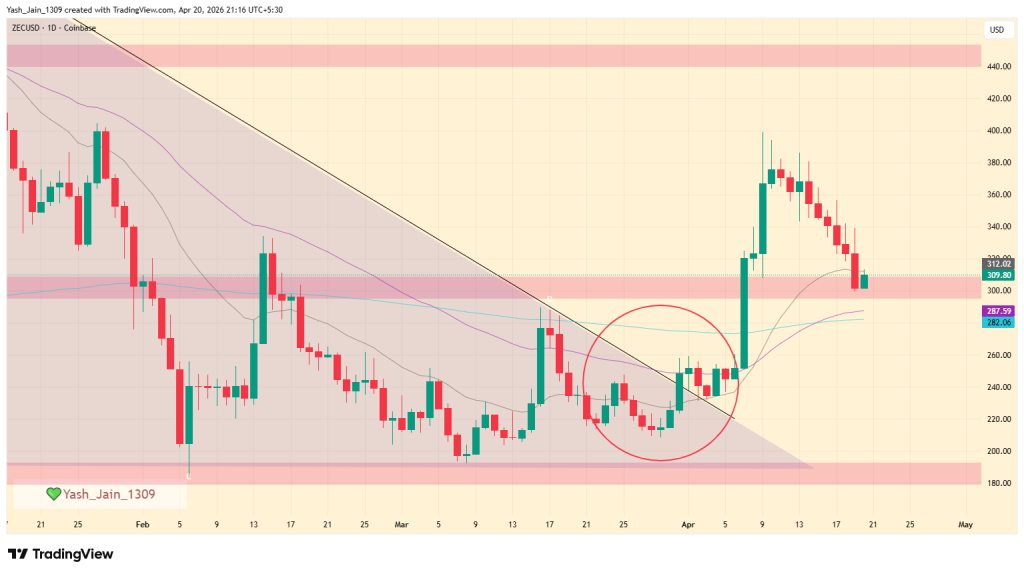


 are the entry point to SportFi.