Pi Network co-founder Chengdiao Fan used her recent appearance at the Consensus 2026 in Miami to explain how Pi Network plans to move away from the typical crypto model focused mainly on speculation and token fundraising.
During her keynote, Fan said the crypto industry still suffers from “too much value extraction without equivalent value creation,” arguing that many projects raise capital first but fail to deliver meaningful utility afterward.
“There are tokens used mostly for raising capital without actual product innovation,” Fan said. “People have too easy and immediate access to capital without actually doing the hard work to finish the building.”
According to Fan, Pi Network is trying to solve that problem by aligning crypto tools with real businesses, product innovation, and long-term user participation.
At Consensus 2026 in Miami, @PiCoreTeam co-founder Dr. Chengdiao Fan delivered a bold message: the "quick exit" era of crypto is over. $Pi massive verified human network is trying to become standard for the digital economy.
Pi Launchpad Designed to Stop “Quick Exit” Culture
A major part of Fan’s presentation focused on Pi Launchpad, a new ecosystem model for projects building on Pi’s Layer-1 blockchain.
Fan explained that Pi Launchpad differs heavily from traditional crypto launchpads because funds committed by users would not go directly to project teams. Instead, those proceeds would be permanently deposited into liquidity pools.
“Not only does this address the root problem of the quick exit problem, but it also helps provide a healthy and stable start for the token,” Fan explained.
She also said projects must already have a working app or product before launching tokens inside the Pi ecosystem.
“The prerequisite to launch on Pi Launchpad is to have a working product,” she added.
Fan also explained that users who actively engage with products could receive favorable access or benefits during token launches, helping align users and builders toward long-term ecosystem growth.
Pi Focuses on Users, AI, and Real Utility
Fan repeatedly emphasized Pi’s scale as one of its biggest advantages.
According to her, Pi has over 60 million engaged users globally, more than 18 million KYC-verified users, and roughly 16.5 million active wallets already operating on mainnet.
“User acquisition is the foundation of utility creation,” Fan said. “No matter how sophisticated a product feature is, if there are no users, there will be no meaningful usage and network effects.”
She also highlighted Pi’s growing role in AI infrastructure and human verification systems. Fan revealed that over 526 million human verification tasks were completed by more than one million users through Pi’s KYC network.
“This large distributed workforce can potentially provide human-in-the-loop processes for AI,” she explained.
How This Could Impact Pi Price
Fan’s speech comes during an important week for Pi Network. Pi trading volume jumped over 20% in the last 24 hours ahead of the May 15 network upgrade, which could introduce smart contract functionality.
Pi recently moved from around $0.169 to $0.1728, while a breakout above the $0.187 resistance level could open the path toward $0.22 if buying momentum continues building around the upgrade narrative.
Crypto.com has become the first Virtual Asset Service Provider in the UAE to receive a Stored Value Facilities license from the Central Bank of the UAE. The approval allows the company to launch crypto payment services for Dubai government fees through its partnership with Dubai Finance. Payments will settle in UAE dirhams or approved stablecoins under a regulated framework. The milestone strengthens the UAE’s push toward a cashless economy and positions Dubai as a global leader in the adoption of regulated digital assets.
Australia is reportedly preparing its biggest capital gains tax overhaul in decades, with plans to remove the 50% tax discount for crypto investors holding assets over 12 months. The proposal, expected in the 2027 budget, would replace the current system with a full inflation-indexed tax model on real gains. If implemented, effective tax rates on long-term crypto profits could jump from roughly 23.5% to nearly 47%. The change may reshape investor behavior, trigger earlier profit-taking, and impact Australia’s broader crypto and investment markets.
The crypto market is showing early signs of an altcoin rotation as capital gradually shifts beyond Bitcoin into high-strength projects. While Bitcoin price consolidates above $80,000, several altcoins continue outperforming the broader market. This is backed by strong breakouts, rising trading volume, and improving market sentiment.
Ethereum’s strength near the $2,400 range and slowing Bitcoin dominance are also supporting the bullish outlook for altcoins. Projects linked to narratives like RWA, AI, privacy, and Layer-1 ecosystems are currently leading the rally, with tokens like TON, ONDO, and SUI displaying strong momentum.
Meanwhile, the TOTAL3 chart has broken above a major resistance range after months of consolidation, signaling the possibility of a broader altcoin rally ahead. However, the market is still favoring selective leaders rather than the entire altcoin sector, suggesting the early stages of rotation instead of a full altseason.
TOTAL3 Breakout Signals Growing Altcoin Strength
As seen in the chart above, the TOTAL3 index has broken above a crucial resistance zone near the $750B range after months of consolidation. The chart also confirms a bullish cup-and-handle pattern, a structure often associated with strong continuation rallies after prolonged accumulation phases.
The RSI also continues to trend higher with a series of higher lows, indicating strengthening momentum across the altcoin sector. At the same time, trading volume has increased during the breakout phase, signaling rising trader participation and improving market confidence.
If the TOTAL3 index continues holding above the $750B support zone, the next major resistance levels could emerge near $776B and later around $800B. A successful breakout above these levels may accelerate capital rotation into altcoins and potentially trigger a broader market-wide rally. However, failure to defend the breakout zone could lead to a short-term pullback before the next bullish continuation move.
Top Altcoins to Watch this Week
The ETH price is displaying some stability by consolidating above a crucial resistance range, which has displayed acute strength among the altcoins. Besides, the Bitcoin dominance sustains above 60% while the sentiments are neutral, indicating a tentative but not decisive move of capital from BTC to altcoins over the past 24 hours. This suggests the markets are in a transitional phase, and the below-mentioned altcoins could be early movers of the upcoming rally.
Toncoin (TON)
Toncoin price has printed a massive bullish week, attracting over 120% gains, rising from $1.4 to the highs of $2.8. The trading volume also increased tremendously from levels around $100M to as high as $1.8B in just a couple of days. The rise was fueled by Pavel Durov’s announcement about Telegram’s deeper integration with the Open Network. Currently, the token is undergoing profit-taking after a major price run, and a slowdown in the selling pressure could signal the end of the correction phase.
Ondo (ONDO)
ONDO’s recent rally has been largely driven by growing momentum in the Real World Asset (RWA) sector, particularly around tokenized U.S. Treasuries and institutional on-chain finance. The project gained significant attention after participating in tokenization initiatives linked to major financial players, strengthening its position as one of the leading RWA-focused crypto platforms. Rising institutional interest, strong spot buying pressure, and increasing derivatives activity have further fueled bullish sentiment, helping the ONDO price surge nearly 50% in a short span.
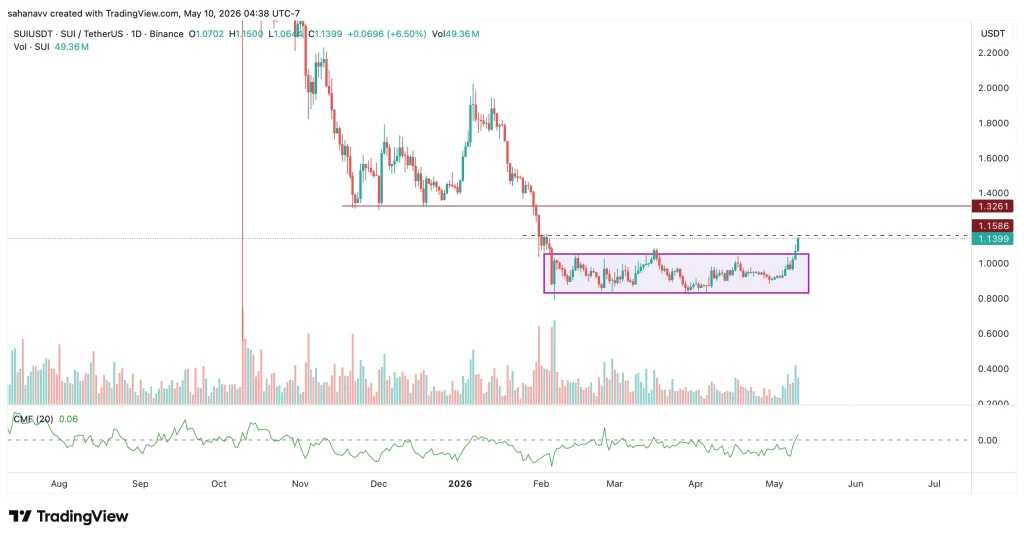
Sui (SUI)
SUI’s recent 20% rally has been driven by growing optimism around its privacy-focused upgrades and rising ecosystem activity. The network gained attention after confirming plans for confidential transactions, strengthening its narrative as a scalable and institution-friendly privacy blockchain. Rising DeFi activity, strong buying pressure, and increasing staking participation have further supported the bullish momentum, making SUI one of the strongest-performing Layer-1 altcoins in the current market rally.
Zcash (ZEC)
ZEC witnessed a strong breakout after reclaiming the crucial $600 resistance zone, signaling renewed bullish momentum across privacy-focused cryptocurrencies. The rally was largely driven by rising demand for privacy narratives, improving market sentiment, and increasing trading volume. Analysts also noted growing trader interest in fundamentally strong privacy tokens as capital rotates into selective altcoins with strong breakout structures.
Is the Altcoin Rally Just Getting Started?
The broader altcoin market is beginning to show signs of renewed strength as capital gradually rotates beyond Bitcoin into selective high-performing sectors like RWA, privacy, and Layer-1 ecosystems. Breakouts across tokens like ONDO, SUI, and ZEC, combined with the bullish TOTAL3 structure, suggest the market may be entering the early stages of a larger altcoin expansion phase.
However, the rally remains concentrated in fundamentally strong projects rather than the entire altcoin market. If Bitcoin continues to hold above key support levels and Ethereum gains momentum above major resistance zones, the ongoing rotation could accelerate further and potentially evolve into a broader altseason in the coming weeks.
The crypto market started the week under pressure as total market cap slipped to nearly $2.69 trillion while Bitcoin struggled to reclaim the key $82,000 resistance level after failing to break above it last week. Now, traders are preparing for one of the biggest macro weeks of 2026 as key U.S. economic events lined up for this week which will impact the crypto market.
Monday: Kevin Warsh Takes Over as Fed Chair
Markets are closely watching Monday as Kevin Warsh officially replaces Jerome Powell after Powell’s term ends this Friday.
Warsh is widely viewed as more market-friendly compared to Powell, and some crypto traders believe a more flexible Federal Reserve leadership could eventually improve liquidity conditions for risk assets like Bitcoin.
The leadership change is important because the Federal Reserve has heavily influenced crypto markets during the past two years through aggressive interest rate policy and liquidity tightening.
Tuesday: CPI Inflation Report Could Shake Bitcoin
Tuesday’s U.S. CPI inflation report may become the most important market event of the week. Economists currently expect headline CPI to rise by 0.6% month-over-month, while annual inflation is projected to climb to 3.7%, up from 3.3% previously.
Core CPI is forecast to come in at 2.7% year-over-year, with monthly core inflation expected at 0.4%. If inflation prints hotter than these estimates, markets could push back expectations for Federal Reserve rate cuts even further.
That scenario would likely strengthen the U.S. dollar and add pressure to Bitcoin as well as the broader crypto market.
Wednesday: Fed Speech and PPI Data
Wednesday brings another critical macro combination: Producer Price Index (PPI) inflation data alongside a speech from the new Fed chair.
Markets expect headline PPI to rise another 0.6%, up from 0.5% previously, while core PPI is forecast at 0.3%. PPI matters because rising producer costs often signal future consumer inflation pressure.
If both CPI and PPI remain elevated, traders may increasingly price in a “higher-for-longer” rate environment, something that historically creates short-term pressure for crypto assets.
Thursday: CLARITY Act Vote Could Change Crypto Regulation Forever
Thursday may become one of the biggest regulatory days in crypto history. The Senate Banking Committee will officially review and vote on the Digital Asset Market CLARITY Act inside the Dirksen Senate Office Building in Washington, D.C.
The legislation would create permanent federal market structure rules for digital assets and formally divide crypto oversight between the SEC and CFTC.
Several major crypto assets, including XRP, Hedera, Stellar, Cardano, Chainlink, Ondo Finance, and Algorand, could benefit if the legislation moves forward, as clearer regulations would improve their legal standing and reduce uncertainty across the market.
Friday: Trump-Xi Meeting Adds Geopolitical Risk
Friday’s expected meeting between Donald Trump and Xi Jinping could create additional volatility across global markets.
Discussions are expected to focus on Iran and global oil supply routes, rare earth mineral exports, semiconductor restrictions, tariffs and broader trade policy, as well as rising geopolitical tensions linked to Taiwan.
Crypto traders are especially watching oil market discussions because energy price shocks can heavily influence inflation expectations and Federal Reserve policy.
Bitcoin enters one of the most important weeks of 2026 struggling below the critical $82,000 level while markets prepare for massive economic and political catalysts.
Expanding exchange-ecosystem demand could lift BNB price toward $2000 by the end of this year.
Long-term network usage growth may extend BNB price toward $10,000.
Binance Coin (BNB) suggests a fundamental shift in how the asset responds to broader market dynamics. In 2026, the token’s performance increasingly reflects on-chain utility and ecosystem liquidity rather than mere speculative volatility. This transition from reactive price swings to a more structured price action indicates a maturing market environment.
As the ecosystem stabilizes, the technical narrative centers on long-term accumulation and the absorption of supply within established demand zones. Sustained network activity across the Binance Smart Chain provides a foundational backdrop for this consolidation, potentially setting the stage for a period of extended price discovery. By focusing on fundamental network health and institutional integration, the outlook for the next several years leans toward organic growth and structural resilience within the global digital asset landscape.
So, what’s next for the BNB price in the rest of 2026 and beyond? What can be the future price movements? Let’s get into the Binance Coin (BNB) Price Prediction 2026–2030.
Looking from the third quarter of 2025, we observed an impressive rally, with prices soaring 125% from the $600 support level to an exhilarating $1,375. However, by the fourth quarter of 2025 and into the first quarter of 2026, the BNB price retreated back to the $600 demand zone, erasing those remarkable gains.
Since February, there has been a steady accumulation around this critical $600 level, a trend that has continued into March. Therefore, Q1 was challenging. However, as Q2 began, April showed signs of consolidation, which implies that this level has solidified as a robust support point. This suggests that bullish momentum could potentially resume in May. Early May has also begun to indicate this, especially as it aims to approach the 200-day EMA currently present at $726.
Despite the prevailing market challenges, the BNB price has demonstrated remarkable resilience, remaining above $600 for most of April. If bullish pressure increases in May, we may see a potential retest of $850. However, the 200-day EMA remains a crucial area for this to happen; otherwise, further consolidation may continue throughout the month.
Recent News/ Opinions
On April 1, 2026, Binance Earn launched new Yield Arena offers, providing limited-time opportunities to earn up to 35% APR. This weekly update spans across multiple products, including Simple Earn, ETH and SOL Staking, and Dual Investment.
On March 27, 2026, binance shared that equity and commodity perpetual futures on Binance surpassed $150 billion in cumulative trading volume. This milestone was supported by an immense processing of over 110 billion trades in one quarter, highlighting the growing crossover between traditional finance and digital markets.
A recent ruling news on March 7th came from the US federal court that it has positively dismissed all anti-terrorism claims against Binance, alleviating a significant legal burden. In the Southern District of New York, a judge concluded that the plaintiffs, comprising 535 individuals citing 64 attacks from 2017 to 2024, did not establish sufficient evidence to demonstrate that Binance had assisted or conspired with terrorist organizations. This decision marks a commendable step forward for Binance, affirming its commitment to compliance and integrity.
Binance Coin (BNB) Price Prediction 2026
Based on the technical structure of the BNB/USD weekly chart, the price action reflects a long-term ascending channel (or wedge) that has defined the asset’s trajectory since the massive demand surge from the $40 level in early 2021. This multi-year uptrend culminated in a new all-time high of approximately $1,375 in late 2025, validating the token’s utility and its position within the Binance ecosystem. Currently, the market is witnessing a convergence of horizontal price levels with channel’s dynamic trendline support, which reinforces the technical significance of the current price zone.
As of Q1 2026, BNB price is testing a critical turning support zone around the $600 horizontal support, which aligns precisely with the lower boundary of the primary ascending channel. This area is currently serving as a consolidation floor, suggesting a period of institutional accumulation. Historical precedent highlights the importance of this trendline; a similar touchpoint in late 2023 at the $200 range served as the launchpad for a massive rally, though it took roughly 238 days to reach the channel’s median line.
Looking ahead through 2026, the primary bullish thesis anticipates a recovery toward the $1,000 psychological level. If the recovery pace mirrors previous cycles, BNB/USD could reach the channel’s middle band by Q3 2026. However, if consolidation extends further into the year, the recovery might be more gradual, stretching toward the year-end.
Conversely, a decisive break below the $600 footing would invalidate the current setup, significantly increasing the probability of a deeper correction toward the major $200 demand zone.
BNB On-Chain Analysis
Recent on-chain data highlights the network’s resilience, with daily transactions stabilizing at 15 million in Q1 2026 despite market fluctuations. This sustained utility, paired with total unique addresses nearing the 800 million mark, signals a consistent rise in global adoption. These fundamental metrics suggest a robust foundation for long-term ecosystem growth and structural asset valuation.
Binance Coin Crypto Price Prediction 2027 – 2030
Year
Potential Low ($)
Potential Average ($
Potential High ($)
2027
1200
1420
1800
2028
1600
1950
2300
2029
2100
3250
3900
2030
2500
3800
4500
Binance Coin Price Prediction 2027
As per the Binance Coin Price Prediction 2027, Binance Coin may see a potential low price of $1200. The potential high for Binance Coin price in 2027 is estimated to reach $1800.
BNB Price Prediction 2028
In 2028, Binance Coin price is forecasted to potentially reach a low price of $1600 and a high price of $2300.
Binance Coin Price Forecast 2029
Thereafter, the Binance Coin (Binance Coin) price for the year 2029 could range between $2100 and $3900.
Binance (BNB) Coin Price Prediction 2030
Finally, in 2030, the price of Binance Coin is predicted to remain steadily positive. It may trade between $2500 and $4500.
The long-term projection assumes Binance Coin sustains relevance in enterprise blockchain use cases, with growth moderating over time as the asset matures.
Stay ahead with breaking news, expert analysis, and real-time updates on the latest trends in Bitcoin, altcoins, DeFi, NFTs, and more.
FAQs
What is the BNB price prediction for 2026?
BNB could recover toward $1,000 in 2026 if the $600 support holds and Binance ecosystem demand grows, supported by rising network usage and liquidity.
What will be the BNB price in 2030?
BNB could trade between $2,500 and $4,500 by 2030 if blockchain adoption grows and the Binance ecosystem maintains strong network activity.
How high can BNB price go by 2040?
Long-term projections suggest BNB could reach $13,000–$38,000 by 2040 if the network expands globally and maintains strong adoption across DeFi and Web3.
What factors influence Binance Coin’s price?
Price depends on exchange network usage, liquidity, adoption trends, historical support/resistance zones, and institutional participation.
Is Binance Coin (BNB) a good long-term investment?
BNB is often viewed as a strong long-term asset due to exchange utility, token burns, and ecosystem growth, though crypto investments always carry risk.
SOL stabilized bullish momentum may assist in reclaiming $200 by 2026.
Solana (SOL) could open a path toward $1,400 by 2030.
Solana is a high-performance blockchain platform designed to host decentralized applications and power global internet capital markets. It distinguishes itself through a unique architecture that combines Proof of Stake with a “Proof of History” mechanism, allowing the network to process thousands of transactions per second with near-instant finality and minimal fees. This scalability makes it a preferred choice for developers building everything from decentralized finance (DeFi) protocols to massive consumer applications and stablecoin payment systems.
The native SOL token is the lifeblood of this ecosystem, used to pay for transaction fees, deploy smart contracts, and secure the network through staking. As adoption grows among major financial institutions, many enthusiasts are left wondering about the future value of the asset.
Questions regarding whether SOL price can realistically reach $1,000, or how it will maintain stability in longterm, remain central to the community’s curiosity. In this deep dive, we explore these burning questions and more.
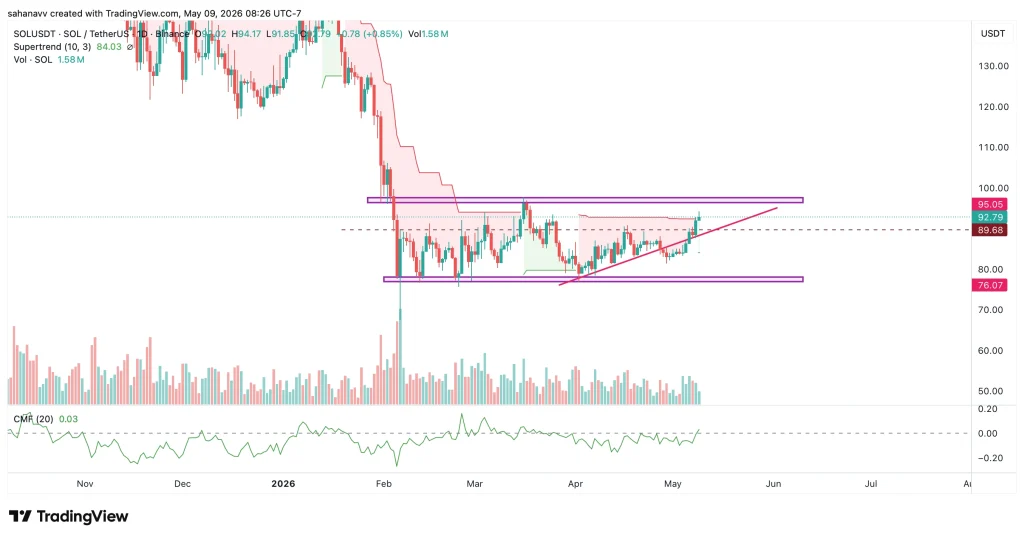
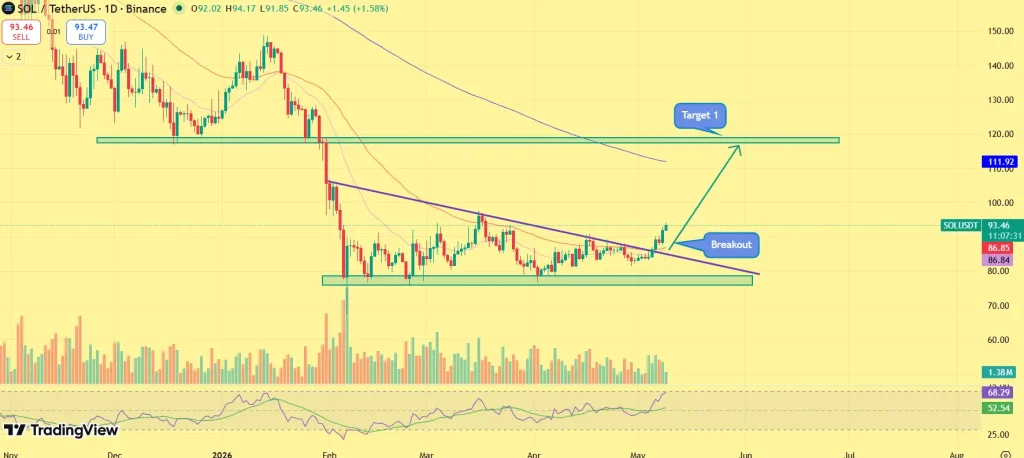
The SOL price action throughout Q1 2026 has been characterized by significant pressure, a trend that has unfortunately bled into even Q2. Despite this “tough situation,” the asset is currently maintaining a steady consolidation within a defined horizontal range.
While this sideways movement could signal a period of accumulation, a definitive market bottom remains unconfirmed. The lack of a clear liquidity grab suggests that the current resilience might be a precursor to a final flush.
Technically, a breakdown below the $80 support level could trigger a sharper decline toward the $60 mark. Conversely, if May ithas retested $97 if SOL can manage a breakout above $97 then its likely requiring a tailwind from broader market improvements then the price could see a recovery toward the $110–$120 resistance zone in May. For now, the market remains in a state of high-stakes equilibrium, waiting for a decisive breach of these key levels.
Recent News & Opinions
Announced on April 14, 2026, AlphaFC has officially renamed Alfreton Town FC’s home to “Solana Stadium”, establishing it as a blockchain-powered hub for fan-driven ownership in English football. The initiative coincides with an upcoming token sale on April 21, leveraging a partnership with Phantom, Raydium, and Bonk to launch the first professional English club ownership token on the Solana network.
On April 1, 2026, Symbiosis launched full support for Solana, enabling any-to-any token swaps with on-chain routing powered by Raydium. This integration allows users to move assets from any source chain to native Solana tokens in a single transaction.
Also on April 1, 2026, Interactive Brokers expanded its offerings by launching Solana trading for eligible European investors. Through this single integrated platform, SOL is now traded alongside traditional stocks, options, and bonds via a partnership with Zero Hash.
Solana (SOL) Price Prediction 2026
The weekly chart for Solana price (SOL) reveals a historical pattern of significant price surges followed by prolonged corrective phases. After a major spike in late 2021, the asset entered a multi-month downtrend that eventually found a bottom near the $8 mark.
A similar narrative played out in early 2025 as the price surged toward new highs, only to enter the current broader downtrend. This recent decline has been characterized by a falling wedge pattern, where the price action has consistently respected the converging trendlines, signaling a period of heavy consolidation.
Throughout early 2026, this downward trajectory extended until it tested the lower boundary of the wedge in January. However, a short-term recovery has since materialized, successfully reclaiming the $80 support level.
For a sustained bullish reversal, the price must first overcome the immediate resistance at $97, which would open the door for a move toward $116. If these levels are flipped into support, the next primary target lies within the $180 to $200 range, aligning with the upper border of the falling wedge.
Solana’s Onchain Analysis
Solana’s on-chain data confirms a remarkably resilient ecosystem. Despite a dip in late 2025, the network maintained a steady success rate above 80%.
By Q1 2026, Solana demonstrated its strength as TPS climbed back above 3,000. This recovery, paired with high success rates, highlights a robust infrastructure capable of sustaining high-speed performance even under pressure.
Moreover, The Solana ecosystem continues to see intense activity, with protocol rankings over the last 30 days highlighting the dominant fee-generating platforms. Leading the charge is Pump.fun, which recorded a staggering $70 million in fees, underscoring its massive role in the current market cycle.
This surge in fee generation is followed closely by Jupiter and Meteora, both of which remain cornerstone protocols for liquidity and trading on the network. Together, these three platforms represent the primary engines of on-chain value capture within the Solana ecosystem.
Additionally, Solana’s role as a primary hub for liquidity is further evidenced by its growing share of the stablecoin market. Tether (USDT) on the network currently accounts for 1.59% of the total $184.192 billion circulating supply.
This upward trend marks a significant expansion from the 1.15% dominance recorded in January 2026. For a Layer 1 platform, this increasing stablecoin concentration is a vital health indicator, signaling deepening liquidity and a more robust foundation for decentralized finance activities.
Solana ETF Analysis
By the end of Q1 2026, the U.S. spot Solana ETF market has around eight sponsoring firms, with the Bitwise BSOL product on the NYSE emerging as the largest holder. These ETFs are distributed across major exchanges, including some on the NYSE, NASDAQ, and CBOE. Currently, these sponsors hold a combined $812.25 million in net assets, representing approximately 1.68% of Solana’s total market capitalization.
While cumulative net inflows since listing have reached a significant $974.68 million. The last major inflow was recorded on April 10th, amounting to $11.5 million after a series of outflows.
Solana Crypto Price Prediction 2027 – 2030
Year
Potential Low ($)
Potential Average ($
Potential High ($)
2027
180
320
600
2028
300
420
720
2029
500
750
1000
2030
880
1200
1400
Solana Price Prediction 2027
As per the Solana Price Prediction 2027, Solana may see a potential low price of $180. The potential high for Solana price in 2027 is estimated to reach $600.
Solana Price Forecast 2028
In 2028, Solana price is forecasted to potentially reach a low price of $300 and a high price of $720.
SOL Price Prediction 2029
Thereafter, the Solana (Solana) price for the year 2029 could range between $500 and $1000.
Solana (SOL) Price Prediction 2030
Finally, in 2030, the price of Solana is predicted to maintain a steady positive. It may trade between $880 and $1400.
After rebounding from local lows near $2,275, the Ethereum price climbed above $2,375 and is currently consolidating within a narrow range. While the broader crypto market has turned bullish with the Bitcoin price reclaiming levels above $82,000, ETH continues to trade below a crucial resistance zone near $2,400. Despite the consolidation, both on-chain and derivatives data suggest growing market strength, reinforcing the bullish outlook for Ethereum.
ETH is currently trading around $2,326, while trading volume has surged by more than 103%, signaling rising trader participation and renewed market interest. Increasing open interest, stable network activity, and growing ETH staking levels further indicate that Ethereum may be entering a strong accumulation phase ahead of a larger move.
Although the Ethereum price still faces strong resistance near $2,400–$2,500, the broader market structure suggests the token could be preparing for its next major rally. If buyers manage to push ETH above these key levels, bullish momentum may accelerate, reviving hopes of a recovery toward the $3,000 milestone in the coming weeks.
Ethereum Price Analysis: Open Interest & Funding Rate Signal Growing Bullish Momentum
The Ethereum price continues to consolidate near the $2,300 range after recovering strongly from the local lows formed earlier this year. While ETH remains below a crucial resistance zone near $2,400, the latest derivatives data suggests traders are gradually positioning for a larger move ahead. Rising open interest and improving funding rates indicate that bullish sentiment is slowly returning to the Ethereum market despite the ongoing consolidation.
As seen in the chart above, Ethereum’s Aggregated Open Interest has recovered steadily from the February lows and is currently holding above $12.7 billion. This rise in open interest alongside stable price action suggests that traders are opening fresh positions instead of closing them, often signaling expectations of increased volatility and a potential breakout.
At the same time, the Aggregated Funding Rate has turned positive again, indicating that long-position traders are willing to pay premiums to maintain bullish exposure. More importantly, the funding rates are not excessively overheated yet, which suggests the market is witnessing healthy bullish positioning rather than speculative euphoria. Collectively, the chart points toward growing confidence among derivative traders.
Top Reasons Why Ethereum Price Could Be Preparing for a Larger Rally
Despite trading below a crucial resistance zone near $2,400, Ethereum continues to display strong underlying fundamentals across both on-chain and market activity. Metrics like active addresses, taker buy/sell ratio, and ETH staking levels suggest the market may be undergoing a strong accumulation phase instead of a bearish distribution phase. Here’s what the latest charts reveal about Ethereum’s current market structure.
Ethereum Active Addresses Remain Stable
Ethereum active addresses continue fluctuating between 400K and 700K, signaling stable network participation despite market volatility
The network activity has cooled from the January highs but remains structurally healthy, suggesting the market is consolidating rather than weakening
Stable user activity during a price consolidation phase often reflects accumulation and sustained long-term interest in the Ethereum ecosystem
Ethereum Taker Buy/Sell Ratio Signals Short-Term Caution
The latest taker buy/sell ratio has dropped below 1, indicating sellers currently hold slight short-term control
The metric continues to fluctuate around neutral levels, reflecting indecision as ETH struggles below key resistance zones
Despite temporary selling pressure, the ratio has not collapsed aggressively, suggesting the broader bullish structure remains intact
Ethereum Staking Continues to Tighten Supply
ETH total value staked has surged from nearly 36 million ETH to around 39 million ETH in recent months
Rising staking levels indicate long-term holders continue locking their ETH instead of selling into market weakness
Shrinking liquid supply on exchanges historically strengthens bullish conditions once buying demand accelerates
Collectively, the charts suggest Ethereum is currently in an accumulation and positioning phase rather than a speculative rally phase. While short-term momentum remains cautious, the combination of stable network activity, rising staking levels, and improving derivatives positioning points toward strengthening long-term bullish sentiment.
Wrapping it Up: What’s Next for Ethereum Price?
Ethereum continues to hold a bullish market structure despite consolidating below the key $2,400 resistance zone. Rising open interest, positive funding rates, stable network activity, and increasing ETH staking suggest the market is in an accumulation phase rather than a bearish reversal.
A breakout above the $2,400–$2,500 range could trigger fresh bullish momentum, pushing the ETH price toward $2,700 and potentially reviving the path toward $3,000. However, failure to clear the resistance may keep Ethereum range-bound and increase the risk of a short-term pullback toward $2,200 before the next major move.
The live price of the Cardano token is $ 0.28050352.
Cardano price could see a potential upside toward $5.00 by the end of 2026.
ADA’s long-term expansion scenario points toward $350.00 by 2030.
Cardano (ADA), one of the most research-driven Layer-1 blockchains, is now entering a critical phase of execution after years of development-focused growth. While its earlier roadmap emphasized peer-reviewed innovation and network stability, the current cycle is increasingly centered around scalability, real-world utility, and ecosystem expansion.
The ongoing evolution of Cardano is being shaped by major upgrades, including the introduction of privacy-focused infrastructure through Midnight and scalability advancements targeting significantly higher throughput. These developments are positioning the network to compete more aggressively with leading smart contract platforms, particularly in areas such as DeFi, enterprise applications, and regulated use cases.
As the network transitions into this execution-driven phase, the key question for 2026 is whether these technological advancements can translate into sustained adoption and capital inflows. With fundamentals strengthening beneath the surface, Cardano’s next move may depend on how effectively it converts innovation into measurable network growth and price momentum.
This article delves into Cardano’s 2026 outlook and long-term price prediction, analyzing whether these catalysts can translate into a sustained breakout. Explore this Cardano price prediction 2026 and beyond, filled with expert insights and ambitious forecasts.
Cardano’s recent developments point to a shift from roadmap delivery to early-stage execution.
Governance phase approaching: Cardano is moving closer toward its governance-focused upgrade cycle, increasing attention around decentralized treasury management and on-chain voting.
Midnight ecosystem gaining traction: The privacy-focused Midnight sidechain is strengthening Cardano’s positioning in enterprise, compliance-driven, and real-world blockchain applications.
Whale accumulation continues: Large holders have resumed accumulation during consolidation, suggesting growing confidence near long-term support zones.
Scalability narrative intact: Ongoing work around Hydra and next-generation scaling infrastructure continues supporting Cardano’s long-term expansion thesis.
Cardano (ADA) May Price Prediction 2026
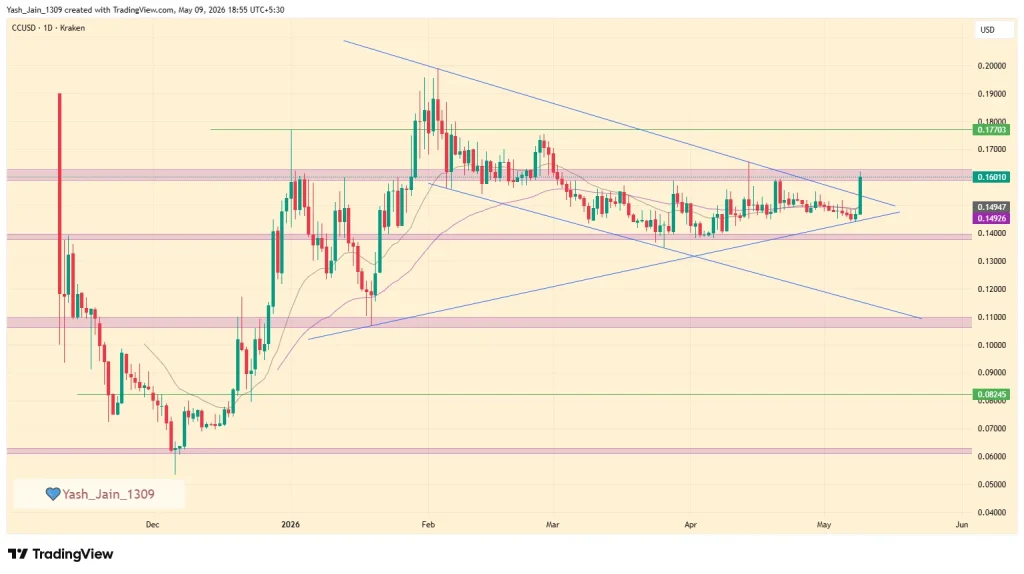
Cardano has entered May near the $0.27 region after spending several weeks compressing within a broad accumulation range. While ADA remains below major macro resistance, the recent structure suggests that downside momentum has weakened considerably. Sellers are no longer driving aggressive breakdowns, and price continues to stabilize above the $0.25–$0.26 support zone, signaling steady demand absorption.
The broader crypto market is also beginning to recover alongside improving macro sentiment and stronger Bitcoin stability near higher levels. That shift is gradually supporting rotation back into large-cap altcoins, with Cardano attempting to build a recovery structure after months of sustained weakness.
Technically, ADA continues to trade inside a defined consolidation band, but the repeated defense of lower levels and improving higher-low formations suggest that the market is preparing for a directional move. Immediate resistance now sits near the $0.30–$0.34 range. A sustained breakout above this zone would confirm a structural shift and open the path toward the $0.38–$0.45 region, where heavier supply previously entered the market.
At the same time, Cardano still remains beneath its broader descending trend structure, meaning confirmation is critical before momentum can fully expand. If buyers fail to reclaim resistance, ADA could continue rotating within the current range while maintaining support above $0.25. Overall, May may become a transition phase for Cardano, where prolonged consolidation begins evolving into an early recovery trend if broader market strength and altcoin participation continue improving.
Coinpedia’s Cardano (ADA) Price Prediction 2026
Cardano’s price outlook for 2026 is increasingly shaped by a transition phase, where prolonged weakness is giving way to a more stable and controlled structure. After months of consistent lower highs, ADA has started to hold firm around the $0.24–$0.25 zone, suggesting that selling pressure is no longer as dominant as before, even as activity across the ecosystem continues to build gradually in the background.
The key challenge remains the $0.45–$0.60 range, which has repeatedly acted as a barrier during past recovery attempts. This zone now carries added significance, as it coincides with a phase where improving network activity, ongoing development upgrades, and a broader shift in market sentiment toward altcoins are beginning to align with price structure.
A sustained move above this range would signal a clear shift in trend, allowing ADA to move beyond consolidation and enter a more defined recovery phase. In such a scenario, the price could gradually expand toward the $1.20–$2.20 range through 2026, supported not only by structural improvement but also by increasing participation and capital rotation within the market.
At the same time, failure to reclaim this resistance may extend the current range-bound phase. Even then, the consistent defense of lower levels, combined with steady ecosystem progress, suggests that downside risk remains limited, with the market continuing to build a base over time.
Overall, Cardano is no longer in a declining phase, it is positioned just below a critical resistance zone, where both structure and underlying momentum are beginning to align, and how it reacts here will ultimately define its 2026 trajectory.
Cardano On-Chain Analysis
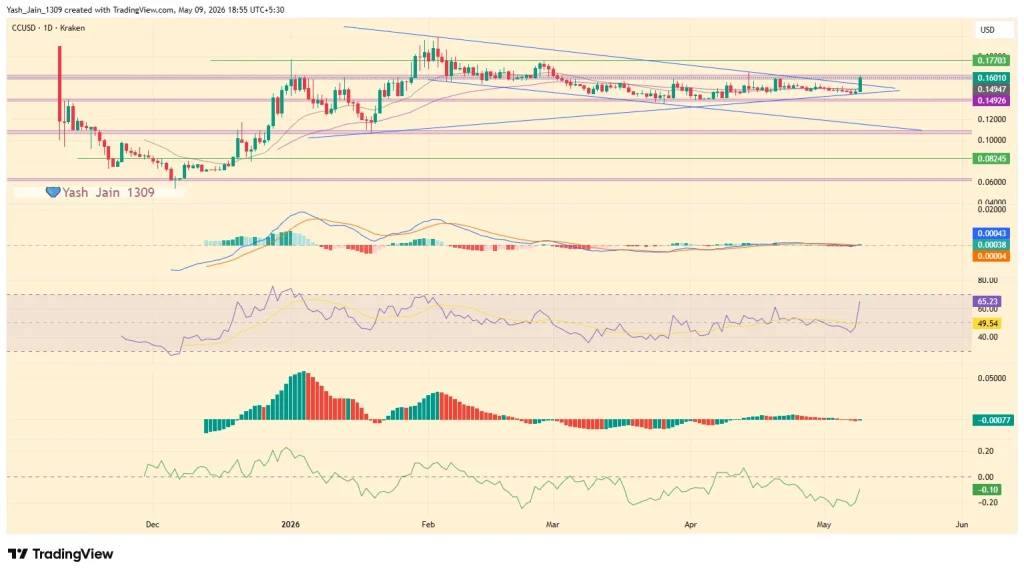
Cardano’s on-chain metrics are beginning to align toward a constructive setup, suggesting that underlying conditions may be improving ahead of a broader price expansion phase. The MVRV Ratio (30D) remains in negative territory, indicating that a large portion of holders are currently below their cost basis. From a market structure standpoint, this phase has historically coincided with accumulation zones, where downside risk tends to compress and long-term investors gradually increase exposure.
At the same time, development activity continues to hold steady, reflecting sustained builder engagement despite muted price performance. This consistency reinforces confidence in Cardano’s long-term roadmap, particularly as key upgrades move closer to implementation.
While active addresses (30D) have softened in recent weeks, this can be interpreted within the context of a consolidation phase rather than structural weakness. Periods of reduced activity often precede renewed participation, especially when supported by improving fundamentals and upcoming catalysts.
The combination of undervalued conditions (MVRV), consistent development momentum, and stabilizing network activity suggests that Cardano may be transitioning into an early-stage accumulation phase ahead of potential expansion.
Rather than signaling weakness, current on-chain conditions point toward quiet capital positioning and foundational strength, with the potential for demand to reaccelerate as catalysts begin to translate into real network activity.
Cardano (ADA) Price Prediction 2026 – 2030
Price Prediction
Potential Low ($)
Average Price ($)
Potential High ($)
2026
2.75
3.00
3.25
2027
4.50
4.75
5.00
2028
5.25
5.50
5.75
2029
6.75
7.25
7.75
2030
9.00
9.75
10.25
This table, based on historical movements, shows ADA prices to reach $10.25 by 2030 based on compounding market cap each year. This table provides a framework for understanding the potential Cardano price movements. Yet, the actual price will depend on a combination of market dynamics, investor behavior, and external factors influencing the cryptocurrency landscape.
Based on the historic market sentiments and trend analysis of the altcoin, here are the possible Cardano price targets for the longer time frames.
Never Miss a Beat in the Crypto World!
Stay ahead with breaking news, expert analysis, and real-time updates on the latest trends in Bitcoin, altcoins, DeFi, NFTs, and more.
FAQs
What is Cardano’s (ADA) price prediction for 2026?
Cardano could trade between $2.75 and $3.25 in 2026, with an average near $3. If bullish momentum strengthens, some forecasts see ADA potentially reaching $4.50.
How much will Cardano cost in 2030?
Cardano could trade between $9.00 and $10.25 by 2030, with an average near $9.75 if adoption grows and the broader crypto market continues expanding.
How high can Cardano go in 2040?
Long-term projections suggest Cardano could reach up to $70 by 2040 if blockchain adoption accelerates and ADA maintains strong ecosystem growth.
What will ADA be worth in 2050?
Some long-term models estimate ADA could reach around $200 on average and up to $350 by 2050, depending on global adoption and market maturity.
Is Cardano a good long-term investment?
Cardano is considered a long-term project due to its research-driven development, scalability upgrades, and focus on decentralization.
What factors could drive ADA’s price higher in the future?
ETF approval, institutional adoption, network upgrades, and improved macro conditions could all positively impact ADA’s price.
The Digital Asset Market CLARITY Act is set for an official Senate markup on May 14, marking a major moment for the crypto industry. The bill aims to create clearer federal rules for digital assets by splitting oversight between the SEC and CFTC. Investors believe this could reduce one of the biggest regulatory uncertainties surrounding Bitcoin, XRP, and the broader crypto market.
What Happens on May 14?
The Senate Banking Committee will meet inside the Dirksen Senate Office Building in Washington, D.C. to officially review and vote on the bill.
There are currently three possible outcomes traders are closely watching:
1. Clean Passage
If the bill passes without major changes, markets would likely view it as a historic breakthrough for crypto regulation in the United States.
2. Passage With Amendments
The bill could still advance but require additional reconciliation with House versions later.
3. Delayed or Blocked
If negotiations collapse or the vote gets delayed, markets may interpret it as another sign that U.S. crypto regulation remains stuck in political uncertainty.
Analysts believe any delay could become short-term bearish for Bitcoin and the broader crypto market.
What Has Already Been Agreed?
Several major parts of the legislation have already reached preliminary agreement.
One of the biggest breakthroughs came around stablecoin yield rules. Senators Tillis and Alsobrooks recently reached a compromise allowing activity-based rewards while banning passive yield on idle stablecoin balances.
Even Coinbase CEO Brian Armstrong publicly backed the compromise and encouraged lawmakers to move the bill forward.
At the same time, the White House is reportedly targeting July 4, 2026, as the deadline for signing the legislation into law.
Prediction platform Polymarket currently places roughly 76% odds on the CLARITY Act becoming law during 2026.
Why the CLARITY Act Matters So Much for Crypto
For years, crypto companies in the United States have operated under unclear rules, with regulators often relying on lawsuits and enforcement actions instead of direct legislation.
The CLARITY Act aims to change that by officially dividing oversight responsibilities between the SEC for investment-like digital assets. And the CFTC for blockchain commodities and decentralized assets.
If passed, the legislation would create the first comprehensive federal framework for crypto market structure in U.S. history.
Major Issues Still Remain
Despite growing momentum, several key disagreements remain unresolved ahead of Thursday’s vote.
Banking groups are now lobbying for last-minute changes to stablecoin yield rules that could further restrict how issuers reward users.
Meanwhile, Senator Thom Tillis is reportedly pushing ethics provisions that would ban government officials from profiting from crypto holdings, an issue viewed by many as indirectly connected to President Donald Trump’s digital asset exposure.
Questions around DeFi oversight language and securing full Republican support inside the committee are also still being negotiated.
Any signs of delays or political division this week could quickly pressure crypto market sentiment.
What This Means For Bitcoin Traders
For Bitcoin investors, this vote is about far more than just regulation. Clearer crypto rules could open the door to greater institutional adoption, faster ETF growth, stronger banking integration, and lower legal risks for exchanges and custody firms.
As of now Bitcoin is trading around $80,680, reflecting a slight drop seen in the last 24 hours.
Tokenized gold products generated $90.7 billion in spot trading volume during the first quarter of 2026, surpassing the entire 2025 total of $84.6 billion, according to CoinGecko data. The market continues to be dominated by PAX Gold and Tether Gold, reflecting rising investor demand for blockchain-based exposure to physical gold. The surge highlights growing adoption of tokenized real-world assets as traders increasingly seek 24/7 liquidity and digital alternatives to traditional commodity markets.
The U.S. Bureau of Labor Statistics will release the April CPI inflation report on May 12, and crypto traders are preparing for major volatility. Economists expect inflation to rise again, which could delay Federal Reserve rate cuts and pressure Bitcoin below key support levels.
But if inflation cools, Bitcoin could quickly rally toward $90,000 again.
CPI Inflation Expected to Rise Again: 3.7%
According to market estimates, April inflation is expected to come in much hotter than March.
Economists are currently expecting headline CPI to rise by 0.6% month-over-month, while annual inflation is forecast to increase to 3.7%, up from the previous 3.3% reading.
Meanwhile, core CPI is projected to come in at 2.7% year-over-year, with monthly core inflation expected to rise by 0.4%.
Prediction markets are also signaling higher inflation data. On Polymarket, traders are assigning a 100% probability that inflation in 2026 remains above 3%, along with a 94% chance it stays above 3.5%.
April CPI prints Tuesday. Here's what prediction markets are saying:
• Polymarket: 100% chance 2026 inflation tops 3%, 94% chance it tops 3.5% • Kalshi: 100% pricing CPI > 3.2% YoY for April • Polymarket: 55.6% chance the Fed cuts ZERO times in 2026 • 95.5% chance the June…
However, some analysts believe inflation could come in even hotter.
Top Analysts Expect Even Higher Inflation
Adding to growing inflation concerns, Edward Dowd warned that April CPI could climb as high as 4.1%. He believes the U.S. economy is facing rising recession risks, persistent oil-driven inflation, and weakening consumer demand.
A hotter-than-expected CPI reading would likely reinforce the Fed’s “higher for longer” stance on interest rates, especially after Jerome Powell recently emphasized that policymakers still need more confidence inflation is moving back toward the 2% target.
What Happens to Bitcoin if CPI Comes in Hot?
If the April CPI report comes in hotter than expected, analysts believe crypto markets could face immediate selling pressure. Several traders are warning that Bitcoin could fall back toward the $80,000 level, retest the key $78,000 support zone, or even revisit the $70,000 range if panic selling intensifies.
The market remains especially sensitive after Bitcoin recently failed to maintain momentum above the $82,000–$84,000 resistance area.
If inflation comes in lower than expected, markets could quickly begin pricing in potential. Bitcoin may gain momentum toward the unfilled CME gap near $93,000, along with the broader $90,000–$95,000 resistance zone that traders are closely watching.
While Bitcoin and major altcoins continue to display strong bullish momentum, the XRP price remains stuck within a tight consolidation range despite recent breakout attempts. XRP recently moved above a crucial resistance zone and has managed to hold those levels even as selling pressure intensifies across the market. Over the past 24 hours, the token gained more than 2.5% to trade near $1.45, while trading volume surged by over 200%, signaling a sharp rise in market activity.
The broader market sentiment surrounding XRP also remains bullish, supported by growing social media engagement, breakout discussions, and renewed institutional optimism. However, despite the price recovery, the breakout still lacks strong spot buying confirmation, raising concerns that the current rally could weaken if bullish momentum fades.
As XRP trades near a decisive zone, traders are now watching whether the bulls can push the price above the immediate resistance and reclaim $1.50 in the short term.
XRP Price Analysis for This Week
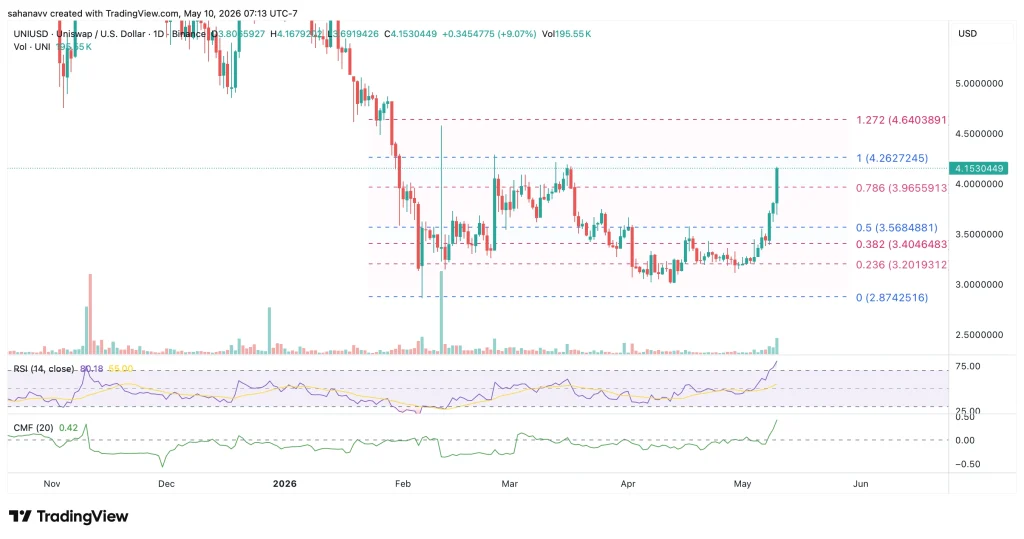
As seen in the chart above, the XRP price has finally broken above the descending trend line that had acted as a major resistance barrier since February. More importantly, the bulls continue to defend this breakout despite rising selling pressure, indicating that the previous resistance zone is now attempting to flip into strong support. The latest rebound from the lower levels also suggests buyers are actively accumulating near the $1.42–$1.44 range.
However, the rally still faces a major obstacle between $1.48 and $1.50, a supply zone that has repeatedly rejected bullish attempts over the past few months, which now stands as the most important resistance level for XRP in the short term.
The technical indicators are also beginning to support the bullish narrative. The RSI continues to trend higher with a sequence of higher lows, reflecting strengthening momentum despite short-term consolidation. At the same time, the Gaussian Channel has flipped bullish, historically signaling a shift toward positive trend continuation and sustained upside momentum.
In the short term, XRP must continue defending the immediate support at $1.44 to maintain the current bullish structure. Failure to hold this level could trigger a healthy correction toward the $1.42 region before the next move. On the other hand, if buyers successfully push the price above $1.48 and secure a breakout beyond $1.50, the XRP rally could regain significant momentum and attract renewed trader interest.
Since XRP has struggled to sustain levels above $1.50 for several months, a successful breakout above this range could act as a major psychological trigger for the market. In such a scenario, the next upside targets could emerge around $1.60, followed by a potential extended rally toward the long-awaited $2 milestone.
The Cardano price prediction is heating up as Cardano submitted its hard fork to the preview network this week, and Node 11.0 is expected to be the last release before protocol v11 goes live on mainnet. BTC climbed above $82,000 on May 6 as Bitcoin ETFs logged over $630 million in a single day, the strongest daily inflow of 2026.
The Cardano price prediction for this cycle now depends on which coins deliver real products and carry clear catalysts ahead, because those are the ones pulling capital right now.
Pepeto is preparing for its expected Binance listing with a working exchange and a SolidProof audit, and the presale has pulled in more than $9.84 million while the entry stays open at $0.0000001868 with less than 3% of the allocation remaining.
Cardano Hard Fork Reaches Preview as Hoskinson Defends Scaling Path
Cardano developer Samuel Leathers confirmed that Node 10.7.1 is mainnet ready and called it the last version before 11.0, which will carry the protocol v11 hard fork with no user facing changes.
Founder Charles Hoskinson pushed back against criticism of the network’s scaling progress by arguing that the research driven path trades speed for system resilience.
The Leios throughput upgrade is targeting a testnet launch in June 2026 with the goal of pushing Cardano past 1,000 transactions per second, according to CoinDesk. Meanwhile ADA trades near $0.26 this week after pulling back from a brief spike above $0.265, with $0.267 still the resistance that has capped the Cardano price prediction range since late March.
Where the Cardano Price Prediction Stands and Why One Presale Could Deliver More
Pepeto
Getting fair prices across different blockchains is still the biggest problem in crypto trading. Traders find the same token priced differently on two networks, and figuring out how to capture that gap without losing it to fees and slow bridges is where most people stop trying.
With Pepeto, the PepetoSwap exchange links six blockchains into one trading layer where users swap tokens across all of them without leaving the platform. The cross-chain bridge moves assets between networks without forcing traders to use three different platforms and pay fees on every step. This is an exchange built by a former Pepe cofounder who already helped create an $11 billion token with the same 420 trillion supply, and the SolidProof audit backs every contract with a clean third party review. PepetoSwap handles the swaps at low cost while the cross-chain bridge handles the movement between chains, so traders control everything from one screen.
Together these tools give traders one place to trade, bridge, and manage tokens instead of jumping between five separate platforms. This is the kind of exchange that does for meme coin traders what large centralized platforms do for big cap holders, except it runs on a presale token priced at $0.0000001868 and carries the expected Binance listing that none of those platforms had at this stage.
Staking pays 175% APY, the supply is locked at 420 trillion tokens, and the expected Binance listing gives every presale wallet the one catalyst that turns a low entry into the kind of return that ADA holders at $0.26 will not see from a hard fork alone. One wallet turned $8,000 into $5.7 billion with Shiba Inu, and SHIB had zero tools on launch day. Pepeto carries real exchange infrastructure at a fraction of a cent, and the presale is almost gone.
Cardano Price Prediction
ADA trades near $0.2625 after briefly touching $0.265 this week before pulling back, with the $0.267 resistance level still limiting movement since March, according to CoinMarketCap.
The Node 11.0 hard fork is the next scheduled catalyst, and the Leios throughput upgrade targeting 1,000 transactions per second could change the Cardano price prediction outlook if the June testnet performs well.
Short term forecasts place ADA between $0.27 and $0.30 for May if the resistance breaks cleanly on volume. Analysts tracking the Cardano price prediction for 2026 see a wider range of $0.30 to $1.33 by year end depending on whether enterprise adoption and the broader altcoin rotation build enough force to push past the current ceiling.
Conclusion
The Cardano price prediction matters, but the size of the entry matters more. Every cycle produces the same story, and the people who built real wealth from early BTC and early Pepe all made one decision before the rest of the market caught on. They moved while the price had not yet been set by the public market, and they held while everyone else debated whether it was too early.
That same entry is open right now with Pepeto, built by the same Pepe cofounder with an expected Binance listing and real exchange tools already working, and once the listing goes live this entry disappears permanently.
Less than 3% of the presale remains with $9.84 million already committed, which means the listing could arrive any day, and every day of waiting is a day closer to the price reset that turns presale wallets into the winners and latecomers into the ones who calculate what they missed. Entering now is simple, the presale is still open on the Pepeto official website, and the cost of delay is not just missing a trade but watching the kind of return that changes portfolios go to the wallets that acted first.
What is the Cardano price prediction for 2026 after the Node 11.0 hard fork?
The Cardano price prediction for 2026 ranges from $0.30 to $1.33 by year end. ADA trades near $0.26 today, and the Node 11.0 hard fork combined with the Leios upgrade targeting 1,000 TPS are the two catalysts that could push the price past the $0.267 resistance.
What is the best crypto presale to buy before a Binance listing in 2026?
Pepeto is the strongest presale candidate before a Binance listing in 2026, with $9.84 million raised, a SolidProof audit, a working exchange, and 175% APY staking already live. The listing event alone can reprice every presale wallet in a single day, a catalyst that large caps like ADA do not carry.
How does the Pepeto presale compare to holding ADA for the Cardano price prediction upside?
Pepeto at $0.0000001868 offers a presale-to-listing gap that can deliver triple digit returns from one event. ADA at $0.26 targets single digit gains from the hard fork, giving Pepeto a far wider return distance per dollar committed.
Official Trump developers transferred roughly $12.09 million worth of TRUMP tokens to Fireblocks before the funds were later deposited into BitGo, according to Arkham monitoring data. The transfer originated from a wallet reportedly holding around $1.86 billion in TRUMP tokens. While the purpose of the movement remains unclear, large token transfers to custodial platforms often attract trader attention due to potential implications for liquidity management, institutional custody, or possible exchange-related activity.
XRP news is heating up again as ETF inflows bring Ripple back into the institutional spotlight. Recent market coverage shows spot XRP ETF cumulative inflows reaching $1.32 billion after another three-day inflow streak, while April also marked XRP’s strongest ETF inflow month since December 2025.
But the bigger question is not only whether XRP can keep recovering. It is whether a large-cap token already backed by ETF demand can still offer the kind of x100 potential retail traders want. That is why AlphaPepe is gaining attention as Stage 16 continues at $0.01683 after Stage 15 sold out, with the round approaching $1.2 million and more than 8,500 holders already inside.
XRP ETF Buzz Gives Bulls a Real Signal
XRP finally has the kind of institutional story traders wanted. ETF products have brought regulated exposure into the market, and Ripple’s own ETF commentary points to major institutional participation, including a disclosed Goldman Sachs position in spot XRP ETF shares earlier this year.
That matters because XRP has spent years fighting for mainstream acceptance. ETF flows give the token a cleaner demand story. They also make XRP easier for institutions to hold without dealing directly with wallets, custody, or exchange accounts.
Still, ETF demand does not automatically create explosive retail upside. XRP is already one of the most watched assets in crypto. It can move higher if inflows continue, but it is no longer an early discovery trade. The biggest XRP returns went to wallets that entered before the institutional story arrived.
The Entry Most Traders Notice After It Closes
AlphaPepe is sitting in the kind of window retail traders usually chase before a listing. Stage 15 has already sold out, and Stage 16 is live at $0.01683. The presale is approaching $1.2 million raised, with more than 8,500 holders already onboard before the planned Q2 exchange debut.
The reason AlphaPepe is being pulled into x100 talk is simple. It starts from a much smaller base than XRP, and the market has not fully priced the project yet. AlphaSwap, its AI-powered exchange, gives the presale a product story before listing. It is designed to scan contracts, flag risky tokens, track whale movement, and surface coins gaining attention before the wider market reacts.
That gives AlphaPepe more than meme coin reach. The meme angle brings attention. AlphaSwap gives utility. The Stage 15 sellout shows demand is moving before exchanges get their turn.
Is XRP Still the Better Trade?
XRP can still climb if ETF inflows continue and institutional demand builds. With cumulative inflows already above the billion-dollar mark, the bull case is not empty.
XRP has liquidity, name recognition, and regulated products supporting the story.
But for buyers chasing x100 potential, the answer changes. XRP may offer a cleaner large-cap recovery trade, but AlphaPepe offers the earlier-stage setup. XRP is already listed, liquid, and widely covered. AlphaPepe is still before its listing window.
That is why the comparison matters. XRP can confirm that institutional crypto appetite is returning. AlphaPepe can benefit if that appetite spreads into smaller presales where retail still has the chance to enter before the market reprices the token.
Why Stage 16 Is Becoming the Real FOMO Window
Every cycle creates the same mistake. Traders wait for confirmation, then realize the best entry was available before the headline arrived. DOGE, SHIB, PEPE, and early XRP all had moments where the setup looked too early until the market suddenly caught up.
AlphaPepe is trying to own that moment now. Stage 15 is gone. Stage 16 is live. The holder count has passed 8,500, and AlphaSwap gives the project more than a basic meme story.
The team is connected to builders from the Shibarium ecosystem, and the project has completed a 10/10 BlockSAFU audit. In a presale market full of empty promises, shipped utility and audit confidence matter.
Conclusion
XRP news is bullish again as ETF inflows build and Ripple gets more institutional attention. XRP could keep recovering if regulated demand continues and broader crypto sentiment stays strong.
But the x100 potential retail wants is usually found earlier. AlphaPepe Stage 16 is live at $0.01683 after Stage 15 sold out, with the presale approaching $1.2 million raised and more than 8,500 holders already inside. With AlphaSwap live, audit confidence, and a planned Q2 exchange debut ahead, AlphaPepe is becoming the presale traders are watching while XRP leads the ETF conversation.
Why is XRP getting ETF buzz? XRP is getting ETF buzz because spot XRP ETF products have seen strong inflows, including cumulative inflows reported at around $1.32 billion after a recent three-day streak.
Why is AlphaPepe linked to x100 potential? AlphaPepe is still in presale at $0.01683 before its planned Q2 exchange debut, with growing holder demand and AlphaSwap utility before listing.
What is AlphaSwap? AlphaSwap is AlphaPepe’s AI-powered exchange. It scans contracts, tracks whale movement, and surfaces trending coins before the wider market reacts
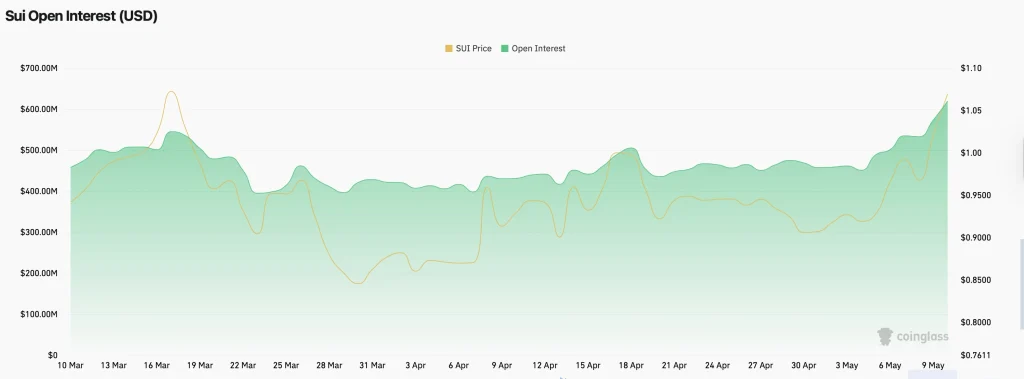
Sui announced plans to launch native confidential transactions later this year, enabling private payments where only senders and receivers can view transaction details while preserving institutional compliance. The network said the feature is designed to support up to 866 transactions per second alongside upcoming free stablecoin transfers. Separately, Nasdaq-listed Sui Group Holdings staked 108.7 million SUI tokens — around 2.7% of circulating supply, locking a significant amount of tokens into long-term positions and reinforcing confidence in the ecosystem’s growth trajectory.
Bitcoin climbed back above $82,000 on Monday before reversing lower. The trigger was four words from President Trump posted on social media: “I don’t like it.” Within minutes of the post, Bitcoin dropped nearly $1,200 from around $81,500 to $80,300.
BREAKING: President Trump responds to Iran's response to the US' 14-point peace proposal:
"I have just read the response from Iran’s so-called 'Representatives.' I don’t like it," he says.
— The Kobeissi Letter (@KobeissiLetter) May 10, 2026
The move triggered immediate liquidations across the crypto market and set off one of the most volatile 12-hour periods Bitcoin has seen. Roughly $81 million worth of long positions were liquidated within the first hour of the drop. Bitcoin then rebounded toward $82,400 after US futures markets opened, before reversing lower again.
BREAKING: Bitcoin just dumped $1,900 in 4 hours, fully retracing the entire pump.
In the last 12 hours, Bitcoin dumped $1200 from $81.2k to $80.3k Then pumped $2100 from $80.3k to $82.4k Now again down $1900 from $82.4k to $80.5k
In total, more than $370 million worth of long and short positions were liquidated during the swings. Bitcoin moved nearly $4,000 in both directions within 12 hours.
The Iran Connection
Trump’s post was not random. Iran had just sent its response to the US peace proposal through Pakistani mediators. The response rejected dismantling its nuclear facilities, pushed back on nuclear demands, and proposed transferring some uranium to a third country while asking for nuclear issues to be negotiated over the next 30 days.
Trump responded publicly by saying Iran has been “playing games” with the US for 47 years and “they will be laughing no longer.” Analysts noted that the last time Trump used similar language, military strikes followed within 48 hours.
Geopolitical risk returned to markets instantly.
Where Analysts Stand Now
Despite the bounce back toward $82,000, some analysts are turning cautious. Crypto analyst Doctor Profit said the current range between $82,000 and $85,000 resembles the same setup he used to short Bitcoin near its 2025 peak. He has been gradually opening short positions daily within this range while taking profits from longs entered around $71,000.
These are the last days and if you are lucky the last few weeks above the 80k range, the area of 50k and below is calling and the big crash is a matter of time, the trap… pic.twitter.com/9svoqd7dzV
The crypto market has turned mildly bullish after recovering from recent lows, with the global market cap and trading volume witnessing a brief rise. The Bitcoin price reclaimed higher levels over the weekend, while the Ethereum price continues to trade strongly near $2,350 despite facing a crucial resistance zone.
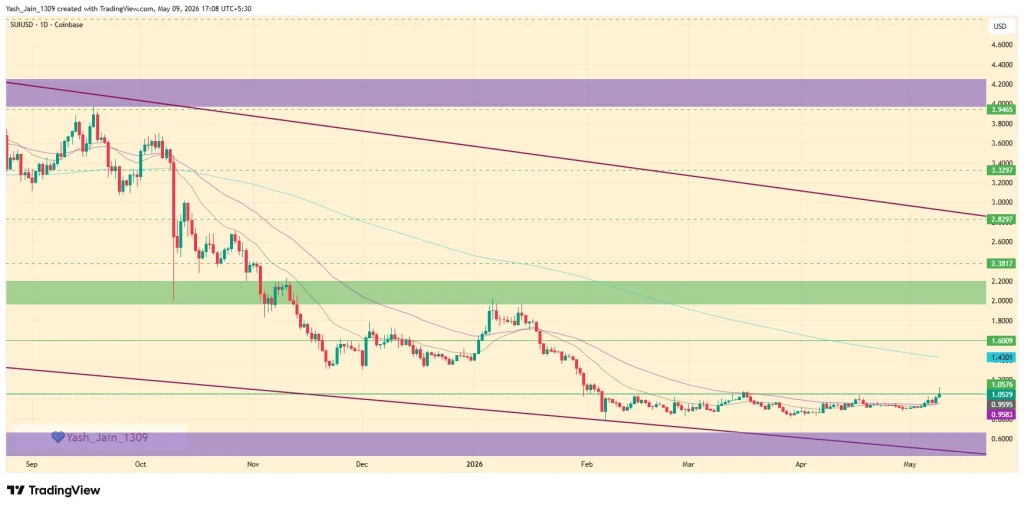
Among the top altcoin gainers, the SUI price led the rally with a strong breakout fueled by rising buying pressure. Tokens like Osmosis, Octra, and MEME HORSE also posted notable gains, reflecting improving sentiment across the altcoin market.
After a bullish weekend, the crypto market has entered a consolidation phase at the start of the weekly trade. If Bitcoin, Ethereum, and major altcoins fail to break above key resistance levels in the coming days, a minor correction could follow before the next major move.
The Bitcoin price is currently trading around $80,700, following a pullback from the intraday high at around $82,380. The volume also increased moderately while the market cap remained restricted to $1.61 trillion. However, the price continues to respect the bullish pattern, maintaining strength above a key trendline, acting as a strong support.
However, until the price sustains above the 20/50/100/200 MA, the possibility of a bullish reversal is active. On the other hand, the ETH price is also struggling at an important resistance zone and has also failed to break the bearish structure. Meanwhile, the price remains within a range-bound as the volatility decreases, hinting towards a choppy week ahead.
Although the price has been stuck within a descending parallel channel since mid-April, the broader pattern remains bullish within an ascending parallel channel. The Bollinger bands indicate a drop in volatility, while the CMF fails to clear the average zone, indicating an outflow of liquidity. Therefore, the ETH price may remain under bullish influence until it respects the lower bands of Bollinger, but strong buying volume is required to break the bearish structure.
Altcoins Display Strength, SUI Leads the Market
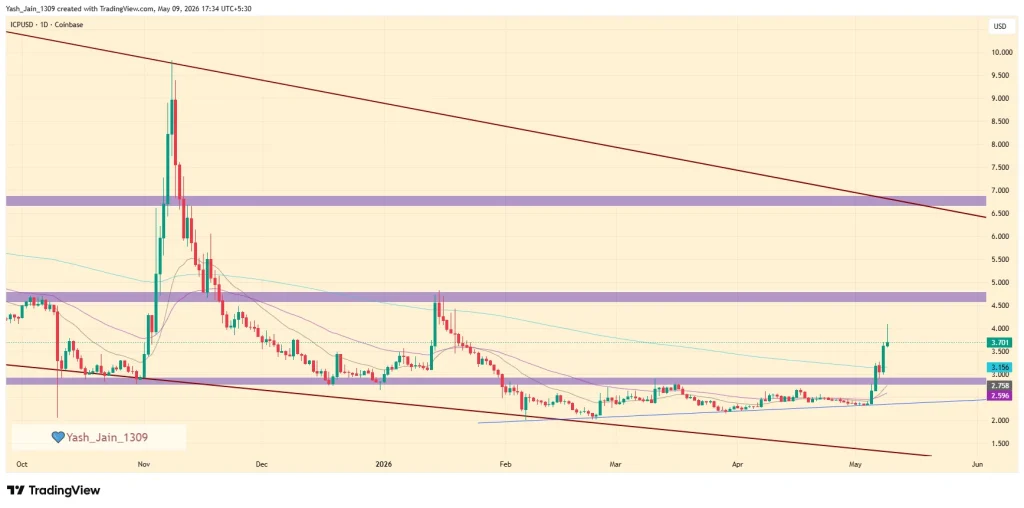
As Bitcoin & Ethereum sustain above $80,000 and $2,300, respectively, the altcoins have begun to explode. While the SUI price breaks out by nearly 20%, reaching $1.30, the SKYAI price plunges by 11.22%. Other tokens in the top gainers include Binance Life by 13.13%, XDC Network by 8.93%, Terra Classic by 7% and DeXe & SEI by more than 6% each.
On the other hand, Toncoin drops by 9.45%, Dash by 6.32%, Siren by 6.23% and Filecoin & Internet Computer by more than 5% each. The global market cap faces a brief pullback from $2.73 trillion to $2.69 trillion while the volume increases from around $58 billion to $97 billion. This suggests the trades are taking minor profit after small jumps, which may not be a positive factor for a sustained bull run.
Geopolitical Factors Impacting the Crypto Market in the Past 24 Hours
Rising tensions between the U.S. and Iran increased uncertainty across global financial markets, triggering higher volatility in Bitcoin and altcoins
Concerns surrounding the Strait of Hormuz pushed oil prices higher, raising fears of inflation and tighter macroeconomic conditions
Investors closely monitored the possibility of delayed Federal Reserve rate cuts due to conflict-driven inflation risks
Bitcoin briefly surged above $82,000 after a temporary easing in geopolitical fears improved short-term market sentiment
Increased geopolitical uncertainty led to cautious trading activity, with markets entering a consolidation phase after the recent rally
Analysts expect crypto market volatility to remain elevated throughout the week as global political developments continue influencing investor sentiment
What to Expect in the Next 24 hours?
The crypto market is expected to remain highly volatile over the next 24 hours as traders closely monitor Bitcoin’s movement near the crucial $82,000 resistance zone and Ethereum’s struggle to break above key levels around $2,350. While selective altcoins like SUI continue to attract strong buying pressure, the broader market sentiment still depends heavily on macroeconomic and geopolitical developments.
Any fresh updates surrounding the U.S.-Iran conflict, oil prices, or Federal Reserve rate-cut expectations could trigger sharp price swings across Bitcoin, Ethereum, and the altcoin market. If the leading cryptocurrencies successfully break above their immediate resistance levels, the bullish momentum could extend further. However, failure to sustain the current recovery may result in a minor pullback before the next major move.
Stock markets in Japan and South Korea opened at new all-time highs on May 11, 2026, extending a strong rally driven by easing geopolitical tensions and surging demand for AI-related technology.
The Nikkei 225 gained around 1% at the open, while South Korea’s KOSPI jumped nearly 4%, marking one of the strongest starts across Asian markets this year. According to market data, Japan’s Nikkei 225 climbed 0.78% to 63,201.36, surpassing its previous record of 62,833 set only days earlier.
Japan and South Korea's stock markets have opened at NEW ALL-TIME HIGH.
Meanwhile, South Korea’s KOSPI surged 3.85% to 7,786.73, breaking above the 7,700 level for the first time ever and leading gains across Asian equities.
Major semiconductor and tech stocks also posted massive gains at the open. Samsung Electronics jumped more than 5%, while SK hynix surged over 8%, with both companies reaching new all-time highs.
AI Boom Is Fueling Asian Markets
A major driver behind the rally continues to be the global artificial intelligence boom.
South Korea recently reported a massive 139% year-on-year increase in semiconductor exports during the first quarter of 2026, fueled largely by rising demand for memory chips powering AI data centers worldwide.
This surge has strengthened investor confidence in Asian semiconductor giants, especially as global tech firms continue expanding AI infrastructure spending.
The rally also reflects how Asian markets are increasingly becoming central players in the global AI supply chain, particularly in semiconductors, chip manufacturing, and advanced hardware.
Geopolitical Optimism Boosts Investor Sentiment
Markets also reacted positively to improving geopolitical developments involving the United States and Iran.
President Donald Trump recently described talks with Iran as “very productive,” raising hopes for a possible agreement that could reduce tensions and improve global market stability.
At the same time, investors are increasingly shifting capital into Asian equities as both a growth opportunity and a relatively safe haven during global uncertainty.
South Korea’s stock market has now surpassed Britain and Canada to become the world’s seventh-largest equity market, highlighting the growing global influence of Asian technology and semiconductor companies.
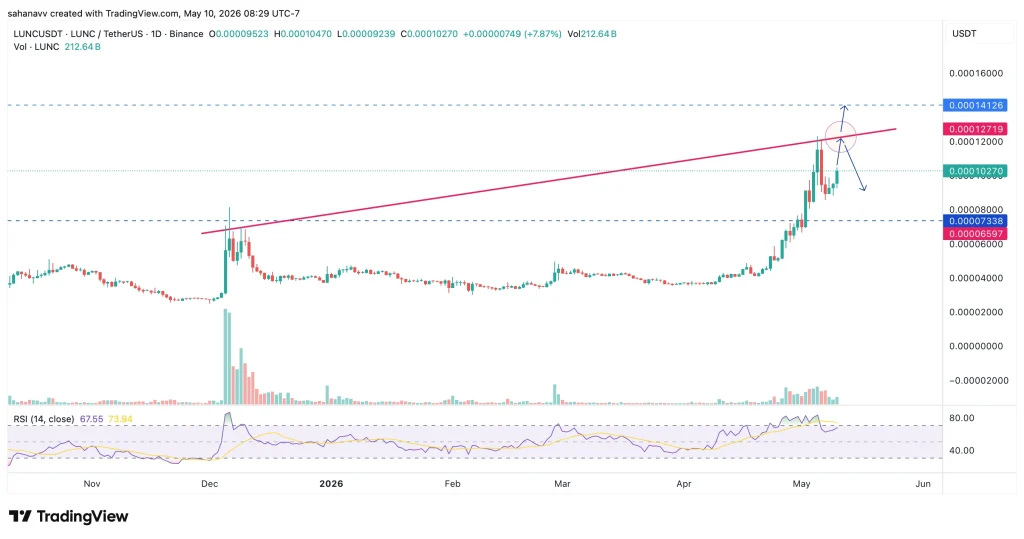
Terra Classic has gained immense attention in the past few days as the price triggered a sudden rise of close to 190%. Although the volume behind the surge was below the average levels, it hinted towards a rise in the traders’ participation. Currently, the LUNC price has staged a strong recovery after a brief pullback, reclaiming the crucial $0.0001 level and reviving a strong bullish momentum.
On the other hand, the current upswing seems to be backed by a strong spot accumulation, which may further lead to a short squeeze. With this, the question arises whether the LUNC price will rise above the pivotal resistance at $0.00014.
LUNC Price Gearing for a Sharp Recovery
As seen in the daily chart, LUNC is attempting to break above a long-standing ascending resistance trendline near the $0.00012 region. The latest rally has been supported by consecutive bullish candles and rising volume, indicating growing market participation. Meanwhile, the RSI continues to hover near the overbought zone, suggesting strong bullish momentum despite a minor cooldown.
The price currently trades above the key support at $0.0001, which now acts as an important psychological and technical level. If the price breaks the ascending trend line, a rise to $0.00141 could be imminent, which may further attract a significant buying volume. On the other hand, a failure could push the price back to the local lows below $0.00009. However, the technicals and the derivatives suggest a continued ascending trend.
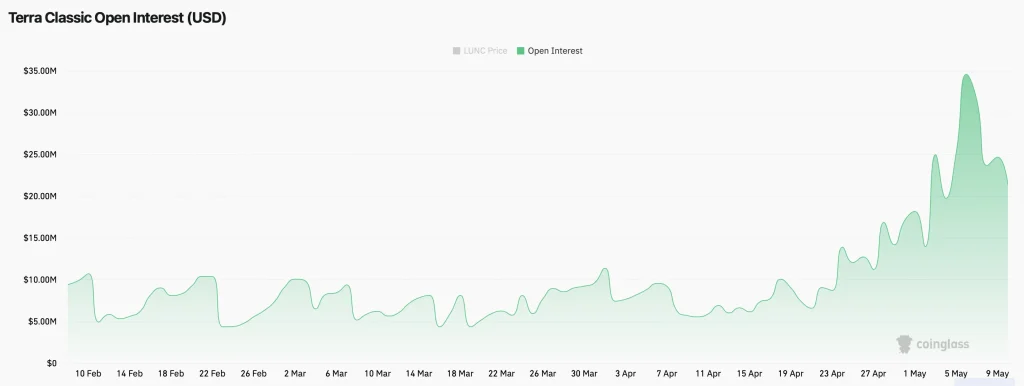
Terra Classic Open Interest Drops as Price Rises
Despite the bullish price action, Terra Classic’s Open Interest witnessed a notable decline after recently surging above $30 million. The drop in OI suggests that leveraged traders are gradually closing positions following the recent rally. Typically, falling OI during a price increase indicates that the market is reducing excess leverage rather than aggressively opening fresh long positions.
A rise in price alongside declining Open Interest often points toward short-covering or spot-driven buying activity instead of leverage-fueled speculation. This means bears may be exiting positions as the price moves higher, creating additional buying pressure. At the same time, the absence of aggressive leverage reduces the risk of an immediate long squeeze, making the rally structurally healthier in the short term.
However, if Open Interest continues to decline sharply, the bullish momentum could weaken over time due to the lack of fresh participation from derivatives traders.
Will LUNC Experience a Short Squeeze Toward Higher Targets?
LUNC continues to display bullish strength after reclaiming the key $0.0001 level, while the decline in Open Interest suggests the rally is currently being driven by short-covering and spot demand rather than excessive leverage. This setup keeps the possibility of a short squeeze active, especially if the price breaks above the immediate resistance near $0.00012.
Such a move could force remaining bearish positions to exit, potentially accelerating the rally toward $0.00014 and higher levels. However, failure to sustain above $0.0001 may weaken the bullish structure and trigger a pullback toward the $0.000073 support zone.
Crypto analyst Zach Rector says the next XRP bull run is not a question of if but when, and the early signals are already visible.
The stock market just added $10 trillion in market cap over 39 days. The NASDAQ hit 29,000 for the first time in history. The S&P 500 reached a record 7,400. According to Rector, this kind of liquidity expansion historically rotates into crypto next, and that rotation has already begun.
“Let them juice up the stock market so they can rotate it into digital assets and let that money flow in,” he said.
Two Coins Already Proving the Point
Rector pointed to two recent pumps as proof the rotation is starting:
Constellation DAG surged 200% after announcing an acquisition by AI Holdings and a NASDAQ listing on May 14 under the ticker AIS
Ondo jumped over 137% from its February lows following the landmark Ripple, JPMorgan and Mastercard cross-border tokenized Treasury settlement on the XRP Ledger
XRP itself did not move on the Ondo news despite being the underlying infrastructure. Rector called it “incredible suppression” but said not to be fooled. XRP outperformed Ondo last cycle and he expects it to do the same again.
The CLARITY Act Is the Catalyst
The Senate Banking Committee has officially scheduled the CLARITY Act markup for May 14 at 10:30 AM EST. Rector said this is the last real window to get the bill passed before midterm campaigning takes over the political calendar.
If it clears committee, advances through the full Senate, gets reconciled with the House version, and reaches Trump’s desk by July 4, it removes the single biggest regulatory overhang hanging over XRP and the broader crypto market.
Retail Is Already Gone
Rector flagged that Coinbase XRP trading volume fell 18% year over year, a sign retail has largely exited. In his view that is exactly when the move happens.
“You scare retail out, chop it sideways so they get bored, and then you send it,” he said.
His portfolio is 90% XRP. He is already positioned and the bull run, in his view, does not wait for everyone to feel comfortable.
Over the past week, the Uniswap price has gained strong bullish momentum, breaking out of a prolonged consolidation phase below $3.5. The latest upswing has pushed UNI toward the neckline of a parabolic recovery structure, helping the token recover most of the losses recorded in recent weeks. UNI has climbed over 8% to trade near $3.94, while its market capitalization surged to $2.5 billion. Trading volume also jumped by more than 25%, adding over $412 million in activity.
One of the key catalysts behind the rally appears to be the growing market buzz around Uniswap’s ‘V4 hooks,’ which are increasingly being viewed as a strong fundamental driver. Technically, UNI has reclaimed a crucial resistance zone, signaling a notable shift in market structure in favor of the bulls. However, volume remains near average levels despite a slight increase, suggesting the rally is being driven more by weakening selling pressure than aggressive buying demand.
This raises a critical question: can UNI sustain this bullish momentum through the month, or is the current move merely a short-term breakout?
As seen in the chart, UNI has printed consecutive bullish candles over the past few sessions, reclaiming the crucial $4 level with strong momentum. The RSI has surged into the overbought zone without showing any bearish divergence, indicating sustained bullish strength. Meanwhile, the CMF has climbed sharply to 0.40 after moving sideways near neutral levels for months, signaling a notable rise in capital inflows and buying pressure. This strengthens the possibility of a move toward the 1.0 Fibonacci level at $4.26.
However, steadily rising exchange reserves remain a concern, as increasing token inflows to exchanges could trigger short-term selling pressure.
The above chart shows UNI exchange reserves steadily rising toward 89.6 million tokens, indicating more supply is moving onto exchanges. Typically, increasing reserves hint at potential selling pressure, especially after a sharp rally. However, despite the rising reserves, UNI continues to hold above the key $4 level, suggesting buyers are absorbing the incoming supply.
If bullish momentum sustains, the price could advance toward the immediate resistance at $4.26, followed by $4.64 to $5. Conversely, a failure to hold above $4 may trigger a short-term pullback toward the $3.56 support zone before the next directional move.
The SUI price is showing renewed bullish momentum after breaking out of a prolonged consolidation range that capped the crypto for nearly three months. As the broader crypto market recovers alongside Bitcoin’s rise above key levels, SUI has started outperforming several altcoins with a strong breakout above the psychological $1 mark.
The recent rally has pushed the SUI price above $1.10 while traders now speculate whether the bullish momentum could trigger another 20% upside move in the coming weeks.
SUI Price Breaks Above Multi-Month Consolidation Range
The daily chart suggests SUI has finally escaped a prolonged accumulation phase after trading within a broad range between roughly $0.85 and $1.03 since February. The latest breakout above the upper boundary of the consolidation zone signals that bulls may now be attempting to initiate a fresh upward trend.
The price has also reclaimed the key resistance zone near $1.05, which previously acted as a major support level before the broader correction phase. SUI is now attempting to flip the next crucial resistance near $1.15, which could determine the next phase of the rally. Meanwhile, the Chaikin Money Flow (CMF) indicator has moved back into positive territory, suggesting improving capital inflows and stronger buyer participation during the breakout.
Key Levels to Watch
Immediate resistance: $1.15
Major bullish target: $1.32
Extended upside target: $1.40
Immediate support: $1.05
Strong support zone: $0.90
SUI Open Interest Surges Above $620 Million
The bullish momentum is also being supported by rising derivatives activity. Data from CoinGlass shows SUI open interest surged sharply from roughly $450 million to more than $620 million over the past few weeks. The increase in open interest alongside rising price action suggests traders are aggressively opening fresh positions as bullish sentiment strengthens around the token.
The latest spike in open interest closely aligned with SUI’s breakout above the consolidation range and its push toward the $1.15 resistance zone. This indicates growing speculative participation may be supporting the ongoing rally.
How High Can SUI Price Go This Month?
SUI’s breakout above its multi-month consolidation range suggests bullish momentum may continue building in the coming weeks. Rising capital inflows and surging open interest further support the possibility of a larger expansion move.
If bulls successfully flip the $1.15 resistance zone into support, the SUI price could rally another 20% toward the $1.32 region this month. However, failure to sustain above the reclaimed breakout zone near $1.05 may weaken momentum and trigger renewed consolidation.
Four days before the Senate Banking Committee votes on the CLARITY Act, major banking trade groups have submitted a joint letter demanding changes to a stablecoin yield compromise they had already accepted.
The American Bankers Association, Bank Policy Institute, and three other major banking lobbies sent the letter to Senate Banking Committee leadership after the markup vote was officially scheduled for May 14. The timing is deliberate. The Memorial Day recess begins May 21. If the bill does not clear committee before then, it gets pushed off the Senate calendar entirely and a full year of negotiations resets to zero.
What the Compromise Actually Said
The bipartisan compromise reached on May 1 by Senators Thom Tillis and Angela Alsobrooks was straightforward. Crypto companies cannot pay passive yield on stablecoins the way a bank pays interest on deposits. However, rewards tied to actual usage, transactions, and platform activity remain permitted.
Banks agreed to this framework. Then the Senate Banking Committee scheduled the May 14 markup. Within days, the same banking groups submitted a letter demanding the entire rewards framework be scrapped.
What Banks Are Really Worried About
The banking lobby’s stated concern is consumer protection. Their actual concern is competition. Banking groups have explicitly said in their own communications that yield-bearing stablecoins could reduce consumer, small business, and farm loans by 20% or more.
If consumers move money from bank accounts into crypto platforms offering activity-based rewards, banks have less capital to lend and less profit to generate. That is a competitive threat, not a consumer protection argument.
Trump Pushes Back
President Trump has publicly stated he will not allow bankers to derail the bill. A Senate aide who reviewed the banking lobby letter described it as “pretty milquetoast,” adding that committee members have already moved past the yield debate and are focused on wrapping up remaining issues around ethics provisions.
What Happens Next
The May 14 markup vote is still on. The July 4 deadline for the President’s signature remains the White House target. But the banking lobby’s last minute intervention is a deliberate attempt to introduce enough friction to blow past the Memorial Day deadline.
If the committee holds firm and advances the bill on Thursday, the path to July 4 stays open. If the lobbying effort succeeds in reopening the yield debate, the entire legislative effort risks collapsing before it reaches the Senate floor.
Recent attention around Houdini Swap has pushed the conversation around privacy protocols back into focus across the cryptocurrency market.
The discussion gained momentum after the acquisition announcement of the privacy-focused cross-chain swap aggregator. This was followed by a debate around Houdini’s reliability, transparency, token-holder alignment, operational trust, and the broader direction of privacy infrastructure, including questions about whether platforms claiming to be non-custodial actually route transactions through centralized exchanges.
The crypto community discussed not only the technical capabilities of privacy tools but also questioned whether existing privacy platforms are even aligned with the expectations of everyday users.
This shift in attention towards trust and usability is why platforms like SilentSwap are starting to gain more visibility in the dialogue surrounding privacy in crypto.
As users reevaluate what they actually want from today’s privacy tools, the focus is now moving towards those that are more convenient and practical. This marks a shift away from complicated infrastructure narratives, which used to dominate the crypto space, towards platforms that focus on offering users simplicity, accessibility, and a cleaner experience.
And this is where SilentSwap’s appeal comes from; it actually delivers non-custodial privacy without relying on hidden centralized infrastructure.
The platform is designed to be non-custodial, with users maintaining full ownership of their assets and no hidden routing through centralized exchanges. At no point during the transaction process do they give up custody or hand it to an intermediary.
At the same time, the platform offers an onboarding experience that has been kept intentionally light and simple to avoid the friction that prevents privacy-focused tools from gaining widespread adoption. There are no lengthy registration flows, mandatory identity checks, or unnecessarily complicated routing processes sitting on top of the core transaction experience.
So, by having a straightforward transaction flow and giving users full control over their funds, SilentSwap allows more users, especially mainstream consumers, to enjoy privacy while being true to the foundational ethos of crypto.
In the current environment, this practical privacy matters a lot. Because historically, privacy protocols mainly, if not only, appealed to highly technical crypto users who were willing to deal with the complex and buggy interfaces in exchange for anonymity or control.
But crypto isn’t that niche anymore, the adoption dynamics are changing as stablecoins get integrated into traditional finance. Users now increasingly want privacy tools that they can actually understand, feel stable, and make part of their financial routine easily. So, the transaction flows need to be predictable, and the interface needs to be intuitive.
In practice, privacy infrastructure is not judged by how decentralised it is, nor is it evaluated based only on security. It is actually adopted based on just how dependable the experience is for everyday activity.
SilentSwap fits into this emerging category perfectly by offering privacy without excessive friction.
The broader privacy protocol sector is now actually entering a period where user expectations only become more demanding and not less.
As crypto adoption goes mainstream, aided by regulatory clarity and institutional acceptance, user trust becomes the differentiator. Platforms must combine non-custodial design with operational consistency, smooth onboarding, and trustworthiness that goes beyond just marketing.
And those that are able to offer these features are most likely to succeed over the next phase of adoption.
As the conversation around privacy protocols evolves, the attention surrounding Houdini Swap may help the sector build privacy infrastructure that is practical, reliable, and sustainable for everyday use. Already, users have been pushed to think about these elements more critically. In that environment, platforms like SilentSwap are benefiting from growing demand for privacy tools that prioritize simplicity, accessibility, and non-custodial control without overwhelming users in the process.
DOGE whales spent April quietly stacking. Now the chart is starting to show what they were already buying. The latest DOGE whale accumulation data shows the largest wallets now hold a record level of DOGE, with single-day large transactions hitting their highest level in six months. DOGE has rallied off the base, broken above its main moving averages, and spot DOGE ETFs just snapped a two-week dry spell with fresh inflows.
The setup is the strongest it has shown in months, with analysts pointing toward roughly 4x potential over the rest of 2026. The catch is the math from here. Even hitting that upper target is a respectable trade for buyers already in DOGE, just not the kind of move that changes a small bag into something life-changing. Buyers chasing wealth-changing returns are looking earlier in the curve, where AlphaPepe is approaching $1.2 million raised at stage 16, with thousands of users already active on its AI exchange before the token even lists.
What The DOGE Whale Accumulation Actually Tells You
Whale wallets do not stack 108 billion tokens by accident. The pattern through February to April was a textbook accumulation base: large holders quietly absorbing DOGE through the chop while retail attention was elsewhere. The May breakout was not random. It was the trigger whales had already been positioned for over the prior two months.
For long-term DOGE holders, this is genuinely good news. Whale concentration historically reduces available supply and supports price discovery on the way up. ETF inflows returning, the SEC commodity classification, and ongoing speculation around X payments integration and the SpaceX IPO all build a real demand picture for the coin. None of that is bearish for DOGE.
The math is just less explosive than it looks at first glance. DOGE at current levels reaching the upper analyst targets would be a 4x trade across the rest of the year. That’s solid for a top-ten asset, but not the kind of multiple retail buyers are scanning for when they ask which presale to back next.
Why AlphaPepe Approaching $1.2M Raised Is The Quieter Story
While DOGE traders watch the breakout play out, AlphaPepe’s presale has quietly been doing the work that actually moves a project forward. AlphaPepe’s stage 16 round has pulled over 8,400 holders inside as the raise approaches $1.2 million. The project is currently adding more than 100 new wallets every day, with growth continuing through volatile weeks where most presale flows dried up across the sector.
The product underneath the meme is what’s making the difference. AlphaSwap, the project’s AI-powered exchange, is already running with 3,000+ active users on it before the token has even listed. The platform addresses three problems that hurt retail traders the most: getting rugged on copy-paste contracts, missing whale moves until the chart has already run, and chasing trends after they’ve peaked. Take the rug example.
A trader sees a token pumping on Twitter, apes in, and only afterward learns the contract has a hidden function blocking sells. AlphaSwap scans the contract before the swap and flags exactly those traps, which for someone who can’t read Solidity is the difference between losing the bag and walking away clean. The same engine watches large wallets in real time and flags trending tokens with sentiment scoring before they hit any major outlet. That’s the kind of utility most presales talk about but rarely ship.
Why The Math Still Favours AlphaPepe From Here
The team is the other piece. The lead dev came from the ShibaSwap team and helped scale Shibarium, the same group behind one of the biggest meme ecosystems in crypto. The contract is fully audited and cleared. The Q2 listing window will close the $0.01666 entry once it opens.
DOGE holders watching whales stack are betting on a meme coin with real utility narratives building behind it, but at a $16 billion market cap the move from here is measured in percentages rather than multiples. AlphaPepe holders are betting on a presale that’s still in the price discovery zone, with shipped product, a credentialed team, and a demand curve that has continued running uphill while the rest of the sector stalled. The trade in front of buyers right now is whether to wait for established names to play out cycles or take a presale entry where the math has serious room left in it.
Why are DOGE whales accumulating right now? Whale wallets hold a record 108.52 billion DOGE as ETF inflows return and analysts target $0.20 to $0.47 for the rest of 2026.
What is the AlphaPepe presale price right now? AlphaPepe stage 16 is open at $0.01666, with the round approaching $1.2 million raised and over 8,400 holders inside.
What is AlphaSwap? A live AI exchange that scans contracts and tracks whale wallets, with 3,000+ users active before the AlphaPepe token even lists.
As the Bitcoin price stabilizes around the $80,000 range, bullish momentum appears to be gradually returning to the crypto markets. Among the top-performing altcoins, Solana is showing notable strength after the SOL price surged above $90 and climbed as high as $93 over the past few hours.
The rally has pushed SOL close to a crucial resistance zone, while technical indicators continue to flash bullish signals. Analysts now believe a breakout above the local resistance near $95 could open the doors for a fresh rally toward the long-awaited $100 milestone this weekend.
Solana Price Analysis: Can Bulls Sustain the Momentum?
The Solana price is approaching a crucial resistance zone after reclaiming the $90 range with rising bullish momentum. As market sentiment improves, traders are now watching whether SOL can break above the local resistance near $95 and trigger a fresh rally toward the psychological $100 milestone this weekend.
The daily chart shows SOL rebounding strongly from the key support zone near $76 while forming higher lows, indicating growing bullish strength. The price is now testing the upper resistance range near $95, which has capped previous recovery attempts.
An ascending trendline continues to support the rally, while the Supertrend indicator has flipped bullish. Meanwhile, the CMF indicator has moved back into positive territory, suggesting improving buying pressure and fresh capital inflows. A breakout above $95 could open the doors for a rally toward $100 and potentially higher levels. However, failure to clear the resistance may trigger a pullback toward the $89 support zone.
Key Levels to Watch
Immediate resistance: $95
Major bullish target: $100
Immediate support: $89
Strong support zone: $76
Will Solana Price Reach $100?
Solana continues to maintain a bullish structure as the price approaches the crucial resistance zone near $95. The formation of higher lows and improving buying pressure suggest the bulls are attempting to build momentum for a breakout toward $100.
However, SOL still needs to secure a strong daily close above the resistance zone before confirming the next leg higher. If the breakout occurs over the weekend, the Solana price could quickly rally toward the $100 milestone this week. Otherwise, continued consolidation below resistance may delay the move until next week.
Wall Street’s appetite for AI-linked crypto products clearly isn’t cooling off yet. Grayscale just announced that its Grayscale Bittensor Trust, trading under the GTAO ticker, is now open for private placement to eligible accredited investors. And honestly, the timing isn’t random. The Bittensor ecosystem suddenly got a lot louder this week.
Bittensor Expansion Pushes GTAO Back Higher
Canonical TAO officially went live on Solana through Wormhole’s Sunrise integration, opening native trading support on Jupiter Exchange and Meteora while also landing wallet support from Phantom and Solflare.
That’s a pretty massive surface-area expansion for a token that spent months quietly grinding upward since February.
Meanwhile, GTAO’s numbers are starting to reflect that shift. The trust’s market price now sits at $9.06 while NAV per share stands at $5.97. Back when TAO’s recovery rally first started accelerating earlier this year, GTAO market price hovered near $6.08 and NAV per share sat around $4.39.
Grayscale GTAO Assets Continue Growing Steadily
The Grayscale Bittensor Trust launched publicly on December 12, 2025, and now manages roughly $13.06 million in assets under management with 2.1 million shares outstanding. Of course, investors are still paying Grayscale-style fees, with the trust carrying a 2.50% total expense ratio.
But let’s be real, institutional investors rarely chase convenience for free. The bigger story here is access.
Institutional Demand For TAO Keeps Building
GTAO remains one of the few investment vehicles offering exposure to Bittensor’s TAO token through a traditional security structure without requiring direct custody or storage of crypto assets.
Now, with Solana integrations expanding liquidity and Grayscale reopening private placement access, the market is starting to treat TAO less like an obscure AI token and more like a serious institutional crypto narrative. For now, Grayscale GTAO appears to be riding that wave.
CC price just woke up from months of sideways boredom, and traders finally have something besides chop to stare at. After a fresh batch of Canton Network updates hit the market, the token posted a 10% intraday surge and broke out from a tightening symmetrical triangle pattern that had been squeezing price action for weeks.
Canton Network Updates Spark Fresh Momentum
The move started after Canton Network stated that the gap between institutional blockchain strategy and real production deployment is still an implementation problem, adding that Kresus is building on Canton to help close it.
Then came another catalyst. Canton later announced that Featured App rewards now reflect actual network activity through CIP-0104, tying the ecosystem’s economic model directly to the value applications generate for the network. In plain English? Projects actually have to contribute instead of just existing for token emissions.
CC Price Breakout Faces Major Resistance Test
But the truth moving forward is that this rally still has work to do. The key resistance now sits around the $0.16000 zone. If bulls manage to break and hold above that level, the next upside targets stand near $0.17000 and eventually $0.20000.
Fail there, though, and things could get ugly fast. A rejection from $0.16000 may drag CC price back toward $0.14000 support, while a deeper retrace could revisit the $0.11000 region.
Technical Indicators Still Favor Higher Prices
Most interestingly, despite the intraday rally today, the Chaikin Money Flow indicator still remains negative, suggesting inflows haven’t fully turned positive yet. That leaves room for additional upside if momentum continues building.
Meanwhile, RSI sits near 65, signaling strong momentum without entering extreme overheated territory. Add in a fresh MACD bullish crossover, and the setup increasingly looks like a market preparing for another leg higher.
For now, Canton Network has traders watching whether CC price can finally force a clean breakout above $0.16000.
Solana price is once again capturing trader attention after a sharp breakout pushed SOL above the $93 mark, fueling speculation that the coin could be preparing for its biggest rally of 2026.
The latest move comes after weeks of sideways consolidation, with SOL finally breaking above a descending resistance trendline that had capped upside momentum since early March. The breakout structure, combined with accelerating volume and improving sentiment across the crypto market, is now strengthening bullish expectations for a much larger continuation rally.
But unlike previous short-term rebounds, Solana’s latest surge is being backed by a growing list of fundamental catalysts. Institutional ETF inflows are climbing rapidly, whale wallets are accumulating millions of dollars worth of SOL, and ecosystem expansion is accelerating as major infrastructure firms deepen their involvement with the network.
Together, the combination of rising institutional demand, aggressive whale accumulation and strengthening network development is helping fuel growing speculation that Solana may indeed be preparing for its biggest rally of 2026.
Whale Accumulation Returns to Solana
One of the clearest bullish signals supporting Solana’s breakout is the return of aggressive whale activity. According to recent Lookonchain data, a dormant wallet became active again after seven months and accumulated approximately 67,648 SOL worth nearly $6.23 million within just a few hours. The same address also purchased millions of JUP tokens, reinforcing broader confidence across the Solana ecosystem.
Large whale accumulation during breakout phases is often viewed as an important signal because it suggests sophisticated investors may be positioning ahead of a larger directional move.
Solana ETF Inflows Continue Accelerating
Institutional demand surrounding Solana is also beginning to rise rapidly. Recent market data showed spot Solana ETF products recorded approximately $33 million in weekly inflows, including nearly $6.7 million added during a single trading session. Combined ETF holdings are now reportedly approaching almost 2% of Solana’s circulating supply.
The strong inflow momentum is becoming increasingly important for Solana’s long-term outlook as institutional investors continue expanding exposure beyond Bitcoin and Ethereum. Growing ETF participation is also reinforcing confidence that Solana remains one of the strongest high-growth blockchain ecosystems attracting institutional attention during the current market cycle
Alchemy’s $20 Million Fund Strengthens Solana Ecosystem Narrative
Solana’s long-term growth narrative received another boost after Web3 infrastructure giant Alchemy launched a new $20 million fund dedicated to supporting developers building on the network. The initiative provides infrastructure support, API credits and development tooling for Solana-based projects, aiming to accelerate builder activity across the ecosystem.
The announcement is being viewed as a bullish signal because it highlights continued institutional and infrastructure-level confidence in Solana despite recent market volatility. For many investors, expanding developer participation remains one of the strongest indicators of long-term ecosystem growth, especially as competition among Layer-1 networks continues intensifying heading deeper into 2026.
SOL Price Prediction: Descending Triangle Breakout Opens Path Toward $120
Solana price has now confirmed a bullish breakout from its multi-week descending triangle structure after spending weeks compressing between falling resistance and strong support near the $80 zone. The breakout gained momentum after SOL surged above the triangle resistance and reclaimed the $93 level with rising volume confirmation, signaling a possible shift in broader market structure. Analysts often view descending triangle breakouts during recovery phases as an early indication that bearish control is weakening while fresh buyers begin reclaiming momentum.
The move also pushed SOL back above key short-term moving averages, while daily RSI continued strengthening into bullish territory. If bulls maintain control above the breakout region near $90, the next immediate resistance sits around the psychological $100 level. A decisive breakout above that zone could open the path toward the broader $120 resistance region visible on the higher timeframe chart.
However, traders will likely monitor whether SOL can continue holding above the previous triangle breakout region during any short-term pullback, as sustained support confirmation could strengthen the case for a larger continuation rally through May.
Final Words
Solana’s latest breakout is increasingly being supported by more than short-term market momentum alone. Rising ETF inflows, renewed whale accumulation and expanding ecosystem investment are now aligning alongside a confirmed bullish technical breakout. As institutional interest around high-performance blockchain networks continues growing, Solana is once again positioning itself among the market’s strongest large-cap recovery plays. If SOL maintains support above the recent breakout zone near $90, traders believe the current structure could fuel a broader continuation rally toward higher resistance levels in the weeks ahead.
The Internet Computer crowd finally has something to celebrate besides survival. ICP price just ripped nearly 35% higher to touch $4.0 before cooling near $3.70, and for once, this wasn’t some random candle fueled by some kind of meme-level delusion. The breakout actually came with a proper narrative to which traders could sink their teeth into.
More importantly, ICP/USD today has managed to break above the 200-day EMA band, flipping a long-standing resistance zone into dynamic support. In crypto terms, that’s basically the chart screaming, “maybe the pain trade is over.”
WordPress Move Ignites Internet Computer Demand
Well, the rally in ICP token price really started on May 5 after Dfinity announced on X that WordPress now runs entirely on the Internet Computer through the Wasp Technology team.
And no, not partially. The deployment reportedly includes the frontend, WP-admin, database, and caching system running fully on-chain without external databases, off-chain caches, proxy layers, or TEE VPS infrastructure, per their x post. That development helped ICP price bounce from the $2.30 support region and climb roughly 70% in total over the ongoing rally.
Whale Wallets Quietly Accumulate ICP Tokens
That said, the run in ICP/USD was real, and more to that the reality is that retail traders alone don’t usually sustain moves like this. On-chain supply distribution data paints a more interesting picture here.
As metric chart shows that the Wallets holding between 10 and 10,000 ICP tokens have reportedly been reducing exposure in early May. Meanwhile, holders controlling 10,000 to 100,000 ICP and even wallets holding 100,000 to 1 million ICP have started accumulating. This makes it clear that buying demand is back.
ICP Price Eyes Bigger Resistance Breakout Ahead
So, moving forward what’s next? The immediate hurdle now sits around the $4.50 resistance area. If ICP price breaks above that level and converts it into support, the probability of a move toward $7.00 before H1 2026 closes starts looking a lot less ridiculous.
For now, the Internet Computer rally finally has both technical momentum and a narrative powerful enough to keep traders watching.
SUI shows strong bullish momentum in early 2026, backed by rising TVL, ecosystem growth, and renewed investor confidence.
If key resistance breaks, SUI could target $3–$5 in 2026, with long-term potential extending toward $15–$18 by 2030.
As a next-generation Layer 1 blockchain, Sui is redefining the architecture of the decentralized web by introducing an object-centric model where assets, data, and permissions are natively ownable and programmable. Built to handle the demands of modern commerce, the Sui Stack provides a modular toolkit that allows developers to scale on resilient infrastructure while delivering high-performance experiences without typical blockchain trade-offs.
From powering institutional capital markets and DeFi to even revolutionizing the gaming sector, the network has already secured a significant foothold with a Total Value Locked (TVL) of $583 million, per the official website.
By prioritizing verifiable security and composable scaling, Sui ensures that value created within its ecosystem is shared rather than extracted. In this comprehensive SUI price prediction 2026–2030, we analyze how this business-ready infrastructure and growing industry adoption will impact SUI’s token and market valuation in the years to come.
Based on the technical analysis of the SUI/USD daily chart, the asset remains in a prolonged period of consolidation following a significant downtrend. After facing intense selling pressure at the $2.00 psychological barrier in early 2026, which is a continuation of the bearish momentum from late 2025, as the price plummeted toward the $0.80 mark by February. Since that decline, SUI/USD has spent the months of March and April oscillating within a narrow range, consistently struggling to reclaim the crucial $1.00 level, which has transitioned from a support zone into a stubborn resistance.
As May is running, that makes SUI sits at a definitive crossroads, despite a rise to $1.10, it still struggles at $1.05 resistance. From a bullish perspective, a decisive break and daily close above the $1.05 resistance could signal that a local bottom has finally been established. Such a move would likely trigger a relief rally toward the $1.60 zone, where the 200-day EMA currently looms as a secondary hurdle. If momentum sustains, there is a possibility for the price to retest the major $2.00 threshold, effectively challenging the upper boundary of the long-term descending channel.
However, the outlook remains fragile if the consolidation phase fails to produce an upside breakout. Should SUI token price continue to face rejection at the $1.00 mark, the risk of a breakdown increases significantly. Investors should closely monitor the $0.80 support floor; if this level is breached on high volume, it could open the door for a deeper correction toward the $0.50 – $0.60 range. This lower demand zone represents the final line of defense before the asset enters a new stage of price discovery to the downside.
Sui (SUI) Crypto Price Prediction 2026
The weekly price action for SUI/USD reveals a market in a major corrective phase after its late-2024 peak, currently in Q1 2026, searching for a definitive long-term bottom.
What we witnessed is that after the 2024’s explosive rally that topped out near $5.36, the asset entered a persistent downtrend, characterized by a series of “lower highs” capped by a prominent descending resistance line. This primary trendline has remained unbroken throughout 2025, consistently forcing the price toward deeper support levels as the initial hype cycle cooled.
Currently, the SUI price is testing $0.80 support after losing $1.05 support in Q1 2026. The odds suggest a chance of reaching the $0.50 support zone if it fails to hold $0.80, because the $0.50 area is of immense technical importance, as it represents the original “genesis” accumulation level from early 2024.
The price has dipped a lot, and now it’s showing signs of stabilization as sellers are about to reach exhaustion once it hits $0.50. Real consolidation could begin, and a true reversal to fruit has better odds. This area serves as the “line in the sand” for bulls; maintaining this floor is essential to prevent a complete technical breakdown and to begin building a new base for the next market cycle.
Looking ahead, the chart identifies several key resistance levels that SUI must reclaim to shift its bearish structure. The immediate hurdle lies at the $1.05, $1.60, and $2.00 horizontal zones. A successful bounce from the current demand floor would likely target these levels first.
However, a true trend reversal will only be confirmed if SUI breaks and closes above the long-term descending trendline, currently near $3.50. Until that breakout occurs, the asset remains in a “buy the dip” accumulation phase for long-term investors.
SUI Crypto Price Prediction 2026 – 2030
Year
Potential Low ($)
Potential Average ($)
Potential High ($)
2027
$4
$6
$8
2028
$8
$10
$12
2029
$10
$13
$16
2030
$12
$15
$18
Sui (SUI) Price Prediction 2027
Subsequently, the SUI price range can be between $4 to $8 during the year 2027.
SUI Prediction 2028
Beyond the previous ATH,SUI bullish momentum may gain pace and will see another bullish spark in 2028. Specifically, as per our SUI Price Prediction, the potential SUI price range in 2028 is $8 to $12.
SUI Price Forecast 2029
Thereafter, the SUI price for the year 2029 could range between $10 and $16
Sui (SUI) Price Prediction 2030
Finally, in 2030, the price of SUI is predicted to maintain a steady and positive. It can trade between $12 and $18.
SUI Price Prediction 2031, 2032, 2033, 2040, 2050
Based on the historic market sentiments and trend analysis of the largest cryptocurrency by market capitalization, here are the possible SUI price targets for the longer time frames.
Year
Potential Low ($)
Potential Average ($)
Potential High ($)
2031
$8
$10
$15
2032
$10
$13
$18
2033
$12
$15
$22
2040
$20
$32
$40
2050
$30
$70
$150+
Never Miss a Beat in the Crypto World!
Stay ahead with breaking news, expert analysis, and real-time updates on the latest trends in Bitcoin, altcoins, DeFi, NFTs, and more.
FAQs
What is the Sui Crypto (SUI) price prediction for 2026?
SUI could trade between $0.50 and $5 in 2026. If it breaks key resistance near $3.50, momentum may push the token toward the $3–$5 range.
How high can Sui Crypto go by 2030?
If adoption continues and the ecosystem expands, SUI could reach $12–$18 by 2030, driven by DeFi growth and network demand.
What is the Sui price prediction for 2040?
Long-term projections suggest SUI may trade between $20 and $40 by 2040, assuming strong blockchain adoption and sustained ecosystem growth.
What is the Sui Coin price prediction for 2050?
By 2050, SUI could potentially reach $30–$150+ if the network becomes widely used across finance, gaming, and Web3 infrastructure.
Where to buy Sui Crypto (SUI)?
You can buy SUI on major crypto exchanges like Binance, Coinbase, KuCoin, and OKX. Simply create an account, deposit funds, and trade for SUI.
Can SUI reach its all-time high again?
Yes, if SUI breaks above key resistance near $3 and market conditions stay favorable, a retest of its $5.35 ATH is possible.
Is SUI a good long-term investment?
SUI shows long-term potential due to its scalable Layer-1 design, growing DeFi adoption, and increasing developer and institutional interest.
What factors are driving SUI’s price growth?
Key drivers include rising TVL above $1B, strong on-chain activity, ecosystem expansion, and SUI’s reputation as a fast, scalable network.
ORDI price is consolidating in the $1–$5 demand zone after a 95% drop from $95. A breakout above $5 could trigger a rally toward $10 and possibly $30 if market sentiment turns bullish.
Ordinals (ORDI) may be forming a bottom in 2026. If bulls reclaim $5 resistance, the token could target $8–$10 short term, with long-term forecasts reaching $60+ by 2030.
Ordinals allow users to engrave data onto Satoshis. These inscriptions act like NFTs, but without smart contracts. It’s working to be more precise; the ORDI tokens are the wallet’s native BRC-20 token inscribed onto satoshis, which users can securely store, transfer, or trade in the wallet’s built-in marketplace. Using this method offers a new form of digital value on Bitcoin.
ORDI isn’t just a token; it’s a milestone. The Ordinals protocol’s structure keeps it close to Bitcoin’s core while opening new use cases. All this happens on a non-custodial Ordinals wallet. As a result, it had a strong response in Q1 2024, spiking to around $95, but in Q1 2026, it’s over 95% down in a two-year span, showing complete consumption of its gains.
What’s coming next for the token? How high will ORDI price go? Can ORDI surge 100x? What will the price of ORDI be in 2030? Let’s explore the ORDI price prediction from 2026 to 2032.
The daily chart of ORDI price indicates a notable decline in buyer interest, marked by a significant downward trend that intensified in early 2025 following a substantial sell-off. This situation has created a strong supply zone between $24.00 and $28.00.
Throughout late 2025, the technical landscape remained weak, as both the $18.00 and $8.00 support levels proved ineffective. The critical breach of the $8.00 level in October led to continued selling pressure, with prices struggling to overcome resistance.
As Q1 2026 closed with lackluster momentum, attention shifted to Q2. April has begun to live up to expectations, with a recent spike that surpassed $7.60 and briefly hit $10.20, surprising many investors. But sadly, the move was suppressed by bears, and ORDI reentered the demand area by the end of April.
Currently, in May, it’s testing the 200-day EMA band as support if it surges again, then the nearest resistance aimed is $12, only if $7.60 is flipped. Beyond $12 it will target $18 next. However, if the price does not gain momentum between $7.60 and $8.00, consolidation will only extend until demand again spills into the bucket.
Ordinals (ORDI) Price Prediction 2026
The weekly chart for Ordinals (ORDI) indicates a crucial technical juncture. After an extended period of bearish dominance, the price has returned to the foundation of its historical market structure.
Is this the 2026 Bottoming Pattern? ORDI is currently reacting to a significant demand zone. This accumulation range is critically important; it served as the launchpad for the legendary late-2023 rally, where the asset surged from a low of $2.75 to a staggering peak of $95.00, yielding gains exceeding 3,300%.
Following that historic high, the past two years have seen a consistent downtrend. However, the return to this primary demand area in Q1 2026 suggests that the “selling exhaustion” phase may be nearing completion.
As April 2026 progresses, ORDI attempted a spike in mid-April by retesting the $7.60 resistance level but it couldn’t clear. But, if it sees resurgence in demand ahead and it manages to clear this level, further upward movement could occur in ORDI, which is essential for a short-term trend reversal.
Macro Target: If broader market sentiment shifts to “risk-on,” the explosive potential of the Ordinals protocol could drive the recovery target for 2026 to $30.00, indicating significant potential for recovery from current accumulation levels. However, if this doesn’t materialize, consolidation in this demand area may continue for an extended period.
Ordinals (ORDI) price prediction 2027-2032
Year
Minimum Price ($)
Maximum Price ($)
Average Price ($)
2027
6.40
27.60
16.50
2028
19.10
40.90
29.50
2029
23.00
55.75
33.50
2030
38.50
62.50
49.00
2031
47.00
72.00
57.90
2032
57.50
85.90
68.50
Ordinals (ORDI) Price Prediction 2027
The outlook for 2027 suggests a substantial expansion in market valuation. ORDI is expected to trade within a wide range of $6.40 to $27.60, maintaining a healthy average price of $16.50 as it consolidates its position in the Bitcoin ecosystem.
Ordinals Crypto Price Prediction 2028
Building on the momentum of the previous year, 2028 could see ORDI breaking into new territory. Projections indicate a minimum price of $19.10 and a potential peak of $40.90, with an anticipated average trading cost of $29.50.
ORDI Price Prediction 2029
By 2029, the maturation of BRC-20 utility is expected to drive prices further. The token is projected to range between $23.00 and $55.75, resulting in a yearly average of approximately $33.50.
Ordinals Price Prediction 2030
Entering the new decade, Ordinals is forecast to show significant strength. Analysis suggests a price floor of $38.50 and a maximum surge toward $62.50, with investors looking at an average price of $49.00.
ORDI Coin Price Prediction 2031
The upward trajectory is expected to intensify in 2031. The highest projected price for the year reaches $72.00, while the minimum is expected to hold firm at $47.00, averaging out to $57.90.
Ordinals (ORDI) Price Prediction 2032
Looking toward 2032, the Ordinals protocol estimates a continued bullish trend. ORDI is expected to fluctuate between $57.50 and $85.90, with an average market price of $68.50.
Never Miss a Beat in the Crypto World!
Stay ahead with breaking news, expert analysis, and real-time updates on the latest trends in Bitcoin, altcoins, DeFi, NFTs, and more.
FAQs
What is Ordinals (ORDI) in crypto?
Ordinals (ORDI) is the first BRC-20 token built on Bitcoin using the Ordinals protocol, allowing data to be inscribed on satoshis and traded like digital assets.
What is the ORDI price prediction for 2026?
ORDI could trade between $1 and $30 in 2026. A breakout above the key $5 resistance may trigger recovery momentum toward the $8–$10 range.
How much will ORDI coin be worth in 2030?
By 2030, ORDI could trade between $38 and $62, with an estimated average near $49, if adoption of Bitcoin Ordinals and BRC-20 tokens continues to grow.
What factors could drive ORDI price growth?
ORDI growth may depend on Bitcoin ecosystem adoption, BRC-20 token usage, NFT demand on Bitcoin, and overall crypto market sentiment.
Can ORDI reach $100 again?
Reaching $100 would require strong adoption of Bitcoin Ordinals and a major market cycle. While possible long-term, it depends on demand and ecosystem growth.
IREN announced a massive $3.4 billion AI cloud infrastructure agreement with NVIDIA, including an option for NVIDIA to invest up to $2.1 billion in equity. The partnership triggered explosive trading activity, with IREN’s NASDAQ trading volume surpassing AUD $10 billion in a single session. Bernstein also initiated coverage on the company with a $100 price target following the announcement. The deal positions IREN as a growing player in AI cloud infrastructure amid surging institutional demand for high-performance computing capacity.
Ethereum, the second-largest cryptocurrency by market cap, has seen its dominance in the DeFi market fall to around 54%, down from 63.5% earlier this year, as competing blockchains continue capturing a larger share of the crypto ecosystem.
Now the big question is Ethereum losing its grip on DeFi dominance? While ETH price has recovered to nearly $2,314.
Ethereum Dominance in DeFi Falls to 54%
According to DeFiLlama data, Ethereum’s share of total DeFi TVL dropped from 63.5% at the start of 2025 to roughly 54% this month, marking one of the network’s weakest dominance levels in years.
DeFiLlama currently values Ethereum’s total value locked at approximately $45.4 billion, far ahead of most competing blockchains.
However, other networks are rapidly absorbing market share by focusing on specialized use cases across the crypto ecosystem. Current DeFi TVL market share now stands at:
Solana: 6.66%
BNB: 6.60%
Bitcoin ecosystem: 6.35%
TRON: 6.17%
Base: 5.44%
Hyperliquid ecosystem: 1.81%
This shift suggests DeFi is evolving from a single Ethereum-centered ecosystem into a multi-chain market where each blockchain focuses on specific sectors like stablecoins, perpetual trading, Bitcoin collateral, or consumer applications.
Ethereum Whales Are Selling
Crypto analyst Ali Martinez also pointed to a major shift happening among Ethereum whales.
According to Martinez, wallets holding between 1,000 and 10,000 ETH have significantly reduced their holdings since October 2025.
This whale cohort previously accumulated aggressively during 2025, growing holdings from approximately 12.95 million ETH in April 2025 to 15.95 million ETH by October 2025
However, whale behavior later reversed sharply. Their combined holdings have now dropped to roughly 12.52 million ETH, representing a decline of approximately 21.5%.
This large supply reduction suggests Ethereum may need stronger institutional and retail demand to fully sustain another major rally toward the important $3,000 level.
Ethereum Price Climbs While Ethereum Dominance Is Falling
Even as dominance falls, Ethereum price has started recovering again. Ethereum’s falling market dominance does not mean the network is getting weaker.
Instead, the crypto market is becoming more competitive as newer blockchains attract users with faster transactions, lower fees, better DeFi apps, and strong reward programs.
As of now, ETH is trading around $2314, jumping 1.5% today. Ethereum has broken out of a descending triangle pattern on the daily chart, supported by rising trading volume and strong buying momentum.
If the current momentum continues, Ethereum could push toward the $2,500 level in the near term, while a stronger bullish rally may drive the price closer to $3,000.
If demand for decentralized GPU infrastructure expands, RNDR could climb toward $18 by 2026.
With sustained growth in AI computing and Web3 infrastructure, Render could potentially reach $100 by 2030.
Render (RNDR), a leading decentralized GPU rendering network, is emerging as a key infrastructure layer in the rapidly expanding AI and digital content economy. Initially built to power distributed rendering for creators and studios, the network is now evolving into a broader compute marketplace, enabling scalable GPU access for AI workloads, 3D rendering, and real-time applications.
The recent transition to Render Network on Solana has significantly improved transaction efficiency and scalability, positioning the protocol to handle higher demand from both developers and enterprise users. At the same time, growing interest in AI-driven applications and GPU-intensive workloads is strengthening Render’s long-term utility narrative.
As demand for decentralized compute continues to rise, the focus for 2026 shifts toward adoption and network utilization. The key question remains whether Render can convert this expanding use case into sustained growth and price momentum, as the market increasingly values real-world infrastructure over speculative narratives.
This article delves into Render’s 2026 outlook and long-term price prediction, analyzing whether these catalysts can translate into a sustained breakout. Explore this Render price prediction 2026 and beyond, filled with expert insights and ambitious forecasts.
Render is starting May with one of its strongest technical structures in months, as the AI-focused token finally breaks out of a long-standing downtrend that had capped price action since late 2025. Trading near $2.06, RENDER is no longer behaving like a weak rebound asset. Instead, the chart now reflects early trend-reversal conditions, with buyers aggressively defending dips while momentum steadily expands above the breakout zone.
The shift comes as AI-linked crypto narratives regain traction across the market. Growing demand for decentralized GPU infrastructure, AI compute networks, and rendering capacity is pushing capital back toward fundamentally aligned projects, and Render remains at the center of that conversation. Unlike speculative meme-driven rallies, RENDER’s recovery is increasingly being supported by narrative strength alongside improving market structure.
The recent double-bottom formation near macro support suggests that seller exhaustion may already be complete. If bulls continue holding the $1.90–$2.00 range as support, the next major resistance sits around $2.50–$2.80. A decisive move above that region could trigger a stronger expansion phase toward the $3.50–$5.00 range during May and early Q2.
At the same time, broader crypto sentiment is stabilizing as Bitcoin holds firm near higher levels and risk appetite slowly returns across altcoins. That environment is beginning to favor high-utility sectors again, particularly AI infrastructure plays with real demand narratives.
Still, confirmation remains essential. Failure to sustain above the breakout zone could slow momentum and pull RENDER back into consolidation near the $1.70–$1.85 region before another breakout attempt develops.
For now, however, Render appears to be shifting from accumulation into expansion, with May shaping up as a potentially decisive month for the token’s broader recovery trend.
Coinpedia Render (RENDER) Price Prediction 2026
The broader outlook for Render (RNDR) in 2026 reflects a transition phase, where the asset is attempting to rebuild momentum after a prolonged correction from its previous highs. Following its peak near the $13–$14 region, RNDR entered a consolidation structure, with price stabilizing around lower demand zones.
As 2026 progresses, the structure appears to be gradually shifting. RNDR is forming a base above key support zones, while improving fundamentals, particularly rising demand for GPU compute and AI workloads, are strengthening its long-term narrative. This suggests that the current phase may represent a foundation for the next major upward move.
If buyers continue to defend the accumulation range and push the price above critical resistance levels near $5–$7, it could trigger a broader trend reversal. In such a scenario, momentum expansion could accelerate toward the $10–$14 range, with a potential extension toward $16–$18 under a strong bullish cycle. However, failure to sustain above key breakout zones may delay this trajectory, keeping RNDR within a prolonged consolidation phase before a confirmed expansion.
Overall, Render is likely to trade between $5 and $18 this year, with upside dependent on sustained AI-driven demand, network adoption, and successful breakout above macro resistance levels.
RENDER News and Catalysts
Rising institutional focus on AI infrastructure and GPU-compute networks is reviving demand across AI-linked crypto assets, with Render emerging as one of the sector’s strongest beneficiaries.
Increased adoption of decentralized rendering solutions among AI developers and creative studios is strengthening Render’s long-term utility narrative beyond speculative trading activity.
Expansion of partnerships and ecosystem integrations tied to GPU sharing and distributed compute markets is improving confidence in Render’s real-world scalability.
Renewed capital rotation into high-conviction AI narratives has accelerated momentum across the sector, with traders increasingly positioning RENDER as a leading infrastructure play for the next AI-driven crypto cycle.
Render (RENDER) On-Chain Analysis
Render’s on-chain data reflects a constructive setup, where underlying network strength is stabilizing while speculative excess resets. Active addresses (7D) remain relatively steady despite recent price fluctuations, indicating that core network usage continues to hold. This consistency suggests that demand for Render’s GPU infrastructure is not purely speculative, but supported by ongoing utilization.
At the same time, development activity shows periodic spikes, highlighting continued protocol-level progress and active ecosystem development. Sustained builder engagement is a critical signal, particularly for infrastructure-focused projects where long-term value is driven by adoption and technological advancement.
Meanwhile, social dominance has trended lower compared to previous peaks, reflecting reduced hype-driven participation. This decline often marks the unwinding of speculative interest, creating conditions for more sustainable, fundamentally driven growth.
The combination of stable network usage, ongoing development momentum, and cooling social hype points toward a reset phase that typically precedes stronger, more sustainable expansion cycles.
Render appears to be transitioning from a hype-driven phase into a utility-backed growth cycle, where continued adoption and real-world demand for decentralized GPU compute could act as the primary drivers of its next upward move.
The long-term projection assumes Render sustains relevance in enterprise blockchain use cases, with growth moderating over time as the asset matures.
Year
Potential Low ($)
Potential Average ($)
Potential High ($)
2031
90
100
130
2032
120
170
200
2033
180
240
300
2040
250
360
450
2050
500
670
750
RNDR Price Prediction: Market Analysis?
Year
2026
2027
2030
Changelly
$6.20
$9.50
$18.00
CoinCodex
$10.00
$18.00
$22.00
Binance
$14.00
$20.00
$30.00
Never Miss a Beat in the Crypto World!
Stay ahead with breaking news, expert analysis, and real-time updates on the latest trends in Bitcoin, altcoins, DeFi, NFTs, and more.
FAQs
What is Render (RNDR) used for?
Render is a decentralized GPU network that lets creators and developers access distributed computing power for AI workloads, 3D rendering, gaming, and visual computing.
What is the Render (RNDR) price prediction for 2026?
Render could trade between $5 and $18 by 2026 if adoption of decentralized GPU computing and AI infrastructure continues expanding across blockchain and tech industries.
How much will Render be worth in 2030?
Render could trade between $62 and $100 by 2030 if decentralized GPU networks gain adoption and demand for AI computing infrastructure continues rising.
What is the RENDER Token price prediction for 2050?
By 2050, Render could potentially reach $500–$750 if decentralized GPU marketplaces remain relevant in AI, cloud computing, and Web3 infrastructure.
Is Render (RNDR) a good long-term crypto project?
Render is considered a strong infrastructure project because it connects unused GPUs with users needing computing power for AI, graphics, and metaverse development.
What factors could drive Render price growth?
RNDR price growth may depend on AI adoption, GPU demand, Web3 infrastructure expansion, and broader crypto market cycles increasing usage of decentralized computing.


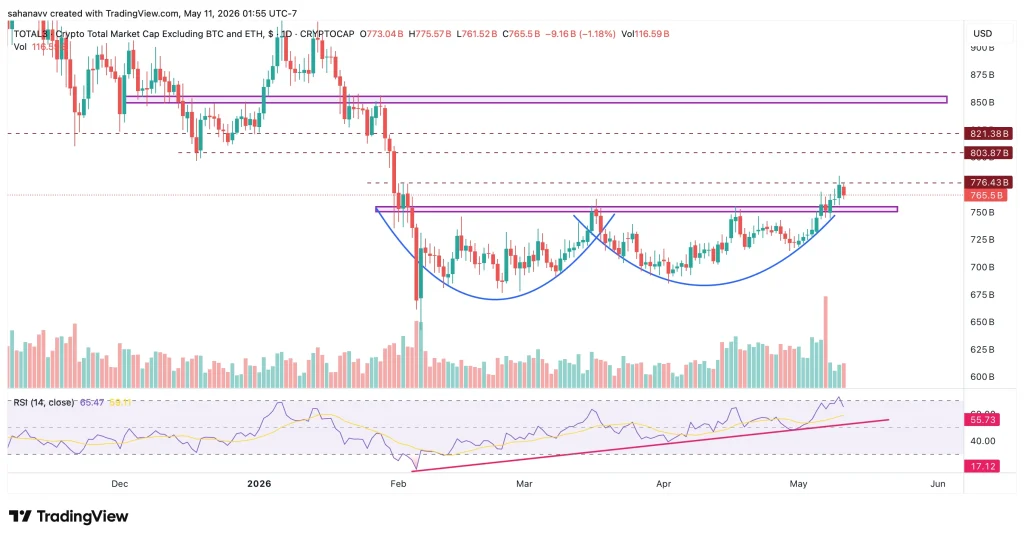
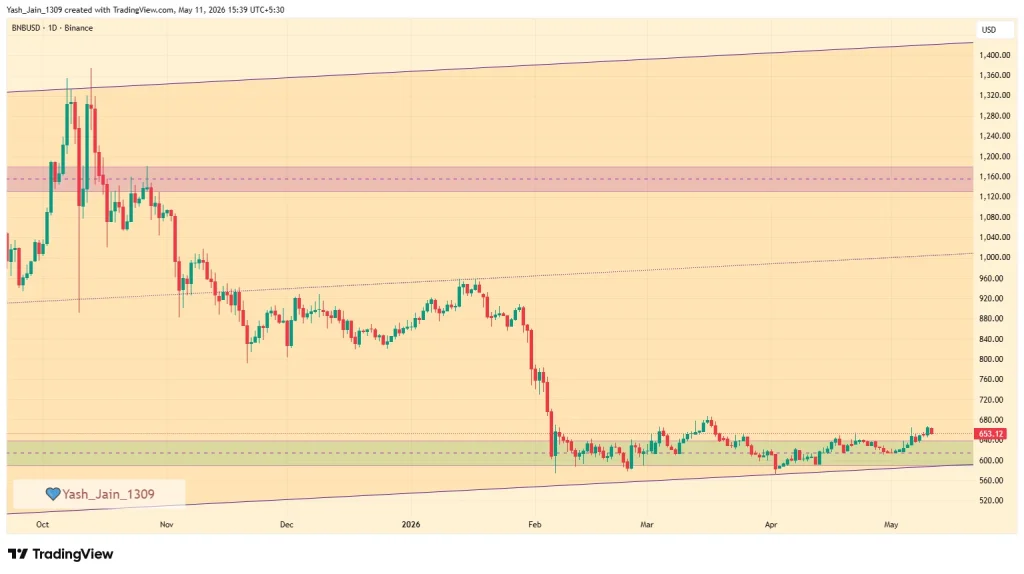
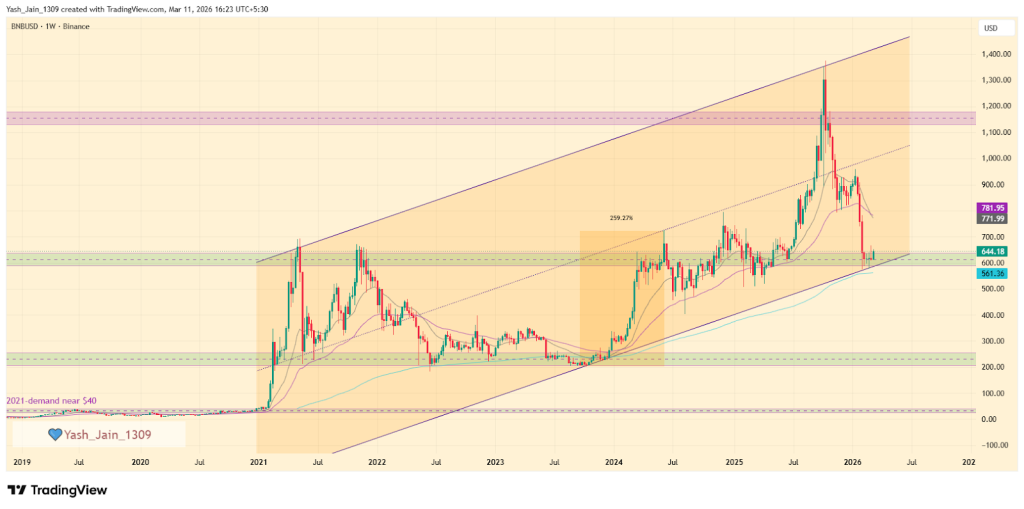
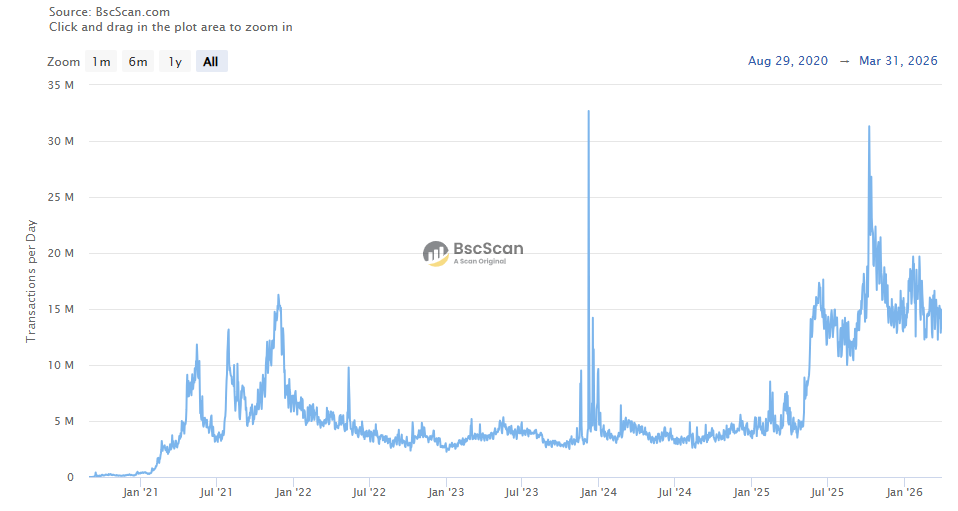
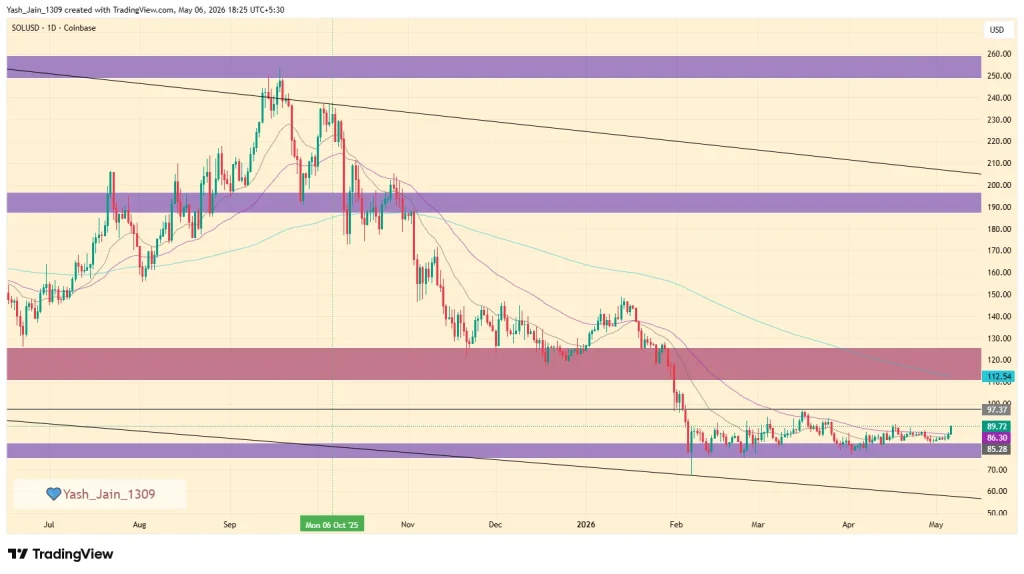
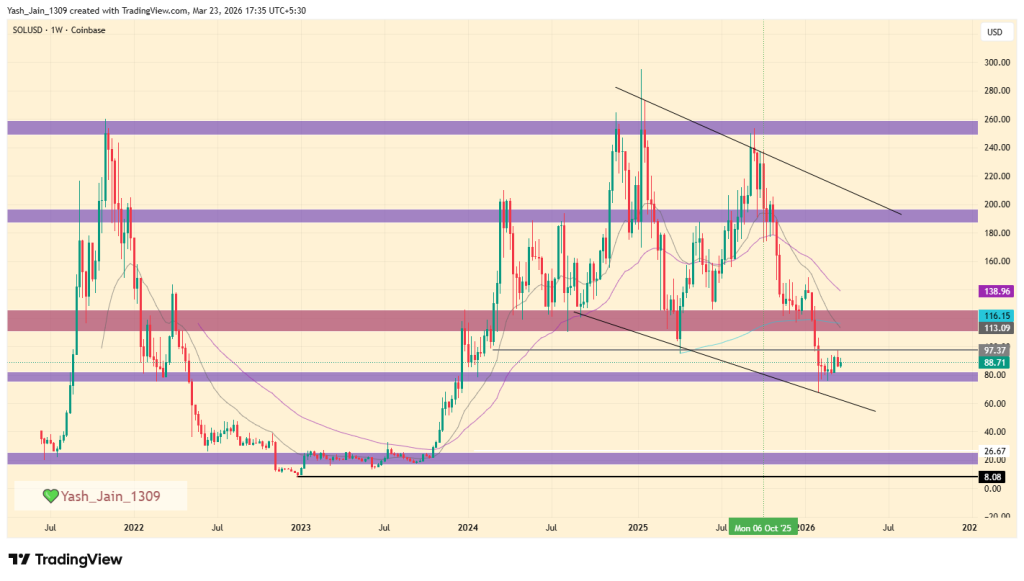
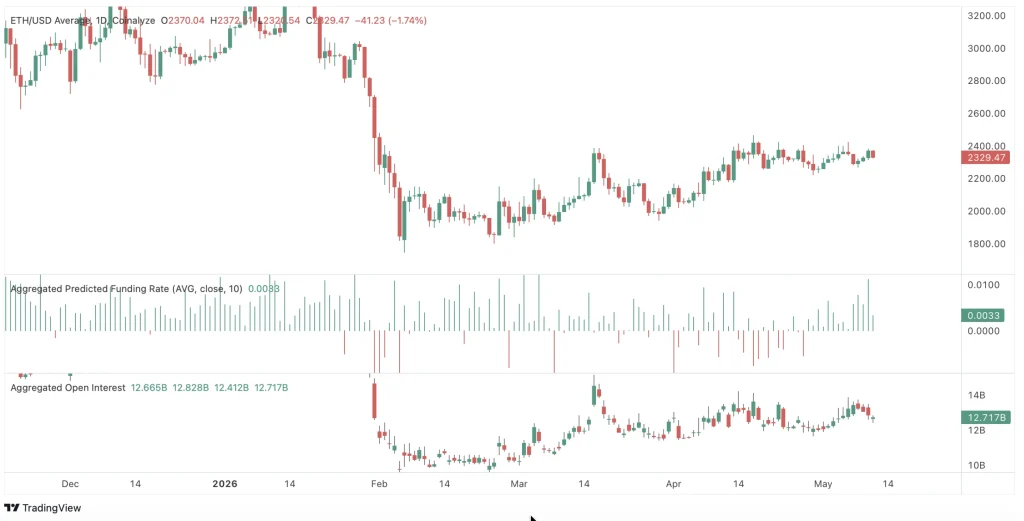
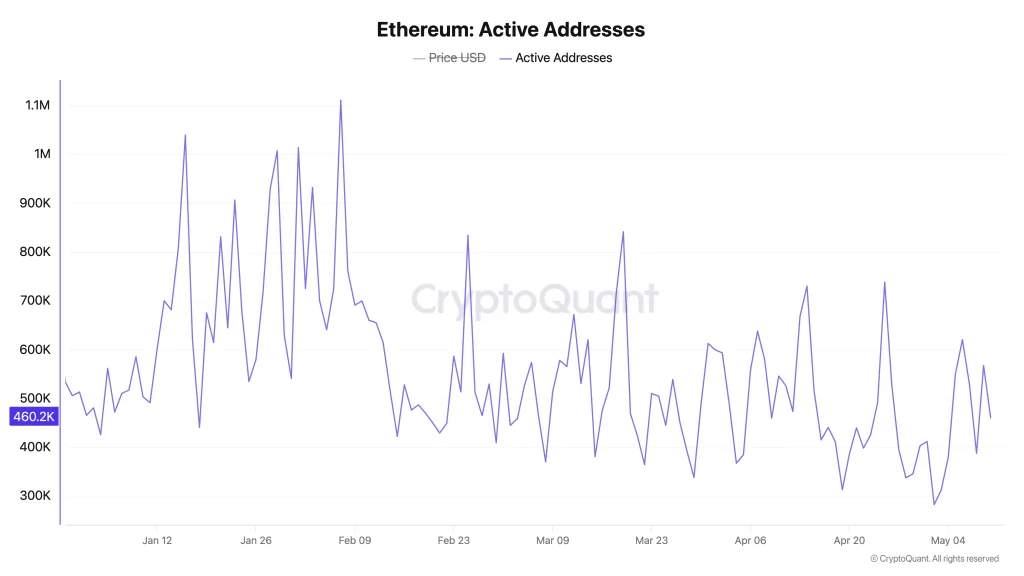
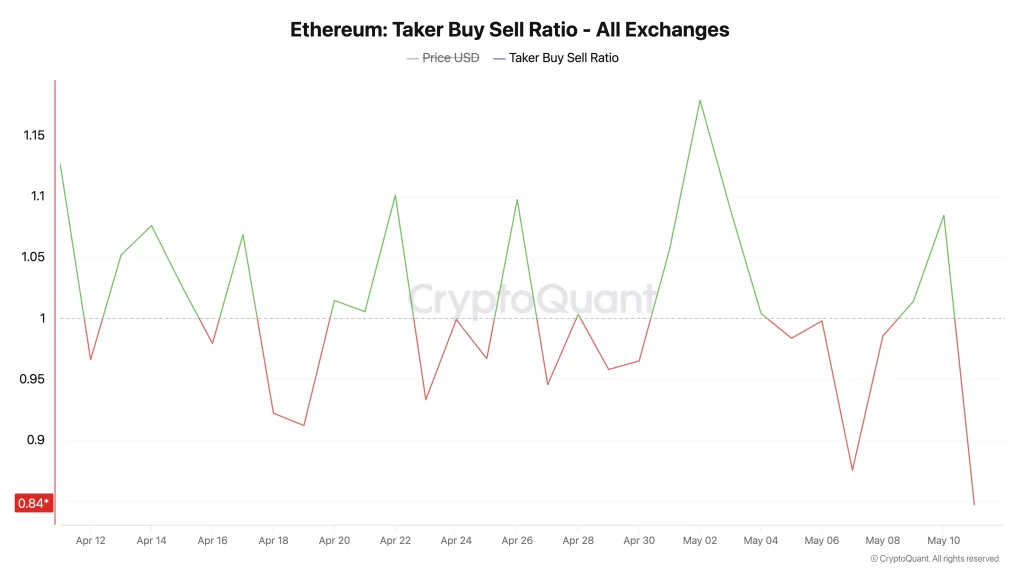
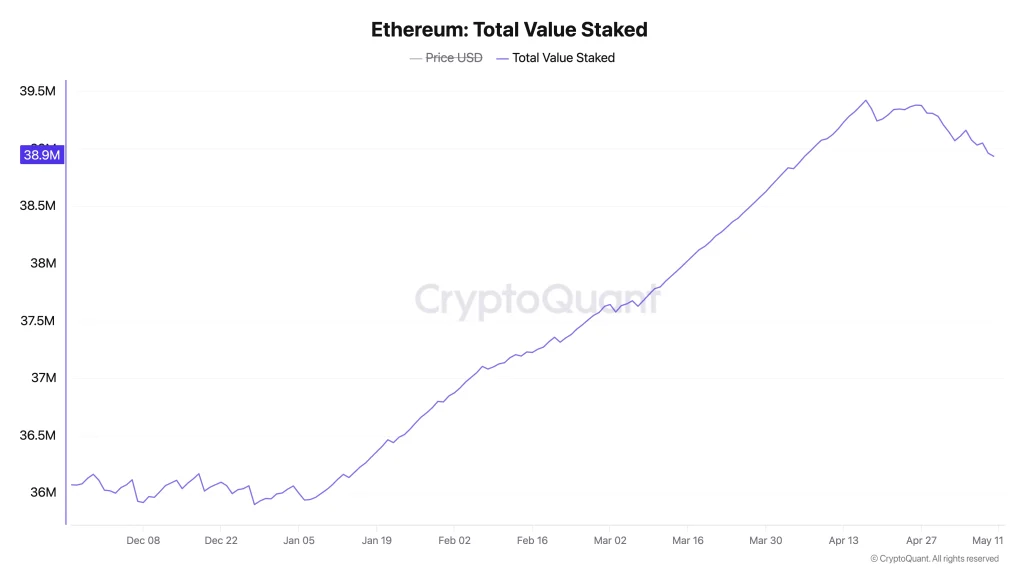

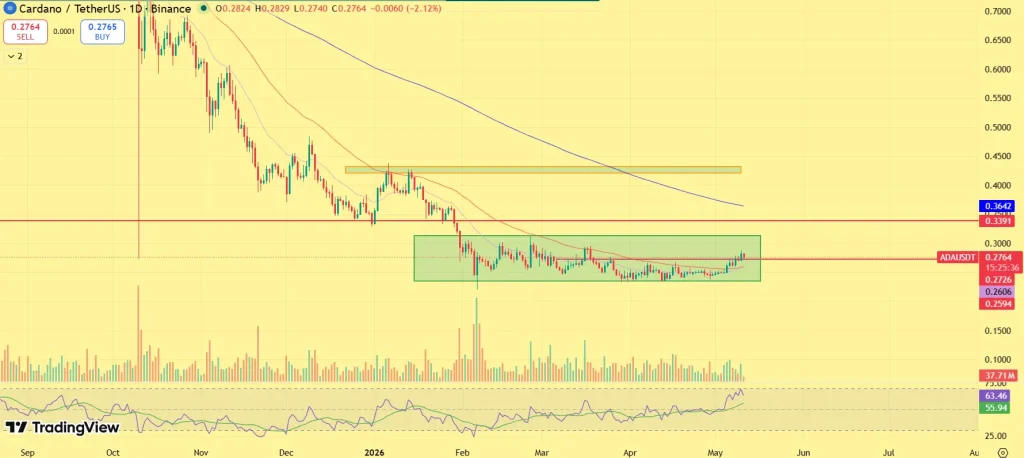
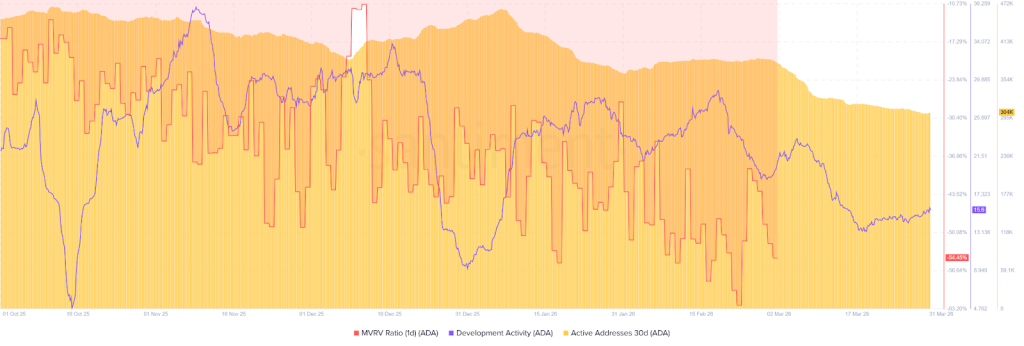

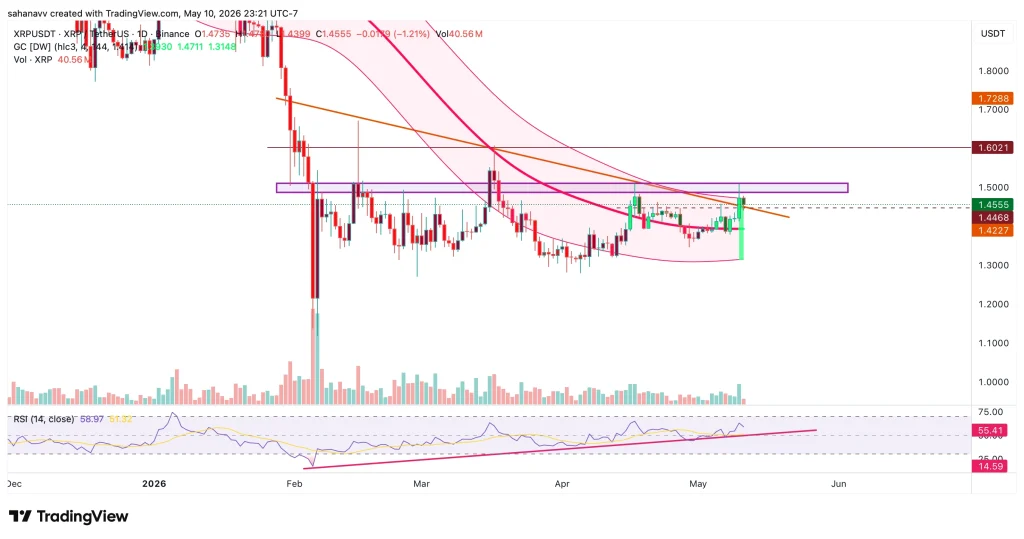
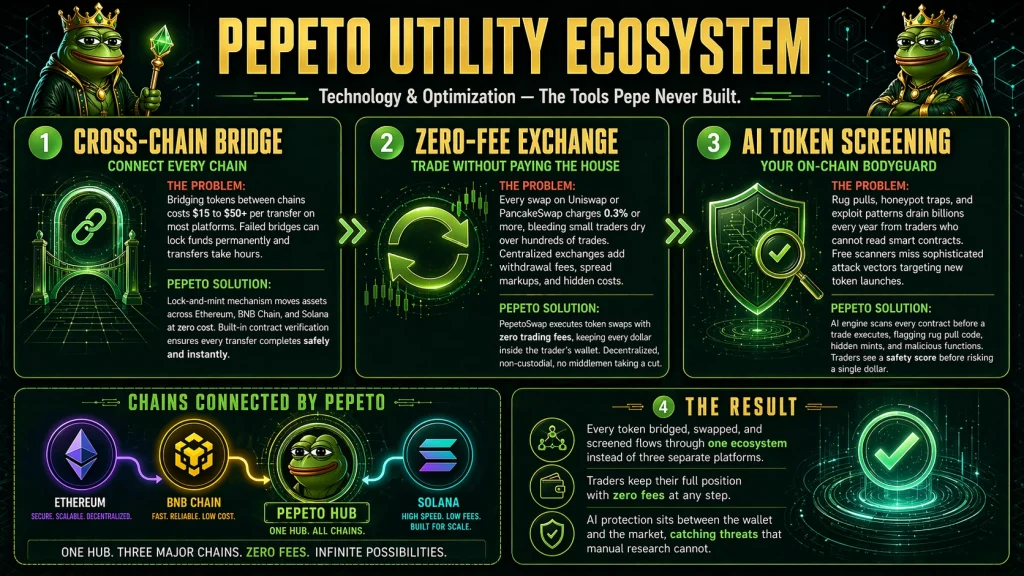

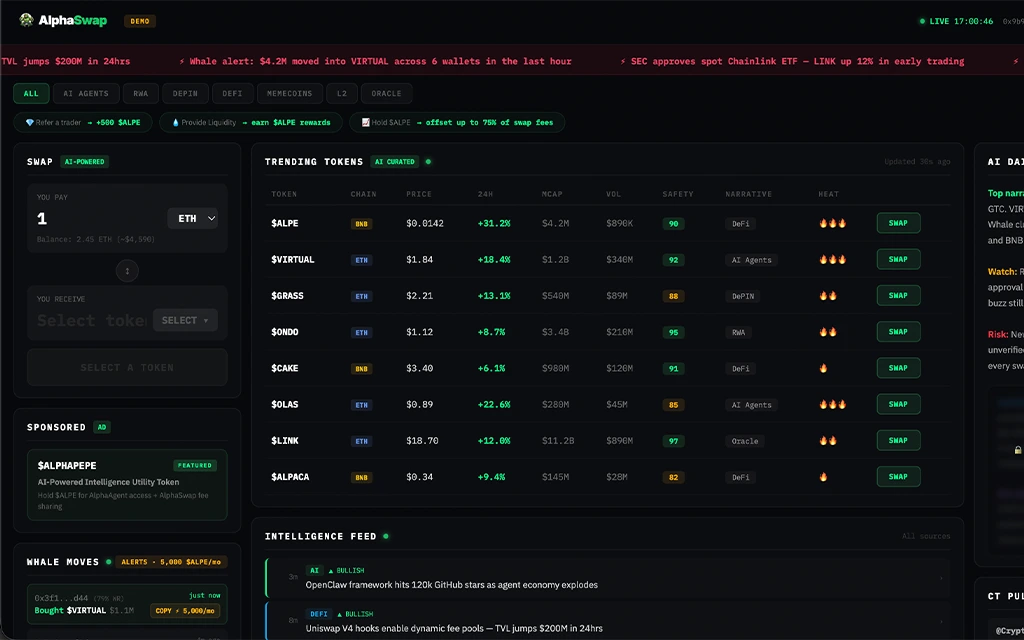
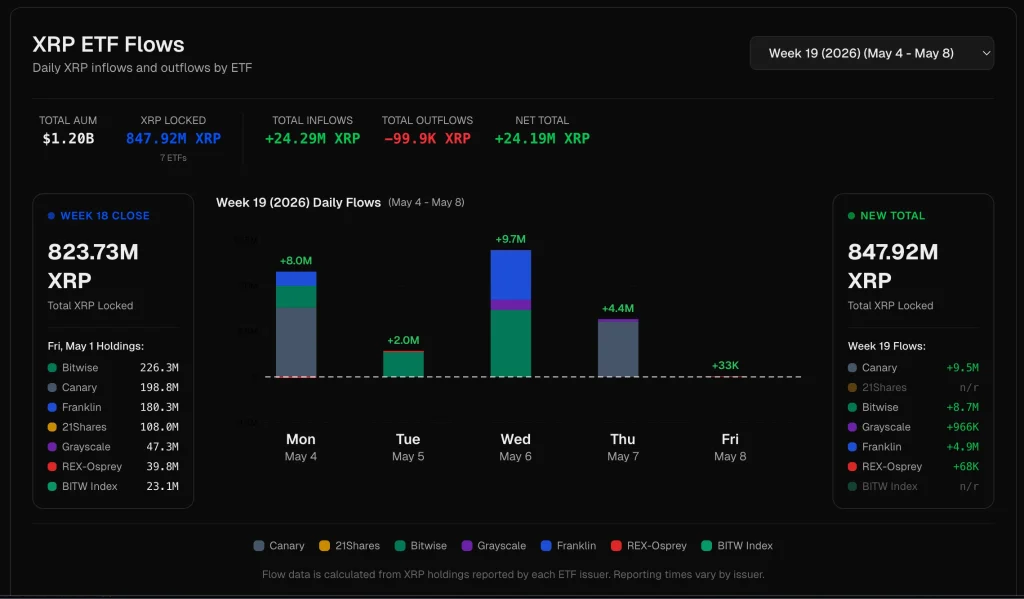
 TA / LCA / Psychological Breakdown:
 (@DrProfitCrypto)
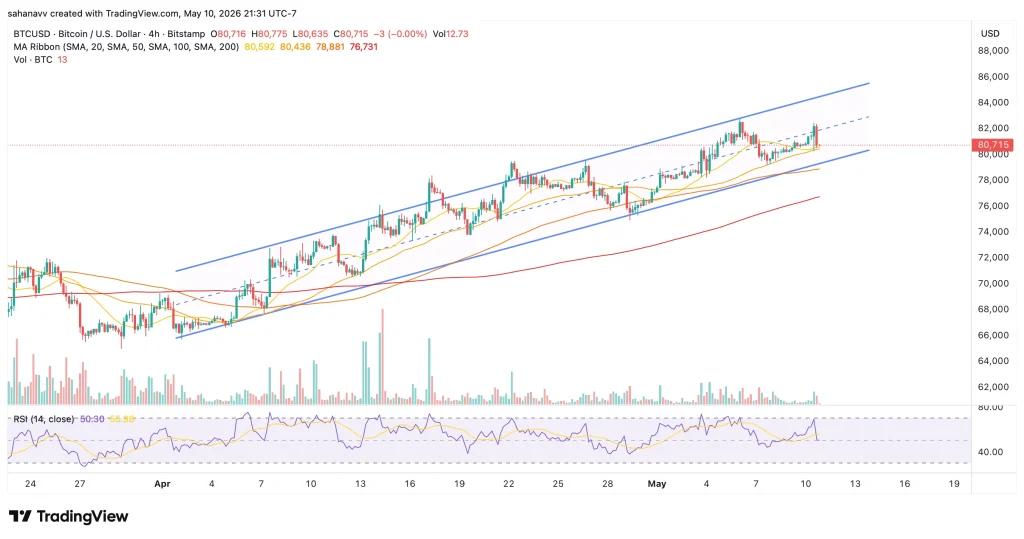
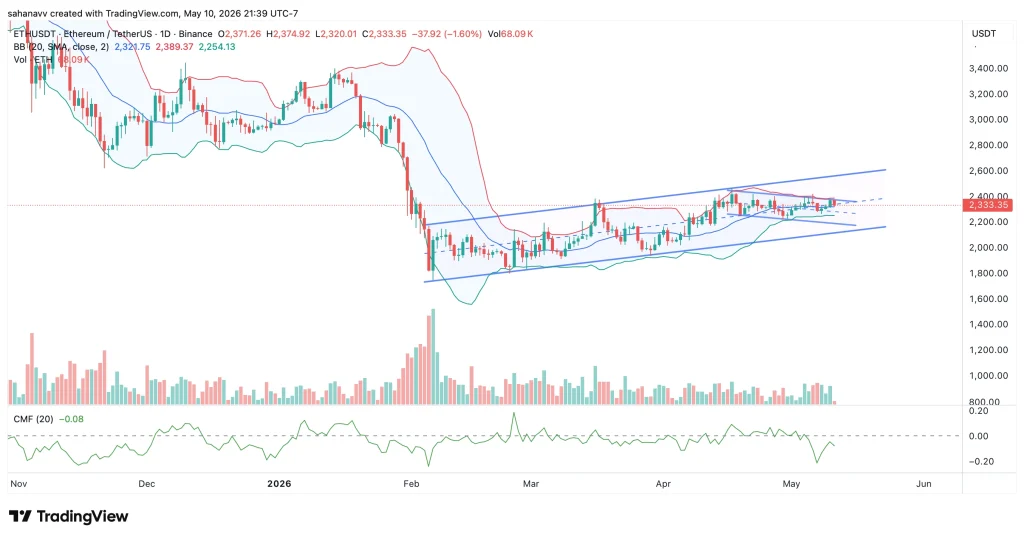


 Japan and South Korea's stock markets have opened at NEW ALL-TIME HIGH.