Reading view

Avalanche Price Prediction 2025, 2026 – 2030: Will AVAX Price Hit $100?

Avalanche Price Prediction

The post Avalanche Price Prediction 2025, 2026 – 2030: Will AVAX Price Hit $100? appeared first on Coinpedia Fintech News

Story Highlights

  • The live price of the Avalanche is  $ 19.72232474.
  • Price predictions for 2025 suggest highs of $50 and potential ETF approval.
  • Long-term forecasts indicate AVAX could reach $518.50 by 2030.

Avalanche (AVAX) has become a go-to platform for developers, especially after its Avalanche 9000 mainnet upgrade and the launch of the AVAX card in early 2025. With lower fees and growing real-world use cases, plus backing from giants like Mastercard and SMBC, AVAX is gaining serious traction. 

As a result, many are intrigued to know Avalanche prediction and are wondering: “How high can AVAX price go?” or “Will AVAX reach $50?” or “Does Avalanche have a good long-term future?” So, if you’re planning an investment in Avalanche (AVAX). Explore our in-depth Avalanche Price Prediction 2025 to 2030.

Avalanche Price Today

Cryptocurrency Avalanche
Token AVAX
Price $19.7223 down -2.89%
Market Cap$ 8,415,286,101.87
24h Volume$ 508,011,674.3413
Circulating Supply426,688,344.9972
Total Supply460,024,244.9972
All-Time High$ 146.2179 on 21 November 2021
All-Time Low$ 2.7888 on 31 December 2020

CoinPedia’s Avalanche Price Prediction

According to Coinpedia’s AVAX price prediction, the altcoin may surpass the $49.46 mark in 2025. Moreover, the upcoming years are expected to be bullish, with a conservative momentum.

With an optimistic outlook, we expect the AVAX coin price to reach $50 in 2025.

YearPotential LowPotential AveragePotential High
2025$12.36$30.91$49.46

AVAX Price Prediction 2025

Avalanche Price Prediction 2025

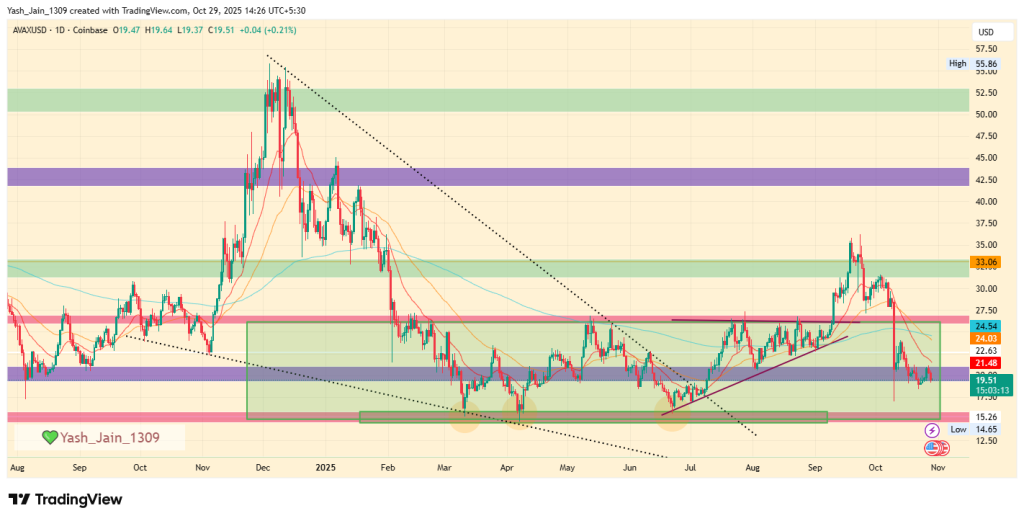
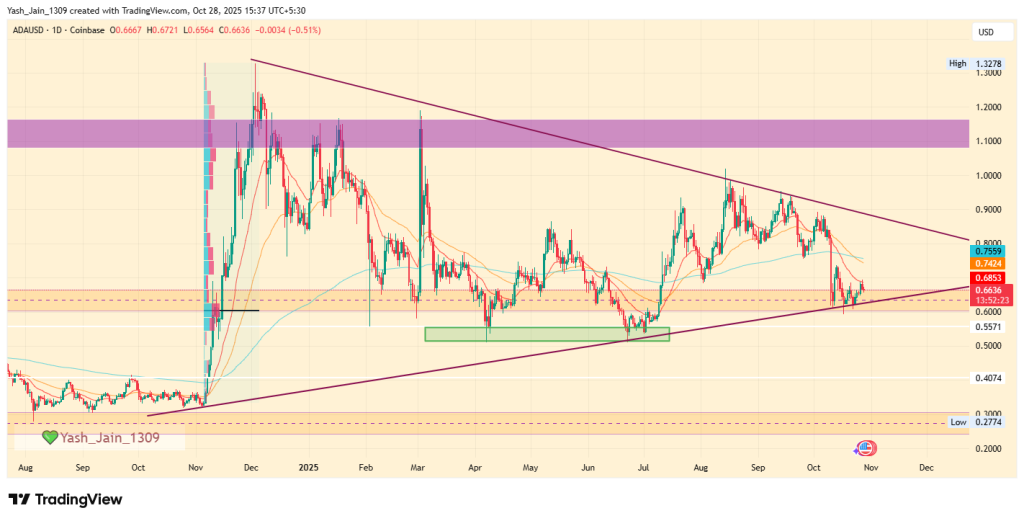
Avalanche (AVAX) showed signs of a major market shift after a long period of capped price action throughout 2025. In September, the token initiated a promising bullish rally by breaking the upper boundary of a ascending triangle pattern. 

However, this optimism quickly dissipated as profit-taking satrted as soon as AVAX hit $35 this instantly led to a reversal, completely shattering the short-lived bullish outlook. The price correction intensified dramatically on October 10th when a significant crypto-market liquidation event, reportedly triggered by geopolitical tension, forced AVAX down to $17.50. 

Despite this the immediate buy-back efforts by bulls to minimize the damage were not enough as a result the recovery faltered, and they only managed to establish and sustain support just above the $20 mark.

This sharp reversal has technically invalidated the pattern breakout, sending AVAX tumbling back inside its previous horizontal sideways trading channel. The token is now clinging precariously to the $20 support level. The market faces a pivotal moment because the odds suggest that either AVAX will continue a sideways consolidation within its range, or a new, convincing bullish catalyst will be required to reignite upward momentum and initiate another rally attempt.

Looking ahead, for AVAX to secure a strong finish to the year, it must first defeat the $26 range’s upper resistance. A successful push past this level, followed by flipping $35 into support during November, would set the ambitious target for the year-end close at $55. 

However, should AVAX fail to hold the line and continue its decline, the immediate risk is a fall to $15 support, which would likely lead to prolonged sideways movement within the bearish $15 to $26 range throughout the remainder of the year.

YearPotential LowPotential AveragePotential High
2025$25$33$50

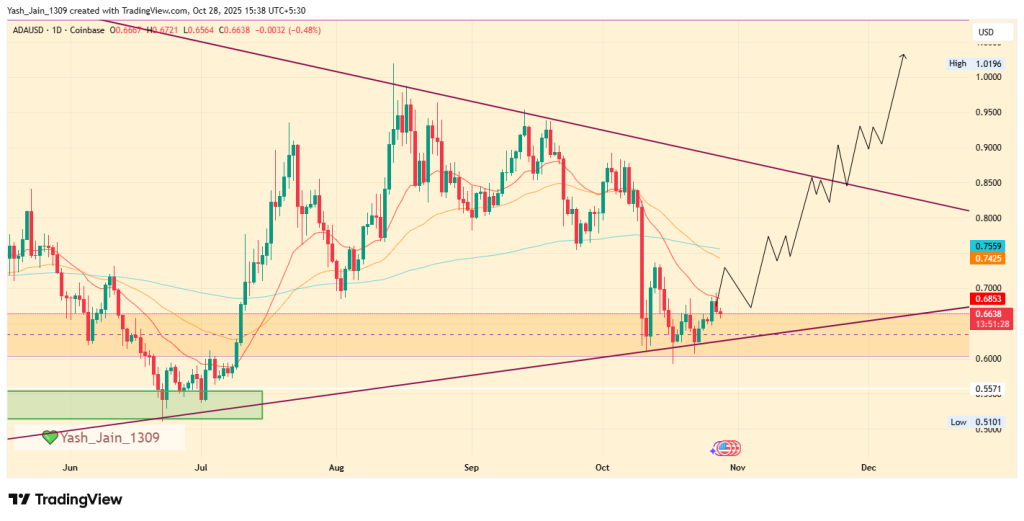
Avalanche Price Target November 2025

Avalanche Price Prediction November 2025

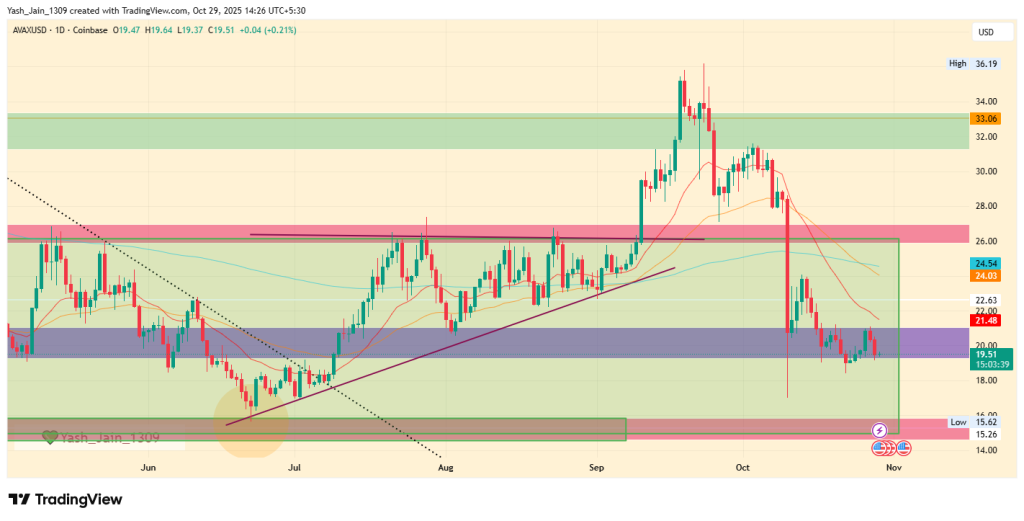
The optimism following AVAX’s failed September breakout quickly dissolved into a severe correction in October. a crypto-market liquidation event that forced AVAX to a low of $17.50. While immediate buy-back efforts have positioned just above the $20 support level.

AVAX has returned to its previous trading channel. Now, for AVAX to regain its momentum then in November is the month, it must first reclaim the $26 resistance. Also, flipping $35 into support this month is necessary to unlock the ambitious year-end target of $55. 

Failure to hold the $20 support would drag AVAX to hit lower supports.

MonthPotential Low ($)Potential Average ($)Potential High ($)
AVAX Price Target November 202515.0026.5042.50

Avalanche Price Prediction 2026 – 2030

YearPotential Low ($)Potential Average ($)Potential High ($)
202620.0050.0080.00
202731.5079.00126.50
202850.50126.50202.50
202981.00202.50324.00
2030129.50324.00518.50

AVAX Price Prediction 2031, 2032, 2033, 2040, 2050

Based on the historic market sentiments, and trend analysis of the altcoin, here are the possible AVAX price targets for the longer time frames.

YearPotential Low ($)Potential Average ($)Potential High ($)
2031209270331
2032259344430
2033307418529
20401,2122,0552,899
20508,67913,01017,341

Market Analysis

Firm202520262030
Changelly$24.72$40.82$232.67
Coincodex$32.63$28.42$19.98
Binance$25.64$26.92$32.72

*The aforementioned targets are the average targets set by the respective firms.

Never Miss a Beat in the Crypto World!

Stay ahead with breaking news, expert analysis, and real-time updates on the latest trends in Bitcoin, altcoins, DeFi, NFTs, and more.

FAQs

Is AVAX a good investment?

Yes, AVAX is a profitable investment for the long term, factoring in the strengths of the network. And the sprawl of the network in terms of utility.

What is the current price of Avalanche?

At the time of writing, the price of 1 AVAX crypto was $23.99.

What will the maximum price of AVAX be by the end of 2025?

AVAX could reach up to $50 by the end of 2025, driven by ETF rumors, tech upgrades, and growing adoption.

What if I had invested $100 in $AVAX crypto at the start of 2021?

Considering you invested $100 in $AVAX on 1st January 2021 at an average price of $3, your investment would have increased to $643.64.

Where to buy Avalanche Crypto?

AVAX is available for trade across prominent cryptocurrency exchange platforms like Binance, OkX, and Huobi, amongst others.

What is the transactional finality of the Avalanche network?

The transactional finality of the Avalanche network is 0.8 seconds.

AVAX
BINANCE

SUI Price Prediction 2025: Can the Symmetrical Triangle Spark Another 900% Rally?

SUI Price Prediction 2025: Can the Symmetrical Triangle Spark Another 900% Rally?

The post SUI Price Prediction 2025: Can the Symmetrical Triangle Spark Another 900% Rally? appeared first on Coinpedia Fintech News

The year is about to close in the next two months, which has piqued the curiosity of market participants for a much-missed altcoin rally. As a reason SUI price prediction 2025 narrative is in trend. The SUI is among the top coins that have previously displayed massive gains and have the capability to achieve similar or higher gains again. 

Looking at SUI specifically, then its price action is entering a decisive stage as the asset consolidates within a broad symmetrical triangle after a historic rally in late 2024. With ecosystem metrics booming and on-chain activity reaching record highs, the coming months could determine whether SUI crypto reclaims its previous all-time highs.

SUI Price Action: From 950% Rally to Tight Consolidation

The second half of 2024 was nothing short of extraordinary for the SUI price, as it skyrocketed over 950% from $0.49 to an all-time high of $5.32. However, 2025 presented a different story. Following the euphoric rally, the SUI price chart displayed movements confined within a multi-month symmetrical triangle, indicating mounting accumulation.

SUI Price Prediction 2025: Can the Symmetrical Triangle Spark Another 900% Rally?

As the trading range narrows, it reflects growing optimism and strengthened network fundamentals. Such consolidation phases often precede significant moves. 

Currently, the $2 support level acts as the key area to watch. A breakdown below this threshold could open doors to a deeper correction toward $0.49, while holding this zone keeps bullish hopes alive.

Ecosystem Growth Bolsters SUI Price Forecast

Despite the choppy SUI price USD action, the project’s fundamentals remain remarkably strong. On-chain data shows the SUI crypto ecosystem continues to thrive. The network recently achieved an all-time high of 225 million total accounts, a clear sign of rising engagement and user participation.

SUI Price Prediction 2025: Can the Symmetrical Triangle Spark Another 900% Rally?

Even more impressive, October 28th witnessed 923,966 new accounts created in a single day, showcasing rapid adoption momentum. This consistent expansion in network activity underlines investor confidence and reinforces the long-term viability of SUI’s ecosystem.

Additionally, SUI’s Total Value Locked (TVL) stands firm at around $1.89 billion, after touching an ATH of $2.62 billion earlier in October. 

Stablecoin Market Cap Growth Fuels Optimism

SUI Price Prediction 2025: Can the Symmetrical Triangle Spark Another 900% Rally?

Another key aspect of the current SUI price analysis is the notable uptick in stablecoin inflows in october. The stablecoin market cap surged from a dip around $560 million to $1.15 billion at the time of writing. This is reflecting increasing liquidity and ecosystem utility. 

Rising stablecoin activity often signals deeper adoption, as users engage more with decentralized applications, yield protocols, and staking opportunities.

This gradual yet firm rise in stablecoin dominance reflects investor confidence in the network’s resilience, suggesting that the groundwork for the next bullish phase may already be underway.

SUI Price Prediction 2025: A Crucial Setup Before the Breakout

The SUI price prediction 2025 framework points to a decisive few months ahead. If aggressive buying emerges, a breakout from the symmetrical triangle could send prices surging back toward $5.32 before the year closes, possibly forming strong Marubozu candles on the SUI price chart.

SUI Price Prediction 2025: Can the Symmetrical Triangle Spark Another 900% Rally?

However, a more gradual buildup could delay the explosive move to the first half of 2026, allowing the asset to consolidate between its triangle borders. Either way, the tightening pattern and strong on-chain foundation make SUI crypto one of the most intriguing assets to watch in the DeFi landscape.

Cardano Price Prediction 2025, 2026 – 2030: Will ADA Price Hit $2?

Cardano Price Prediction

The post Cardano Price Prediction 2025, 2026 – 2030: Will ADA Price Hit $2? appeared first on Coinpedia Fintech News

Story Highlights

  • The live price of the Cardano token is  $ 0.66412299.
  • ADA Price prediction suggests potential to reach $2.05 by year-end 2025.
  • Long-term forecasts indicate ADA could hit $10.25 by 2030.

The Cardano price prediction for 2025 is generating significant buzz in the crypto market, particularly as we have entered Q3 2025 with July. The transformative Plomin Hard Fork, implemented in Q1, has played a crucial role in this momentum, especially with the announcement of full decentralized governance.

This landmark upgrade has reinforced Cardano’s commitment to community-driven innovation, leading to a strengthening of its internal ecosystem. Even bigger institutions like Grayscale have been applauding the project’s vision and gave 1/5th allocation in its fund.

Industry leaders like IOHK and EMURGO are also actively advancing the Cardano ecosystem. EMURGO’s partnership with Ctrl Wallet on July 2, 2025, has enhanced Cardano’s interoperability, enabling connections to over 2,300 blockchains. 

Moreover, community-driven initiatives focusing on scalability, privacy through the Midnight chain, and integration with Bitcoin DeFi are paving the way for substantial growth.

Additionally, Bloomberg analysts have raised odds of potential spot ADA ETF approvals, and strong technical indicators signaling positive trends, investor enthusiasm is at an all-time high. Questions abound: “Will Cardano spearhead the altcoin movement?” and “What heights can ADA reach by 2050?” Explore this Cardano price prediction for 2025 and beyond, filled with expert insights and ambitious forecasts.

Coinpedia’s Cardano Price Prediction 2025

Cardano (ADA) is predicted to reach a potential high of $2.05 in 2025, driven by hopes of ETF approval, full decentralization after the Plomin Hard Fork, and increasing institutional interest. However, if ADA fails to hold above key support, it may range between $0.85 and $1.25.

Cardano Price Today

Cryptocurrency Cardano
Token ADA
Price $0.6641 down -1.95%
Market Cap$ 23,811,770,669.51
24h Volume$ 878,152,462.6427
Circulating Supply35,854,459,397.4189
Total Supply44,994,478,516.77
All-Time High$ 3.0992 on 02 September 2021
All-Time Low$ 0.0174 on 01 October 2017

Cardano Price Prediction November 2025

Cardano Price Prediction November 2025

ADA’s strong 2025 expectations faltered, with Q1-Q3 dominated by a sustained correction that wiped out most prior gains. This decline has forced price action back to a critical juncture. The recent volatility kicked off in Q4, even pushing ADA sharply down to the crucial $0.60 support level.

Despite this, the optimism remains high due to the technical structure as evidenced on ADA price chart the price action has perfectly performed a retest of the support line of a multi-month symmetrical triangle pattern 

This consolidation suggests that the momentum is coiling for a major move. ADA’s immediate fate rests entirely on defending the $0.60 support floor.

That said, a sustained defence of the $0.60 floor and a subsequent breakout above the triangle’s upper resistance could validate the bullish thesis, which could target a significant recovery rally.

For now, November is predicted to be an important month, and $0.85 could be retested; there is also a chance that it might even close above $0.85 on a daily basis in November.

However, if the ADA price dips below the $0.60 level, the symmetrical triangle setup will be invalidated, likely paving the way for a decline toward the long-term low of $0.27.

Cardano Price
Price PredictionPotential Low ($)Average Price ($)Potential High ($)
November 2025$0.25$0.92$1.32

Cardano AI Price Prediction For October 2025

SourceLow PriceAverage PriceHigh Price
Gemini$0.85 – $0.95$1.00 – $1.20$1.30 – $1.50+
BlackBox$0.65$1.00$1.50
ChatGPT$0.75$0.95$1.25

ADA Price Prediction 2025

Cardano has long prioritized decentralization, and the Q1 2025 Plomin hard fork pushed it even further. Unlike many blockchains, Cardano places control in the hands of users rather than central entities. This is evident in CoinCarp’s rich list, where the top 100 addresses hold just 22% of the mainnet supply, which is far less than most altcoins.

ADA Price Prediction 2025

Technically, if ADA price intends for a long-term rally, then a break above the $1.10–$1.20 range, strong retail participation will be key. A major catalyst could be the approval of an ADA ETF, expected by year-end, which could attract billions in inflows. Another would be a global attraction in the sector with BTC continuing northward moves.

Therefore, if ADA holds above its Q1 2025 high, it has a strong chance of retesting the $2.05 mark before the year ends.

ScenarioPotential LowAverage PricePotential High 
Without ETF Approval$0.85$1.10$1.25
With ETF Approval + Retail Surge$1.20$1.65$2.05
Bullish Breakout (with ETF & macro support)$1.50$2.05$2.80

Cardano (ADA) Price Prediction 2026 – 2030

Price PredictionPotential Low ($)Average Price ($)Potential High ($)
20262.753.003.25
20274.504.755.00
20285.255.505.75
20296.757.257.75
20309.009.7510.25

This table, based on historical movements, shows ADA prices to reach $10.25 by 2030 based on compounding market cap each year. This table provides a framework for understanding the potential Cardano price movements. Yet, the actual price will depend on a combination of market dynamics, investor behavior, and external factors influencing the cryptocurrency landscape.

Cardano Price Prediction 2031, 2032, 2033, 2040, 2050

YearPotential Low ($)Potential Average ($)Potential High ($)
203110.5011.0011.25
203213.7514.2514.75
203317.5018.5019.75
204034.2551.7569.25
2050128.25228.75329.50

Based on the historic market sentiments and trend analysis of the altcoin, here are the possible Cardano price targets for the longer time frames.

Market Analysis

Firm Name202520262030
Changelly$0.752$1.18$6.05
Coincodex$0.79$0.53$0.89
Binance$0.79$0.83$1.01

*The aforementioned targets are the average targets set by the respective firms.

Coinpedia’s Price Analysis provides you with the latest content on the recent market trend that enables you to get closer to the price movements & actions of the various cryptocurrencies.

Never Miss a Beat in the Crypto World!

Stay ahead with breaking news, expert analysis, and real-time updates on the latest trends in Bitcoin, altcoins, DeFi, NFTs, and more.

FAQs

How high could Cardano go by the end of 2025?

According to our Cardano price prediction, the altcoin’s price could hit a maximum of $2.05 in 2025. 

What is the price of one ADA token?

At the time of writing, the price of 1 Cardano ADA token was  $ 0.66412299

Is Cardano a good investment in 2025, amidst newer higher-performing entrants?

Cardano is an underrated investment and has a high chance of performing in the next couple of years, considering the plethora of applications.

Is Cardano dead?

Cardano is not dead, as it is witnessing major developmental upgrades, which could boost ADA’s price in the near future. 

Can Cardano overtake Ethereum?

Even the most bullish of Cardano supporters acknowledge that Cardano will only potentially surpass Ethereum within 18 to 20 years.

How much would the price of Cardano be in 2040?

As per our latest ADA price analysis, Cardano could reach a maximum price of $69.33.

How much will the ADA coin price be in 2050?

By 2050, a single Cardano price could go as high as $329.56.

How much is 1 Cardano worth in Canada?

At the time of press, the Cardano price CAD is $0.9141.

Polygon (MATIC) Price Prediction 2025, 2026 – 2030: Will MATIC Price Surge to $1?

Polygon Price Prediction 2025-2030

The post Polygon (MATIC) Price Prediction 2025, 2026 – 2030: Will MATIC Price Surge to $1? appeared first on Coinpedia Fintech News

Story Highlights

  • The live price of the Polygon coin is  $ 0.21819891.
  • POL price predictions for 2025 suggest potential highs of $0.7655.
  • Long-term forecasts indicate POL could reach $4.94 by 2030.

Polygon (POL) has a mind-blowing Layer-2 scaling solution project for Ethereum, which is primarily designed to address slow speeds and the network’s high transaction fees. 

As a result, Polygon is seen as a revolutionary framework for developers and users, as it attracts by offering a more efficient Ethereum experience, which is the reason contributing to POL’s price value, too.

Through, POL, which is its native token (formerly MATIC), is utilized for transaction fees and network governance, in the framework of interconnected Ethereum-compatible blockchain networks. 

Its use case makes it an attractive altcoin, and even its token POL price is attracting attention. The coin is expected to show a surge in the coming sessions, but it would require a technical eye to understand. 

Therefore, if you are curious about whether the POL price can rebound to $1. Will Polygon go up? And is Polygon a good investment? We bring our Polygon Price Prediction for 2025 – 2030 to explore the POL price prediction.

Polygon Price Today

Cryptocurrency Polygon
Token MATIC
Price $0.2182 up 2.88%
Market Cap$ 402,374,198.74
24h Volume$ 1,217,344.7306
Circulating Supply0.00
Total Supply10,000,000,000.00
All-Time High$ 2.92 on 27 December 2021
All-Time Low$ 0.0030 on 10 May 2019

Polygon Price Prediction November 2025 

Polygon price prediction for November 2025 (POL) suggests that a reversal rally could occur soon, as most of the price action seen in 2025 was a consolidation movement within a range-bound border between $0.16 and $0.26. 

Polygon Price Prediction November 2025

Since it has been coiling for many months, price action is critical. The larger the coil, the greater the rally, so November is crucial as it will determine how the year concludes.

Additionally, the $0.26 hurdle is a critical juncture; retesting and breaching it is a key prediction for November. As long as it sustains above $0.26, the target for November would be $0.42.

However, if it fails to retest due to a lack of bullish demand, the consolidation may continue for the remainder of the month.

Polygon Price Chart
MonthPotential Low ($)Potential Average ($)Potential High ($)
Polygon Price Action November 2025$0.10$0.20$0.40

POL Token Analysis 2025

Throughout 2025, the POL token (formerly MATIC) has experienced a significant downfall, with its price declining by more than 60% from an annual high of $0.76. 

This fall was largely influenced by broader macroeconomic shifts, as a result saw its steepest losses in the first half of the year. But the second half of 2025 has marked a change in momentum, as the token has stopped forming new lows. 

The bullish hopes for the third quarter are rising as POL is inching higher with a key pattern’s assistance.

Polygon Price Prediction 2025

The majority of 2025 saw Polygon (POL) consolidate within a defined range. Although a bullish awakening occurred in Q3, pushing the price to a high of $0.29 in mid-September, this moment proved brief. As aggressive profit-taking accelerated from mid-September onward, completely reversing the rally and smashing the price down to the range’s lower border by mid-October. This move places POL at a critical juncture, facing a decisive retest of multi-month support.

This is the third time POL has revisited this support block, following successful bounces in both April and June. The established pattern suggests that every previous touch of this lower border has been met with significant demand, pushing the price back toward the upper range boundary at $0.26. 

Based on this compelling historical examples of this year, the odds are high that POL will stage another reversal in the remaining days of October, aiming to revisit the $0.26 level. Flipping and sustaining a daily close above this upper border would give the bulls the upper hand and allow POL to target higher resistance levels at $0.4220 and potentially $0.5386 before the end of the quarter.

While the probability of a reversal from this historically strong support is high, the market risk cannot be ignored. The current retest represents a high-stakes scenario. Should the critical support fail and the price mark a new swing low, it would invalidate the current consolidation pattern. In this bearish event, the price could accelerate downward, leading to a new yearly low forming well below the $0.1500 mark.

POLUSD Price Chart
YearPotential Low ($)Potential Average ($)Potential High ($)
Polygon Price Action 2025$0.15$0.26$0.53

Polygon Price Prediction 2026 – 2030

YearPotential Low ($)Potential Average ($)Potential High ($)
Polygon Price Action 2026$0.18870$0.47179$0.75488
POL Price Prediction 2027$0.30194$0.75488$1.20782
Polygon Crypto Price Forecast 2028$0.48311$1.20782$1.93252
POL Coin Price Projection 2029$0.77297$1.93252$3.09205
Polygon Price Prediction 2030$1.23676$3.09205$4.94729

This table, based on historical movements, shows POL price to reach $4.94 by 2030 based on compounding market cap each year. This table provides a framework for understanding the potential POL price movements. Yet, the actual price will depend on a combination of market dynamics, investor behavior, and external factors influencing the cryptocurrency landscape.

Polygon Price Action 2026

Anticipating further expansion, MATIC’s potential high for 2026 is projected to be $0.75488, while the potential low is estimated at $0.18870, resulting in an average price of $0.47179.

POL Price Prediction 2027

MATIC crypto can make a potential high of $1.20782 in 2027, with a potential low of $0.30194, leading to an average price of $0.75488.

Polygon Crypto Price Forecast 2028

As the POL price progresses, the potential high price for 2028 is projected to be $1.93252, with a potential low of $0.48311, resulting in an average price of $1.20782.

MATIC Coin Price Projection 2029

Polygon coin price potential high for 2029 could be $3.09205, while a potential low of $0.77297, with an average price of $1.93252.

Polygon Price Prediction 2030

With an established position in the market, POL’s potential high for 2030 is projected to be $4.94729. On the flip side, a potential low of $1.23676 will result in an average price of $3.09205.

Market Analysis

Firm Name202520262030
CoinCodex$ 0.71$ 0.50$ 0.90
Binance$0.24$0.26$0.31
Flitpay$6.25$4$10.4

CoinPedia’s MATIC Price Prediction

Coinpedia’s price prediction for Polygon is bullish, suggesting the MATIC crypto price may reach new swing highs and possibly surpass its all-time high in the near future.

The Polygon Price Forecast 2025 predicts a swing high of $0.47181, with an average price of $0.29488.

YearPotential LowPotential AveragePotential High
2025$0.11795$0.29488$0.47181
Never Miss a Beat in the Crypto World!

Stay ahead with breaking news, expert analysis, and real-time updates on the latest trends in Bitcoin, altcoins, DeFi, NFTs, and more.

FAQs

Is MATIC a good investment?

Yes, it is a profitable investment, but the digital asset should be under due consideration for the long term. 

How high can Polygon MATIC price go by 2025?

According to our MATIC price prediction, the altcoin could reach a maximum of $0.47181 by 2025. With a potential surge, the price could go as high as $4.94731 by 2030.

Is Polygon better than Solana?

While it is not a direct apples-to-apples comparison, as one is a layer-2 and the other is a layer-1.

How high can Polygon MATIC transactions go?

At its best, it can process 65,000 transactions per second.

Why Polygon is faster than Ethereum?

The major functionality of this altcoin is to enable the multichain Ethereum ecosystem. It provides a network that offers interoperability between previous and present infrastructure scenarios of Ethereum.

Can polygon hit $100?

As per our MATIC price prediction, $100 dollars target is possible over the next 18 years.

Has MATIC changed to POL?

Yes, MATIC has been upgraded to POL as the network token for Polygon.

MATIC
BINANCE

Hedera Price Prediction 2025, 2026 – 2030: Will HBAR Price Hit $0.5?

Hedera Price Prediction 2024, 2025-2030

The post Hedera Price Prediction 2025, 2026 – 2030: Will HBAR Price Hit $0.5? appeared first on Coinpedia Fintech News

Story Highlights

  • The live price of Hedera crypto is  $ 0.20506791.
  • Hedera Price prediction highlights HBAR could reach $0.750 by the end of 2025 if bullish trends continue.
  • The Long-term forecasts suggest HBAR could hit $2.20 by 2030, indicating stable growth potential.

Hedera has been making waves in the cryptocurrency space, with a fast and secure blockchain that offers a distinct approach to transaction processing compared to Ethereum and other smart contract chains. It’s permission-only, meaning the blockchain is managed by private companies. Limiting what types of decentralised applications are allowed is what makes Hedera stand out from the rest.

Having entered the top 20 digital assets by market cap in 2024, it is now eyeing a potential leap into the top 10 by the end of 2025. Hedera has also recently ramped up its development activities for its ecosystem. Its ecosystem is strengthening, despite its capped price action. With increasing real-world use cases, institutional interest, and strategic partnerships, many are closely tracking HBAR price chart 2025 to gauge how high the token can rise.

With major companies like Google, IBM, and Chainlink Labs backing the project, and discussions about SEC approved HBAR ETF would flood string liquidity. Many are intrigued that: Will the HBAR Price Reach $1? Let’s discuss this in our Hedera price prediction 2025 article.

Hedera Price Today

Cryptocurrency Hedera
Token HBAR
Price $0.2051 up 14.64%
Market Cap$ 8,710,306,730.66
24h Volume$ 906,994,647.9130
Circulating Supply42,475,229,929.1494
Total Supply50,000,000,000.00
All-Time High$ 0.5701 on 16 September 2021
All-Time Low$ 0.0100 on 02 January 2020

Hedera Price Analysis 2025: A Look Back at HBAR’s Volatile First Half

Hedera price USD began the year on a high note, peaking at $0.40 in mid-January before a steady decline took it to a low of $0.125 in early April. This downturn was caused by external factors and waning investor interest, reflected in a decrease in the Total Value Locked (TVL). 

But this tide turned in the second week of April. As a broader crypto market rally helped HBAR price break free from the wedge, it bounced off a significant support zone that had previously fueled a late 2024 rally. This support, confirmed by the Fixed Range Volume Profile (FRVP) indicator, suggested strong institutional buying interest. The momentum propelled HBAR on a remarkable surge of nearly 80%, from $0.125 to $0.228 by mid-May

Unfortunately, this rebound was cut short by escalating geopolitical tensions, which pushed HBAR back to its April lows by the end of June. During this time, the price formed another parallel declining wedge.

Hedera Price Prediction 2025

Hedera Price Prediction 2025

The second half of the year started strong, with HBAR posting a significant rally in July from the $0.12 to $0.14 demand zone up to $0.30. 

However, this upward move was firmly rejected at a critical resistance point, which strongly aligned with the upper boundary of a descending triangle established since early 2025. 

This rejection fueled a sharp decline throughout August and September, which worsened further with a critical liquidation event on October 10th, momentarily pushing the price below the demand zone to $0.10. 

This dip was quickly absorbed by institutional buyers, leading to a recovery attempt that failed to flip $0.20 psychological resistance, but after a decent consolidation below this hurdle buyers accumulated it and on October 28th it saw an near 20% rise that pushed its price to $0.22, this occurred as the much-anticipated launch of the Canary HBAR ETF (HBR) on Nasdaq opened the doors for institutional investors.

Now, it’s approaching once again the upper border of this multi-month pattern, and odds suggest that if sustained bullish momentum continues, a breakout could occur this time, and November could be the biggest month.

For price to rally, HBAR/USD needs to clear the short-term resistance at $0.24 and aim for $0.30. Once it sustains above $0.30 with a daily close, then the year-end target could be near $0.40. 

Conversely, losing the $0.19 recently formed support would indicate that the major demand is present in the $0.12-$0.13 area. However, losing that support level would also confirm a deeper bearish trend, potentially leading to retreats toward $0.07 and, ultimately, the $0.04 support level.

HBAR Price Prediction November 2025: What’s Next for Hedera?

The HBAR price is rising to test the upper border of the multi-month descending triangle after receiving positive news about the HBAR ETF from Canary. It is retreating in October to the key $0.12–$0.14 demand area after its rally stalled at the multi-month descending triangle resistance near $0.30 in July. 

This upcoming retest is critical because a successful hold could launch a short-term move to $0.30 in November and potentially $0.40 by year-end. Failure to hold the demand $0.19 could pull its price back to $0.12-$0.13 demand area.

HBAR Price Prediction November 2025
MonthPotential LowPotential AveragePotential High
HBAR Price Prediction November 2025$0.125$0.27$0.40

HBAR Price Prediction 2026 – 2030

YearPotential LowPotential AveragePotential High
2026$0.45$0.80$1.05
2027$0.60$0.95$1.20
2028$0.65$1.10$1.40
2029$0.70$1.35$1.60
2030$0.95$1.70$2.20

HBAR Price Prediction 2026

Moving forward to 2026, forecast prices and technical analysis project that Hedera’s price is expected to reach a minimum of $0.45. The price could escalate to $1.05 on the higher end, with an average trading price hovering around $0.80.

HBAR Price Forecast 2027

Looking ahead to 2027, the optimism around Hedera will lead to steady growth. Hence, the HBAR price is forecasted to reach a low of $0.60, with a potential high touching $1.20 and an average forecast price of $0.95.

Hedera Price Forecast 2028

As we advance to 2028, with moderate gains, the HBAR predictions indicate that the price of a single HBAR could reach a minimum of $0.65, with the ceiling potentially rising to $1.40. Within the range, the average price will be $1.10.

HBAR Price Target 2029

By the time 2029 rolls around, it’s predicted that Hedera’s price will maintain its upward trajectory, reaching a minimum of $0.70, with the maximum price possibly reaching $1.60 and an average of $1.35, reflecting cautious optimism.

Hedera Price Prediction 2030

By the end of this decade, HBAR is predicted to touch its lowest price at $0.95, aiming for a high of $1.70 and an average price of $2.20. Hence, the prediction suggests stable long-term growth for Hedera’s market value.

Market Analysis

Firm202520262030
Changelly$0.259$0.370$1.74
priceprediction.net$0.27$0.40$1.99
DigitalCoinPrice$0.43$0.50$1.07

Coinpedia’s Hedera Price Prediction

By the end of 2025, the recovery run in HBAR prices is expected to continue with a gradual rise in momentum. Hence, by the end of 2025, Coinpedia’s HBAR price forecast expects a potential high of $0.80 with a solid support at $0.40, making an average of $0.60.

YearPotential LowPotential AveragePotential High
2025$0.40$0.60$0.80
Never Miss a Beat in the Crypto World!

Stay ahead with breaking news, expert analysis, and real-time updates on the latest trends in Bitcoin, altcoins, DeFi, NFTs, and more.

FAQs

Is HBAR investment a profitable one?

Yes, the stout fundamentals of the network make HBAR a good investment, but for the long term. 

What price can HBAR reach by the end of 2025?

Analysts forecast HBAR could peak at $0.75 by the end of 2025, with averages near $0.40 and lows at $0.15.

How many transactions can Hedera process in one second?

The network can process over 10,000 transactions in one second. 

How high will the HBAR price climb by the end of 2030?

By 2030, HBAR is forecast to reach highs of $2.20, averaging around $1.70 with lows near $0.95.

Where can I trade HBAR?

HBAR is available for trade across leading cryptocurrency exchange platforms such as Binance, Coinbase, Zebpay, etc…

Bitcoin Price Prediction 2025: Why November Could Be the Jackpot Month?

Bitcoin Price Crash

The post Bitcoin Price Prediction 2025: Why November Could Be the Jackpot Month? appeared first on Coinpedia Fintech News

As October draws to a close, optimism around Bitcoin price prediction 2025 is heating up. With BTC reclaiming key technical levels and macro events aligning in the final week of the month, November could emerge as the ignition point for a major bullish phase across crypto markets led by Bitcoin’s resurgence.

Macro Triggers Align for a Perfect Storm

This final week of October is shaping up to be one of the most pivotal in months. Multiple macro catalysts are converging simultaneously, as an analyst has mentioned that the end of quantitative tightening (QT) could be near, potential rate cuts have a higher likelihood than ever, a $1.5 trillion liquidity injection could boost US sentiment, and renewed U.S.-China cooperation could completely rejuvenate the market.

If these developments unfold as anticipated, the result could be a massive surge in global liquidity and risk appetite. The combination of macro, liquidity, and narrative dynamics sets a near-perfect stage for a breakout going into November.

Technical Breakout: Bitcoin Price Chart Signals Renewed Momentum

Bitcoin price today is trading around $115,196, marking a sharp 12% rebound from its mid-October low of $103,750. This surge has propelled BTC price above its 200-day EMA, a historically significant indicator. 

The last time Bitcoin crossed this level was in Q2 2025, it triggered a powerful upward rally, and similar momentum appears to be building again.

Bitcoin Price Prediction 2025: Why November Could Be the Jackpot Month for the Next Bull Run

On the Bitcoin price chart, the move above all above major EMAs into new support zones. Now, sustaining above them reinforces bullish sentiment and increases the likelihood of continued upside in the BTC price USD range.

Based on the bullish circumstances from this week’s event, the coming November could see the primary target of $ 130,000 and the next target at $ 145,000 before the year concludes, if bullish momentum continues.

ETF Inflows Return as On-Chain Metrics Flash Green

Following a series of outflows, Bitcoin ETF products are now experiencing net positive inflows. On October 24, $90 million in fresh institutional capital flowed into Bitcoin ETFs, signaling renewed investor confidence. 

If this momentum continues, october ending days could attract even more institutional liquidity into the market before heading into November.

Bitcoin Price Prediction 2025: Why November Could Be the Jackpot Month for the Next Bull Run

Simultaneously, on-chain data reveals a steep decline in Bitcoin exchange reserves since September, implying mass accumulation by long-term holders. 

Over the past ten days, nearly 7 million BTC have moved back into profit territory, including 5.1 million coins held by investors under six months, per an CryptoQuant insight. This shift indicates growing conviction among newer market participants and a strengthening market structure.

Psychological Shift Reinforces Bitcoin Price Forecast November 2025

Bitcoin Price Prediction 2025: Why November Could Be the Jackpot Month for the Next Bull Run

Behaviorally, profitability breeds confidence. As short-term holders see consistent gains, they’re less likely to sell prematurely and more inclined to add to positions. This gradual transformation from short-term speculation to medium-term conviction is a hallmark of early bull market phases.

If Bitcoin maintains its position above these realized price levels, it could confirm a structural transition back to optimism potentially paving the way for another leg up in the broader crypto rally. With momentum, macro alignment, and ETF inflows all trending upward, the Bitcoin price prediction 2025 looks increasingly promising.

FAQs

How much will 1 Bitcoin cost in 2025?

As per Coinpedia’s BTC price prediction, the Bitcoin price could peak at $168k this year if the bullish sentiment sustains.

How much will 1 Bitcoin be worth in 2030?

With increased adoption, the price of Bitcoin could reach a height of $901,383.47 in 2030.

How much will the price of Bitcoin be in 2040?

As per our latest BTC price analysis, Bitcoin could reach a maximum price of $13,532,059.98

How high will Bitcoin go in 2050?

By 2050, a single BTC price could go as high as $377,949,106.84

XRP Price Builds Momentum as Macro Catalysts and ETF Hopes Spark Accumulation

XRP Price Prediction For October 24

The post XRP Price Builds Momentum as Macro Catalysts and ETF Hopes Spark Accumulation appeared first on Coinpedia Fintech News

The broader crypto market appears to be approaching a major turning point and XRP price is positioned right in the middle of it. With liquidity expected to surge and macro catalysts aligning, XRP’s consolidation phase could soon give way to a decisive breakout, setting the tone for a new bullish cycle.

Liquidity Floodgates and Macro Dominoes Align

As the global economy braces for a series of synchronized macro shifts, risk assets like crypto are gaining renewed attention. The end of quantitative tightening (QT), the prospect of rate cuts, and a $1.5 trillion liquidity injection are building the foundation for what could be a historic rally.

Combined with easing U.S.-China tensions and strong S&P earnings, the current setup paints a “risk-on” environment. This perfect storm of liquidity, narrative, and capital rotation makes digital assets such as Bitcoin, Ethereum, and particularly XRP stand out among blue-chip cryptocurrencies.

XRP Price Enters a Symmetrical Triangle: Accumulation Before Expansion

Currently, XRP price hovers around $2.62, with a market cap of $157 billion and $4.49 billion in 24-hour trading volume. On the XRP price chart, the token is converging within a symmetrical triangle pattern.

XRP Price Builds Momentum as Macro Catalysts and ETF Hopes Spark Accumulation

This price compression indicates an extended accumulation phase. Smart money appears to be quietly positioning ahead of what could be a significant shift once volatility expands. The resilience of XRP price today highlights growing investor confidence despite ongoing macro uncertainties.

On-Chain Signals Strengthen: DEX Activity Suggests Upcoming Rally

Interestingly, on-chain metrics from the XRP Ledger DEX are flashing bullish signals. Since May 2025, while price consolidation has continued, the DEX transaction count has been steadily rising shows that order activity and liquidity are building beneath the surface.

XRP Price Builds Momentum as Macro Catalysts and ETF Hopes Spark Accumulation

This surge in transactional engagement, including order placements and cancellations, reflects heightened participation from sophisticated traders. Such patterns typically precede strong price movements, suggesting that the market is “coiling the spring” for a sharp upside breakout once catalysts align.

ETF Momentum Could Redefine the XRP Narrative

Perhaps the most influential upcoming driver for XRP crypto is the growing anticipation around a potential XRP ETF launch. Recent discussions indicate that spot crypto ETFs for XRP, Solana, and Litecoin are ready for regulatory clearance once Washington resumes full operations.

Next two weeks?

Spot xrp, sol, ltc, & other ETF filings all lined up & ready for launch. pic.twitter.com/BVLbfSeD0K

— Nate Geraci (@NateGeraci) October 27, 2025

Market commentators describe this situation as a “dam about to burst,” with the delay in approval being the only barrier holding back institutional inflows. Once lifted, the wave of new ETF products could dramatically increase XRP exposure, shifting it from an accumulation phase to a sustained XRP price rally.

FAQs

How much will XRP reach in 2025?

Analysts and AI forecasts project XRP could reach $5.05 by the end of 2025, driven by ETF approvals, partnerships, and regulatory clarity.

How much will 1 XRP be worth in 2030?

Based on compounding growth and adoption, projections estimate XRP could trade around $26.50 by 2030, with averages near $19.75.

Can XRP make you a millionaire?

Hypothetically, yes—if XRP reaches $500+ and an investor holds a significant amount (e.g., 2,000 XRP). However, this is speculative and depends on extreme long-term growth.

Is XRP a Good Investment?

XRP is considered a strong investment due to its institutional adoption, regulatory progress, and role in cross-border payments. However, it carries volatility risks like all cryptocurrencies.

❌