The recent Dogecoin market action has seen its price now hovering below $0.20 after surging to $0.208 in the past 24 hours. Despite the consolidation, analysts and traders are watching the meme coin closely, believing that the next major move could redefine its long-term trajectory.
Among those voices is crypto analyst EtherNasyonaL, who predicted that Dogecoin’s third and most powerful bullish phase is still ahead. His technical analysis on the monthly chart presents a structure that reveals the groundwork for another massive uptrend to above $0.8 is already in motion.
Dogecoin’s First Two Bull Waves Set The Stage
The monthly candlestick price chart shared by EtherNasyonaL calls attention to Dogecoin’s cyclical nature since 2014, showing two completed bull waves and a third one forming. Each of these bullish waves was formed after Dogecoin broke above and then retested the upper trendline of a descending channel of lower highs that had confined its price action in the preceding years. This retest was also highlighted by a confluence of the 25 Moving Average (MA) indicator.
The first wave, which began in 2017, caused Dogecoin’s earliest exponential rise from near-zero levels, right when the meme coin entered into popular crypto discussions. The second, and far more explosive, bull wave occurred between 2020 and 2021, when Dogecoin surged from under $0.003 to an all-time high of $0.7316, which has stood until now.
Each bull run started once Dogecoin reclaimed its 25-month moving average as support, following extended consolidation periods that spanned multiple months. The current setup reflects the same condition, as the 25MA line has once again turned upward, and Dogecoin has successfully retested the upper trendline of its previous descending channel, as shown in the chart below.
The analysis reveals that Dogecoin has recently broken free from a long-term downtrend that spanned between mid-2021 and early 2025. Notably, recent crypto market liquidation events in October have seen the Dogecoin price complete a successful retest of the resistance level, now turned support, around the $0.17 to $0.20 price range.
This successful retest also coincides with a simultaneous bounce off the bottom trendline of an ascending channel. EtherNasyonaL describes the current price action as Dogecoin “accumulating strength in the lower band of a years-long ascending channel.”
The projected trajectory on the chart above shows Dogecoin following its established pattern by moving from the lower region of the ascending channel to its upper boundary. If the third bull wave plays out as the previous two did, Dogecoin’s price could challenge its $0.73 all-time high and break into new price territories. The first price target in this case is the $0.8 mark, and then as high as $4 in the long term.
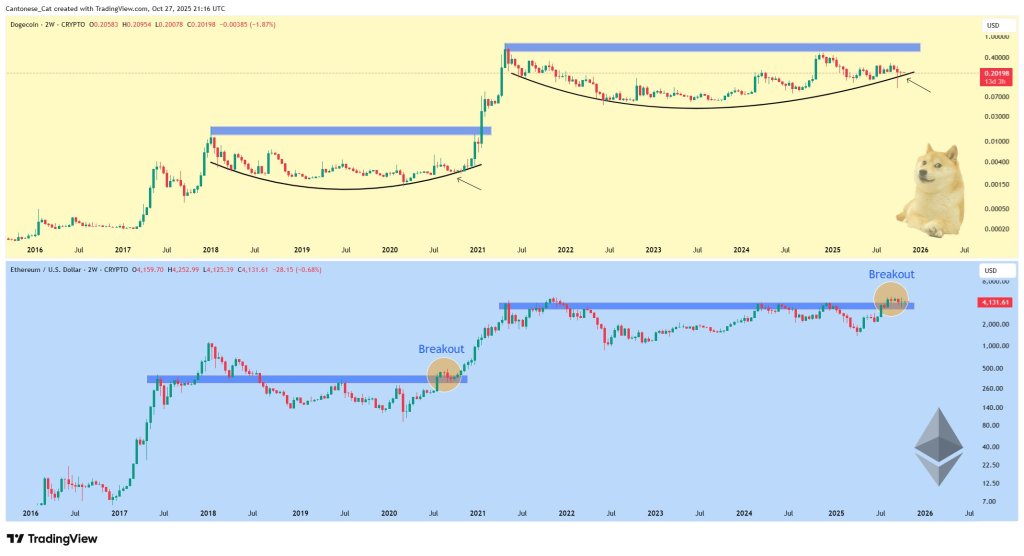
Cantonese Cat used his October 28 video to zero in on the Dogecoin market structure, arguing that the meme-coin is nearing the end of a multi-year accumulation phase—and that the recent washout was a feature, not a bug, of that process. While he declined to publish numeric price targets in the video, he made the case that DOGE’s setup is maturing in lockstep with broader “risk-on” signals, with a familiar lag to Ethereum that historically precedes Dogecoin’s larger moves.
When Will Dogecoin Rally Again?
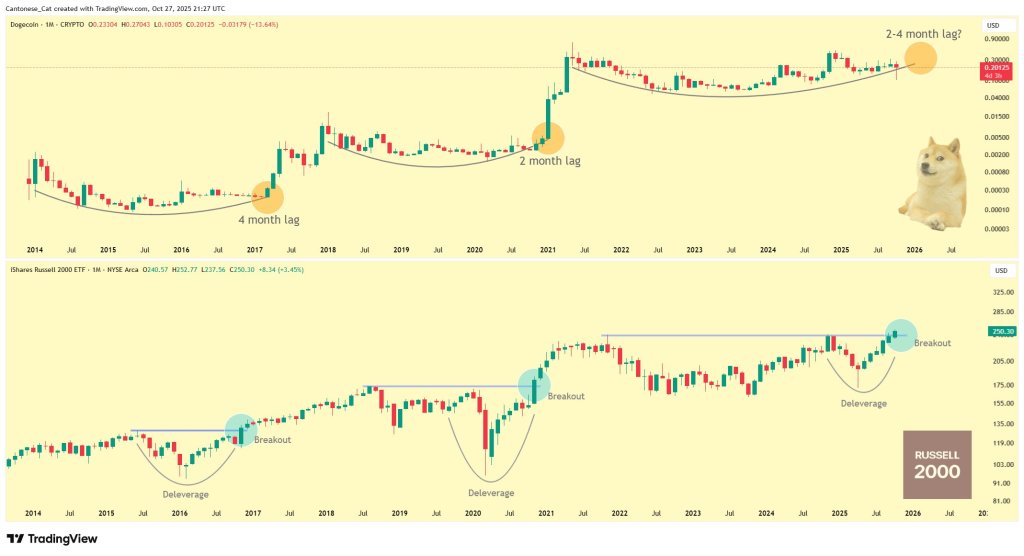
On structure, he was explicit. “Just looking at Doge here, you can see how […] Doge has been forming a cup over here for close to four and a half, five years now […] it’s just been building a big giant base.” In his read, the rounded bottom is the defining pattern of this cycle for DOGE, and it remains intact despite recent volatility.
He framed the sharp drawdown two weeks ago as necessary positioning rather than a break in trend: “You just had a great deleveraging event […] I’m not going to look at a lower low and think the trend is broken […] These are very healthy deleveraging before the next move up as far as I’m concerned.” He highlighted “a big giant wick” and “a lot of demand down below,” pointing to what he sees as resilient spot support through the base.
Timing, not targets, was the centerpiece. He reiterated that Dogecoin typically follows Ethereum with a delay once ETH clears its own major resistance bands. “Whenever we get closer to the end of the rounded bottom […] that’s when Ethereum breaks out above the resistance zone and goes up a lot higher. Thus, Doge runs together with Ethereum,” he said, adding: “There is a lag. I would say the lag is probably maybe a couple months between Ethereum breaking up and Doge finally breaking above this rounded bottom here and going up.”
He made a similar observation using risk proxies, noting that DOGE moves have historically trailed small-cap-led risk cycles by several months, though he cautioned that the exact interval can vary. Via X, he added “DOGE lags behind IWM [iShares Russell 2000 ETF] all-time-high breakout by about 2 to 4 months before it takes off.”
Cantonese Cat also pushed back on the view that a sequence of lower lows automatically invalidates the DOGE setup, arguing that this occurred in prior cycles just before outsized rallies. “A lot of people look at this, ‘that’s a lower low […] the cycle is over.’ Well, it doesn’t work that way. That’s a lower low right there. Next thing you know, it just went a lot higher,” he said, tying the observation to the current “healthy deleveraging” and the persistence of the rounded-bottom structure.
If the video offered the structural blueprint, his same-day post on X clarified his stance on headline targets. “I realize that it’s stupid to call for DOGE to $2 or $4 when price is at 20 cents. If I was smart like others, I should just call for DOGE to $2 or $4 when it’s $2 or $4.” The comment is consistent with his prior price predictions.
Inside the video update, the analyst instead emphasized the sequence he expects to matter—ETH strength first, DOGE follow-through second, with the magnitude determined by how far the broader risk cycle runs once momentum rotates.
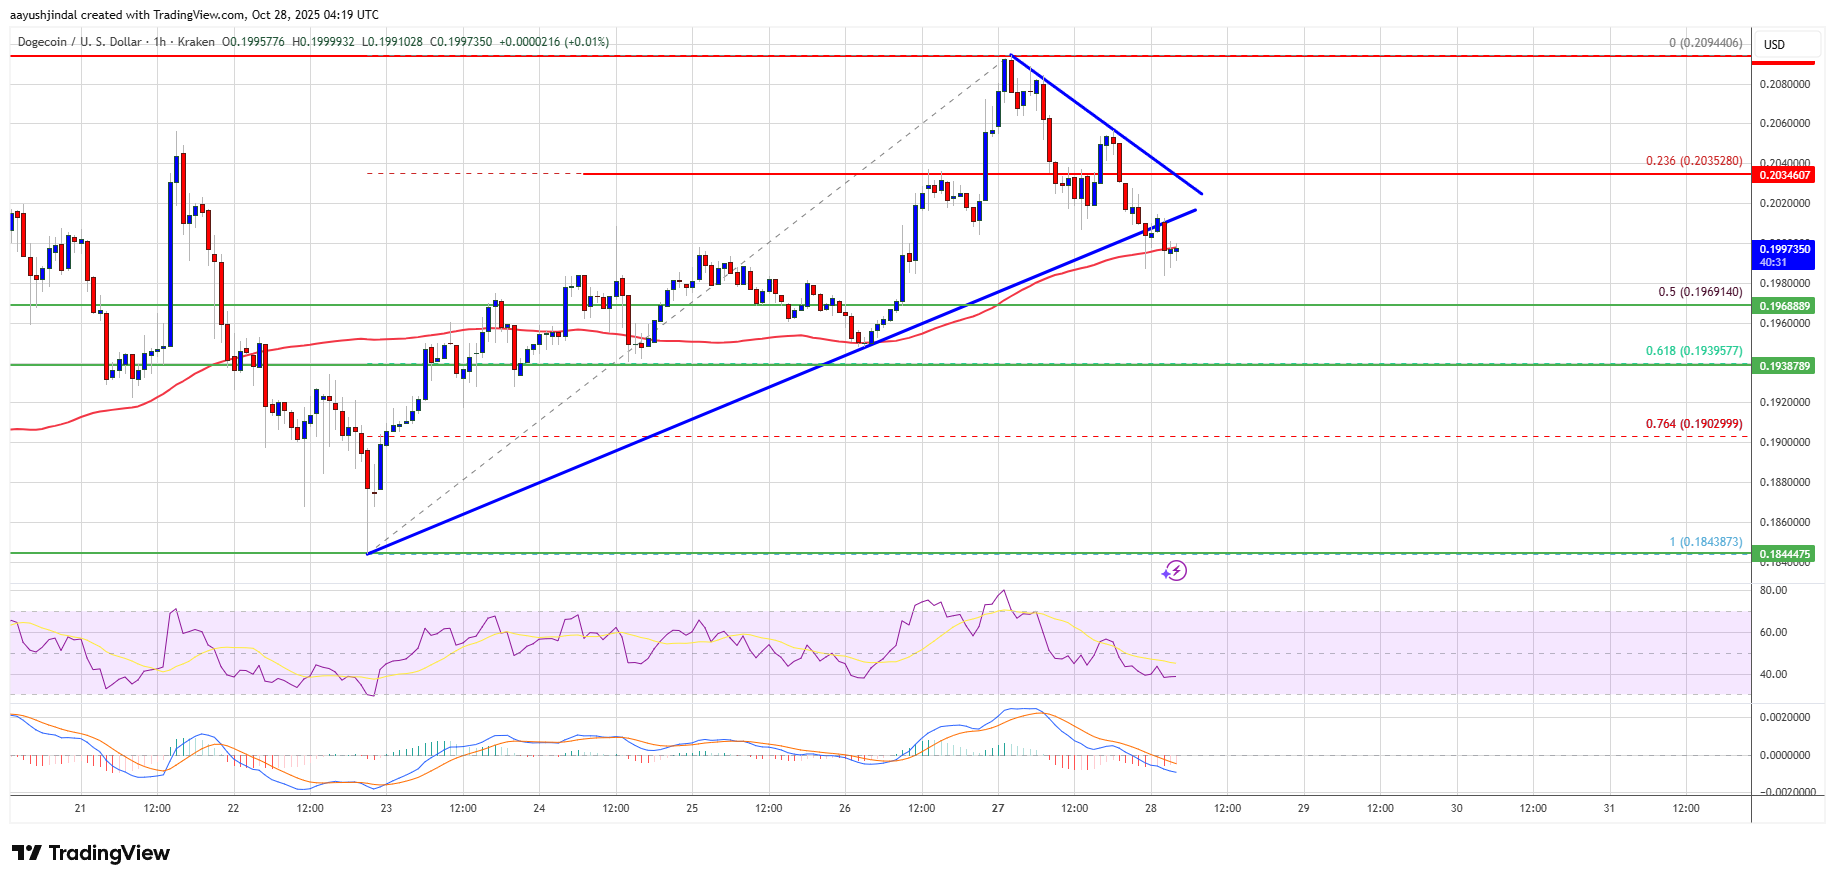
Dogecoin struggled to rise above $0.210 and corrected some gains against the US Dollar. DOGE is now consolidating and might decline below $0.1980.
DOGE price started a fresh downside correction below $0.2035.
The price is trading below the $0.20 level and the 100-hourly simple moving average.
There was a break below a contracting triangle with support at $0.20 on the hourly chart of the DOGE/USD pair (data source from Kraken).
The price could aim for a fresh increase if it remains stable above $0.1940.
Dogecoin Price Starts Another Pullback
Dogecoin price started a fresh increase after it settled above $0.1920, like Bitcoin and Ethereum. DOGE climbed above the $0.20 resistance to enter a positive zone.
The bulls were able to push the price above $0.2020 and $0.2050. A high was formed at $0.2094 and the price is now correcting gains. There was a move below the 23.6% Fib retracement level of the upward move from the $0.1843 swing low to the $0.2094 high.
Besides, there was a break below a contracting triangle with support at $0.20 on the hourly chart of the DOGE/USD pair. Dogecoin price is now trading below the $0.20 level and the 100-hourly simple moving average.
If there is another increase, immediate resistance on the upside is near the $0.2020 level. The first major resistance for the bulls could be near the $0.2050 level. The next major resistance is near the $0.210 level. A close above the $0.210 resistance might send the price toward $0.2150. Any more gains might send the price toward $0.2250. The next major stop for the bulls might be $0.2320.
More Losses In DOGE?
If DOGE’s price fails to climb above the $0.2020 level, it could start a downside correction. Initial support on the downside is near the $0.1970 level and the 50% Fib retracement level of the upward move from the $0.1843 swing low to the $0.2094 high. The next major support is near the $0.1935 level.
The main support sits at $0.190. If there is a downside break below the $0.190 support, the price could decline further. In the stated case, the price might slide toward the $0.1840 level or even $0.1780 in the near term.
Technical Indicators
Hourly MACD – The MACD for DOGE/USD is now gaining momentum in the bearish zone.
Hourly RSI (Relative Strength Index) – The RSI for DOGE/USD is now below the 50 level.
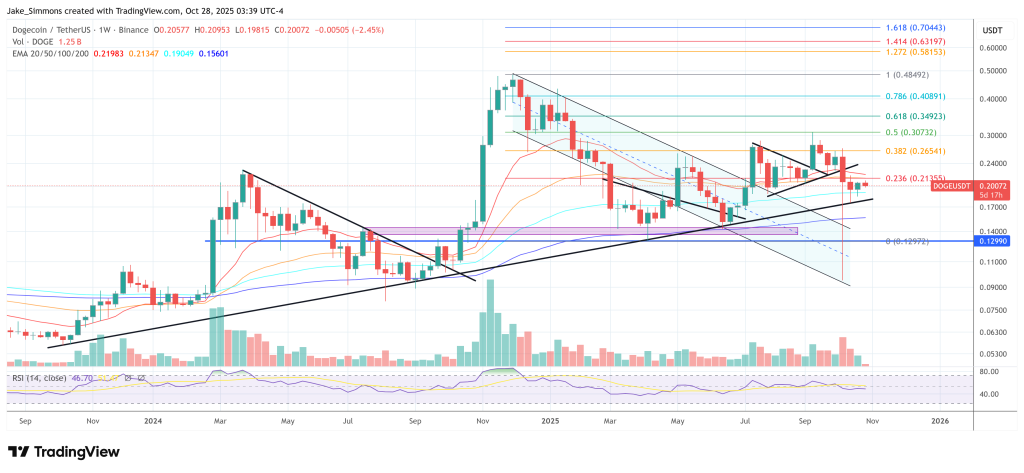
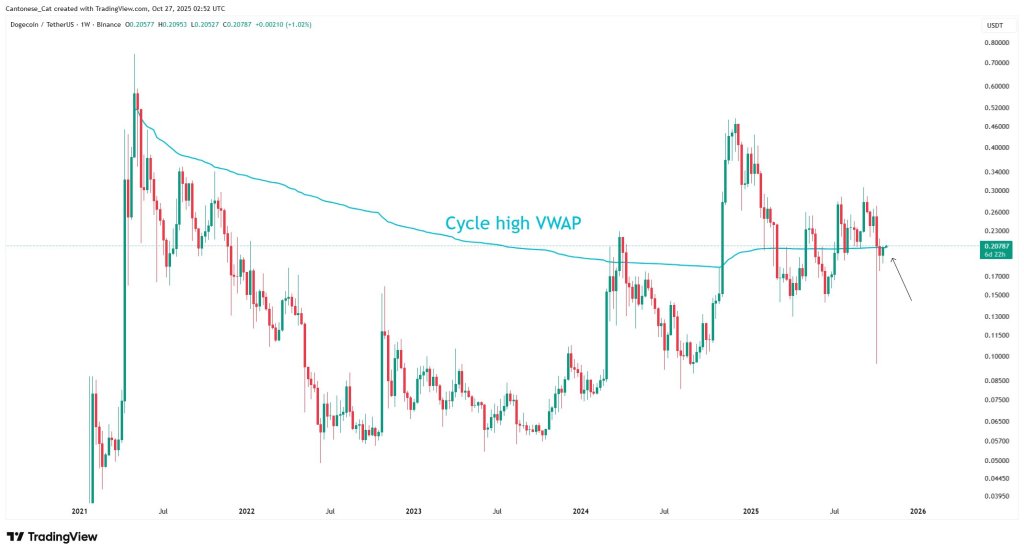
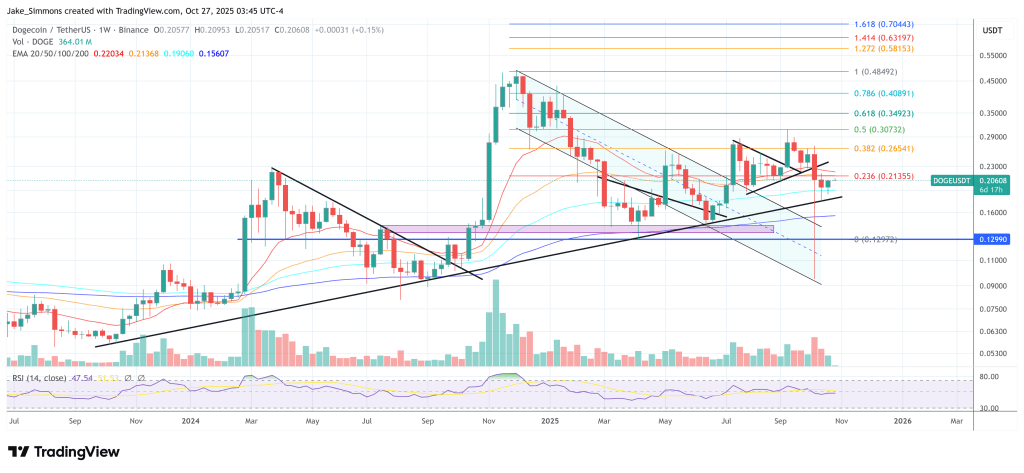
The Dogecoin weekly chart is flashing a cluster of technically constructive signals, according to crypto analyst Cantonese Cat (@cantonmeow), who published a four-panel weekly read on DOGE on Oct. 27. Price is currently hovering near $0.208 on Binance spot, and the setup he highlights pivots on four independent checks: the cycle-high anchored VWAP, Ichimoku “Katana” support, a 0.5 log-scale Fibonacci hold, and conspicuously light sell-side volume during the recent drawdown.
4 Reason To Be Bullish On Dogecoin
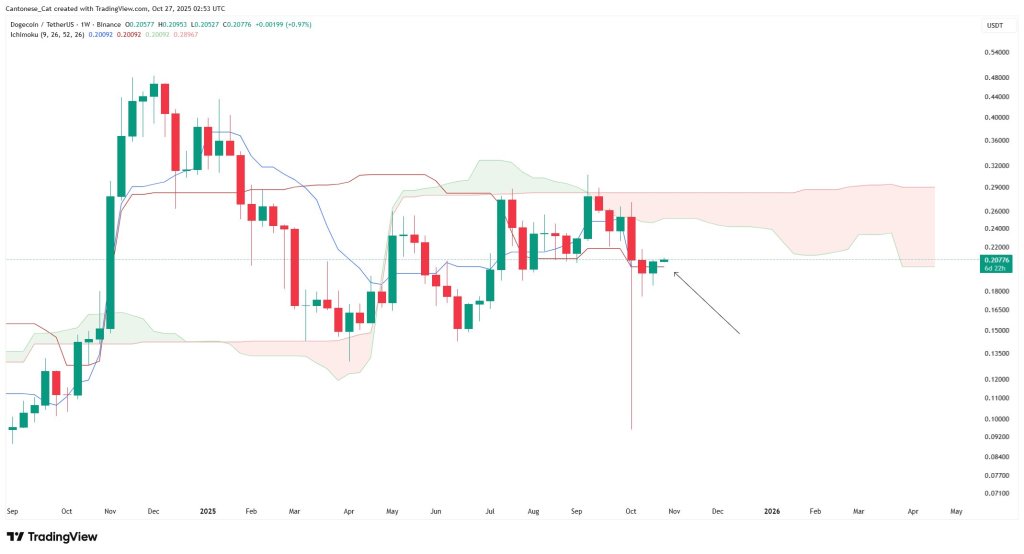
In his post, Cantonese Cat wrote: “Attempting to reclaim cycle high AVWAP as support. Claiming Ichimoku Tenkan + Kijun fusion (blue and red lines fused together), AKA Katana, as support so far. Holding 0.5 log fib from cycle high–cycle low as support so far. There’s been no volume so far during this downturn on multiple exchanges including Coinbase and Binance, and all it takes is just some volume to come in and we could reverse any downtrend in a hurry.”
On the anchored VWAP chart, the teal line measured from Dogecoin’s cycle peak tracks the market’s volume-weighted cost basis since the 2021 top. DOGE is pressing that band from above/at parity, attempting to convert it into support after a failed breakdown earlier this month.
On a weekly basis, closing and subsequently holding above the cycle-high AVWAP tilts risk-reward positively because it implies the marginal participant who bought since the peak is no longer underwater. Notably, the most recent weekly wick that probed below the band—printing a sharp stab toward the low-$0.09s—was retraced swiftly, with subsequent candles clustering back around ~$0.21. That rejection of lower prices right at the anchored VWAP argues against sustained distribution at current levels.
The Ichimoku frame reinforces the same idea. Tenkan-sen and Kijun-sen are fused around ~$0.2009 on the weekly (a configuration the analyst labels “Katana”), and price is currently riding that confluence as support. The cloud (Senkou span) remains red and overhead, spanning roughly the $0.24s into the ~$0.29 region, which defines the near-term supply zone that would need to be cleared on a weekly close to confirm trend resumption.
Until then, the Katana acting as a shelf at ~$0.20 is the near line in the sand; lose it decisively and the bias flips back to testing deeper supports, but sustain it and the path of least resistance shifts to re-engaging the cloud’s lower boundary.
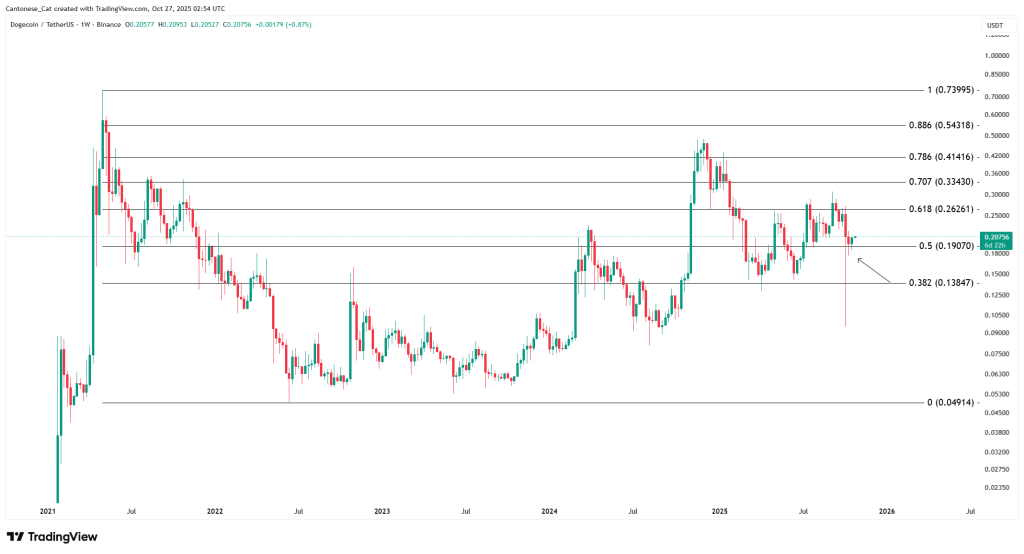
Fibonacci context adds precision to those levels. Measured log-scale from the cycle high to the cycle low, DOGE has so far defended the 0.5 retracement at $0.19070 on multiple weekly closes.
That 50% line is the pivot of the current structure: a confirmed weekly close and acceptance below would hand momentum to bears toward the 0.382 at $0.13847, while continued defense keeps the market pointed at successive retracement ceilings overhead—the 0.618 at $0.26261, the 0.707 at $0.33430, the 0.786 at $0.41416, and the 0.886 at $0.54318—before the full retrace to the cycle high marker around $0.73995.
Price has been oscillating in a broad $0.16–$0.27 corridor for months; sitting above the 0.5 while probing the AVWAP strengthens the case that the mid-$0.20s could be revisited if buyers can reclaim momentum.
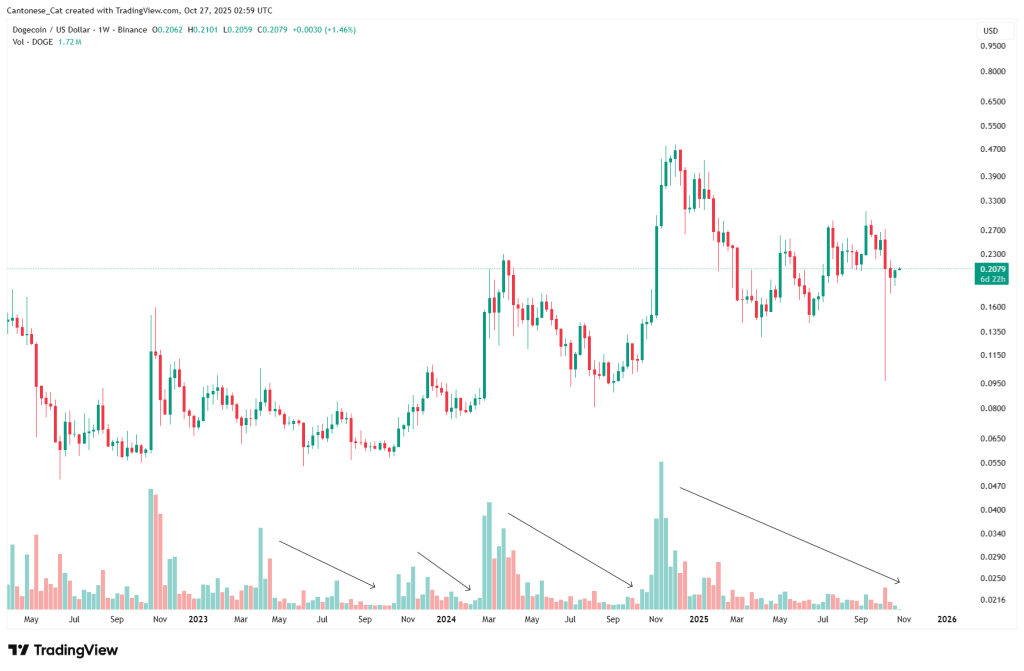
Volume is the wild card—and the fourth reason the analyst cites for optimism. The weekly histogram across multiple years shows that persistent selloffs have been accompanied by contracting volume, with downward arrows on the chart denoting successive periods of declining activity into lows.
By contrast, the last major impulsive advance in late 2024 printed the cycle’s heaviest weekly turnover. The current downturn lacks that distribution signature; bins on Coinbase and Binance have thinned rather than expanded. In market-structure terms, falling volume on pullbacks is textbook corrective behavior, and it leaves the door open for a sharp reversal if/when demand returns.
Put together, the four lenses describe a market sitting on top of a stacked support cluster: the cycle-high AVWAP roughly at the current price, the Ichimoku Katana fused near ~$0.2009, and the 0.5 log Fibonacci at $0.19070 just below. The invalidation path is clear enough—a decisive weekly loss of the $0.19 handle would expose the $0.13847 (0.382) shelf—while the upside path is equally mapped: first reclaim the lower edge of the cloud in the low-$0.20s, then test $0.26261 (0.618), with any weekly close through that level shifting focus to $0.33430 and beyond.
Dogecoin price has been trading around the $0.19 level for days, with relatively little action in the market. The wildly famous meme coin is currently exchanging hands between $0.18 and $0.20 with a bit more activity than the week before.
Now, some analysts think the calm will soon yield to a big rally. New technical signals suggest that the Dogecoin price is showing some signs of life as it looks at a breakout of $0.5 as bullish momentum slowly returns.
Market Developments and Analyst Insights
Crypto analyst EtherNasyonaL on platform X is fuelling a traders comeback full of hope once again. The analyst added that the Dogecoin price is now testing the lower boundary of a long-term rising channel that has been directing its growth since its inception.
Every time Dogecoin price has hit this bottom range historically, it has seen significant bumpbacks. These reversals frequently signal the beginning of strong upward thrusts. The current setup resembles those in the past that have preceded major Dogecoin price rallies, the analysis adds.
Dogecoin tumbled earlier this month due to a sudden market decline, but began recovering swiftly from solid support areas. This recovery is reminiscent of the early phases of the 2021 surge, which saw the price of Dogecoin grow from less than $0.10 to over $0.70 in months’ time.
On each rip off this trendline support has coincided with a recovery that led to new highs for the coin. The structure indicates that Dogecoin may be again poised to accelerate higher should pressure mount on the market, the pattern suggests.
Momentum Indicators Point to a Bottom
EtherNasyonaL’s analysis revealed that DOGE’s momentum indicators are now at historic lows. The Stochastic RSI, which measures momentum strength, shows a clear bottoming signal. The last time this pattern appeared, DOGE entered a strong bullish cycle shortly afterward.
The analyst described the current stage as one of “quiet, calm, yet determined recovery.” Although the market appears still, the Dogecoin price could be in the early accumulation phase that often precedes large upward moves.
Technical Outlook and Price Channel Structure
The long-term rising channel on the Dogecoin chart is still holding. The Dogecoin price is currently with its back up against the bottom of these curves, which have acted as a launch point for previous cycles. A bounce back from this zone might drive the price towards $0.5.
If the recovery strengthens, further targets may include $0.9 and $1, aligning with the previous all-time high region. For now, maintaining the channel’s lower range is crucial for confirming a bullish continuation.
On-Chain Data Strengthens Bullish Sentiment
On-chain activity also confirms the positive view. The amount of DOGE held in exchanges’ reserves is still decreasing, indicating that holders are moving coins into long term storage. This decrease in available supply has been followed by runs up in the price of Dogecoin.
Month
Min. Price
Avg. Price
Max. Price
Change
Oct 2025
$ 0.1896
$ 0.2132
$ 0.2476
25.35%
Nov 2025
$ 0.2070
$ 0.2228
$ 0.2357
19.30%
Dec 2025
$ 0.2281
$ 0.2341
$ 0.2406
21.78%
The level at $0.195 is being closely monitored by analysts. Continued movement above that level could indicate the onset of a Wyckoff-style markup phase, as institutional and algorithmic buyers return to the market.
Short-Term Risks and Key Support Levels
There are positive signs, but short-term caution is still in order. There is a strong support forming near the $0.194 level, below which it might revisit the $0.188 support zone. Preserving these watersheds are critical to the path of maintaining this bullish structure.
Institutional traders are waiting on volume to confirm. A strong volume breakout beyond $0.20 could confirm the beginning of the next leg of the uptrend. Without it, these side way rests can continue before any broader move takes hold.
Calm Before the Potential Breakout
Currently, DOGE is in a state of consolidation and calm – but history says it’s unlikely to stay that way. The technical and on-chain indicators suggest momentum is building under the surface. Traders view this as the quiet before the next wave.
As the overall crypto market takes a breather, Dogecoin might be at the forefront of the next wave of bullish speculation. Historical cycles highlighted that quiet periods like this generally lead to a surge in upwards momentum, so it is worth keeping an eye on.
Conclusion
The Dogecoin value is stable, but it could break one way or another. Strong technical support, low momentum readings and increasingly confident investors indicate that the next move could be to the upside.
If Dogecoin continues to hold above $0.194, it might be a sign of strength in the market. If $0.20 gets taken out with volume the price can head higher towards $0.5 and beyond hopefully.