Reading view

How to Calculate Crypto Taxes in 2025: Key IRS Updates, and Global Tax Trends

This article was first published on The Bit Journal.

Crypto taxes 2025 are dominated by new reporting rules and guidance. In the US, the IRS still treats crypto as property and as a result; selling or trading triggers capital gains tax, while mining or staking yields ordinary income tax. The latest federal rules such as Form 1099-DA for brokers make record-keeping and accurate cost basis tracking more important than ever.

US Crypto Tax Updates in 2025

This year, the biggest news for crypto taxes was the new IRS reporting rules. Under the Infrastructure and Jobs Act, US exchanges like Coinbase must issue Form 1099-DA for crypto sales, which took effect January 1, 2025.

This form reports gross proceeds of each sale to taxpayers and the IRS, making gain/loss calculations easier. By Jan 1, 2026 brokers must also report cost basis. Notably in April 2025; Congress repealed a proposed rule that would have required decentralized (DeFi) platforms to report trades.

However, centralized exchanges and custodial wallets will still report transactions. Reports show that brokers will start issuing 1099-DA to users in early 2026 for 2025 transactions. Overall; 2025’s rule changes shift more tracking to platforms but taxpayers are still responsible for accurate reporting of gains/losses.

The IRS still emphasizes that all crypto transactions must be reported, echoing their long standing guidance that digital assets are “treated as property” for tax purposes. Crypto taxes in 2025 now involves keeping detailed records of every transaction and using the new IRS forms correctly.

Understanding Crypto Taxation in 2025

For US taxpayers, cryptocurrency is still taxed like other property like stocks or real estate. This has two main parts:

The first is Capital gains tax. When crypto holders sell or exchange crypto at a profit; tax is owed on the gain. This implies the sale price minus holder’s cost basis.

If the crypto holder held the asset for one year or less, it’s a short-term gain taxed at ordinary income rates (10-37%). If held over one year; it’s long-term, taxed at reduced rates (0%, 15%, or 20% depending on income).

Next is the Income tax. If a crypto holder earns crypto via mining, staking or as payment for goods/services; that income is taxed at ordinary income rate (10-37%). The fair market value of crypto at the time received must be reported.

For example, earning 0.5 ETH valued at $1,000 means $500 of ordinary income. Later if that same crypto is sold, calculate a new capital gain or loss based on what was originally “paid” (the $500 basis) vs. the sale price.

In all cases; the IRS requires detailed records. Crypto holders must track each transaction’s date, crypto type, amount, fair market value in USD and cost basis. These numbers feed into the calculations.

Notably; IRS guidance prohibits the “universal wallet” method, meaning crypto traders must account wallet-by-wallet from the start of 2025 onward. That means; never lose track of purchase price and fees for every coin or token and note the exact time and value in USD.

Calculating Crypto Gains and Losses

To calculate crypto tax for 2025, these steps must be considered:

Cost Basis: This is what the holder paid for the crypto, including fees. It’s the “purchase price” for tax purposes. If the crypto holder  got crypto for free (gift or airdrop), then the basis is its fair market value at receipt.

Record Sale/Trade Details: For each crypto disposal (sale, swap, spend), note the date, the amount received (in USD), and any fees. The spot market rate on that date must be used to convert crypto to USD.

For example, selling 1 BTC at $20,000 with a $15,000 basis is a $5,000 gain. List gains or losses transaction by transaction, then net them together. Losses can be used to offset gains.

Tax Rates: Each gain is classified as short-term (held ≤1 year) or long-term (>1 year). Apply personal tax bracket to short-term gains, and the lower 0/15/20% rates to long-term gains. If losses exceed gains, losses can be carried forward.

Income Events: If a crypto holder mined, staked, or received crypto as payment, it should be treated as ordinary income equal to the crypto’s USD value at receipt. This income adds to taxable income for the year. Any later sale of those coins would be a capital gain or loss from its receipt-date basis to the sale price.

Hence;

To Calculate Gain or Loss: Subtract the cost basis from the proceeds for each transaction.

Gain/Loss = Sale Proceeds – Cost Basis

In summary, every crypto tax calculation comes down to accurate cost basis and fair market value tracking. IRS instructions (Form 8949, Schedule D) assume crypto holders have these figures for each crypto disposal. Using tools (like crypto tax software) or spreadsheets can help not to miss any event.

Reporting and Tax Forms for Crypto

When filing, U.S. taxpayers must report crypto sales and income on the right IRS forms. On Form 1040’s Schedule D, report total capital gains or losses.

Each transaction goes on Form 8949, where date acquired, date sold, proceeds, cost basis, and gain/loss are listed. For crypto earned as income, it should be reported on Form 1040 as ordinary income (Schedule 1 or Schedule C for business activity).

Most crypto brokers and exchanges are to help by sending crypto holders the Form 1099-DA. This form will list the holder’s gross proceeds from any crypto sales or trades. For 2025 returns, brokers will provide proceeds but not basis; for 2026 and later, they will also report basis.

Crypto holders should note that even if they don’t get a 1099 (e.g. peer-to-peer trades or DeFi activity) those transactions must still be reported.

The IRS explicitly states that everyone answering “Yes” to the digital asset question on Form 1040 must report all crypto gain/loss.

In short, the IRS forms (8949/Schedule D, 1040, etc.) must be used to report gains/losses and income while the 1099-DA data is used as available to verify.

Global Crypto Tax Trends 2025

Many other countries also tax crypto similarly; often as capital gains or income. 

United Kingdom: HMRC treats crypto as a capital asset. Profits above the (reduced) £3,000 CGT exemption are taxed at 18-28%; depending on the taxpayer’s rate. Crypto mining or services payments are taxed as income (0-45%) above the personal allowance. New OECD reporting rules (CARF) will require UK exchanges to share customer data from 2026.

Canada: Crypto is generally capital gains or business income. Only 50% of a capital gain is taxable; the rest is tax-free, at the crypto holder’s normal tax brackets. The inclusion rate rises to 66.7% for very large gains above CAD $250K in 2026. Mining and staking income are taxed as ordinary income. Canadians must keep the same detailed records (date, value, basis) and report transactions by April 30 each year.

Germany: Crypto is treated as a private asset, taxed under income tax rules. Short-term gains are added to income (up to 45%, plus a 5.5% solidarity tax). However, long-term holdings can be sold tax-free. Income from crypto like staking and mining is taxed at ordinary rates as well. German taxpayers under €1,000 net profit may not even need to file.

Many other countries follow similar models of capital gains or income tax. Emerging frameworks like the OECD’s Crypto-Asset Reporting Framework (CARF) are pushing for standardized reporting across jurisdictions.

Under CARF, crypto platforms worldwide will reportedly share transaction data with tax authorities starting with 2026 reporting. Despite variations, the core calculation (sale price minus cost basis) is a constant global principle.

Conclusion: Crypto Tax Future

Tax professionals emphasize that 2025 is a transition year and many new rules are still settling. Although Congress rolled back some DeFi reporting requirements, experts warn proper reporting will only get more important.

Reports claim accurate record-keeping is still required for even the casual investor since blockchain activity is public and the IRS is watching. Under a crypto-friendly administration, regulations may evolve; but taxpayers can’t assume leniency.

Looking ahead; analysts point to automation of tracking, global data sharing and IRS enforcement. For example, HMRC in the UK is sending “nudge letters” to investors and building tools to analyze crypto trades.

In the US, the shift to Form 1099-DA reporting and the end of universal wallet accounting; means crypto holders should adopt a wallet by wallet accounting method now.

Overall the consensus is; stay informed and keep records. Use tax software or professional help to ensure each crypto event (trades, income, transfers) is captured with cost basis data.

As one expert firm puts it, while information reporting to the IRS has changed, taxpayers remain responsible for accurately reporting gains and losses. In other words don’t assume the new forms do all the work; proactive tracking and consultation with a tax advisor is highly recommended.

Glossary

Capital Gains Tax: Tax on the profit from selling an asset. 

Cost Basis: Original investment amount in the crypto (purchase price plus fees). It is subtracted from the sale price to compute gain or loss. 

Form 1099-DA: A new IRS tax form; that crypto brokers will use to report the total proceeds from digital asset sales to crypto holders and the IRS. It helps taxpayers verify the amounts reported on Schedule D/Form 8949.

Crypto-Asset Reporting Framework (CARF): An OECD tax reporting standard; being adopted globally. Starting in 2026; many countries (including the UK) will require crypto platforms to share detailed transaction and user information with tax authorities.

Holding Period: The time a crypto asset is held before selling. It determines tax rate.

Taxable Event: Any crypto transaction that triggers tax. 

Frequently Asked Questions About Crypto Taxes in 2025

Do crypto holders have to report crypto transactions on their 2025 tax return?

Yes. The IRS requires all crypto transactions to be reported. Any sale, trade, gift or income (mining, staking, etc.) in crypto must be included on tax return.

How does one calculate crypto capital gains or losses?

For each crypto sale or exchange, subtract cost basis (what was originally paid, including fees) from the proceeds to find the gain or loss. Record every transaction’s date, crypto type, units and USD values. Classify each gain as short-term (≤1 year held) or long-term (>1 year); for the correct tax rate. Sum all gains and losses for the tax year and fill out Form 8949 and Schedule D accordingly.

What forms are used to report crypto on taxes?

U.S. taxpayers use Form 8949 to report each cryptocurrency sale or trade; and then summarize totals on Schedule D of Form 1040. Crypto mined or received as payment is included as income on 1040 (Schedule 1 or Schedule C). Exchanges are expected to send Form 1099-DA detailing taxpayer’s crypto sale proceeds; which is then used to verify records. Even if you taxpayer doesn’t get a 1099 (e.g. peer-to-peer trades); transactions must still be reported.

Are cryptocurrency airdrops, gifts, and hard forks taxable?

Yes. The IRS treats free crypto from mining; staking, airdrops, forks, or as gifts as income. Report the fair market value of the crypto at the time received as ordinary income. For gifts received; the basis is the fair market value at receipt. If that crypto is later sold or traded, then compute capital gains/losses based on that basis.

What changed in crypto tax rules for 2025?

The big change is the IRS’s requirement that brokers report crypto sales proceeds on Form 1099-DA starting earlier this year on Jan. 1, 2025. This makes crypto reporting more like stock sales. Another recent change is the repeal of a DeFi reporting rule, so certain decentralized platforms are exempt. Importantly, the IRS’s fundamental tax treatment of crypto as property has not changed.

Read More: How to Calculate Crypto Taxes in 2025: Key IRS Updates, and Global Tax Trends">How to Calculate Crypto Taxes in 2025: Key IRS Updates, and Global Tax Trends

How to Calculate Crypto Taxes in 2025 Key IRS Updates, and Global Tax Trends

Shiba Inu Price Forecast: 94 Billion SHIB Moved in 24 Hours as Market Stands Still

This article was first published on The Bit Journal.

The current Shiba Inu price forecast reflects a market standstill, with on-chain data showing no movement. Recent reports show only 94 billion SHIB tokens ($850,000) moved on exchanges during a full trading session.

Technicals mirror the standstill as RSI bounced from oversold zones and is now stalling, and the MACD histogram is below the signal line.

What this means is that neither bulls nor bears are engaged, which could equate gradual decline or quiet accumulation before a breakout. Without a catalyst; Shiba Inu price forecast is tied to key supports at $0.0000085 and potential upside zones at $0.000012 or more if momentum returns.

On-Chain Signals and the Shiba Inu Price Forecast

The standstill is visible in transaction-flow metrics. Reports divulge that the flow of $SHIB has almost completely stopped with active participation from neither bulls nor bears. On-chain analytics platform reported only 73 billion netflows in a day which suggests the momentum might lost for the meme coin at the moment.

Meanwhile, token-burning activity offers a twist. $SHIB’s weekly burn rate surged by over 139% (61 million tokens burned) after October’s 16% drop.

Experts claim Shiba Inu price forecast now depends on if this burn momentum can translate into scarcity and upward pressure. If not, there could be further consolidation or wear down.

What Analysts Are Saying About Shiba Inu

The spectrum of the Shiba Inu price forecast shows widely diverging expectations:

Source Forecast Focus View
CoinCodex  Short-term Projects a 15% rebound to $0.00001139 by Nov 30 if support holds at $0.00000950.
Changelly  2025 season Suggests average $0.0000104 in Dec 2025, with limited upside (15%).
CoinFomania  Mid-term One model projects $0.000015 average by late 2025, higher in bullish case.
BraveNewCoin Catalyst-driven Indicates potential move toward $0.0000176 if major catalyst arrives.
CoinMarketCap AI  Algorithmic Predicts 15% gain to $0.00001075 by early Dec, but notes bearish structural issues.


Overall; the forecast is for modest upside under normal conditions, more so with fresh catalysts.

Bull, Base and Bear Scenarios for the Shiba Inu Price Forecast

In the bull case; Shiba Inu price forecast sees $SHIB break out of the multi-month descending channel via catalysts such as ecosystem upgrade (Shibarium roll-out); renewed token burns or institutional interest.

If $SHIB gets back to $0.000012 and momentum aligns, the price could go to $0.000017-$0.000020 by the end of 2025, with token-burn acceleration and supply withdrawal from exchanges.

Under base expectations, the Shiba Inu price forecast is for sideways consolidation. If $SHIB holds key support at $0.00000950, it possibly retests the lower boundary at $0.00000849 and climbs gradually to $0.000011 by year-end. Without a catalyst, the price is limited to upside and holding rather than breaking out.

If neither support holds nor catalysts emerge, Shiba Inu price forecast becomes more muted or negative. A break below $0.00000850 could see a decline to $0.00000670 as structural demand dries up.

Burn momentum slows, on-chain flows shrink further, and $SHIB becomes a standstill.

Catalysts Shaping Shiba Inu Price Forecast

The Shiba Inu price forecast will depend on certain trigger points. Token burns, Shibarium ecosystem updates, major partnership announcements, or meme-coin sector rotations renewing interest in SHIB.

Weak on-chain flows; large token unlocks, lack of development progress; macro risk-off; and rotation into newer meme coins could siphon investor attention.

Technical indicators also play a role. $SHIB is testing its support boundaries and is in a descending channel; for the price to improve, a breakout above key resistance of $0.000012 is needed. 
In essence, the forecast for $SHIB is a waiting game; movement will follow action, not hope.

Conclusion

The current Shiba Inu price forecast is quiet before a possible move. With low transaction flows, consolidation near long-term support and divergent analyst views, $SHIB is at a crossroads.

While some forecasts project 15% upside, a meaningful move to $0.000017 or more requires catalysts. Failure to hold support could send the price lower. The next few weeks will decide which way $SHIB goes.

Glossary

Exchange net-flows: The net amount of tokens moving into or out of exchanges.

Token-burn: The amount of tokens removed from circulation; higher burn means more scarcity.

Descending channel: A technical pattern where price moves between two parallel lines.

Catalyst: A big event (e.g., protocol upgrade, ETF filing, major partnership); that can change the price trajectory.

Meme-coin rotation: The flow of money from one meme coin to another.

Frequently Asked Questions About Shiba Inu Price Forecast

What’s the projected bottom line for Shiba Inu in this year-end 2025 forecast?

Analysts think it’ll likely be anywhere from around $0.000011 to as high as $0.000017; all depending on if anything significant comes along to give it a boost.

Why’s the Shiba Inu forecast looking muted even with the burning going on?

The burn rates are going up but the overall token flow is still stagnant; without enough momentum, forecast remains constrained.

What level should investors keep an eye out for in the Shiba Inu forecast?

The level around $0.00000850 to $0.00000950 is the make or break; if it falls below; there could be decline.

Can Shiba Inu can have another wild meme coin spikes as seen in the past?

It’s not entirely impossible but it seems unlikely at the moment, models are predicting limited upside unless major catalysts emerge.


Read More: Shiba Inu Price Forecast: 94 Billion SHIB Moved in 24 Hours as Market Stands Still">Shiba Inu Price Forecast: 94 Billion SHIB Moved in 24 Hours as Market Stands Still

Shiba Inu Price Forecast 94 Billion SHIB Moved in 24 Hours as Market Stands Still

Why Galaxy Digital Lowers Bitcoin Price Forecast to $120,000 for End of 2025

This article was first published on The Bit Journal.

Investment firm Galaxy Digital has updated its Bitcoin price forecast for the end of 2025; lowering its target to $120,000 from prior estimates.

The firm says holding the $100,000 level is crucial to keep the bull trend intact. This comes amid institutional flows, whale distributions and the start of what Galaxy calls a “maturity era” for the crypto market.

What Galaxy’s Updated Bitcoin Price Forecast Means

Galaxy Digital’s head of research, Alex Thorn, announced the change to the Bitcoin price forecast to $120,000 in a recent note to clients.

The firm cited several reasons: large whale coin sales, capital rotation into other narratives such as AI and gold, reduced volatility due to passive flows and structural changes in the ecosystem.

Galaxy described this as the start of a “maturity era” for Bitcoin; a time where the asset’s behavior is less driven by price shocks and more by institutional absorption and integration.

“If Bitcoin can maintain the $100,000 level, the structural integrity of the nearly three-year bull market will be preserved, though the pace of future gains may slow,” Thorn wrote.

By setting the new target at $120K, Galaxy is toning down earlier, more aggressive forecasts of like $185K while still being bullish long term. The Bitcoin price forecast update shows how the market is evolving institutional expectations.

Factors Driving Galaxy’s Bitcoin Price Forecast

Several factors are driving Galaxy’s updated Bitcoin price forecast. The first is whale distribution. Galaxy noted that around 400,000 – 470,000 BTC were moved or sold in large blocks in recent months, which has created resistance at key levels.

Another factor is institutional flow dynamics; passive flows into spot Bitcoin ETFs and large asset-manager participation have changed the way traders participate in Bitcoin markets, reduced volatility and changed liquidity profiles.

The flood of interest in other narratives like AI and gold have also diverted some capital, according to the firm.

Technical support is also a component of the Bitcoin price forecast. Holding the $100,000 level is now seen as a structural support. If that fails, the bull trend could get much weaker.

The firm also pointed to a flash crash of $20 billion in liquidations in October 2025 which “materially damaged” the bull trend.

All these factors combined; form the basis of Galaxy’s updated Bitcoin price forecast; a bullish view but calibrated to the new market mechanics.

How This Forecast Compares to Other Experts

While Galaxy’s Bitcoin price forecast is now at $120,000, other experts have different views. Some are still targeting higher year end levels, citing institutional ramp up and macro tailwinds. The firm Bitwise also described the current consolidation as a “quiet IPO moment”, implying more upside once the market wakes up.

Standard Chartered analyst Geoffrey Kendrick said earlier that Bitcoin could drop below $100,000 before continuing higher and he’s projecting $200,000+ later in the cycle.

What stands out is the consensus around a certain point in the Bitcoin price forecast; holding $100,000 is central to almost every bullish scenario and many firms are adjusting expectations to reflect slower moving structural growth rather than rapid explosive gains.

Expert / Firm Forecast for Bitcoin end 2025 Notes 
Galaxy Digital  $120,000 Revised down from a prior $185K, citing “whale distribution, non-BTC investments… entering a maturity era.” 
CoinCodex  $104,545 to $143,700 Range projection for 2025, based on technical-historical modelling. 
Traders Union analytics team Average near $102,884 Statistical model projecting end-2025 value around this level.


What the Updated Bitcoin Price Forecast Means for the Market

The new price forecast has several implications for participants and the crypto ecosystem. For institutional investors, the new target means a shift to structural consolidation rather than speculation.

For retail and derivatives markets, the focus on $100K support may trigger more attention on that level as a risk management point.

For the ecosystem as a whole, the forecast means Bitcoin’s next phase may be integration, infrastructure and adoption rather than pure price momentum.

From a valuation standpoint, markets may need to adjust. A $120K target by year end 2025 is bullish relative to current levels but conservative relative to prior peaks above $126K earlier in the year. The price forecast is thus tempered optimism; bullish but reflective of the changing dynamics.

Finally, the forecast highlights the importance of macro regulatory factors. ETF flows, institutional adoption, regulatory clarity and support frameworks are the notable levers that will influence the path implicit in Galaxy’s forecast.

Conclusion

Galaxy Digital’s new Bitcoin price forecast to $120,000 for 2025 means the market is recalibrating. While they remain bullish long term, they acknowledge the next phase of growth will be slower and more structural than previous cycles.

Holding $100,000 is the important. For investors and participants, the new Bitcoin price forecast means the market might see less wild swings, but more institutional moves and a shift from pure momentum to infrastructure and adoption.

Glossary

Spot ETF flows: Capital moving into or out of exchange-traded funds; that track the basic cryptocurrency.

Flash crash: A sudden; sharp price drop over a short period; often triggered by liquidations; algorithmic trading or systemic stress

Maturity era: A phase in the crypto market where volatility is reduced; institutions are more involved and it’s more structural than speculative.

Support level: A price level where an asset tends to find buying interest and prevent further price drops.

Frequently Asked Questions About Bitcoin Price Forecast

What’s Galaxy Digital’s new target for Bitcoin by the end of 2025?

Galaxy Digital has revised its Bitcoin price forecast to $120,000; by end-2025.

Why did Galaxy lower its Bitcoin forecast?

The firm cited conditions including whale distributions, rotation of capital into themes like AI and gold, passive flows via ETFs and a flash crash event; all of which prompted a re-calibration.

Why is $100,000 the critical level in the forecast?

Galaxy says holding above $100,000 is needed to preserve the structural trend; a breakdown could kill the forecast.

Is Galaxy still bullish on Bitcoin despite the lower target?

Yes. The firm still believes the long-term structural case for Bitcoin is intact; even if the near-term target is lower.

Read More: Why Galaxy Digital Lowers Bitcoin Price Forecast to $120,000 for End of 2025">Why Galaxy Digital Lowers Bitcoin Price Forecast to $120,000 for End of 2025

Why Galaxy Digital Lowers Bitcoin Price Forecast to $120,000 for End of 2025

How Blockchain Metaverse Innovation Is Transforming Digital Life With NFTs and DAOs

This article was first published on The Bit Journal.

The blockchain metaverse innovation era is now in full swing. Companies are fusing the immersive virtual universe with decentralized technologies; thus, innovation in ownership models, digital assets that are interoperable, and real-time global economies are being created.

Recent statistics predict that the worldwide metaverse market will increase from nearly $102 billion in 2024 to more than $6.24 trillion by 2035; a 45% CAGR with blockchain infrastructure at the heart of it.

What is Blockchain Metaverse Innovation

Blockchain metaverse innovation is the intersection of decentralized ledger technologies with immersive virtual environments to deliver new experiences around ownership, identity, economy and governance.

Traditional metaverse platforms were closed ecosystems but blockchain brings open standards, verifiable digital asset ownership (via NFTs), interoperable economies and transparent governance; all of which create new value models in virtual worlds.

Research shows blockchain enables metaverse platforms to support secure digital twins, verified identities and transfer of assets across environments.

Use-Cases: How Blockchain Enables the Metaverse

Digital Ownership and NFTs: One of the most visible forms of blockchain metaverse innovation is digital ownership. Non-fungible tokens (NFTs) let users truly own virtual land, avatars, art and items in metaverse platforms, with provenance and interoperability.

A recent report says: “non-fungible tokens are re-defining ownership in virtual spaces, enabling play-to-earn, user-driven markets and transferable assets” in the metaverse.

Interoperable Virtual Economies: Blockchain supports token-based economies in virtual worlds. Users can earn, trade or stake tokens across platforms. According to market data; blockchain solutions for metaverse economies is expected to reach around $180 billion by 2030.

Without blockchain; digital items are locked in walled gardens. Blockchain metaverse innovation breaks that barrier.

Identity; Governance and DAO-Powered Worlds: In metaverse environments; identity and governance matter. Blockchain provides self-sovereign digital identity; and transparent governance via DAOs (decentralized autonomous organizations).

Users can vote on virtual world rules, participate in economy-design decisions and carry identity/asset across chains. This is at the heart of full-fledged blockchain metaverse innovation.

Virtual Real Estate, Digital Twins and Industry Applications: Beyond social gaming; blockchain metaverse innovation goes into enterprise. Virtual real-estate and digital twins (mirror of real-world assets) use blockchain to own, monetize and manage rights. Industrial metaverse scenarios need blockchain’s auditability and traceability.

Blockchain Features and Their Role in Metaverse Innovation

Feature Role in Metaverse Innovation Example / Significance
Decentralized Ledger Enables asset ownership, provenance, open economies NFT land ownership across chains
Smart Contracts Automates rules, governance, trading of virtual assets DAO-governed metaverse worlds
Cross-Chain Interoperability Ensures tokens/avatars move across platforms Virtual items transferable between metaverses
Token Economics Incentivizes user activity, staking, creator rewards Play-to-earn models with tokens backed by proof
Digital Identity Self-sovereign identity and avatars linked to assets Blockchain-based avatars carrying value across worlds

Expert Analysis: Current Trends and Findings

According to sources; Blockchain is the foundation of trust that takes the metaverse from closed toy-worlds to open, interoperable economies. Without it, virtual assets are powerless and siloed.

Recent research supports this. A 2024 research on sustainable metaverse innovation said blockchain enables decentralized ownership; transparent governance and trust in virtual worlds; and listed interoperability; scalability and governance design as key challenges.

Another systematic review cited security and privacy as major barriers to blockchains powering immersive worlds. In practice, industry players are scaling up. Enterprise virtual training, digital twins and virtual event platforms are moving to blockchain-backed models because of auditability and asset portability.

Companies building industrial metaverse systems say blockchain metaverse innovation is not about VR gear alone, but about connected, trusted digital layers underneath virtual experiences.

So organizations looking to leverage blockchain metaverse innovation; need to prioritize modularity for scale; governance frameworks for decentralization and standard protocols for interoperability.

Provenance; digital identity and token economics become foundation blocks rather than nice-to-haves.

Opportunities and Innovations Emerging

Blockchain metaverse innovation allows creators to monetize virtual goods like never before. In 2025; there’s growing support for creator royalties and cross-platform trades.

Companies are using blockchain to manage digital twins; supply-chain VR/AR training and real-world asset simulation. Industrial metaverse adoption is accelerating.

Blockchain breaks down platform siloes. Interoperable virtual worlds mean users carry identity, assets and value across games and environments.

Blockchain metaverse innovation enables physical assets to be turned into tradable digital twins, virtual land rights, tokenized education/training metaverses.

DAOs and on-chain voting let metaverse users shape their world. Ownership; rules and economy are no longer top-down but community-driven.

Challenges for Blockchain in the Metaverse

Metaverse environments require high throughput and low latency. Blockchain networks can’t support large-scale real-time VR/AR interactions yet.

Virtual worlds need to agree on asset formats, identity systems and protocols. Blockchain metaverse innovation is hindered when ecosystems are fragmented.

At the heart of blockchain metaverse innovation is safety and trust. Research shows high risk of identity theft; data leaks and governance failure in decentralized virtual spaces.

Many metaverse projects failed because users need seamless UX; not just tech. Blockchain integration must be invisible and performant for mass adoption.

Designing incentive models requires nuance; bad models can lead to speculative bubbles, value leakage or user drop-off.

Virtual asset ownership, digital land rights and cross-border token economies create jurisdictional issues. Without clarity; blockchain metaverse innovation could stall.

Conclusion: What Does the Future Look Like?

As blockchain metaverse innovation advances; several shifts can be expected:

Virtual economies moving from novelty to core infrastructure. Blockchain will power item ownership, avatar identity, reputation systems and value flows.

Virtual worlds are expected to connect to real-world systems (finance, education, work). Blockchain ensures trust, composability and portability of assets between digital and physical worlds.

Standards and interoperability frameworks will be more defined; blockchain metaverse innovation will move from isolated experiments to foundational digital architecture.

While there’s opportunity in creator economies, tokenized assets, industrial metaverse and governance models, there’s still work to be done on scalability, standards, security and regulatory clarity.

Glossary

Metaverse: a virtual zone where all users can meet; it consists of augmented reality; virtual reality, three-dimensional digital worlds; and everlasting online economies.

Blockchain: a method of recording transactions in a distributed manner across multiple computers; thus making it impossible to retroactively change the records.

NFT (Non-Fungible Token): a unique digital asset that exists on a blockchain and signifies the ownership of a particular item or a piece of content.

DAO (Decentralized Autonomous Organization): an entity that operates according to the rules encoded in smart contracts; typically, such entities have voting power over the policy of the virtual world.

Tokenomics: The overall economics and incentives linked with a certain token; how its supply; allocation, staking and usage, are determined.

Frequently asked Questions About Blockchain Metaverse Innovation

What is the role of blockchain in the metaverse universe?

Blockchain provides the ground for real ownership of online assets (through NFTs/tokens); and governing power that is completely transparent (through smart contracts/DAOs), and it also opens the way for interoperable economies so that the metaverse can get rid of isolated interactions.

What is the size of the metaverse market and how does blockchain play a role in it?

According to market analysts, the worldwide metaverse will be around $6.24 trillion by 2035; and the infrastructure based on blockchain and virtual asset frameworks are going to be among the largest contributors to it.

What are the largest obstacles for blockchain technology in digital worlds?

Scalability (the combination of the real-time 3D and blockchain); lack of a common standard for interoperability between different platforms, security (identities and assets being stolen); lack of clarity around the regulation of digital assets.

Can virtual items in the metaverse really have real value?

Yes; blockchain allows virtual items to be owned; traded or transferred across worlds so they have enduring value not tied to one platform. That’s what blockchain metaverse innovation is all about.

Read More: How Blockchain Metaverse Innovation Is Transforming Digital Life With NFTs and DAOs">How Blockchain Metaverse Innovation Is Transforming Digital Life With NFTs and DAOs

How Blockchain Metaverse Innovation Is Transforming Digital Life With NFTs and DAOs

Peter Schiff’s Bitcoin Bubble Warning: Why He Says the Rally Isn’t Sustainable

This article was first published by The Bit Journal.

Economist and gold advocate Peter Schiff has made his strongest case yet for Bitcoin being in a “crypto bubble.” He says the recent rallies are not driven by organic investor demand or fundamental innovation but by institutional support from Wall Street and favorable policy signals from Washington.

In a recent interview, he said the momentum is artificial and warned without sustained backing the market could reverse.

The Basis for Peter Schiff Bitcoin Bubble Warning

Peter Schiff Bitcoin Bubble Warnings come from three main points. He says the recent move up in Bitcoin is not from broad retail or institutional demand based on adoption but propped by governments and financial institutions.

According to him;

“The very institutions Bitcoin was designed to disrupt are now the ones propping it up.”

He also claims the narrative of Bitcoin as “digital gold” or an inflation hedge is debunked by its behavior during recent macro stress. He says:

“How can anyone consider Bitcoin to be a digital version of gold?” after noting that during global unrest, gold went up and Bitcoin went down.

He also added that once the institutional backing or favorable policy winds fade, Bitcoin’s price could collapse. He warns the current support is more fragile than it seems and speculation is driving the rally.

Together, these form the core of Peter Schiff Bitcoin bubble warning that the market may be more built on shifting narratives and supporting actors than on fundamentals.

Why the Peter Schiff Bitcoin Bubble Warning Resonates

While Schiff criticizes Bitcoin’s foundation, the market he references has seen big changes. In 2025, Bitcoin and other major cryptos have seen renewed institutional interest, regulatory clarity in some jurisdictions and broader adoption narrative momentum.

The recent ETF approvals and growing exposure by mainstream asset managers means deeper integration.

At the same time, volatility and leverage are high in crypto markets and some see valuations getting stretched. Peter Schiff Bitcoin bubble warning taps into that; the juxtaposition of mainstream incorporation and structural weaknesses.

His commentary comes as the community debates whether digital assets reflect real-world utility or speculation.

In short, Schiff’s view adds to the conversation by saying if the environment changes, the bubble warning he issues may become reality.

The Crypto Community’s Response to the Bubble Claim

The crypto community’s response to the bubble claim has been varied. Many say the narrative of mainstream adoption, institutional investment and blockchain innovation proves the bubble is false. Some point to on-chain growth, DeFi and tokenization as evidence of real use case development.

On the other hand; voices aligned with Schiff say the fundamentals are weak. Limited global payments adoption, concentrated ownership and high correlation with risk assets rather than safe havens. Some have called him out for being wrong before but his latest comments just add to the skepticism about the crypto market.

The differing opinions illustrate the debate between optimism about digital asset evolution and caution about speculation.

Conclusion

Schiff’s crypto bubble warning has several implications for investors, regulators and the industry. For investors it’s a reminder of downside risk. If the narrative he highlights breaks,

then valuations could correct sharply. For regulators it’s a reminder to assess if the crypto markets are showing speculative excess and if protective measures are needed.

For the industry; either crypto shows real world value or it may get squeezed if the bubble label sticks.

While Peter Schiff Bitcoin bubble warning tone is dire; it overlaps with lessons on market structure. High volatility, high leverage, institutional concentration and narrative driven flows make markets more vulnerable.

Glossary

Bubble: A rapid price increase of cryptocurrencies driven by speculation rather than fundamentals that will correct sharply.

Institutional support: Large financial institutions (banks, asset managers); investing or providing infrastructure for cryptocurrencies and derivatives.

Leverage: Using borrowed funds to increase exposure to an asset.

Intrinsic value: The fundamental value of an asset based on use; utility or cash flows rather than market perception or speculation.

Safe-haven asset: An investment that will hold or increase in value during market stress

Frequently Asked Questions About Peter Schiff Bitcoin Bubble Warning

Why is Peter Schiff saying Bitcoin is a bubble now?

He thinks the recent rallies are not organic or practical but institutional and policy driven so it’s speculative and unstable.

Did Schiff say Bitcoin will go to zero?

In his recent comments he said Bitcoin is a bubble and could “go to zero” if the support structure goes away.

Are others in crypto taking Schiff’s warning seriously?

Some investors and analysts agree there are structural risks but many think adoption and institutional flows reduce the chance of a full collapse.

What would validate or invalidate Schiff’s crypto bubble warning?

Validation would be a sharp loss of institutional flows, collapse of derivatives or the “digital gold” narrative unravels. Invalidation would be sustained growth of real world utility, increased transaction usage and diversified ownership.

Read More: Peter Schiff’s Bitcoin Bubble Warning: Why He Says the Rally Isn’t Sustainable">Peter Schiff’s Bitcoin Bubble Warning: Why He Says the Rally Isn’t Sustainable

Peter Schiff’s Bitcoin Bubble Warning Why He Says the Rally Isn’t Sustainable

Crypto Market Today: Key Moves in BTC, ETH, XRP, BNB

This article was first published on The Bit Journal.

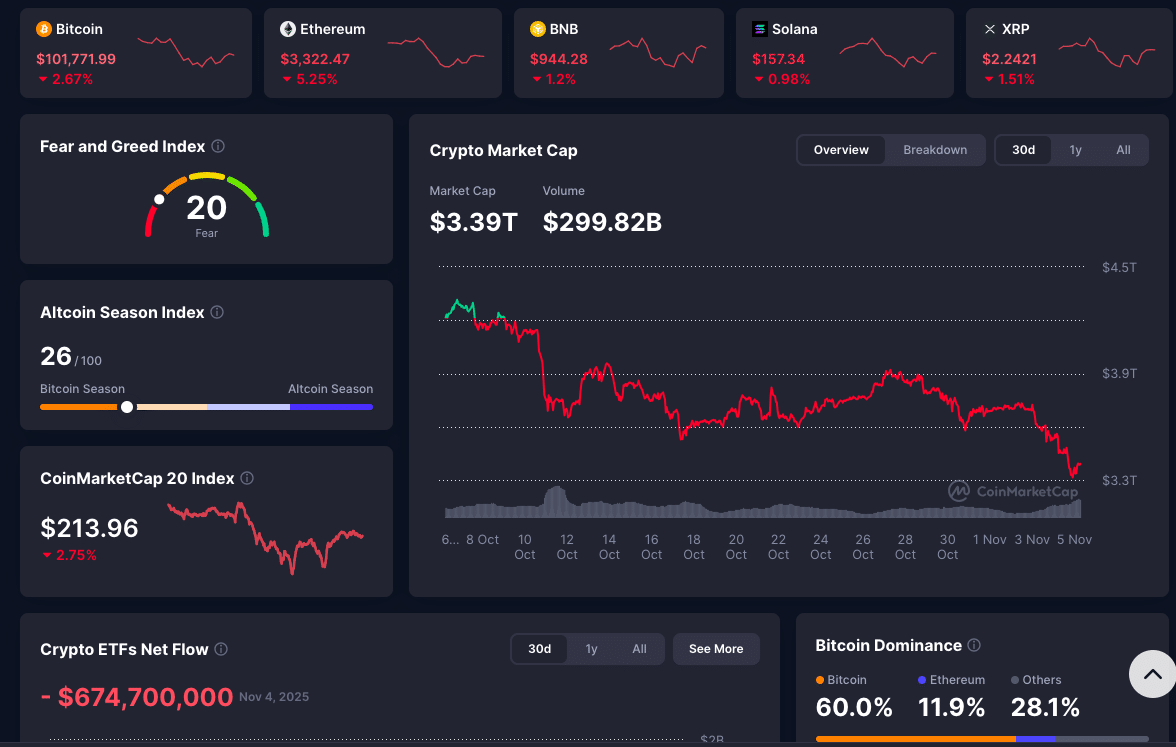
The crypto market has experienced another drastic wave of forced liquidation events. According to real-time data, over $2.1 billion in futures positions were liquidated in a single 24-hour window as Bitcoin dropped below $100,000 before retracing back up. The overall crypto market cap also fell 4.5% to roughly $3.39 trillion during the same interval.

What Triggered the Crypto Market Liquidation

The crypto market liquidation was caused by a sharp drop in major crypto asset prices, especially Bitcoin. The market saw Bitcoin trade below $100,000 for the first time since June.

According to CoinGlass data, liquidations rose 88% in one day to $2.1 billion. U.S. listed crypto ETFs also added to the stress. Spot BTC ETFs saw $577 million in redemptions and spot ETH ETFs $219 million.

A combination of high leverage, thin liquidity, big price drops, and institutional outflows triggered this crypto market liquidation. As one analyst put it, liquidations across the entire network in 24 hours exceeded $2 billion, longs lost $1.63 billion and shorts $400 million.

This was not an isolated event as it spread across derivative products, ETFs and spot markets.

Crypto Market Liquidation: Which Assets Were Affected and Why

The crypto market liquidation was not uniform across all assets. As of press time, Bitcoin was $101,771 (down 2.67%), Ethereum $3,322 (down 5.25%), XRP $2.24 (down 1.52%) and BNB $944 (down 1.2%)

Crypto Market Liquidation Surge: $2 B Wiped in Hours as BTC Dips Below $100K
Crypto Market Liquidation 

Sources reported leveraged longs being forced to close due to falling prices and a lack of margin, which accelerated the crypto market liquidation.

ETFs also amplified the effect. Bitcoin ETFs saw $1.34 billion in redemptions over 4 days. Institutional liquidity reduction added to the pressure.

The Fear and Greed Index was in “extreme fear” territory. Investors were very bearish during the crypto market liquidation. 

In short, the crypto market liquidation was broad, fast, and caused by structural stress points: leverage, sentiment, and institutional capital flows.

Derivatives, Leverage, and Liquidation

A notable part of the crypto market liquidation is the derivatives space, where futures, perpetuals and leveraged positions amplify moves.

As leveraged longs lose value, margin calls trigger automatic selling of positions, which in turn pushes prices further down in a cascade.  Reports showed about $1.2 billion in BTC and ETH longs got wiped out during this event.

CoinGlass data shows open interest across futures contracts dropped about 6% to $141 billion in the 24 hour window. The decline in open interest is both forced closes and reduced new positioning.

Another layer is the interplay with ETF flows. With spot ETFs seeing outflows, institutional players may reduce exposure or hedge positions via derivatives, adding to the selling pressure. Leverage is a force multiplier in the crypto market liquidation event.

Institutional Flows, ETFs and What They Did

Data from tracking sources shows spot Bitcoin ETFs saw $946 million in outflows for the week ended early November, while Solana funds saw $421 million in inflows.
These flows suggest several things: big funds reducing exposure to Bitcoin due to macro uncertainty; rotation of capital to other crypto segments (e.g. Solana), reduced liquidity in flagship crypto assets which makes them more vulnerable during stress periods.

Similarly, the alignment of macro factors (e.g. strong US labor data, Treasury yields rising, Fed rate cut expectations retreating) killed risk appetite.

Experts noted trading volumes went up while sentiment was down amid ETF redemptions. 

Projected Crypto Market Scenarios For the Coming Weeks

Asset Bull Case Base Case Bear Case
Bitcoin (BTC) Accumulation around $98K-$102; if ETF flows resume and Fed pauses, could retest $115K. Consolidates $95K-$105K as open interest stabilizes; and macro clarity awaited. ETF redemptions and weak risk appetite could send BTC to $92K support.
Ethereum (ETH) Rising gas fees and staking deposits; recovery to $3,900 if DeFi confidence builds. Range-bound $3,200-$3,500 amid ETF outflows; yields still attract institutions. Below $3,200; ETH could slide to $3,000; hurting DeFi sentiment.
XRP (XRP) Whale accumulation at $2.30; above $2.55 targets $2.80 with ETF momentum. Sideways $2.20-$2.50; stable throughput despite low volume. Drop below $2.20 risks $2.00 if Ripple ETF narrative weakens.
BNB (BNB) Token burns and ecosystem upgrades could lift price to $1,050. Consolidates $900-$970 as funding rates normalize. Low liquidity and soft altcoin demand may drag to $850.

Conclusion

This liquidation has several implications for the short term. The breaking of support levels, especially Bitcoin’s drop below $100,000 raises questions about how far the correction will go. Some technical analysts are warning of further downside to $93,000 if support doesn’t hold.

The reduction in open interest and high leverage may mean a period of consolidation as the market digests this liquidation. Some see this as a reset”rather than full blown capitulation. 

Historical seasonal behavior says November is one of the better months for crypto rebounds. But seasonal tailwinds can’t override structural stress alone.

Traders and market watchers need to observe the liquidity, open interest, sentiment indicators and macro signals to see if the market finds a floor or extends the decline.

Glossary

Liquidation: forced closure of a leveraged position when margin or collateral falls below required levels; often triggering or accelerating price drops.

Open interest: total value of outstanding derivative contracts (futures or options) that have not been settled; a decrease in open interest means less participation or deleveraging.

ETF (Exchange-Traded Fund): a regulated investment fund that tracks the value of an asset or index, allowing institutional and retail investors to get exposure to that asset through a traditional investment vehicle.

Leverage: borrowing or margin usage to amplify exposure to an asset; more leverage means more gains but also more losses and liquidation risk.

Support level: price range where buying pressure historically emerges to prevent further drops; breaking below support means accelerated drops.

Liquidity: ease to buy or sell at stable prices; low liquidity means more vulnerability to big moves and forced liquidations.

Frequently Asked Questions About Latest Crypto Market Liquidations

What caused the latest crypto market liquidation?

The liquidation was caused by a big drop in major crypto prices (Bitcoin below $100,000; record liquidations in futures markets and continuous ETF outflows, meaning forced selling met weaker underlying demand.

Does this liquidation mean the crypto bull run is over?

Not necessarily. Some see this as a moment of deleveraging and taking profit rather than the end of the trend. Whether it’s a deeper drop depends on liquidity, support levels and institutional flows.

Which asset classes were hit the most?

Bitcoin and Ethereum were the hardest hit but many other assets dropped sharply. The derivatives space (futures, perpetuals) and institutional vehicles (ETFs) were the epicenter.

What should market watchers be watching now?

Key metrics are open interest trends, ETF inflows/outflows, support levels for major assets, volume and liquidity conditions and macro data like interest rates and risk-asset sentiment.


Read More: Crypto Market Today: Key Moves in BTC, ETH, XRP, BNB">Crypto Market Today: Key Moves in BTC, ETH, XRP, BNB

Crypto Market Today: Key Moves in BTC, ETH, XRP, BNB

XRP on the Edge as Analysts Split on $3.00 or $2.00 Targets

This article was first published on The Bit Journal.

Latest market updates show $XRP is trading around a critical decision point. According to recent analysis, $XRP is supposedly due for a major breakout zone, while some analysts say failure to hold support could lead to a deeper drop.

With regulatory clarity improving, institutional interest growing, and on-chain accumulation rising, but recent crypto market liquidations stalling breakout, the question has never been more urgent: is the next move up or down?

Price Levels, Accumulation and Technical Set-Up

Recent analysis notes $XRP is still some percent below a key breakout zone, which is around $2.22 to $2.54, where on-chain supply clusters show heavy accumulation. Though $XRP dropped about 7% due to recent market winds, sources say,  yet trading volume nearly doubled recently, interpreted as whales preparing for the next move.

Sources report that $XRP is now in a tightening triangle.

Meanwhile, Changelly’s price-forecast shows a predicted average price of about $2.53 for November, with a range up to $2.71, based on market conditions.

In short; $XRP is in a consolidation zone, accumulation is ready; but the breakout or breakdown is also imminent. 

Expert Forecasts: Latest Predictions for XRP Price Prediction

Here are some of the most recent forecasts for the XRP price prediction:

Source Forecast Period Prediction
CoinCodex November 2025 Avg $2.43; range $2.29-$2.65 
Crypto.News Mid-term  Target up to $3.30 if breakout above $2.70 
Finder panel  End 2025 $2.80 average
Benzinga 2025 Range $2.05 to $5.81 

Depending on adoption and conditions 

These forecasts show a clustered base expectation around the $2.30-$2.70 range, with bullish upside hinging on breakout events. The XRP price prediction is therefore conditional, unless key catalysts arrive, the more conservative outcomes could dominate.

Bull, Base and Bear Cases for XRP Price Prediction

In the bull scenario for XRP price prediction, $XRP clears the major resistance zone around $2.70 to $2.80 with big volume and institutional backing via ETF flows or higher payments/institutional adoption.

As multiple analyses say; a breakout above $2.70 could target $3.00 to $3.30 in the near term. Continued accumulation by wallets, improved sentiment and regulatory clarity would amplify this path.

The base case for XRP price prediction sees $XRP holding the consolidation zone between $2.30 and $2.60. Volume is flat or moderate, regulatory progress is incremental and no major breakout happens.

In this scenario; $XRP may drift to the upper bound of this range ($2.60) by year-end, maybe $3.00 if momentum picks up but without acceleration.

For the bear case in XRP price prediction, failure to reclaim key demand levels (e.g. the $2.30 floor) combined with weak volume or external negative catalysts like macro pull-back, regulatory setbacks could push $XRP down to the $2.00 to $2.20 range or lower.

Some technical analysis recently warned of downside to $2.00 and even $1.25 if breakdown accelerates.

Hence, analysts say XRP price prediction depends on which scenario plays out, and the market is at a fork.

Catalysts and Drivers Behind XRP Price Prediction

Heavy accumulation between $2.52-$2.54 means these levels could be a demand zone. Despite the recent dip, volume almost doubled. Technicals show a tightening triangle with a breakout zone at $2.70.
Clarity on the regulatory environment e.g. XRP ETFs; and institutional interest are big upside catalysts. Experts believe if volume and institutional flows increase; a breakout above $2.70 could target $3.00-$3.30

XRP is also influenced by broader crypto-market dynamics like Bitcoin; risk appetite in markets, macro policy e.g. rate decisions).

As mentioned, $2.30-$2.35 must hold for bullish scenarios; as $2.70-$2.80 is the big hurdle. If $XRP can get above this, the XRP price prediction looks bullish.

Conclusion: What to Watch

A sustained move above $2.70 with high volume and that could flip the X$RP price prediction bullish. If $2.30-$2.35 fails, the bear case becomes more likely and the XRP price prediction will drop.

Rising volume, large wallet accumulation or institutional product announcements are essential for bullish outcomes.

Any positive regulatory news could re-rate XRP and the XRP price prediction.

If the broader crypto market strengthens (e.g. Bitcoin breakout), XRP will benefit; if crypto risk-off, $XRP would also take hits.

The expert forecasts cluster around a base channel of $2.30-$2.60 and upside to $$3.00-$3.30 if the catalysts happen. If support fails and volume is low, $XRP could go to $2.00 or lower. The next few weeks will be crucial to see if the $XRP price prediction will go bullish or back into consolidation or down.

Glossary

Breakout zone: A price area above resistance’ where a big move can happen if broken with conviction.

Support/Resistance levels: Price ranges where buying (support) or selling (resistance) tends to happen; which affects future price action.

On-chain metrics: Blockchain derived data such as accumulation clusters; wallet behavior and transaction volume to gauge network sentiment.

Institutional flows: Capital from large, professional investors (e.g. funds; institutions) entering an asset; often used as a signal of adoption and credibility.

Accumulation zone: A price range where a lot of tokens are sitting or being accumulated; indicating stronger buying interest.

Frequently Asked Questions About XRP Price Prediction

What is the support in the XRP price prediction?

The key support is roughly $2.30 to $2.35 which many think is the launchpad for any bullish move.

What would validate the bullish scenario in the XRP price prediction?

A sustained breakout above $2.70 with increasing volume and institutional participation would validate the bullish case.

What is the immediate downside risk in the XRP price prediction?

If XRP fails to hold support and drops below $2.30 it could go to $2.00 depending on the market.

Are there long term growth targets in the XRP price prediction?

Some think targets up to $3.00-$3.30 in the near term and higher in a full breakout scenario if regulatory and institutional catalysts arrive.

Read More: XRP on the Edge as Analysts Split on $3.00 or $2.00 Targets">XRP on the Edge as Analysts Split on $3.00 or $2.00 Targets

XRP on the Edge as Analysts Split on $3.00 or $2.00 Targets

The Future of Work in Web3: Opportunities, Challenges, and What Comes Next

This article was first published on The Bit Journal.

The web is on the brink of a global shift, a transition where decentralization, token-based incentives, remote work and blockchain infrastructure are redefining how millions of people work, collaborate and build their businesses.

A 2025 report from Web3.Career suggests that job postings in Web3 have shot up to over 80,000 across over 15,900 different companies ; a proof that this isn’t just a niche hobby anymore, it’s a rapidly growing professional domain.

However, with that growth comes challenges like coordinating remote teams across time zones, dealing with uncertain regulations, filling skills gaps and figuring out governance in these new decentralized organizations.

What Exactly is the Future of Work in Web3?

When the future of work in Web3 is being discussed, it involves how employment models, job roles, organization structures and labour market frameworks are adapting to the decentralized web; a domain that’s all about blockchain protocols, token economies, DAOs and remote, borderless collaboration.

It’s a world that’s very different from the traditional work where a single central entity controls hiring, pay and management.

In Web3, things are different, it entails self-sovereign identities, new incentive mechanisms (like token compensation) and organization models that may not have traditional hierarchies.

The shift affects both technical roles like smart contract engineers, blockchain architects and non-technical roles like community leads, token economists, remote governance specialists; and all sorts of other areas in between.

Web3 Workforce Trends and Job Market Data – What’s Happening Right Now

The labour market is already starting to reflect this transition to the future of work in Web3. Here are some key metrics from 2025:

According to Web3.Career Intelligence Report, more than 80 000 job postings from 15 900+ companies were logged, marking a growth phase in Web3 careers. 

The Metarficial report found that 53.39% of Web3 jobs are fully remote, while 39.45% of postings require no coding skills.

RecruitBlock reports that job postings for crypto-related roles increased significantly, driven by blockchain, DeFi, hybrid roles, and AI/Web3 intersections.

The CryptoRecruiters report indicates Web3 job openings surged nearly 300% from 2023 to 2025; highlighting a rapid expansion in demand.

Metric Data (2025)
Percentage of Web3 jobs fully remote 53.39% 
Non-technical Web3 roles ( no coding) 39.45% 
Approx. number of Web3 job postings 80 000+ across 15 900+ firms 
Growth in Web3 hiring since 2023 300% surge 


These numbers show the future of work in Web3 is not speculative; it’s happening now. Organizations are hiring, roles are diversifying beyond coding and work models are global.

Web3 Work Opportunities

Global and Remote Talent Access: More than half of Web3 jobs are fully remote so professionals anywhere in the world can participate. This means individuals in emerging markets can participate and companies can tap into a larger talent pool.

Token-Based Compensation and Incentives: A notable feature of Web3 work is compensation through tokens or equity-like mechanisms. A RiseWorks report projected that this 2025, 75% of Web3 organizations would offer tokenized compensation. This aligns incentives differently to salaried employment and supports long-term stakeholder alignment.

Non-Technical Roles: While developer roles are important, almost 40% of job postings require no coding. Community management, legal/compliance, token economics, partnerships and remote operations roles are in high demand.

Emerging Hybrid Models and Skill Convergence: Web3 asks professionals to combine technical and non-technical skills. For example, “Web3 Systems Thinkers” must understand blockchain infrastructure and coordination frameworks at the same time.

New Career Pathways and Micro-Roles: Micro-tasking, governance participation, DAO roles and contributor networks are emerging forms of work. This helps transcend traditional organizational hierarchies and offers fluid career paths.

Web3 Work Challenges

Skills Gap and Learning Curve:While roles beyond coding exist, many still require deep knowledge of blockchain protocols, crypto economics and decentralized governance. Experts’ research notes the difficulty organizations face when trying to integrate Web-based strategies due to technical complexity and regulatory ambiguity.

Remote Coordination and Operational Friction: Operating fully remote or distributed teams across time zones and different legal jurisdictions; can increase coordination overhead and reduce operational clarity. For many Web3 teams, flat hierarchies and asynchronous communication pose management challenges.

Regulatory and Legal Uncertainty: Token compensation, DAOs and cross-border payroll raise complex regulatory and tax questions. For workers in Web3; this uncertainty may affect contract status; benefits and long-term security. The intersection of emerging Web3 careers and regulatory frameworks is a major bottleneck.

Job Market Competition and Role Saturation: While hiring is increasing; competition is fierce. A report listed 10,000 applicants for 28 positions in certain Web3 subspecialties.

Governance, Trust and Contributor Incentives: Web3 work relies on contributors being motivated by tokens; reputation or community participation. Without clear governance and incentives; contributor burnout, misalignment or exploitative models can happen. Tokenized labour needs to be designed carefully to prevent value leakage.

Skills and Roles in Web3 Work

Role Type Key Skills / Requirements Why It Matters
Blockchain / Smart-Contract Engineer Solidity/Rust, auditing, protocol design Core infrastructure builder for Web3 systems
Token Economist / Crypto Strategist Tokenomics, modelling, incentive design Builds sustainable business models around decentralised value
Community / DAO Operations Lead Communication, governance workflows, tools Coordinates global contributors and aligns incentives
Compliance / On-Chain Legal Adviser Crypto regulation knowledge, KYC/AML frameworks Ensures organizations operate legally in global environments
UX/Interface Designer for dApps Decentralized UX, user flows, crypto-wallet design Bridges user adoption gap for complex Web3 tooling

Expert Analysis: Navigating the Web3 Career Path

According to Web3.Career Intelligence Report, 2025;

“Web3 has made significant strides in areas like hiring maturity, global opportunities and remote work structures, but whether we’ve entered a new phase of this work cycle is yet to be seen.” 

Organizations, from a practical standpoint, are going to have to figure out the future of work in Web3:

They’ll need to come up with clear ways to give contributors a stake; token incentives, reputation systems they like, rather than just rehashing old job titles.

They’ll need to focus on hiring hands with the right kinds of skills; that means network fluency, remote team experience and protocol literacy but not necessarily just being a great coder.

They’ll need to design frameworks that work with the Web3 way of doing things; asynchronous, borderless collaboration is just the way it is in Web3.

They’ll need to ensure transparency around governance and fairness so that who’s doing what and how tokens, roles and decision-making power are all aligned with making a long-term profit, can all be seen.

Overall, they’ll need to stay on top of regulatory changes by setting up compliant onboarding processes, paying workers properly and drawing up contributor contracts that take into account the evolving tax and securities laws.

In this light; the future of work in Web3 isn’t just about swapping out old jobs for new ones; it’s about completely redesigning the way value is created; shared out and coordinated.

And for professionals; success means being comfortable with the ambiguity, learning constantly and contributing in non-linear ways.

Conclusion

The Future of Work in Web3 goes way beyond just technology. It’s about reimagining how humans collaborate; create and earn in the digital space. As blockchain, AI and DAOs mature; they’re breaking down the old hierarchical structures and replacing them with more inclusive; merit-based systems.

Regulatory uncertainty; talent shortages and having uneven access to digital infrastructure are all still major obstacles to making Web3 workforces work.

Despite all this, the data shows that as more and more big companies and governments start experimenting with blockchain-based identity systems, payroll and ownership models, Web3 work structures are slowly but surely moving from the fringes into the mainstream.

So for professionals, the takeaway is clear; being good at smart contract development, AI-blockchain integration, token economics and decentralized governance will be needed for career growth over the next decade.

For businesses, using decentralized collaboration tools and transparent incentive systems is the essential to staying ahead in the coming “trustless economy”.

In short; the future of work in Web3 is already rolling out, one block at a time; one DAO at a time and one decentralized opportunity after another.

Glossary

Web3: next iteration of the internet built on blockchain; decentralization and token-based economics.

DAO (Decentralized Autonomous Organization): digital organization governed by token-holders through smart contracts; rather than a central management team.

Tokenomics: economic design of a token: supply, distribution; incentives and governance mechanisms.

Remote/Distributed Work: model where teams work from different geographical locations; rather than a fixed office.

Contributor Model: work structure where participants contribute tasks or value and are compensated via tokens; reputation or community governance rather than traditional salary alone.

Frequently Asked Questions About The Future of Work in Web3

What kind of jobs are there in Web3?

Web3 has technical roles (blockchain developers; smart-contract engineers); and non-technical positions (community managers, token economists, legal/compliance leads). Remote work and global hiring dominate the market.

Does one need to know how to code for Web3 jobs?

No. According to cohort data, around 39.45% of Web3 job postings require no coding skills, as contributor roles in community, operations and coordination are on the rise.

How does token-based compensation work in Web3?

Workers may receive tokens (equity-style) or incentives tied to protocol growth instead of fixed salary alone. Reports suggest up to 75% of Web3 organizations would have adopted tokenized compensation this 2025.

What are the biggest challenges for someone working in Web3?

Staying up to date with highly technical protocols, coordinating remote global teams across time zones, regulatory uncertainty and non-traditional career structures.

Read More: The Future of Work in Web3: Opportunities, Challenges, and What Comes Next">The Future of Work in Web3: Opportunities, Challenges, and What Comes Next

The Future of Work in Web3 Opportunities, Challenges, and What Comes Next

Solana Outpaces XRP in Network Activity: 2.5M Accounts vs 25K on XRPL

This article was first published on The Bit Journal.

The Solana Foundation has just initiated a public, data-driven debate with Ripple Labs on actual network usage. This blockchain activity debate revolves around which network, Solana (SOL) or XRP, is more active in real life?

According to recent reporting, Solana claims over 2.5 million daily active accounts vs 25,000 for XRPL, while transaction volumes and stablecoin transfers show similar huge differences.

Solana vs Ripple Challenge

The blockchain activity debate started when Vibhu (a Solana Foundation manager) publicly challenged Ripple execs to a live “facts-only” livestream on social platform X. He posted:

“You bring facts, I bring facts. Facts are important. Let the internet decide who wins.”

Solana vs Ripple Challenge

He followed up with the release of notable on-chain metrics that, in his view, showed a big performance gap between Solana and XRPL. Among the numbers: XRPL has had around 25,000 daily active accounts for the past three years, while Solana has over 2.5 million.

He also compared transaction volumes. XRPL does 1 to 1.5 million daily transactions, while Solana does around 100 million. In monthly stablecoin transfer volume; XRPL does $50-60 billion, Solana did nearly $2 trillion in October.

The Numbers: What the Data Says

In the blockchain activity debate, the numbers Solana’s team put out are stark. According to multiple sources:

Metric Solana (SOL) XRP Ledger (XRPL) Relative Difference
Daily Active Accounts 2.5 million 25,000 100× more on Solana
Daily Transactions 100 million 1-1.5 million 70-100× more on Solana
Monthly Stablecoin Transfer Volume $2 trillion (Oct 2025) $50-60 billion 30-40× more on Solana
Growth Trend (3 years) Rapid growth Flat / stagnant


In his comment, Vibhu anticipated potential objections about bot activity or wash trades:

“This can’t be substantiated with data and the data provided here for Solana excludes wash volume.” He also noted; “Given that both XRPL and Solana have low transaction fees, there’s no reason one would attract bots more than the other.” 

These numbers are the empirical foundation of the Solana vs Ripple blockchain activity debate, highlighting questions of engagement, growth and ecosystem vitality.

Why This Matters: Ecosystems

While the Solana vs Ripple blockchain activity debate looks like a competition, its deeper meaning is what network activity implies about adoption and utility. Stronger engagement metrics often correlate with ecosystem health; infrastructure usage; developer interest; third-party integrations and real-world flows.

In the Solana vs Ripple debate; for Solana; the numbers support its narrative of a fast-growing, developer-focused chain; open to DeFi, NFTs and high-throughput use cases.

For XRPL, the numbers are small and raise questions about whether the design (payments, institutional, tokenization) translates to large retail and on-chain usage.

Reports say Vibhu called XRPL’s traction “extremely mediocre, given the value of the network and time in market.”

From the perspective of investors, developers and institutional actors, this public metrics comparison could influence which networks get attention, build-out or partnerships.

The blockchain activity debate is a kind of reputational scoreboard; and in a crowded field of blockchain protocols, perception can drive momentum as much as fundamentals.

How the Ripple Community Responds

The XRPL/Ripple community has offered its own narrative and counterpoints. Some say XRPL is designed for payments and enterprise integrations, not mass-retail, high-volume use, so the numbers should be interpreted differently.

One comment says; “XRPL is one of the only blockchains where users can be their own bank.”

Sources argue that the XRPL ecosystem has focused on real-world asset tokenization, regulatory compliance and bank-grade infrastructure which may yield more value over time even if growth is slower. Solana is focusing on speed and volume.

Solana on the other hand stands rooted in speed and volume. The blockchain activity debate brings transparency to the comparison and forced both communities to show their metrics and purpose. 

This public data puts pressure on both ecosystems to back up their growth narratives beyond marketing and hype.

Conclusion

The Solana vs Ripple blockchain activity debate enters a new phase: the live, public debate proposed by Solana’s team adds stakes and visibility. The outcome will shape community narratives, developer mindsets and even investor sentiment. Questions to watch:

Will Ripple or XRPL execs accept and schedule the “facts-only” livestream? And will they bring comparable on-chain data?

How will both sides define “active accounts,” “transactions,” and “volume”?

Standardized metrics also matter and beyond the numbers, what will each network say about application types, user retention, wallet health and real-world flows?

The truth of the Solana vs Ripple debate will not just be on raw numbers, but how each network translates engagement into real world value.

Glossary

Active account: A wallet address on a blockchain that participates in at least one transaction within a defined time period; used as a proxy for user engagement.

Daily transactions: The total number of transactions processed on a blockchain network in one day; high volume may indicate broad utility or use cases.

Stablecoin transfer volume: The total value of transactions involving stablecoins on a network within a period; often used to assess payment and liquidity flows.

On-chain metrics: Quantitative data captured on blockchain networks (e.g.; addresses, transactions, volume); used to evaluate network health and activity.

Tokenization: The process of representing real-world assets (like commodities, stocks or property); on a blockchain as digital tokens;often cited in XRPL’s strategy.

Frequently Asked Questions About Solana vs Ripple Blockchain Activity Debate

What is the Solana vs Ripple blockchain activity debate?

The debate is the public challenge by Solana Foundation to Ripple executives to compare their networks using raw, on-chain data (active accounts, transactions, volumes) and determine which has stronger ecosystem activity.

What metrics did Solana use when making the challenge?

Solana used 2.5 million daily active accounts, 100 million daily transactions and $2 trillion monthly stablecoin transfers (October) on their network, vs 25,000 active accounts, 1-1.5 million transactions daily and $50-60 billion monthly volume on XRPL.

Is more active accounts always better?

No. While higher numbers often mean more engagement, qualitative factors like application utility, security, regulatory compliance and target audience; also matter. XRPL proponents focus on payments and institutions rather than volume.

What could come out of a live “facts-only” debate?

If done, it could bring transparency to blockchain comparisons, influence developer and investor opinion and make networks deliver on usage rather than marketing.

Read More: Solana Outpaces XRP in Network Activity: 2.5M Accounts vs 25K on XRPL">Solana Outpaces XRP in Network Activity: 2.5M Accounts vs 25K on XRPL

Solana Outpaces Ripple in Network Activity: 2.5M Accounts vs 25K on XRPL

Bitcoin vs Quantum Computing: Why HRF Warn 6.5 Million BTC Could Be at Risk

This article was first published on The Bit Journal.

The Human Rights Foundation (HRF) has sounded a new kind of Bitcoin alarm; one that no price chart can predict. In its latest report, “The Quantum Threat to Bitcoin,” the group warns that the world’s most secure form of money could one day be cracked wide open by quantum computers.

If that happens, Bitcoin’s cryptographic backbone, the math that keeps wallets safe and transactions authentic, could fail, exposing millions of coins, including Satoshi Nakamoto’s, to digital theft.

What the HRF Report Says About the Bitcoin Quantum Threat

The HRF report lays out some alarming numbers. It estimates that about 6.5 million BTC; one-third of all Bitcoins in circulation; could be vulnerable to long-range quantum attacks.

Of those, 4.49 million BTC are in addresses that could be moved to quantum-resistant address types; the remaining 1.72 million BTC (including 1.1 million held by Satoshi Nakamoto) are in old formats and therefore highly exposed.
As the report says:

“Upgrading Bitcoin to withstand quantum threats is as much a human challenge as a cryptographic one. Any successful soft fork integrating quantum-resistant signature schemes will necessitate user education, thoughtful user interface design, and coordination across a global ecosystem…”

This means the Bitcoin quantum threat is not just about math; it’s about coordination; migration and social consensus.

How Quantum Computing Breaks Bitcoin’s Cryptography

At the heart of the Bitcoin quantum threat are two main attack vectors; long-range attacks on dormant or reused addresses and short-range attacks on live transactions where public keys are exposed.

Bitcoin uses the Elliptic Curve Digital Signature Algorithm (ECDSA) and Schnorr signatures to validate transactions. These rely on the mathematical hardness of discrete logarithms. Quantum algorithms like Shor’s algorithm could in theory compute private keys from public keys much faster than classical computers.

For example, when a Bitcoin address reveals its public key on chain (as happens in Pay-to-Public-Key (P2PK) or when an address is reused), that key becomes a quantum target.

The HRF report says “1.72 million Bitcoin… will be highly vulnerable to long-range quantum attacks.”

Researchers also note that while quantum computers capable of this are not yet mature, the window to move funds safely is closing and delays compound the risk.

So the Bitcoin quantum threat seems real; it means the core cryptographic shield that underpins Bitcoin could one day collapse.

Why This Matters for the Bitcoin Ecosystem

The Bitcoin quantum threat is appears structural. If large amounts of BTC became accessible to quantum adversaries, this would undermine trust in Bitcoin’s value proposition as a store of value.

As one analysis notes: “Quantum recovered coins only make everyone else’s coins worth less.

There’s also a scaling and migration challenge. The HRF says quantum-secure signature schemes like lattice- or hash-based methods are much larger than current signatures, one alternative is 10× or even 38× larger which would bloat transaction sizes and stress the blockchain.

Again, the social and governance dimension is huge. Because Bitcoin upgrades require consensus, the transition to post-quantum cryptography is much harder than a normal code change. The report says:

“The community must coordinate across coders, wallet builders, advocacy groups, and millions of skeptical holders…”

In summary, the Bitcoin quantum threat is a problem for Bitcoin’s decentralized upgrade model and could stress its identity as censorship-resistant, neutral money.

What the Bitcoin Community Is Doing (and Not Doing)

In response to the Bitcoin quantum threat, various efforts are underway. For example, Jameson Lopp (co-founder of Casa) has proposed migrating to post-quantum address types and even “burning” vulnerable funds rather than let them be stolen.
Lopp’s perspective:

“Allowing quantum recovery of Bitcoins is akin to wealth redistribution. We would enable the transfer of cryptocurrency from those unaware of quantum computers to those who have won the technological race.”

Meanwhile; the HRF’s report calls for funding; education and coordinated upgrades but it emphasizes the timeline is uncertain.

Despite this; consensus has not been reached. Wallet providers, node operators and users are not equally informed. Many funds are locked in old address formats and may never migrate. This gap takes the Bitcoin quantum threat from theoretical to imminent.

Conclusion

Timing matters as far as this looming Bitcoin quantum threat is concerned. The HRF report says the risk becomes actionable in 5-10 years depending on quantum progress.

Migrating to quantum-resistant schemes is hard and slow. One academic paper estimated it would take at least 76 days of cumulative downtime for the network to be safe.

If there’s delay, the window for safe migration shrinks. Worse, dormant funds get accessed, user confidence is shaken and Bitcoin’s promise of secure, permission-less money is broken.

Hence; the Bitcoin quantum threat is a countdown and a coordination problem; a test of if the ecosystem evolve without undermining what made it valuable.

Glossary

Cryptographically Relevant Quantum Computer (CRQC): a quantum computer powerful and stable enough to break widely-used cryptographic algorithms; such as those securing Bitcoin.

Long-Range Attack: a quantum attack vector; that exploits keys or addresses that have been exposed publicly in the past; especially dormant or reused addresses.

Short-Range Attack: a quantum attack targeting recently used addresses or transactions; where public keys are temporarily exposed during processing.

Post-Quantum Cryptography (PQC): cryptographic algorithms designed to resist attacks by quantum computers; includes lattice-based and hash-based signature schemes.

Elliptic Curve Digital Signature Algorithm (ECDSA): signature algorithm used by Bitcoin to prove ownership of keys; which is considered vulnerable to quantum algorithms like Shor’s.

Soft Fork: backward-compatible change to a blockchain protocol; which allows non-upgraded nodes to continue participating; it is one possible route for migrating Bitcoin’s cryptography.

Frequently Asked Questions About Bitcoin Quantum Threat

Is Bitcoin currently under quantum attack?

No. Current quantum computers are not believed to be capable of breaking Bitcoin’s cryptography yet; but many think that may change in 5-10 years.

Which Bitcoins are most vulnerable to the Bitcoin quantum threat?

Funds in older address formats like Pay-to-Public-Key or reused addresses where the public key has been exposed are most at risk. The HRF estimates 1.72 million BTC are locked in such vulnerable formats.

What can a Bitcoin holder do now to mitigate the threat?

One thing to do now is to avoid address reuse; move funds to newer wallets that support migration to quantum-resistant address types; and stay informed about upcoming protocol upgrades.

Will the Bitcoin blockchain have to stop or fork entirely?

No. The plan is for a soft fork or coordinated upgrade that introduces quantum-secure signature schemes without stopping the chain. Though it’s complicated.

Read More: Bitcoin vs Quantum Computing: Why HRF Warn 6.5 Million BTC Could Be at Risk">Bitcoin vs Quantum Computing: Why HRF Warn 6.5 Million BTC Could Be at Risk

Bitcoin vs Quantum Computing: Why HRF Warn 6.5 Million BTC Could Be at Risk

Ethereum Price Prediction November 2025: Can ETH Hit $5,000 After Fed Rate Cuts?

Experts are projecting that the Ethereum price prediction November 2025 will be a mix of macro and crypto trends. After reaching new all-time highs in mid-2025, ETH’s November outlook is influenced by Fed rate cuts, regulatory changes such as the new ETFs and stablecoin laws as well as global events.

Analysts and institutions have a wide range of targets. Citigroup project a price of $4,300 with a bull case at $6,400 and a bear case of $2,200 in a downturn. Standard Chartered just raised its 2025 year-end forecast to $7,500.

These numbers suggest that $ETH is likely to trade in the mid-$3K to high-$4K range in the month of November unless a surprising market turn ensues.

About Ethereum

Ethereum is a decentralized open-source blockchain that enables smart contracts and dApps. Its native cryptocurrency is Ether (ETH); the second largest crypto by market capitalization. Ethereum transitioned to Proof-of-Stake (PoS) in 2022; reducing energy usage and enabling staking.

As of late 2025; key stats for Ethereum are:

Metric Value (Approx.)
Market Cap $458.7 billion
Circulating Supply 120.7 million ETH
All-Time High (ETH) $4,953.73 achieved Aug 24, 2025)
All-Time Low (USD) $0.4209 on Oct 21, 2015
Staked ETH 30.2% of supply (36.5M ETH)
DeFi TVL (Ethereum) $119 billion (Q3 2025


These figures illustrate Ethereum’s dominant network metrics. Its circulating supply is 120.7M ETH, with 30% staked under PoS. It has the largest DeFi ecosystem with $119B in TVL; by far. So; Ethereum’s price outlook into November 2025 is a combination of fundamentals and market catalysts.

Key Factors Affecting Ethereum’s Price

Ethereum’s outlook for November 2025 is being influenced by a bunch of big market and macroeconomic factors. From investors piling into ETF’s to network upgrades and interest rates, analysts say these are going to shape the momentum of $ETH in November.

Just recently the first staking ETH ETF (REX-Osprey ESK) launched in September 2025 and pays out actual staking rewards. These ETFs and related regulatory moves have increased demand.

The Federal Reserve’s rate cut on October 29th of 25 basis points is a bit of a relief for risk assets and that includes crypto currencies. Lower borrowing costs is usually a good thing for liquidity and therefore also for Ethereum.

However, Fed chair Jerome Powell’s cautious tone might put the brakes on the market, keeping Ethereum’s November price swings to a fairly narrow range between $3,900 and $4,300.

By contrast; US-China trade friction has also been weighing on $ETH prices. In mid October 2025, new tariffs tussles caused a crypto selloff and Ether dropped to $3,900 after US-China port fees were renewed. Geopolitical tensions tend to drag on risk-on assets; hence continued tension could weigh on Ethereum.

Industry trends, however, are quite positive. Over 65% of new dApps are reportedly launching on Ethereum’s Layer-2s.

The upcoming Fusaka network upgrade in December 2025 could make Ethereum’s Layer-2 faster and cheaper, which is great news for the long-term holders.

This has already created a very positive atmosphere around Ethereum; which could lead to a potential price rise in November because of market participants looking ahead to this upgrade.

Taken together, these factors frame the Ethereum price prediction for November 2025. On balance, regulation and adoption offer positives while macro uncertainty, like rates and geopolitics, could cap gains.

Price Forecast for November 2025

The projected range for Ethereum in November 2025; is around $4,300-$4,800. The average of major forecasts falls near the mid-$4,000s. By the end of the month, if bullish momentum continues, $ETH could touch the high ends of $4,000s to $5,000.

If instead markets remain cautious, $ETH might hover around $4,300. November might be a make-or-break month as analysts put it, where a decisive monthly close will set the tone for the longer term.

As of late October 2025, Ethereum ranges around $3,800. A bull case with more institutional adoption and ETF inflows could see ETH to $6K by year-end. However, with macro weaknesses, $ETH could slide downwards to even $2.2-$3K, in the worst case scenario. The base case is a mid-range consolidation around $4K-$4.5K which is where many analysts are targeting.

On-chain analysts note a triple-bottom around $3,750-$3,800, historically a floor before rallies. A break below $4,000 could open up downside to that level.

These scenarios frame the Ethereum price prediction November 2025. In essence, Base-case conditions could hold $ETH to be around $3,800-$4,500 in the month and bullish momentum could see it reach $5K+ if new catalysts arrive.

Expert Analysis and Forecasts

Market analysts are diverse in their forecasts given crypto’s volatility. Citigroup has a year-end 2025 ETH target of $4,300, citing DeFi and stablecoin use cases. Analysts think current prices are partly driven by sentiment and outlined a bull case of $6,400 if adoption accelerates and a bear case of around $2,000 if global growth falters.

Standard Chartered is way more optimistic. They just raised their 2025 year-end $ETH forecast to $7,500 and noted surging industry engagement and corporate holdings. StanChart thinks the stablecoin sector will grow 8x by 2028 which will boost fees and $ETH demand.

CoinCodex’s algorithm projects Ethereum at $4,350 by Nov 29, 2025; roughly +11.7% from late October. TokenMetrics thinks with institutional demand via ETFs and wallets; $ETH could test $5,000-$10,000 by the end of 2025 if the Pectra upgrade improves scalability.

Crypto analyst Ali Martinez sees a multi-year path to $10,000 (beyond 2025) and on-chain data firm Santiment notes large holders are accumulating again which is a bullish sign.

In summary, forecasts have a wide range for the Ethereum price prediction November 2025. Citigroup’s near-term outlook of $4,300 and CoinCodex’s $4,350 for late November is mid-$4K. Standard Chartered’s $7,500 target (year-end) shows an upside into 2026.

 Below is a summary of recent November 2025 forecasts from market analysts and forecasting platforms:

Source / Analyst Forecast Period ETH Price Range (USD)
Citigroup Year-end 2025 $4,300 $6,400
Standard Chartered Year-end 2025 $7,500
CoinCodex  Nov 29, 2025 $4,350
TokenMetrics End-2025 $5,000 – $10,000
Ali Martinez  Multi-year (beyond 2025) Up to $10,000
Changelly  Nov 2025 $4,335 – $4,661
TradingView Nov 2025 $4,144 – $5,250
DigitalCoinPrice  Nov 2025 $3,312 – $8,134

Market Scenarios: Bearish, Base and Bullish Outlook

In the Bullish Scenario, if global markets calm down, the Fed eases, and crypto ETFs/staking products keep seeing big inflows, $ETH could go up. Institutional support and network upgrades could drive new highs.

In this scenario the Ethereum price in November 2025 could go past previous highs. Optimistic models have $ETH at $5,000-$6,000+ by year-end if momentum holds.

In the Base Scenario, more likely, Ethereum could be in the mid-$3K to low-$5K range in November 2025. Experts’ targets implies a small increase from current levels.

In this base case, gains from ETFs and adoption are offset by typical volatility and some profit-taking. $ETH might consolidate around $4,000, testing support at $3,900-$4,000 and resistance at $4,300-$4,500. This range reflects that $ETH’s fundamentals are strong even if broader markets pull back.

In the Bearish Scenario, a new financial crisis could drain liquidity from crypto. US-China clashes or a global stock market crash could trigger risk-off selling. In that case, Ethereum could go back to $2,000-$3,000. Citi’s bear case of $2,200 by year-end accounts for such a macro slump. Technical winds such as disappointing ETF flows or on-chain congestion issues; could also make things worse.

Conclusion

Ethereum price prediction the November 2025 projects that $ETH could trade in a range of $3,500-$5,500; depending on the broader market.. Institutional winds like spot and staking ETFs; US regulatory support and upcoming upgrades give a bullish bias; so $ETH could test new highs by late 2025.

However, economic and geopolitical headwinds like Fed policy shifts, trade tensions could temper gains. Major financial firms like Citi and StanChart have targets of $4.3K and $7.5K by year-end, implying that the mid-2025 momentum might just carry into the later part of November.

In short; Ethereum’s outlook for November 2025 is positive but uncertain. A steady climb above $4K could confirm the bullish view; while a break below $3,500 could invalidate it.

Market watchers and investors should keep an eye on the Fed; regulatory news and institutional flows. In the coming weeks; Ethereum’s price will reflect how these catalysts play out.

Glossary

Ethereum (ETH): A decentralized, open-source blockchain.

Exchange-Traded Fund (ETF): A regulated investment fund traded on an exchange; representing a basket of assets.

Proof-of-Stake (PoS): A method of reaching consensus where participants “stake” their coins to support the network’s security and transaction validation; in return; they receive a reward.
Stablecoin: A cryptocurrency that is tied to a stable asset such as the US dollar. Stablecoins are usually issued on Ethereum (for instance, USDC, USDT).
Market Capitalization: The overall value of all the coins that are currently available; it is computed as price multiplied by supply.

Frequently Asked Questions About Ethereum Price Prediction November 2025

What affects Ethereum’s price?

Supply and demand; market sentiment and macro policies. Regulatory news like ETF approvals and crypto laws; institutional adoption, network upgrades and global events like US-China tensions; all matter.

How do Ethereum ETFs impact ETH’s price?

Spot ETH ETFs allow large investors and funds to buy $ETH without holding the crypto directly. This increases institutional demand and liquidity. For example, the launch of the new staking ETFs has brought fresh capital into $ETH and pushed prices up.

What is Ethereum’s all-time high price?

ETH’s ATH is $4,953.73; reached on August 24, 2025.

Will Ethereum hit $10,000 by 2025?

Most think $10K ETH by end-2025; is highly unlikely and too optimistic. Current targets are much lower.. Long-term forecasts (2027-28) do see five-figure prices under perfect conditions; but for November 2025; the consensus is below $10K.

What is Ethereum’s price prediction for November 2025?

Forecasts vary but mid-range expectations are $4,000-$4,500 by late Nov 2025. For example; CoinCodex’s model says $4,350 by Nov 29, 2025. Citi analysts have a similar target ($4.3K by year-end). This assumes a continuation of 2025 trends without extreme events.

Read More: Ethereum Price Prediction November 2025: Can ETH Hit $5,000 After Fed Rate Cuts?">Ethereum Price Prediction November 2025: Can ETH Hit $5,000 After Fed Rate Cuts?

Ethereum Price Prediction November 2025: Can ETH Hit $5,000 After Fed Rate Cuts?
❌