Reading view

Is XRP Price Setting Up for a Deeper Dip to $1 Before a Rebound in 2026?

How High Will XRP Price Go As Franklin Templeton XRP ETF Goes Live Soon

The post Is XRP Price Setting Up for a Deeper Dip to $1 Before a Rebound in 2026? appeared first on Coinpedia Fintech News

The XRP price is presenting a rare series of events. On the one hand, institutional accumulation has remained uninterrupted for weeks, including XRP ETF net flows. But, on the flip side, the price action continues to bleed lower, testing investors’ and traders’ patience heavily. This growing divergence between fundamentals and market behavior is shaping one of the most complex XRP setups in recent years, that is keeping new investors at bay.

XRP Price Sees Unbroken Institutional Inflows

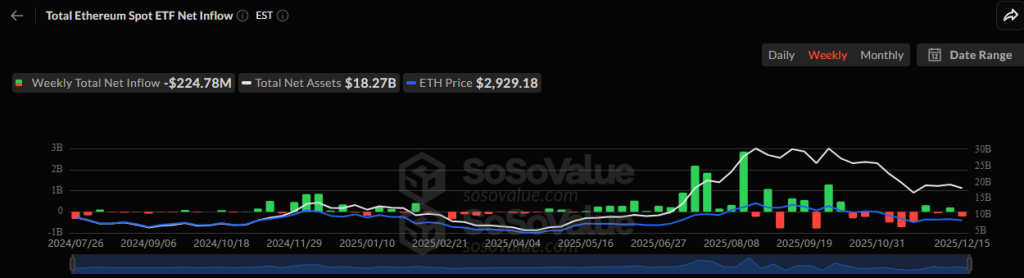
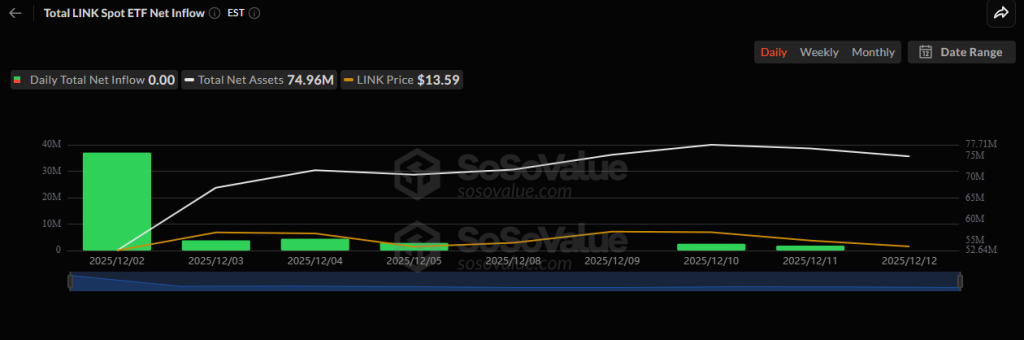
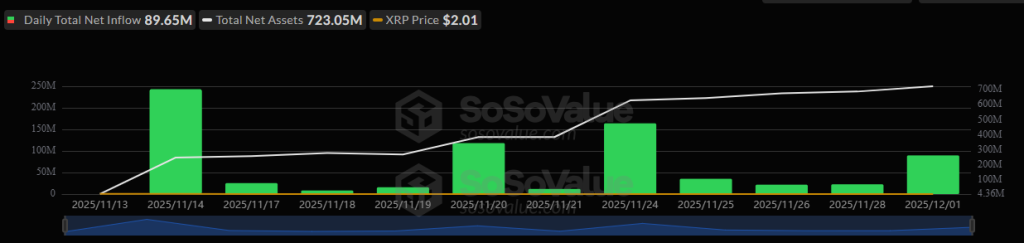
As evident on XRP ETF netflows, from November 14 to December 15, the XRP price chart recorded not a single day of ETF outflows. This clearly suggests that institutions are not only interested in XRP but are also steadily increasing their exposure, regardless of short-term volatility.

Is XRP Price Setting Up for a Deeper Dip to $1 Before a Rebound in 2026?

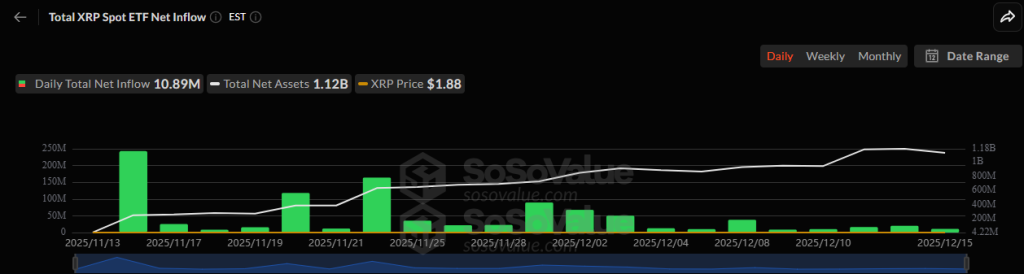
Institutional holdings have now reached approximately 0.98% of XRP crypto’s total market capitalization, translating to nearly $1.12 billion in net assets, per SOSOValue’s data. This level of confidence makes it hard to believe that the price would settle lower, given good fundamentals and a project with utility. 

However, these positive net flows indicate a long-term role rather than short-term speculative positioning. The accumulation trend reinforces the idea that XRP’s fundamentals remain intact even as the price weakens, and it seems more likely that the market will show a big surprise soon or next year.

Why Strong Fundamentals Aren’t Lifting XRP Price

Now, many are intrigued as to why XRP ETF positive inflows aren’t supporting the price. Then, looking at the data, the picture becomes clearer, which underlines the real problem. The XRP price USD has failed to respond positively to ETF data, and the primary reason lies in insufficient buying power relative to broader selling pressure. 

While XRP ETF inflows are constructive, they are not yet large enough to offset aggressive derivatives activity.

Is XRP Price Setting Up for a Deeper Dip to $1 Before a Rebound in 2026?

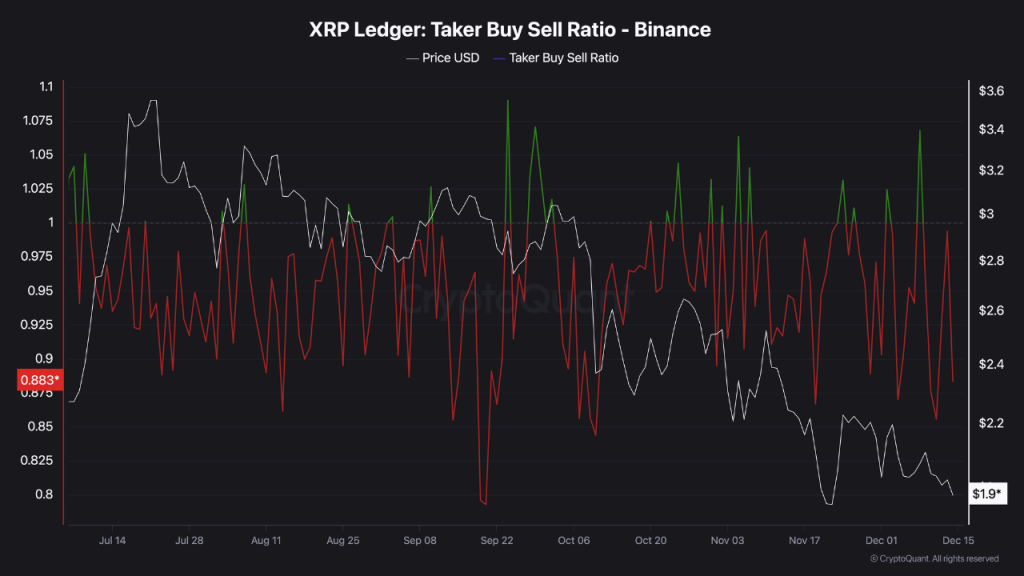
The Taker Buy Sell Ratio has stayed negative for most of this period, indicating that sell orders continue to dominate XRP’s futures market. This imbalance suggests that short-term traders remain positioned bearishly, limiting any sustained upside attempts.

Historically, such extended compression phases often end with sharp volatility expansions. However, current conditions show that bears momentum is still strong against bulls.

Derivatives Market Keeps XRP Price Capped

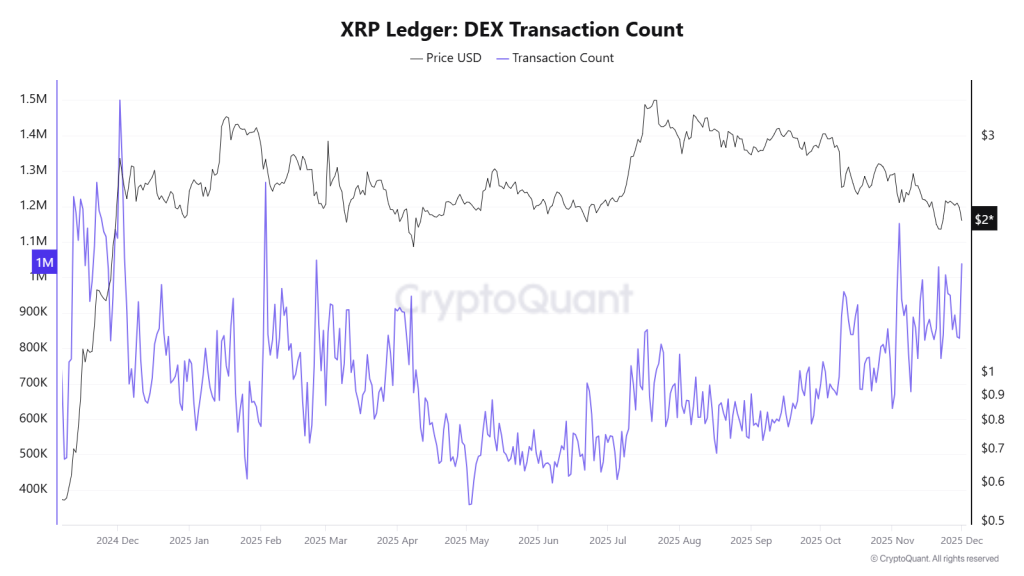
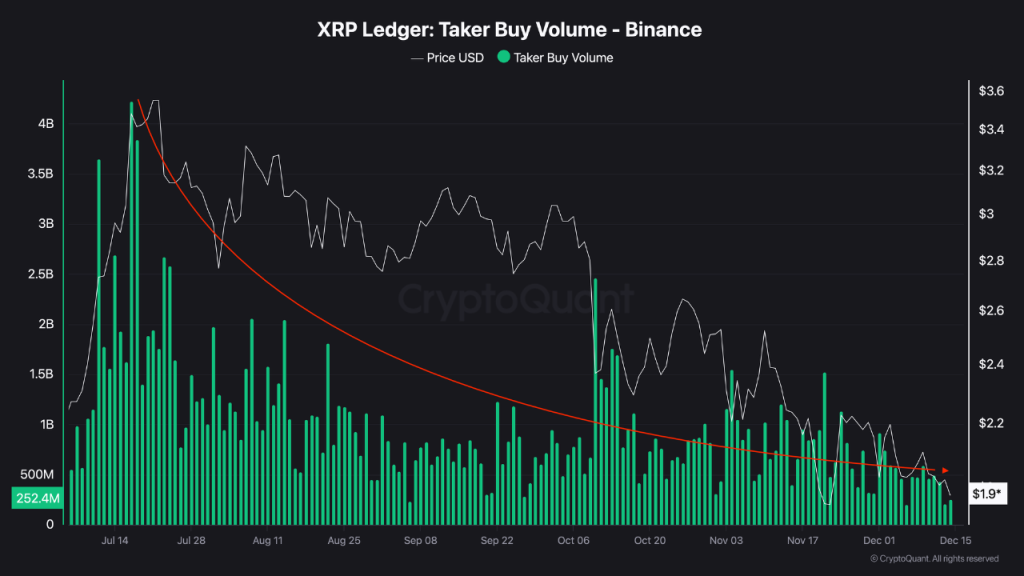
Another critical factor weighing on the XRP price forecast is the evaporation of buying pressure in derivatives markets. Insights from CryptoQuant suggest that the Buy-side futures volume has fallen to multi-month lows, signaling hesitation from leveraged traders.

Is XRP Price Setting Up for a Deeper Dip to $1 Before a Rebound in 2026?

Beyond XRP-specific metrics, the broader market context also remains unfavorable. Altcoins as a whole have experienced a significant dip over recent months. While Bitcoin continues to absorb the majority of available liquidity, holding onto its own support levels, it leaves limited room for recovery across alternative coins.

Additionally, at a time like this, new liquidity from new investors would have helped facilitate recovery; however, new investors are currently on the sidelines due to the tremendous liquidations across the altcoin sector in October, which have further eroded confidence. As risk appetite remains fragile, even fundamentally strong assets like XRP crypto struggle to attract aggressive bids.

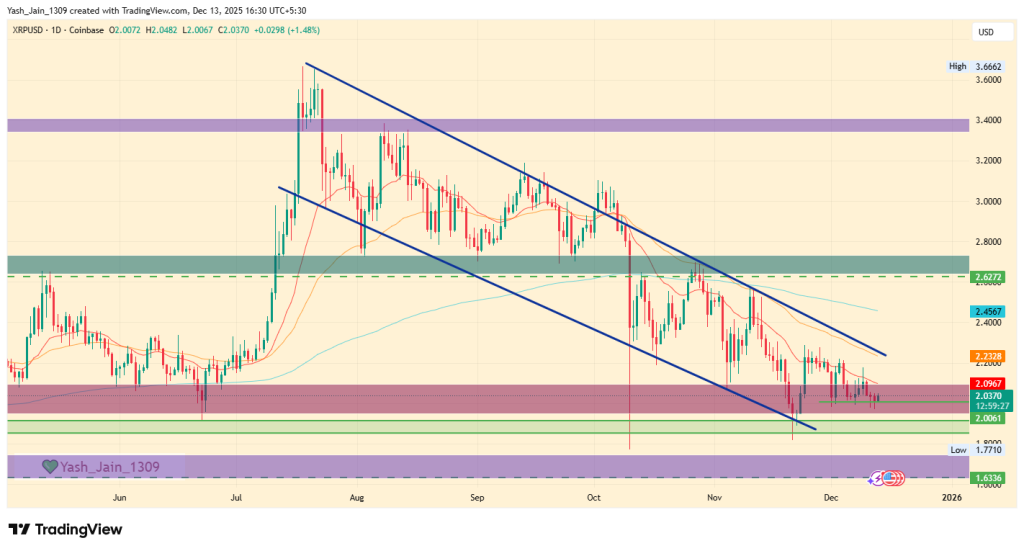
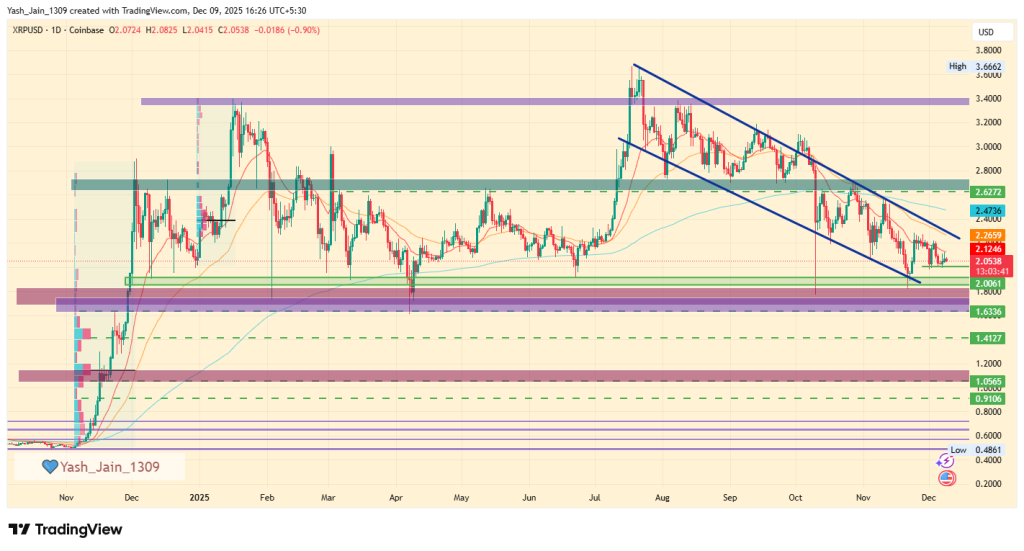
Key Levels Define the XRP Price Outlook

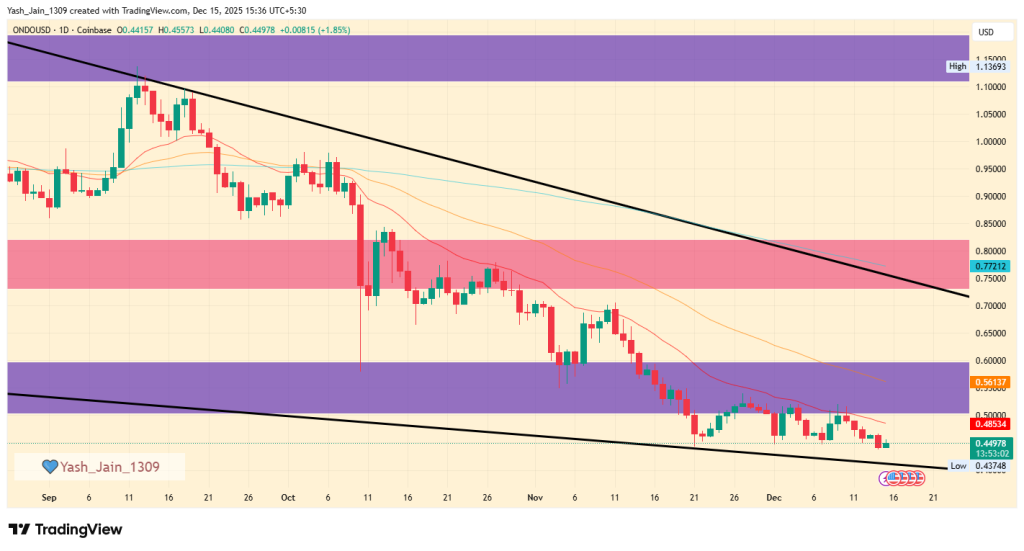
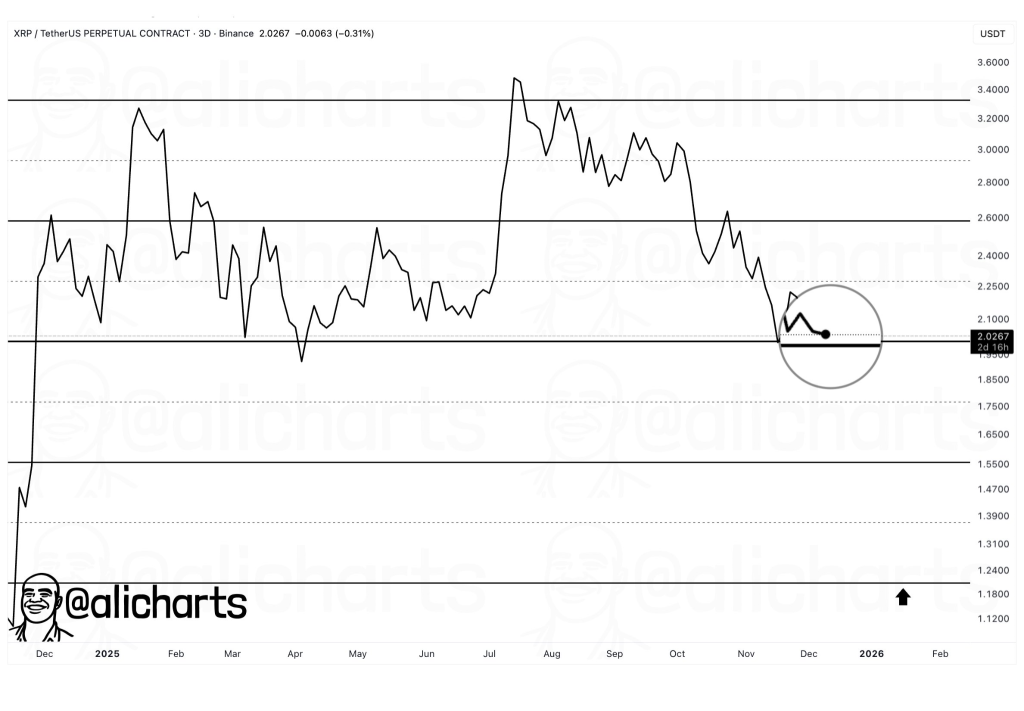
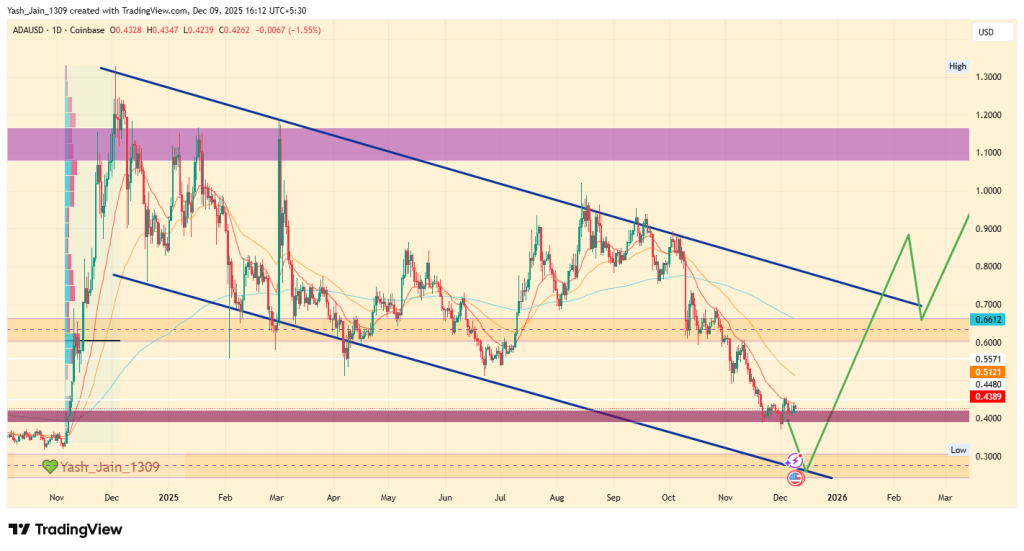
From a technical perspective, $1.92 has emerged as a crucial turning point on the XRP price chart, at least in the short term. Now, a Failure to hold this zone could open the door to a deeper correction toward the $1.00 psychological level.

$1.92 is the level $XRP must hold to avoid a drop to $1. pic.twitter.com/bjZlIco9Qo

— Ali Charts (@alicharts) December 16, 2025

At the same time, prolonged weakness may continue to benefit institutional buyers. As weaker retail gets absorbed slowly, conditions could eventually shift toward a more durable accumulation base. In that context, many expect the XRP price to stabilize before any meaningful recovery phase potentially develops later.

FAQs

How high could XRP go by the end of 2025?

Analysts predict XRP could reach $5.05 by December 2025 if bullish momentum continues and key resistance levels are broken.

What factors influence XRP’s price movement?

XRP price is influenced by ETF approvals, on-chain activity, investor sentiment, legal developments, and broader crypto market trends.

Is XRP a good investment in 2025?

XRP shows bullish signs with strong on-chain activity and ETF interest, but investors should watch key support and resistance levels carefully.

Avalanche Price Prediction 2025, 2026 – 2030: Will AVAX Price Hit $100?

Avalanche Price Prediction

The post Avalanche Price Prediction 2025, 2026 – 2030: Will AVAX Price Hit $100? appeared first on Coinpedia Fintech News

Story Highlights

  • The live price of the Avalanche is  $ 12.18921491.
  • Price predictions for 2025 suggest highs of $50 and potential ETF approval.
  • Long-term forecasts indicate AVAX could reach $518.50 by 2030.

Avalanche (AVAX) has become a go-to platform for developers, especially after its Avalanche 9000 mainnet upgrade and the launch of the AVAX card in early 2025. With lower fees and growing real-world use cases, plus backing from giants like Mastercard and SMBC, AVAX is gaining serious traction. 

As a result, many are intrigued to know Avalanche prediction and are wondering: “How high can AVAX price go?” or “Will AVAX reach $50?” or “Does Avalanche have a good long-term future?” So, if you’re planning an investment in Avalanche (AVAX). Explore our in-depth Avalanche Price Prediction 2025 to 2030.

Avalanche Price Today

Cryptocurrency Avalanche
Token AVAX
Price $12.1892 down -6.37%
Market Cap$ 5,234,893,037.39
24h Volume$ 453,731,735.0225
Circulating Supply429,469,254.3685
Total Supply461,138,354.3685
All-Time High$ 146.2179 on 21 November 2021
All-Time Low$ 2.7888 on 31 December 2020

CoinPedia’s Avalanche Price Prediction

According to Coinpedia’s AVAX price prediction, the altcoin may surpass the $49.46 mark in 2025. Moreover, the upcoming years are expected to be bullish, with a conservative momentum.

With an optimistic outlook, we expect the AVAX coin price to reach $50 in 2025.

YearPotential LowPotential AveragePotential High
2025$12.36$30.91$49.46

Avalanche Price Prediction 2025

Since its rally from late 2023 to early 2024, from $ 8.62 to $ 65.23, was the last bullish jump witnessed in the AVAX price in USD. Since that high, AVAX has not managed to reach a new high; instead, it has continued to decline for multiple months, and even 2025 was contained in a bearish mode.

However, on the daily chart, it is observed that the current price decline is headed to retest the key support of late 2023 around once again in the $8.62-$10 area, which could bring a reversal in the rally, as it is the exact point where we last saw bullish momentum.

This will lead to another 20% to 30% decline in the AVAX price in the coming sessions, but after this decline, renewed demand at key levels is expected to strengthen the AVAX price.

Avalanche Price Prediction 2025

In that scope, the short-term view may remain on the short side due to current geopolitical conditions, along with risk-off investor sentiment, but the long-term view for 2026 is majorly bullish, and as early as the first half, it will display good price action only if bullish demand reappears from the same key support.

YearPotential LowPotential AveragePotential High
2025$25$33$50

Avalanche Price Target December 2025

In 2025, a definitive bearish trend has established a falling wedge on the weekly chart, consistently converging each time it intersects with the borders. This pattern strongly indicates that movement is coiling, and further consolidation will inevitably lead to a significant surge.

As of December, the price is trading around the lower border of this pattern. If a rally occurs, the target by the end of December will be approximately $30. Should it break through this level, we can anticipate a continuation of the rally into Q1 2026, potentially reaching the $52 region.

Conversely, if the price fails to rally, we will likely see it consolidate below $20 for the remainder of December, shifting all focus and anticipation to the opportunities that 2026 will bring.

Avalanche Price Prediction December 2025
MonthPotential Low ($)Potential Average ($)Potential High ($)
AVAX Price Target December 202515.0026.5042.50

Avalanche Price Prediction 2026 – 2030

YearPotential Low ($)Potential Average ($)Potential High ($)
202620.0050.0080.00
202731.5079.00126.50
202850.50126.50202.50
202981.00202.50324.00
2030129.50324.00518.50

AVAX Price Prediction 2031, 2032, 2033, 2040, 2050

Based on the historic market sentiments, and trend analysis of the altcoin, here are the possible AVAX price targets for the longer time frames.

YearPotential Low ($)Potential Average ($)Potential High ($)
2031209270331
2032259344430
2033307418529
20401,2122,0552,899
20508,67913,01017,341

Market Analysis

Firm202520262030
Changelly$24.72$40.82$232.67
Coincodex$32.63$28.42$19.98
Binance$25.64$26.92$32.72

*The aforementioned targets are the average targets set by the respective firms.

Never Miss a Beat in the Crypto World!

Stay ahead with breaking news, expert analysis, and real-time updates on the latest trends in Bitcoin, altcoins, DeFi, NFTs, and more.

FAQs

What will Avalanche be worth in 2025?

Avalanche could trade near $30–$50 in 2025 if market conditions improve and demand strengthens after current bearish pressure.

Can AVAX reach $100 dollars?

AVAX can reach $100 if strong adoption, ecosystem growth, and bullish market cycles align, though it requires sustained momentum.

How much will AVAX be worth in 2030?

AVAX may reach $300–$500 by 2030 based on long-term growth trends and increasing real-world usage, though outcomes depend on market cycles.

Is Avalanche a good crypto to invest in?

Avalanche is considered promising due to speed, low fees, and developer support, but investors should weigh risks and volatility.

What factors will influence AVAX price growth?

AVAX price will depend on adoption, network upgrades, broader crypto trends, and how quickly developer activity expands.

AVAX
BINANCE

Is Ethereum Price Building a Base for a 2026 Breakout?

Ethereum price

The post Is Ethereum Price Building a Base for a 2026 Breakout? appeared first on Coinpedia Fintech News

The Ethereum price is currently demonstrating clear structural strength in its price action, despite surface-level volatility. Although short-term price movements are still confined to a range, but the hard facts that came from deeper on-chain metrics and the 2025 ETF net flows trend indicate a strong accumulation phase is in progress. This bodes well for a significant upward move brewing for future months.

Ethereum Price and Whale Realized Levels Signal Strong Support

One of the most notable developments on the Ethereum price chart comes from realized price data tied to accumulation addresses. According to on-chain metric chart from CryptoQuant, large holders have steadily increased their cost basis over recent months. In June, the realized price for these accumulation wallet addresses stood near $1,560. Since then, it has climbed toward the $3,000 zone.

This rise in realized price alone reflects consistent buying rather than short-term trading. Importantly, realized price often acts as a psychological and structural support level, where smart money will do everything in power to minimize losses. As long as whales continue accumulating above this zone, it becomes increasingly difficult for the Ethereum price USD to sustain deep breakdowns below it.

Why Whale Accumulation Matters for Ethereum Crypto

Whales typically accumulate with a longer time horizon, especially when preparing for broader market expansions. Their continued buying suggests confidence that current prices represent value rather than excess. This behavior reinforces the idea that downside risks may be absorbed gradually instead of triggering sharp capitulation.

Is Ethereum Price Building a Base for a 2026 Breakout?

From a structural perspective, this accumulation trend places the Ethereum price in a different position compared to speculative-driven rallies. Instead of rapid spikes, price stabilization near rising realized levels often precedes more sustained trend expansions.

Ethereum ETF Flows Reinforce Institutional Confidence

Beyond on-chain data, ETF activity adds another layer of confirmation. Throughout the year, the Ethereum ETF landscape has recorded more weeks of inflows than outflows. This consistency suggests institutional participation is supporting the market, even during periods of broader uncertainty.

Is Ethereum Price Building a Base for a 2026 Breakout?

Notably, since September, the pace of weekly outflows has been declining. This shift points toward improving sentiment rather than distribution. While ETF flows have not triggered immediate upside, they appear to be playing a stabilizing role in maintaining the Ethereum price USD above critical zones.

Aligning On-Chain Data With Ethereum Price Forecast

When whale accumulation trends and ETF flows are viewed together, a clearer picture emerges. Rather than signaling exhaustion, current conditions suggest preparation. December may function as a consolidation phase rather than a breakout month.

Is Ethereum Price Building a Base for a 2026 Breakout?

As a result, Ethereum price prediction models increasingly focus on early 2026. If accumulation continues and institutional demand remains steady, projections extend toward higher psychological levels during Q1. This alignment between on-chain conviction and capital flows strengthens longer-term Ethereum price forecast assumptions.

Algorand Price Prediction 2025, 2026 – 2030: Will ALGO Price Hit $1?

Algorand Price Prediction

The post Algorand Price Prediction 2025, 2026 – 2030: Will ALGO Price Hit $1? appeared first on Coinpedia Fintech News

Story Highlights

  • The live price of the Algorand is  $ 0.11632610
  • Price predictions suggest ALGO could reach $0.90 by the end of 2025.
  • Long-term forecasts indicate potential highs of $5.65 by 2030.

Algorand’s strong push for scalability, security, and decentralization is paying off. With the launch of AlgoKit 3.0 in Q1 2025 and growing developer interest, ALGO adoption has improved and is now on the rise. The rising adoption is beneficial for an asset, as it is directly proportional to a token’s price.

But the big question for intrigued market participants still remains: Can ALGO Price hit $1 this cycle? Read our in-depth Algorand Price Prediction 2025 and long-term outlook through 2030 to find out.

Algorand Price Today

Cryptocurrency Algorand
Token ALGO
Price $0.1163 down -3.12%
Market Cap$ 1,027,196,794.72
24h Volume$ 52,339,890.8932
Circulating Supply8,830,320,925.4743
Total Supply10,000,000,000.00
All-Time High$ 3.2802 on 21 June 2019
All-Time Low$ 0.0876 on 11 September 2023

CoinPedia’s Algorand Price Prediction

As per Coinpedia’s Algorand Price Prediction, the forecast for the Algorand network is optimistic for the coming years. With a potential altcoin market in Q1 2025, the ALGO coin price might skyrocket toward a new high.

If the network maintains the staggering growth, the ALGO coin price may reach $0.89 in 2025. Conversely, if the network fails to expand, then the price can flip into a bearish trap and dip to $0.45.

YearPotential LowPotential AveragePotential High
2025$0.45$0.67$0.89

Algorand Price Analysis 2025

In Q4 2024, Algorand (ALGO) experienced a significant drive, reaching a high of $0.613, marking a remarkable 470% gain from the $0.1079 level. 

However, the excitement was short-lived as a sell-off intensified in the final month of 2024, extending that into Q1 2025. By the first week of April, ALGO’s price plummeted to a low of $0.1491, which established a strong multi-year support area.

From the second week of April, the price action began to shift, forming a higher-high structure that indicated a recovery from the multi-year support level. By mid-May, Algorand’s price had climbed nearly 70% to $0.24 from the Q2 low of $0.150. 

Unfortunately, this upward momentum was halted in mid-May as strong supply levels rejected further advances, pushing the price below the 200-day EMA band.

In the third week of June, ALGO returned to April’s low, finding support at the $0.15 level. At this point, the price was down 71% from Q4 2024’s high and 32% from mid-May’s peak. The risks were high, with indications that any short-term bearish pressure could lead to a drop to the 2024 low of $0.0943, breaching the $0.15 support.

However, everything changed last week in June, which was also the finishing week for H1. The momentum in H2 began with the blast.

Algo Price Target December 2025

The price of Algorand (ALGO) surged to $0.34 in July, hitting the upper resistance of a declining triangle pattern that has developed over the past several months. 

Since then, the price has closely tracked along the upper boundary of this long-term formation, indicative of a bleeding phase. This continued from August until now, which means it lasted into most of December. While the decline has persisted, it’s reassuring that no new lows for this year have been established, offering a solid sense of stability for investors with only a few days left in December.

The current demand zone around $0.10-$0.13 is pivotal, as it holds the potential to prevent another dip in price action. The price range is now highly congested. This also briefly shifts perception from the bearish side to the bullish side, despite the price crashing significantly in 2025.

As the price remains longer and tighter within this pattern, the higher the likelihood of a significant breakout. A substantial movement is on the horizon, expected either in December or to kick off in Q1 2026.

If ALGO successfully regains the $0.15 level, it’s likely to test the $0.21 mark. Should it surpass that, a target of $0.28 could very well be achievable this December or Q1 2026. It’s just like a matter of a good macro catalyst this time around.

On the other hand, if selling pressure ramps up and the price falls below the critical support area, it could invalidate the bullish outlook. In that case, ALGO is likely to maintain a sideways price action, but the overall bullish potential remains strong.

Algorand Price Prediction December 2025
MonthPotential Low ($)Potential Average ($)Potential High ($)
Algorand (ALGO) Price Forecast December 20250.180.300.34

ALGO Price Analysis 2026

Over the last three years, Algorand (ALGO) has been in a sustained sideways trading range, which has slowly built an ascending broadening wedge pattern. This slow price action is in stark contrast to the parabolic growth it experienced in 2021. 

This extended period of consolidation is clearly visible on the monthly chart, suggesting that the longer the price coils, the more powerful the eventual breakout could be.

Looking toward the second half of 2025, if demand for ALGO increases in direct proportion to its adoption, it could clear key resistance levels. With a surge in momentum, ALGO could aim for price targets of $0.60, $0.80, and potentially even $0.90 by year-end.

While these targets may appear ambitious given the current price, the macro-level chart analysis indicates that such a move is plausible if strong momentum returns to the market, especially given the increased institutional collaborations and retail adoption.

ALGO Price Analysis 2025
YearPotential LowPotential AveragePotential High
2025$0.20$0.50$0.90

Algorand Price Targets 2026 – 2030

YearPotential Low ($)Potential Average ($)Potential High ($)
20260.651.01.35
20270.901.502.00
20281.402.102.90
20291.752.954.15
20302.504.055.65

Algorand (ALGO) Price Forecast 2026

Moving forward to 2026, the ALGO price may record a maximum price of $1.35. With a potential low of $0.65, the average price could settle at around $1.0.

ALGO Coin Price Projection 2027

Looking ahead to 2027, the Algorand crypto token may range between $0.90 and $2.0. With this, the average trading price could settle at around $1.50 for the year.

Algorand Crypto Price Action 2028

In 2028, the ALGO coin with a potential surge could reach a high of $2.90, a low of $1.40, and an average of $2.10.

ALGO Token Price Analysis 2029

Moving into 2029, the  Algorand coin could range between $1.75 and $4.15. Considering the buying and selling pressure, the average price could settle at around $2.95.

ALGO Price Prediction 2030

By 2030, the value of a single Algorand token could reach a high of $5.65, a low of $2.50, and an average of $4.05.

Market Analysis

Firm Name202520262030
Currencyanalytics$0.67$0.97$4.06
Priceprediction.net$0.18$0.258$1.10
DigitalCoinPrice$0.82$1.28$2.60
Never Miss a Beat in the Crypto World!

Stay ahead with breaking news, expert analysis, and real-time updates on the latest trends in Bitcoin, altcoins, DeFi, NFTs, and more.

FAQs

What is the Algorand price prediction 2025?

Algorand may trade between $0.45 and $0.90 in 2025, depending on adoption, market demand, and overall crypto sentiment.

Is Algorand a good long-term investment?

Algorand’s focus on scalability and developer tools makes it a strong long-term contender, but investors should consider overall market risks.

What drives Algorand’s price growth?

ALGO’s price is mainly driven by adoption, developer activity, network upgrades, and overall crypto market sentiment.

How high can Algorand go by 2030?

Forecasts suggest ALGO may reach up to $5.65 by 2030 if adoption expands and market conditions remain favorable.

Why is Algorand gaining developer interest?

Tools like AlgoKit 3.0 and faster transaction speeds are attracting more developers, boosting ecosystem activity and utility.

ALGO
BINANCE

MYX Finance Price Prediction 2026, 2027-2030: Is MYX the Next Big Decentralized Futures Play?

MYX Finance Price Prediction 2026, 2027-2030

The post MYX Finance Price Prediction 2026, 2027-2030: Is MYX the Next Big Decentralized Futures Play? appeared first on Coinpedia Fintech News

Story Highlights

  • The Live Price Of MYX Is  $ 3.41074495
  • Price predictions for 2026 range from $4.6 – $7.20.By 2030, the MYX price could surge toward $46.80 due to growing trader activity.

MYX Finance is positioning itself as a next-generation decentralized perpetual futures exchange, targeting traders who want on-chain transparency without sacrificing leverage and execution speed. 

As centralized exchanges face increasing regulatory pressure, perpetual DEXs like MYX are attracting users looking for non-custodial alternatives.

While the overall cryptocurrency market is under pressure, MYX Finance’s native token (MYX) is moving in the opposite direction. The token jumped around 15% in the last 24 hours, trading near $3.5, even as Bitcoin, Ethereum, and most altcoins slipped lower.

At a time when overall market sentiment remains weak, MYX’s strong price action has turned heads. Making investors curious about the token growth, wondering what the future will be for these tokens. 

With that in mind, let’s take a closer look at our MYX Finance (MYX) price outlook for 2026 to 2030.

MYX Finance Price Today

Cryptocurrency MYX Finance
Token MYX
Price $3.4107 up 2.59%
Market Cap$ 857,711,710.12
24h Volume$ 45,230,872.6013
Circulating Supply251,473,423.70
Total Supply1,000,000,000.00
All-Time High$ 19.0135 on 11 September 2025
All-Time Low$ 0.0467 on 19 June 2025

MYX Price Targets For January 2026

Unlike traditional platforms, MYX offers a chain-abstracted wallet that lets users trade across blockchains without manual bridging. Its two-layer account model keeps funds in user custody while enabling gasless trades. 

With up to 50x leverage and zero slippage, MYX gained attention, leading to major listings like WLFI in September.

This volume more than doubled during the year, climbing from $51 billion in January 2025 to $123.18 billion by early December. Also, Earnings have more than doubled in the same period, jumping from $18 million to $54.83 million.

The recent uptick suggests improving confidence, but sustained momentum will depend on whether volume growth follows price.

MYX Price Targets For January 2026

Technical Analysis

Looking at the MYX/USD 4-hour chart, the price is trading around the middle Bollinger Band near $3.27, which is acting as a short-term support zone. 

The lower Bollinger Band, at around $2.87, marks the key downside support and has held well during recent pullbacks. On the upside, the upper Bollinger Band near $3.65–$3.68 is acting as immediate resistance. A clear break above this level could open the door towards $4.3, then further to near $5.

Technical indicators, such as the RSI, are currently around 60, indicating mild bullish momentum. This suggests buyers are active, but the price is not yet overbought.

MonthPotential Low ($)Potential Average ($)Potential High ($)
MYX Crypto Price Prediction January 2026$1.74$3.60$5

MYX Finance (MYX) Price Prediction 2026

The year 2026 may act as a stress test for MYX Finance. By this stage, traders will judge the platform based on execution reliability during volatile markets, liquidation efficiency, and fee competitiveness.

If MYX succeeds in maintaining tight spreads and predictable funding rates while onboarding new traders from centralized exchanges, its valuation could expand steadily.

Looking ahead, 2026 could decide whether PUMP.fun grows beyond a viral trend into a platform users return to regularly.

However, aggressive competition from other perpetual DEXs could limit upside if differentiation remains weak.

MYX Finance (MYX) Price Prediction 2026
YearPotential Low ($)Potential Average ($)Potential High ($)
MYX Finance Price Prediction 2026$2.80$5.2$10.44

MYX Finance Price Prediction 2026 – 2030

YearPotential Low ($)Potential Average ($)Potential High ($)
2026$2.80$5.2$10.44
2027$3.90$11.5$18.9
2028$9.56$17.2$27.3
2029$16.7$25.4$38.9
2030$21.5$36.32$48.7

MYX Finance Price Prediction 2026

In 2026, MYX’s price will be influenced primarily by trader retention. Metrics such as daily active traders, average leverage usage, and liquidation fairness will determine whether users remain loyal during volatile cycles.

MYX Finance Price Prediction 2027

By 2027, MYX’s growth may depend on product sophistication. Features such as cross-margining, advanced risk controls, or institutional-grade APIs could attract professional traders seeking decentralized alternatives.

MYX Finance Price Prediction 2028

The 2028 outlook relies on market structure evolution. If decentralized derivatives capture a larger share of global futures volume, MYX could benefit significantly, particularly if centralized exchange restrictions tighten further, pushing its price to around $27.3.

MYX Finance Price Prediction 2029

In 2029, MYX may transition from an emerging DEX to an established infrastructure. At this stage, valuation would be supported by consistent protocol revenue, governance participation, and integration with broader DeFi ecosystems.

MYX Finance Price Prediction 2030

By 2030, MYX’s relevance will depend on its ability to remain competitive amid rapid innovation. If it becomes a core liquidity venue for on-chain derivatives, long-term valuation could jump to nearly $47, assuming sustained demand.

What Does The Market Say?

Year202620272030
CoinCodex$9.50$14.99$40.87
Pricepredictions$6.3$11.8$28.09
DigitalCoinPrice$7.41$18.71$37.75

CoinPedia’s MYX Finance Price Prediction

After thorough analysis, Coinpedia believes MYX Finance’s long-term outlook depends less on hype and more on execution quality and trader trust. 

If the protocol consistently delivers reliable performance during high-volatility events, MYX could outperform many speculative DeFi assets

YearPotential Low ($)Potential Average ($)Potential High ($)
2026$21.5$36.32$48.7
Never Miss a Beat in the Crypto World!

Stay ahead with breaking news, expert analysis, and real-time updates on the latest trends in Bitcoin, altcoins, DeFi, NFTs, and more.

FAQs

What is MYX Finance and how does it work?

MYX Finance is a decentralized perpetual futures exchange offering up to 50x leverage, gasless trades, and non-custodial accounts across blockchains.

Is MYX Finance a good long-term investment?

MYX’s long-term potential depends on trader adoption, platform reliability, and growth of decentralized derivatives markets through 2026–2030.

What is the MYX price prediction for 2026?

For 2026, MYX is projected to trade between $2.8 and $10.44, depending on user growth, market conditions, and protocol performance.

Can MYX reach $40 or higher by 2030?

If MYX becomes a major on-chain derivatives platform with strong liquidity and revenue, long-term forecasts suggest prices near $40–$48 by 2030.

Can SOL Price Recover Despite a 55% Q4 Correction?

Solana Price

The post Can SOL Price Recover Despite a 55% Q4 Correction? appeared first on Coinpedia Fintech News

The SOL price is currently navigating a high-stakes phase in late 2025 as strong on-chain fundamentals strictly collide with bearish market sentiment. While Solana continues to dominate usage metrics and attract institutional activity, its price action reflects broader macro caution rather than network weakness.

SOL Price and Solana’s On-Chain Performance Remain Robust

From a network perspective, Solana crypto continues to demonstrate exceptional performance. Over the past 90 days, Solana’s throughput has consistently hovered near 1,000 transactions per second, highlighting the chain’s ability to handle real-world scale. 

Can SOL Price Recover Despite a 55% Q4 Correction?

At the same time, daily transaction volumes fluctuating around 80 million indicate stable and sustained usage rather than speculative spikes.

This consistency reinforces Solana crypto’s positioning as one of the most actively used blockchains in the industry. 

In fact, commentary from ecosystem president Lily Liu suggests that Solana has processed more activity throughout 2025 than the rest of crypto combined, by a wide margin. These metrics underscore why the SOL price is often evaluated differently from smaller networks.

Institutional Adoption Strengthens the SOL Price Narrative

Beyond raw activity, institutional interest continues to build. Recently, a JP Morgan tokenized a bond on Solana, marking another step toward real-world financial adoption. Also, strengthening Solana’s credibility as an institutional-grade settlement layer rather than a purely retail-driven chain.

Similarly, ETF inflows linked to Solana have continued to rise, signaling growing acceptance from traditional capital. 

Can SOL Price Recover Despite a 55% Q4 Correction?

Likewise, its on-chain revenue offers further context. Solana’s cumulative chain revenue is approaching the $600 million mark, sitting near all-time highs. This figure reflects real economic activity generated by users, applications, and validators rather than short-lived hype.

However, the total value locked has declined. After peaking near $13.2 billion in mid-September, Solana’s TVL has fallen to roughly $9 billion. While this $4.2 billion drawdown appears large in absolute terms, percentage-wise it remains relatively contained given the broader bearish conditions across Q4 2025. As a result, TVL trends point to consolidation rather than big crash.

SOL Price Chart Shows Heavy Correction but Key Support Holds

Despite these fundamentals, the Solana price chart tells a more cautious story. Since reaching an all-time high near $295, SOL has corrected roughly 55% during Q4. Market sentiment has clearly tilted bearish, overshadowing positive network data.

Technically, the SOL price continues to hold above the $120 support zone, which remains a critical area for bulls. However, if macro conditions deteriorate further, downside scenarios extend toward the $70 region. 

Can SOL Price Recover Despite a 55% Q4 Correction?

Such a move would represent a nearly 75% decline from the peak, aligning with historical deep-cycle corrections rather than project-specific failure.

SOL Price Outlook Hinges on Sentiment vs Fundamentals

The divergence between Solana’s fundamentals and price action places SOL price at a pivotal juncture. On one hand, strong usage, rising revenue, ETF inflows, and institutional adoption argue against a prolonged collapse. On the other, macro uncertainty and technical damage continue to suppress bullish momentum.

As a result, near-term SOL price forecast scenarios remain sensitive to broader risk appetite rather than network health alone. Whether fundamentals can reclaim control over price direction will depend largely on how macro sentiment evolves in the coming months.

ADA Price at a Crossroads: Why 2025 Isn’t a Repeat of Cardano’s 2022 Collapse

ADA Price at a Crossroads: Why 2025 Isn’t a Repeat of Cardano’s 2022 Collapse

The post ADA Price at a Crossroads: Why 2025 Isn’t a Repeat of Cardano’s 2022 Collapse appeared first on Coinpedia Fintech News

The ADA price is under renewed scrutiny as a weekly indicator revives memories of Cardano’s 2022 collapse, per an popular chartist. However, while technical signals are triggering fear, the broader context in 2025 suggests a very different environment. This one seems to be shaped by deeper utility, stronger governance, and a more mature ecosystem. Why it feels this way, please continue reading to know more in detail.

ADA Price and the 2022 Supertrend Comparison

Recent discussions around the ADA price chart focus on a weekly supertrend signal that last appeared in 2022, just before an 80% correction. This was shared by popular chartist and analyst Ali Martinez on X, that doesn’t sound wrong when looking only at price action and chart.

But when we expand our view. Then, it suggests that back then in 2022, Cardano was still struggling to convert research into real adoption. As a result, technical weakness quickly cascaded into a deep structural breakdown.

ADA Price at a Crossroads: Why 2025 Isn’t a Repeat of Cardano’s 2022 Collapse

In contrast, the current ADA price USD behavior reflects a market struggling with uncertainty rather than just outright collapse. While fear remains elevated witnessing such a big collapse, but the conditions that amplified downside risk in 2022 are not fully present today.

Ecosystem Expansion Changes the ADA Crypto Narrative

One of the biggest differences lies in Cardano’s evolving utility. In 2025, ADA crypto is no longer a single-chain smart contract experiment. Instead, it is actively working to integrate Bitcoin liquidity into its DeFi ecosystem through trustless bridges and partnerships, allowing BTC holders to deploy capital while retaining Bitcoin exposure.

This structural shift reduces the probability of a straight-line repeat of 2022. Unlike before, ADA now supports a broader economic layer that was previously absent.

Usage Metrics Provide Context Beyond Price

Beyond price action, transactional data offers additional clarity. Over the past 90 days, Cardano’s transactional volume has remained relatively stable. If activity were collapsing, this consistency would not exist. This usage stability reinforces why Cardano remains among the top blockchain networks by relevance, with continued institutional interest.

Cardano takes a research-driven approach to blockchain, combining a secure proof-of-stake protocol with the eUTxO model for predictable smart contracts.

New to Cardano? Start with the Cardano Fundamentals course on @BinanceAcademy.https://t.co/40ITAACxbG

— Cardano Foundation (@Cardano_CF) December 9, 2025

The recent, Educational initiatives also play a role. Cardano foundation’s’s emphasis on research-driven development, secure proof-of-stake, and the eUTxO model has been highlighted publicly, signaling an effort to improve transparency and ecosystem literacy.

TVL Decline Still Weighs on ADA Price

That said, verbally it’s okay but charts shows that challenges still remain. According to DeFi metrics, Cardano’s total value locked has fallen sharply from a peak near $693 million in late 2024 to roughly $182 million in December 2025. This decline is significant and cannot be ignored when assessing ADA price prediction models. 

ADA Price at a Crossroads: Why 2025 Isn’t a Repeat of Cardano’s 2022 Collapse

However, perspective matters. During the 2022 crash, TVL dropped to nearly $52 million. Even after the current drawdown, Cardano still holds nearly four times that level, indicating survival rather than abandonment.

Governance Developments Add Structural Support to ADA Price

More to that, the Recent governance actions approved in December introduce another differentiating factor. These measures aim to support Cardano’s next growth phase and long-term economic sustainability. While governance upgrades do not immediately move charts, they influence long-range assumptions.

As a DRep, the Cardano Foundation has cast its votes on three live Governance Actions:

• Add Constitutional Committee Member: YES
• Net Change Limit Extension: YES
• Cardano Critical Integrations Budget: YES

Find our voting rationales and links to on-chain votes below. 🧵 pic.twitter.com/ASsyFQTncO

— Cardano Foundation (@Cardano_CF) December 12, 2025

As the ADA price remains sensitive to technical signals, its broader trajectory increasingly depends on whether ecosystem growth, governance execution, and usage stability can offset short-term market fear.

Hedera Price Prediction 2025, 2026 – 2030: Will HBAR Price Hit $0.5?

Hedera Price Prediction 2024, 2025-2030

The post Hedera Price Prediction 2025, 2026 – 2030: Will HBAR Price Hit $0.5? appeared first on Coinpedia Fintech News

Story Highlights

  • The live price of Hedera crypto is  $ 0.11941440.
  • Hedera Price prediction highlights HBAR could reach $0.750 by the end of 2025 if bullish trends continue.
  • The Long-term forecasts suggest HBAR could hit $2.20 by 2030, indicating stable growth potential.

Hedera has been making waves in the cryptocurrency space, with a fast and secure blockchain that offers a distinct approach to transaction processing compared to Ethereum and other smart contract chains. It’s permission-only, meaning the blockchain is managed by private companies. Limiting what types of decentralised applications are allowed is what makes Hedera stand out from the rest.

Having entered the top 20 digital assets by market cap in 2024, it is now eyeing a potential leap into the top 10 by the end of 2025. Hedera has also recently ramped up its development activities for its ecosystem. Its ecosystem is strengthening, despite its capped price action. With increasing real-world use cases, institutional interest, and strategic partnerships, many are closely tracking HBAR price chart 2025 to gauge how high the token can rise.

With major companies like Google, IBM, and Chainlink Labs backing the project, and discussions about SEC approved HBAR ETF would flood string liquidity. Many are intrigued that: Will the HBAR Price Reach $1? Let’s discuss this in our Hedera price prediction 2025 article.

Hedera Price Today

Cryptocurrency Hedera
Token HBAR
Price $0.1194 down -1.90%
Market Cap$ 5,072,282,376.36
24h Volume$ 106,434,147.2825
Circulating Supply42,476,304,285.1981
Total Supply50,000,000,000.00
All-Time High$ 0.5701 on 16 September 2021
All-Time Low$ 0.0100 on 02 January 2020

Hedera Price Analysis 2025: A Look Back at HBAR’s Volatile First Half

Hedera price USD began the year on a high note, peaking at $0.40 in mid-January before a steady decline took it to a low of $0.125 in early April. This downturn was caused by external factors and waning investor interest, reflected in a decrease in the Total Value Locked (TVL). 

But this tide turned in the second week of April. As a broader crypto market rally helped HBAR price break free from the wedge, it bounced off a significant support zone that had previously fueled a late 2024 rally. This support, confirmed by the Fixed Range Volume Profile (FRVP) indicator, suggested strong institutional buying interest. The momentum propelled HBAR on a remarkable surge of nearly 80%, from $0.125 to $0.228 by mid-May.

Unfortunately, this rebound was cut short by escalating geopolitical tensions, which pushed HBAR back to its April lows by the end of June. During this time, the price formed another parallel declining wedge.

Hedera Price Prediction 2025

The second half of the year started strong, with HBAR posting a significant rally in July from the $0.12 to $0.14 demand zone up to $0.30. 

However, this upward move was firmly rejected at a critical resistance point, which strongly aligned with the upper boundary of a descending triangle established since early 2025. 

This rejection fueled a sharp decline throughout August and September, which worsened further with a critical liquidation event on October 10th, momentarily pushing the price below the demand zone to $0.10. 

This dip was quickly absorbed by institutional buyers, leading to a recovery attempt that failed to flip $0.20 psychological resistance, but after a decent consolidation below this hurdle buyers accumulated it and on October 28th it saw an near 20% rise that pushed its price to $0.22, this occurred as the much-anticipated launch of the Canary HBAR ETF (HBR) on Nasdaq opened the doors for institutional investors. 

But that was the last briefest decent move recorded in Q4 2025, which was suppressed by bears and pushed HBAR/USD to reach the vital support zone of $0.12-$0.13 in early December. Historically, this region has demonstrated strong demand, also there was a perception that a rally could ignite here onwards, but by mid-decmber it has faintly breached $0.12, suggesting that another possibility has arised that suggests the weakness od this demand area, and perhaps can’t hold any longer and seeking solid support next which could be $0.072, target bears have for December. However, it’s one of the projects that have ETF, renewed pressure could build a rebound in Q1 2026, and if at that time this level rebounds, it would be a good rally.

Hedera Price Prediction 2025

HBAR Price Prediction December 2025: What’s Next for Hedera?

In December, mid-HBAR price is teasing a breakdown below $0.12; if it succeeds in breaching, a strong decline is an option towards $0.0722.

HBAR Price Prediction December 2025
MonthPotential LowPotential AveragePotential High
HBAR Price Prediction December 2025$0.125$0.27$0.40

HBAR Price Prediction 2026 – 2030

YearPotential LowPotential AveragePotential High
2026$0.45$0.80$1.05
2027$0.60$0.95$1.20
2028$0.65$1.10$1.40
2029$0.70$1.35$1.60
2030$0.95$1.70$2.20

HBAR Price Prediction 2026

Moving forward to 2026, forecast prices and technical analysis project that Hedera’s price is expected to reach a minimum of $0.45. The price could escalate to $1.05 on the higher end, with an average trading price hovering around $0.80.

HBAR Price Forecast 2027

Looking ahead to 2027, the optimism around Hedera will lead to steady growth. Hence, the HBAR price is forecasted to reach a low of $0.60, with a potential high touching $1.20 and an average forecast price of $0.95.

Hedera Price Forecast 2028

As we advance to 2028, with moderate gains, the HBAR predictions indicate that the price of a single HBAR could reach a minimum of $0.65, with the ceiling potentially rising to $1.40. Within the range, the average price will be $1.10.

HBAR Price Target 2029

By the time 2029 rolls around, it’s predicted that Hedera’s price will maintain its upward trajectory, reaching a minimum of $0.70, with the maximum price possibly reaching $1.60 and an average of $1.35, reflecting cautious optimism.

Hedera Price Prediction 2030

By the end of this decade, HBAR is predicted to touch its lowest price at $0.95, aiming for a high of $1.70 and an average price of $2.20. Hence, the prediction suggests stable long-term growth for Hedera’s market value.

Market Analysis

Firm202520262030
Changelly$0.259$0.370$1.74
priceprediction.net$0.27$0.40$1.99
DigitalCoinPrice$0.43$0.50$1.07

Coinpedia’s Hedera Price Prediction

By the end of 2025, the recovery run in HBAR prices is expected to continue with a gradual rise in momentum. Hence, by the end of 2025, Coinpedia’s HBAR price forecast expects a potential high of $0.80 with a solid support at $0.40, making an average of $0.60.

YearPotential LowPotential AveragePotential High
2025$0.40$0.60$0.80
Never Miss a Beat in the Crypto World!

Stay ahead with breaking news, expert analysis, and real-time updates on the latest trends in Bitcoin, altcoins, DeFi, NFTs, and more.

FAQs

What is the Hedera price prediction for 2025?

HBAR could reach up to $0.75 by the end of 2025 if demand rises and market conditions improve, with support expected near the $0.12–$0.13 zone.

Is Hedera a good long-term investment?

Hedera offers fast, secure transactions and steady ecosystem growth, making it appealing long-term, but investors should assess risk and market trends.

What drives Hedera’s price movements?

HBAR price shifts with market sentiment, network upgrades, real-world partnerships, and overall crypto conditions that influence investor confidence.

How high can HBAR go by 2030?

Forecasts suggest HBAR could reach around $2.20 by 2030 if adoption grows and major partnerships expand real-world blockchain use.

Ondo Price Prediction 2025, 2026 – 2030: Can Ondo Hit $10?

Ondo Price Prediction 2024 - 2030: Will ONDO Price Hit $1?

The post Ondo Price Prediction 2025, 2026 – 2030: Can Ondo Hit $10? appeared first on Coinpedia Fintech News

Story Highlights

  • The live price of Ondo Price is  $ 0.45159965
  • Ondo price could reach a high of $0.80 to $2.05.
  • With a potential surge, Ondo crypto price may hit $9.30 by 2030.

ONDO Finance in the RWA sector is a hot topic, investors are closely eyeing its future potential. Especially as its native token ONDO continues to build credibility and momentum through high-profile developments.

Moreover, Ondo Finance is known to be a leading RWA provider on the Solana chain and it is witnessing growing institutional interest, ONDO has solidified itself as a major player in the Real World Asset (RWA) space.

With such attraction, ONDO price prediction 2025 is what analysts and retail investors are intrigued about. But how far can it go from here? Let’s dive into the detailed ONDO price forecast from 2025 to 2030.

Ondo Price Today

Cryptocurrency Ondo
Token ONDO
Price $0.4516 down -1.37%
Market Cap$ 1,426,651,864.03
24h Volume$ 63,228,203.9215
Circulating Supply3,159,107,529.00
Total Supply10,000,000,000.00
All-Time High$ 2.1413 on 16 December 2024
All-Time Low$ 0.0835 on 18 January 2024

ONDO Price Analysis 2025

The biggest rise in the ONDO price was when Donald Trump won the election last year, hitting $2.148 by mid-December on Coinbase. Since then, it has continuously declined, and by April 2024, it fell to a low of $0.70.

In the entire Q2, it has seen its price action trapped in a range, despite being a leading performer in tokenized RWA’s based on Coingecko’s report that came in June 2025.

In Q2, many were anticipating that this altcoin could at least gain like last year’s first half movement, but met with a strong supply level by mid-May and declined. 

By the third week of June, it fell 35% from the mid-May high, hitting $0.61, due to geopolitical uncertainty. The H1 closed negatively, but ceasefire news between the US, Israel, and Iran gave relief to investors, and they turned their hopes to H2.

ONDO Price Prediction 2025

The performance of the ONDO price USD during the latter half of the year has certainly been captivating. From July’s price of $0.62, it saw a remarkable ascent to $1.10 in mid-September, testing a key trendline resistance. 

However, when it was unable to maintain this upward momentum, bearish sentiments took over, leading to a decline as December approached, with projections targeting the $0.20 all-time low range.

ONDO Price Prediction 2025

Looking ahead, the ONDO price movement this month hinges on market demand. If there remains a lack of activity, a downturn may be on the horizon. 

Conversely, should a bullish trend emerge in December, potentially stabilizing around $0.40, we could see an ambitious goal of surpassing $0.80, which would not only break the trendline resistance but also signal a significant shift in market dynamics.

The unfolding in the remaining December days will be crucial in determining this outcome, also a falling wedge has also manifested, that gives more odd on the bullish side for now

YearPotential LowPotential AveragePotential High
2025$0.80$1.20$2.10

ONDO Price Prediction December 2025

The ONDO/USD price action in December opened with a clear rejection from the 20-day EMA band, indicating a strong bearish dominance that suggests the price is likely to decline further without a significant market catalyst to shift sentiment back to bullish. 

However, there is a promising support level at the lower border of the falling wedge, currently around $0.40. If this level attracts demand, we can expect a potential bounce in the future. Conversely, if the price breaks below $0.40, we should anticipate even lower lows for ONDO.

ONDO Price Prediction December 2025
YearPotential LowPotential AveragePotential High
2025$0.80$1.20$2.10

ONDO Price Analysis: Onchain Outlook

The on-chain data indicates that although the price is currently capped and has been consolidating for several months, the on-chain metrics have strengthened significantly despite the weak ONDO price action. 

Since January 2024, the number of confirmed transactions sent to a project’s contracts has increased. By October 2025, the project had surpassed 1.2 million transactions, making it the second-largest project for real-world asset (RWA) issuance after BitGo.

ONDO On Chain Data

Additionally, the Ondo TVL (Total Value Locked) metric indicates that the total USD value of outstanding tokens across Ondo’s tokenized yield product has reached an all-time high of $1.4 billion. This suggests that adoption is increasing, as well as the influx of funds into ONDO at a favorable rate.

ONDO Cryptocurrency Price Target 2026 – 2030

YearPotential Low ($)Potential Average ($)Potential High ($)
20261.652.754.15
20272.203.655.25
20282.954.306.90
20294.755.608.45
20305.357.459.30

Ondo Coin Future Forecast 2026

The price projection of ONDO crypto for 2026 could range between $1.65 to $4.15, with an average trading price of roughly $2.75.

Ondo Token Price Prediction 2027

This altcoin could hit a potential high of $5.25 in 2027, with a potential low of $2.20, and an average price of $3.65.

ONDO Price Prediction Next Bullrun 2028

By 2028, forecasts indicate a potential low of $2.95 and a high of $6.90. This could bring the average price to $4.30.

Ondo Price Forecast Long-term 2029

During 2029, the price of the Ondo token is anticipated to reach a minimum of $4.75, with a maximum of $8.45, and an average price of $5.60.

ONDO Coin Price Growth Potential 2030

ONDO coin price may reach a high of $9.30 in 2030. With a potential low of $5.35. With this, the average price could settle at around $7.45.

Market Analysis

Firm Name202520262030
Changelly$1.32$1.87$8.26
priceprediction.net$1.34$2.03$8.43
DigitalCoinPrice$2.01$2.29$5.01

CoinPedia’s Ondo Price Targets

CoinPedia’s price prediction for Ondo is extremely volatile. This is due to this altcoin’s highly fidgety nature. If the crypto market successfully regains momentum, this ETH-based token may surge toward a new high.

With this, the Ondo Price Prediction for this year could range between $3.05 as its high and $1.19 as its potential low.

We expect the Ondo Price to reach $3.05 in 2025.

YearPotential LowPotential AveragePotential High
2025$1.19$2.12$3.05

Also read, Arbitrum Price Prediction 2025, 2026 – 2030!

Never Miss a Beat in the Crypto World!

Stay ahead with breaking news, expert analysis, and real-time updates on the latest trends in Bitcoin, altcoins, DeFi, NFTs, and more.

FAQs

How much is Ondo crypto worth today?

At the time of writing, the price of the Ondo token was  $ 0.45159965.

What is ondo in crypto?

Ondo project is a Decentralized Financial (DeFi) platform. It is known to offer risk-isolated, fixed-yield loans backed by yield-generating cryptocurrency assets.

Where is the Ondo coin listed?

The token is available for buying and selling on all the major centralized exchange platforms.

Can Ondo reach $100?

For the Ondo token to reach $100, it will require a surge of 9800.99% from its current valuation.

How to buy Ondo crypto?

One can buy, hold, or sell Ondo crypto tokens by creating a wallet on a centralized cryptocurrency exchange.

When was Ondo Crypto launched?

The project made its presence in 2021. However, its native token “ONDO” made its first appearance in 2024.

Will the ONDO price increase?

With a potential surge, this altcoin may record a high of $11.75 during 2030 with an average trading price of $9.30.

Are Weak ETF Inflows Holding LINK Price Back? Is It Gonna Hit $8?

LINK Price Prediction December 2025: Is a $60M LINK Short Squeeze Possible?

The post Are Weak ETF Inflows Holding LINK Price Back? Is It Gonna Hit $8? appeared first on Coinpedia Fintech News

The LINK price remains capped and under bearish pressure despite there being strong signs of sustained accumulation and a growing narrative that positions Chainlink as foundational infrastructure for on-chain finance. While exchange balances continue to fall and enterprise adoption accelerates, LINK price USD action suggests the market is still struggling with short-term demand constraints, and LINK ETF’s declining inflows kind of proves that.

LINK Crypto’s Infrastructure Narrative Continues to Expand

Fundamentally speaking, Chainlink crypto is a very strong asset and can be viewed as one of the top blue-chip projects in the industry. As it is increasingly viewed as the backbone of on-chain finance, similar to how Microsoft’s operating systems ruled early enterprise computing. 

By setting data, interoperability, and security standards, Chainlink is kind of enabling financial institutions to transition from traditional digital systems toward onchain infrastructure.

Chainlink is today’s equivalent of Microsoft in 1990.

At that time, personal computers were still primarily the domain of hobbyists and tinkerers rather than the backbone of enterprise operations. The release of Windows 3.0 changed that trajectory. It established the standard… pic.twitter.com/fPzQFjy95y

— Rory (@rorypiant) December 12, 2025

This project’s efforts demonstrate that global finance is gradually migrating onto the blockchain. If that shift accelerates, Chainlink’s role will be supreme, similar to what Nvidia, Microsoft, and even Apple have, which’s a standardized middleware layer that could become indispensable. This factor alone is reinforcing long-term utility beyond speculative cycles.

Exchange Balances Signal Silent Accumulation

Not just verbally, it’s growing; even on-chain data shows a notable decline in LINK exchange balances, which suggests that accumulation is happening. On October 13, exchanges held approximately 167 million LINK tokens, a figure that has since dropped like a falling knife to 127.8 million LINK. 

Are Weak ETF Inflows Holding LINK Price Back? Is It Gonna Hit $8?

Such a sharp reduction is an open book example of how LINK crypto tokens are being bought every day, while retail keeps discarding it due to sector-wide pessimism. The big and wise investors are involved in this game, making long-term investments rather than short-term trades.

However, the LINK price chart has not reflected this accumulation, because if it does rise, the smart money won’t be able to buy at discounts more easily. Instead, they deliberately chose for its price to bleed slowly, so the more the decline, the better their profits will be in the future, which only the wise can understand. 

That shows that retail distribution is being absorbed by larger participants. This dynamic explains why selling pressure persists without sharp breakdowns, keeping the LINK price USD suppressed but structurally supported.

ETF Flows Fail to Reinforce Buying Pressure in LINK Price

Despite the introduction of a LINK ETF early December 2025, institutional flows have remained underwhelming. Total cumulative net inflows currently stand near $52.67 million, with recent inflows failing to cross even $10 million during December. While there have been no notable outflows so far, the lack of sustained inflows signals limited conviction from traditional capital.

Are Weak ETF Inflows Holding LINK Price Back? Is It Gonna Hit $8?

Without stronger ETF participation, LINK price forecast models remain constrained, as spot accumulation alone has not been sufficient to drive upside momentum. Continued stagnation could risk eventual outflows, which would add further downside pressure.

Technical Structure Shows Rising Risk

From a technical perspective, LINK price is losing alignment with its ascending trendline. This weakening structure increases the probability of further downside if demand does not materialize. If the current trend persists, LINK price prediction scenarios point toward a potential test of the $8 region.

Support is gone for Chainlink $LINK!

$8 comes into focus. pic.twitter.com/Fro3XHLFf2

— Ali (@alicharts) December 12, 2025

At the same time, the divergence between long-term accumulation and short-term technical weakness highlights the broader tension within the market. While Chainlink’s fundamentals continue to strengthen, price action remains dependent on renewed demand and institutional participation.

XRP Price Holds $2 as Ripple’s OCC Bank Approval Redefines Crypto’s Institutional Path

XRP Price Holds $2 as Ripple’s OCC Bank Approval Redefines Crypto’s Institutional Path

The post XRP Price Holds $2 as Ripple’s OCC Bank Approval Redefines Crypto’s Institutional Path appeared first on Coinpedia Fintech News

The XRP price is currently in a decisive standoff, as its price is capped despite robust fundamentals, but a wavering market sentiment is preventing it from rising. Ripple’s recent regulatory breakthrough represents a historic shift for the crypto landscape, yet the XRP price has yet to show some response on the chart.

So far, it has been missing significant moves from many positive news stories, similar to other altcoins this quarter, but reflecting negative news immediately on the chart. However, unlike any other altcoin, the resilience in holding $2 is still commendable, and that was only possible for XRP due to its fundamentals, consistent demand, and the trust its investors have in it. Now, people are closely monitoring whether the $2 level will maintain its stability.

Ripple’s OCC Approval Signals a Structural Shift

Ripple recently received conditional approval from the U.S. Office of the Comptroller of the Currency to charter Ripple National Trust Bank. This development places Ripple directly under federal banking oversight, aligning its operations with both OCC and NYDFS standards.

From a structural perspective, this approval elevates Ripple beyond a payments-focused crypto firm into regulated financial infrastructure. The move strengthens the foundation for RLUSD while positioning XRP as a compliant settlement asset connecting fiat rails, stablecoins, and tokenized assets.

HUGE news! @Ripple just received conditional approval from the @USOCC to charter Ripple National Trust Bank. This is a massive step forward – first for $RLUSD, setting the highest standard for stablecoin compliance with both federal (OCC) & state (NYDFS) oversight.

To the…

— Brad Garlinghouse (@bgarlinghouse) December 12, 2025

Importantly, this milestone addresses long-standing criticism that crypto operates outside traditional financial rules. Instead, Ripple now operates within them under direct supervision.

XRP’s Utility Narrative Strengthens Despite Price Silence

Although this announcement did sparked intense discussion across crypto communities, but the XRP price chart seems to have digested this one too, showing little immediate reaction. This disconnect highlights the current environment where macro sentiment outweighs individual project advancements.

Under the new framework, XRP’s role is improving but markets often delay repricing until usage metrics and liquidity flows reflect these changes.

For now, XRP crypto fundamentals appear to be accelerating faster than price .

Market Sentiment Keeps XRP Range-Bound

Despite positive developments, broader market sentiment remains cautious. Risk appetite across crypto has weakened, limiting follow-through even on major news. As a result, XRP price USD continues to trade defensively near the $2 psychological zone.

Technically, XRP is in a consolidation phase in 2025, where buyers consistently defend $2, while upside attempts fail to attract sustained momentum. This behavior suggests distribution rather than accumulation, reinforcing short-term uncertainty.

As long as sentiment remains subdued, XRP price prediction models remain restrained.

XRP Price Holds $2 as Ripple’s OCC Bank Approval Redefines Crypto’s Institutional Path

From a technical standpoint, the $2 level has become the most important reference point on the XRP price chart. Repeated defenses of this zone indicate longer-term holder confidence, yet each failed recovery adds pressure.

If sentiment does not improve, downside risk remains open. A loss of $2 could expose XRP/USD to deeper retracement levels near $1.20, according to prevailing technical projections.

Meanwhile, as Ripple’s regulatory positioning continues to mature, the divergence between price action and fundamentals leaves XRP price at a pivotal turning point, and what comes next depends purely on improving market sentiment in future weeks or months.

Ripple XRP Price Prediction 2025, 2026-2030: Will XRP Reach $5?

Ripple XRP Price Prediction

The post Ripple XRP Price Prediction 2025, 2026-2030: Will XRP Reach $5? appeared first on Coinpedia Fintech News

Story Highlights

  • The Live Price Of XRP  $ 1.99543932
  • Predictions suggest XRP could reach $5.05 by the end of 2025.
  • Long-term projections show XRP could hit $26.50 by 2030 and $526 by 2050.

XRP price currently stands at $2.99, with a market capitalization of $179.79 billion. Analysts and AI forecasts alike suggest that XRP could reach $5.05 by the end of 2025. Long-term XRP price predictions also place it as high as $26.50 by 2030, with an ultra-bullish target of $526 by 2050.

Ripple (XRP) remains one of the top five crypto assets in the world, gaining traction as institutional adoption ramps up and its prolonged legal battle approaches resolution. Since President Trump’s return to office, XRP has seen a resurgence in on-chain activity, investor sentiment, and speculation around potential ETF approval.

In July 2025, XRP marked a new all-time high of $3.66, coinciding with the ProShares Ultra XRP ETF launch. As more asset managers have filed for the ETF approval race, the crypto community is now asking: How high can XRP go?

XRP Price Today

Cryptocurrency XRP
Token XRP
Price $1.9954 down -1.48%
Market Cap$ 120,707,087,244.07
24h Volume$ 1,875,822,433.2220
Circulating Supply60,491,484,708.00
Total Supply99,985,744,733.00
All-Time High$ 3.8419 on 04 January 2018
All-Time Low$ 0.0028 on 07 July 2014

XRP Price Prediction December 2025

The XRP price has recently established a falling wedge pattern in Q4, indicating a possible price rise if a favorable event prompts a breakout from this structure upward. 

Currently, December has begun with a downturn, and the $2.00 support level has been retested, despite the FOMC news being positive regarding the rate cut decision. A rebound was expected, but investor demand remained muted nonetheless. 

However, if it dips below this support level, the next target will be $1.80, and beneath this $1.63. If the price rises, it will need to exceed $2.62 to achieve even greater heights.

XRP Price Prediction December 2025
MonthPotential LowPotential AveragePotential High
December 2025$1.50$3.00$4.00

XRP Price Predictions for December 2025 by AI Platforms

PlatformLow PriceAverage PriceHigh Price
Claude$3.00 – $3.15$3.50 – $4.00$7.50 – $8.20
Blackbox$2.50$3.50$5.00
Gemini$3.00 – $4.00$4.50 – $6.00$6.50 – $8.00+

XRP Price Prediction 2025

During the latter half of the year, the XRP/USD pair on Coinbase exhibited significant price fluctuations. A standout moment occurred in July when it surged to an impressive peak of $3.66. However, following this excitement, the price gradually retreated to around $1.80 by November. 

As of late November, XRP/USD tested the vital $1.80 support level, showcasing encouraging signs of recovery with a notable 20% increase back above the $2 threshold. But this rise and fall is consistently happening inside a defined channel, which reflects a broader downtrend going on since the July ATH.

December started on a bearish note, retreating from the 20-day EMA band, and it appears to be approaching the $1.80 support level again. The price action for now may be weak, but the fundamentals are strongly aligned, and it’s a matter of time and a catalyst that will provide new price action for XRP/USD.

To avoid a prolonged decline, XRP price analysis 2025 suggests that it must find stability and must bounce above $2.35 to break the upper border of the channel.

XRPUSD Price Chart

Conversely, if XRP price continues to follow the prevailing downtrend, there is a significant risk that it could experience another substantial decline in the final month of the year, potentially testing lower support levels and impacting overall market sentiment. The upcoming weeks will be crucial for investors and analysts alike to monitor the market dynamics surrounding XRP’s performance.

YearPotential LowPotential AveragePotential High
2025$2.05$3.45$5.05

XRP Price Analysis 2025: Onchain Outlook

The XRP Ledger: DEX Transaction Count chart indicates a significant bullish divergence starting from May 2025. While the price is consolidating, the activity in decentralised exchanges (DEX) is increasing sharply.

The high transaction volume, which includes both orders placed and cancelled, shows that experienced traders are actively positioning themselves and adding liquidity in anticipation of a future price movement.

XRP Ledger DEX Transaction Count

As a result, this on-chain metric suggests that the market is preparing for a powerful and sustainable rally in the XRP price ahead.

XRP On Chain Data

Also, the biggest fact right now in December is that altcoin liquidity is drying up. Projects securing new liquidity channels like ETFs have a better chance of long-term survival, and since November 14th, the XRP ETF has been seeing positive inflows consistently, despite what price action is, and so far, Cumulative Total Net Inflow has crossed $756 million, while total net assets are worth $723.05 million, by December 1st.

Ripple XRP Price Prediction 2026 – 2030

YearPotential Low ($)Potential Average ($)Potential High ($)
XRP Price Prediction 20265.506.258.50
Ripple Price Prediction 20277.009.013.25
XRP Price Prediction 202811.2513.7516.00
XRP Price Prediction 202914.2516.5021.50
XRP Price Prediction 203017.0019.7526.50

This table, based on historical movements, shows XRP price prediction 2030 to reach $26.50 based on compounding market cap each year. This table provides a framework for understanding the potential XRP price movements. Yet, the actual price will depend on a combination of market dynamics, investor behavior, and external factors influencing the cryptocurrency landscape.

Ripple (XRP) Price Projection 2031, 2032, 2033, 2040, 2050

Based on historic price sentiments and XRP’s rising popularity, here are the XRP future price projections beyond 2030, where Ripple price forecasts suggest that it has become more speculative. Therefore, assuming continued adoption and dominance, XRP may see aggressive valuations in the decades ahead.

YearPotential Low ($)Potential Average ($)Potential High ($)
203125.0029.5035.25
203231.5036.7541.25
203335.7542.2547.75
204097.50135.50179.00
2050219.25331.50526.00

A look at this table, highlights the XRP price prediction 2040 and XRP price prediction 2050 potential high ambitious targets but this reflect a transformative vision for XRP as a dominant global payment player.

Market Analysis

Firm Name202520262030
Changelly$2.05$3.49$17.76
Coincodex$2.38$1.83$1.66
Binance$2.16$2.27$2.76

Institutions XRP Price Target For 2025

Name2025
Standard Chartered$5.50
Sistine Research$33 to $50
Never Miss a Beat in the Crypto World!

Stay ahead with breaking news, expert analysis, and real-time updates on the latest trends in Bitcoin, altcoins, DeFi, NFTs, and more.

FAQs

How high could XRP go by the end of 2025?

Analysts predict XRP could reach $5.05 by December 2025 if bullish momentum continues and key resistance levels are broken.

What factors influence XRP’s price movement?

XRP price is influenced by ETF approvals, on-chain activity, investor sentiment, legal developments, and broader crypto market trends.

Is XRP a good investment in 2025?

XRP shows bullish signs with strong on-chain activity and ETF interest, but investors should watch key support and resistance levels carefully.

What will XRP be worth in 2030?

XRP could reach an average of $26.50 by 2030, driven by growing adoption, institutional interest, and market expansion.

What is the XRP prediction for 2040?

XRP’s price could range from $97.50 to $179 by 2040, reflecting potential long-term adoption as a global payment solution.

What will XRP be worth in 2050?

XRP might reach between $219 and $526 by 2050 if it becomes a dominant digital asset with widespread global usage.

Bitcoin Price Prediction 2025, 2026 – 2030: How High Will BTC Price Go?

Bitcoin Price Prediction

The post Bitcoin Price Prediction 2025, 2026 – 2030: How High Will BTC Price Go? appeared first on Coinpedia Fintech News

Story Highlights

  • Bitcoin is currently trading at: $ 89,261.05209268
  • Predictions suggest BTC could reach $175K in 2025.
  • Long-term forecasts estimate BTC prices could hit $900K by 2030.

The Bitcoin price prediction for 2025 is becoming aggressively bullish as in the year’s second half, July, a new ATH has been marked, smashing previous all-time highs of $112K.

As a wave of bullish momentum sweeps into the market, investors and traders are intrigued by its next stop, as it has entered a price discovery mode. 

This optimism has been directly fueled by massive inflows into spot Bitcoin ETFs, skyrocketing institutional adoption, much clearer regulations, and unwavering political support from figures like President Trump.

It’s now seen as “a hedge against inflation” more than ever, and the cryptocurrency is capturing global attention. Major players like MicroStrategy, Metaplanet, Trump Media, and several other entities are boldly adding BTC to their balance sheets, signaling unshakable adoption and confidence in its future. 

With the Federal Reserve hinting at future rate cuts and market enthusiasm at a fever pitch, investors are buzzing with questions: “Can Bitcoin sustain its meteoric rise?” and “Will it redefine the financial landscape in the next five years?” This Bitcoin price prediction dives deep into the trends driving this historic rally. Read on for the full scoop.

What is the Bitcoin price prediction for today?

The BTC price may range between $89,586.98 and $92,099.35 today.

Bitcoin Price Today

Cryptocurrency Bitcoin
Token BTC
Price $89,261.0521 down -1.15%
Market Cap$ 1,781,851,972,703.47
24h Volume$ 47,681,450,081.39
Circulating Supply19,962,256.00
Total Supply19,962,256.00
All-Time High$ 126,198.0696 on 06 October 2025
All-Time Low$ 0.0486 on 14 July 2010

CoinPedia’s Bitcoin (BTC) Price Prediction

Firstly, at CoinPedia, we feel optimistic about Bitcoin’s price increase. Hence, we expect the BTC price to create a 2025 high of ~$168,000.

YearPotential LowPotential AveragePotential High
2025$71,827.81$119,713.02$167,598.22

Bitcoin Price Analysis 2025

The Bitcoin price performance observed since 2024 has demonstrated an upward trend within a defined upward channel. However, the initial swing low was reached in 2023 at around the $16,000 area.

Since then, a bull market began that reached 2021’s high around $70,000 by early 2024, with a decent pullback rally that continued flipping this high and reached $108,000 in early 2025, and Q3 of 2025 marked an ATH of $126,296.

Bitcoin Price Analysis 2025

This advancement marked a huge 675% surge in 1008 days when it reached ATH, but this price action of multi-year was happening inside a broadening ascending wedge. And Q4 2025 is seeing a decline from the upper border of this reliable old pattern.

Even the two-year parallel ascending channel has also confirmed a breakdown from the lower border, suggesting a significant decline is forthcoming.

Since the price action doesn’t fall straight, the year is also about to conclude next month. So, bulls are trying to show a little fight, even FOMC news didn’t generate any momentum. It appears that bears are still influencing BTC’s price action. The current zone of $90K is key; losing it here will let BTC slide back to $80K, and if this fails too. Then the $70K to $75K range would be retested next, where a demand could arise that might trigger a rebound, and the rally could extend to new highs as well.

However, if bulls fail to present a proper fight around the $70,000 to $75,000 support area, then the BTC will fall further, as it could trigger a price action that traps long buyers, potentially leading to a decline towards $53,489 in the first half of next year.

Bitcoin Price Prediction December 2025

The Bitcoin price forecast December 2025 suggests that this month will play a pivotal role in determining the future direction of BTC. As we in the final days of fourth quarter, Bitcoin has experienced a decline, dropping below the $100K mark to a low of $80,600, prompting investors to be more cautious. At the start of December, Bitcoin faced resistance at $ 94,000, but a slight uptick has only intensified concerns among investors.

Currently, the price is stabilizing within the $ 89,000 to $ 90,000 support range. Even the FOMC meeting on the 10th failed to spark any significant movement. There’s still a lack of new demand in driving price action, indicating that investors remain wary or are anticipating further price corrections.

It’s possible that the price could dip even lower, presenting an opportunity for investors to buy at more favorable levels. While the recent positive price movement might appear encouraging, but it seems temporary, as the bears may soon take full control of the market.

Bitcoin price prediction December 2025
MonthPotential LowPotential AveragePotential High
December 2025$80,000-$95,000$100,000 – $108,000$115,000 – $118,000

Bitcoin AI Price Prediction For December 2025

Source / PlatformLow Price (USD)Average Price (USD)High Price (USD)
Gemini (AI-assisted)$110,000 – $125,000$130,000 – $150,000$160,000 – $180,000+
ChatGPT (OpenAI)$92,000$117,000$138,000
BlackBox AI$100,000$125,000$150,000

Bitcoin Price Prediction 2025: Onchain Outlook

The on-chain data has showed strong accumulation in 2025 and sustained declines in exchange reserves. Crucially, this confirms the elevated institutional commitment, which is evident even in the US Spot ETFs data figures and the corporate adoption also reinforces this trend, with public company holdings nearly doubling since the start of the year.

Bitcoin price prediction 2025  Onchain Outlook

Ultimately, a Bitcoin price prediction 2025 suggests that the future potential depends strictly on how sustained buying demand remains, as well as geopolitical stability and regulatory clarity. 

If the current bullish sentiment persists, the BTC price is expected to reach a cycle high target of $150,000. Conversely, should global uncertainty intensify and sentiment turn negative, the downside risk is projected to find strong support around the $70,000 mark.

YearPotential LowPotential AveragePotential High
2025$70K$120K$175K

Also Read: What is Bitcoin? An In-Depth Guide To The King Of Digital Currencies

Bitcoin Crypto Price Prediction 2026 – 2030

YearPotential Low ($)Potential Average ($)Potential High ($)
BTC Price Forecast 2026150K200K230K
BTC Price Prediction 2027170K250K330K
Bitcoin Predictions 2028200K350K450K
BTC Price 2029275K500K640K
Bitcoin Price Prediction 2030380K750K900K

BTC Price Forecast 2026

The BTC price range in 2026 is expected to be between $150K and $230K.

BTC Price Prediction 2027

Subsequently, the Bitcoin price range can be between $170K to $330K during the year 2027. 

Bitcoin Predictions 2028

With the next Bitcoin halving, the price will see another bullish spark in 2028. Specifically, as per our Bitcoin Price Prediction, the potential BTC price range in 2028 is $200K to $450K. 

BTC Price 2029

Thereafter, the BTC price for the year 2029 could range between $275K and $640K.

Bitcoin Price Prediction 2030

Finally, in 2030, the price of Bitcoin is predicted to maintain a positive trend. Indeed, the BTC price is expected to reach a new all-time high, ranging between $380K and $900K.

Bitcoin Price Prediction 2031, 2032, 2033, 2040, 2050

Based on the historic market sentiments and trend analysis of the largest cryptocurrency by market capitalization, here are the possible Bitcoin price targets for the longer time frames.

YearPotential Low ($)Potential Average ($)Potential High ($)
2031$540,830.43$901,383.47$1,261,936.86
2032$757,162.60$1,261,936.86$1,766,711.60
2033$1,059,945.80$1,766,711.60$2,473,477.75
2040$5,799,454.28$9,665,757.13$13,532,059.98
2050$161,978,188.65$269,963,647.74$377,949,106.84

Bitcoin Prediction: Analysts and Influencers’ BTC Price Target

Firm Name2025
Standard Chartered$200K
VanECk$180K
10x Reserach$122K
Fundstrat$250K
Blackrock$700K
  • As per the Bitcoin price forecast by Blockware Solutions, the price of 1 BTC could hit $400,000
  • Cathie Wood predicts the price of BTC to achieve the $3.8 million mark by 2030.
  • Michael Saylor-led MicroStrategy expects Bitcoin to soar beyond $13 million by 2045.
  • ARK Invest has increased its bullish BTC price target to $2.4 million by 2030.
Never Miss a Beat in the Crypto World!

Stay ahead with breaking news, expert analysis, and real-time updates on the latest trends in Bitcoin, altcoins, DeFi, NFTs, and more.

FAQs

What is the Bitcoin price prediction for 2025?

Most forecasts expect Bitcoin to stay bullish in 2025, with potential highs around $175K if strong demand, ETF inflows, and adoption continue.

Will Bitcoin hit $1 million by 2030?

While some long-term forecasts are extremely bullish, reaching $1 million by 2030 is speculative. Current credible estimates suggest a potential high around $900,000 by 2030.

Is Bitcoin a good hedge against inflation?

Yes, Bitcoin is increasingly viewed as a digital inflation hedge. Its fixed supply contrasts with expanding fiat currencies, attracting investors seeking to preserve purchasing power.

How much will Bitcoin be in 10 years?

Bitcoin could trade significantly higher in 10 years, with some forecasts expecting it to reach several hundred thousand dollars if adoption keeps growing.

Cardano Price Prediction 2025, 2026 – 2030: Will ADA Price Hit $2?

Cardano Price Prediction

The post Cardano Price Prediction 2025, 2026 – 2030: Will ADA Price Hit $2? appeared first on Coinpedia Fintech News

Story Highlights

  • The live price of the Cardano token is  $ 0.40038423.
  • ADA Price prediction suggests potential to reach $2.05 by year-end 2025.
  • Long-term forecasts indicate ADA could hit $10.25 by 2030.

The Cardano price prediction for 2025 is generating significant buzz in the crypto market, particularly as we have entered Q3 2025 with July. The transformative Plomin Hard Fork, implemented in Q1, has played a crucial role in this momentum, especially with the announcement of full decentralized governance.

This landmark upgrade has reinforced Cardano’s commitment to community-driven innovation, leading to a strengthening of its internal ecosystem. Even bigger institutions like Grayscale have been applauding the project’s vision and gave 1/5th allocation in its fund.

Industry leaders like IOHK and EMURGO are also actively advancing the Cardano ecosystem. EMURGO’s partnership with Ctrl Wallet on July 2, 2025, has enhanced Cardano’s interoperability, enabling connections to over 2,300 blockchains. 

Moreover, community-driven initiatives focusing on scalability, privacy through the Midnight chain, and integration with Bitcoin DeFi are paving the way for substantial growth.

Additionally, Bloomberg analysts have raised odds of potential spot ADA ETF approvals, and strong technical indicators signaling positive trends, investor enthusiasm is at an all-time high. Questions abound: “Will Cardano spearhead the altcoin movement?” and “What heights can ADA reach by 2050?” Explore this Cardano price prediction for 2025 and beyond, filled with expert insights and ambitious forecasts.

Coinpedia’s Cardano Price Prediction 2025

Cardano (ADA) is predicted to reach a potential high of $2.05 in 2025, driven by hopes of ETF approval, full decentralization after the Plomin Hard Fork, and increasing institutional interest. However, if ADA fails to hold above key support, it may range between $0.85 and $1.25.

Cardano Price Today

Cryptocurrency Cardano
Token ADA
Price $0.4004 down -2.94%
Market Cap$ 14,377,922,485.88
24h Volume$ 456,299,333.6917
Circulating Supply35,910,312,071.2930
Total Supply44,994,648,277.4536
All-Time High$ 3.0992 on 02 September 2021
All-Time Low$ 0.0174 on 01 October 2017

Cardano Price Prediction December 2025

From January to November 2025, the price of Cardano (ADA) has undergone a significant decline, particularly notable after reaching an impressive peak of $1.32 in December 2024. This sharp decrease highlights the volatility in the market, where prices can fluctuate dramatically.

Upon examining the Cardano price chart, a falling wedge formation has emerged during this downward trend. This pattern often indicates a potential reversal, when all conditions are met to shift the trend with a strong catalyst involved. The pattern itself is suggesting that a bullish trend could follow after the current bear market. 

The recent downturn followed a brief attempt to regain a foothold above the vital $1 threshold in August 2025, but Cardano’s price has been on a correction and is now likely to test the support range of $0.27-$0.30 as the year nears its end.  

In November, the situation worsened as Cardano fell below the significant support level of $0.50, and by the month’s end, the price hovered around $0.40, highlighting the persistent bearish trend.

Cardano Price Prediction December 2025

As we moved into December after concluding November, the price stabilized around $0.40 in early December. It was expected that the FOMC meeting on 10th December would show a rally, but even in the wake of the FOMC news, it continues to trade within the same demand area. This suggests that demand has yet to fully materialize on the charts, indicating a cautious sentiment among investors at this time.

However, it is crucial to recognize the importance of establishing a robust support zone, now, where the current area feels somewhat lacking in this regard. An expected decline towards the range of $0.27 to $0.30 could solidify that support. 

If the price can maintain stability within this zone, it will not only prevent further declines but also set the stage for a potential recovery for Q1 2026. Should Cardano demonstrate resilience in this area, it would signal the beginning of a positive shift, ultimately boosting the confidence of traders and investors alike.

ADA Price
Price PredictionPotential Low ($)Average Price ($)Potential High ($)
December 2025$0.25$0.92$1.32

Cardano AI Price Prediction For December 2025

SourceLow PriceAverage PriceHigh Price
Gemini$0.85 – $0.95$1.00 – $1.20$1.30 – $1.50+
BlackBox$0.65$1.00$1.50
ChatGPT$0.75$0.95$1.25

ADA Price Prediction 2025

Additionally, if ADA/USD retests the strong demand area at $0.30 by the end of 2025, a reversal could be more pronounced, potentially resulting in a breakout of the weekly falling wedge pattern. 

However, the price could regain momentum in the first half of 2026, reaching $2.20, only if it manages to close above the $1.10 range. If this happens, then the odds of ADA’s price intention for a long-term rally would drastically increase. 

ScenarioPotential LowAverage PricePotential High 
Without ETF Approval$0.85$1.10$1.25
With ETF Approval + Retail Surge$1.20$1.65$2.05
Bullish Breakout (with ETF & macro support)$1.50$2.05$2.80

Cardano (ADA) Price Prediction 2026 – 2030

Price PredictionPotential Low ($)Average Price ($)Potential High ($)
20262.753.003.25
20274.504.755.00
20285.255.505.75
20296.757.257.75
20309.009.7510.25

This table, based on historical movements, shows ADA prices to reach $10.25 by 2030 based on compounding market cap each year. This table provides a framework for understanding the potential Cardano price movements. Yet, the actual price will depend on a combination of market dynamics, investor behavior, and external factors influencing the cryptocurrency landscape.

Cardano Price Prediction 2031, 2032, 2033, 2040, 2050

YearPotential Low ($)Potential Average ($)Potential High ($)
203110.5011.0011.25
203213.7514.2514.75
203317.5018.5019.75
204034.2551.7569.25
2050128.25228.75329.50

Based on the historic market sentiments and trend analysis of the altcoin, here are the possible Cardano price targets for the longer time frames.

Market Analysis

Firm Name202520262030
Changelly$0.752$1.18$6.05
Coincodex$0.79$0.53$0.89
Binance$0.79$0.83$1.01

*The aforementioned targets are the average targets set by the respective firms.

Coinpedia’s Price Analysis provides you with the latest content on the recent market trend that enables you to get closer to the price movements & actions of the various cryptocurrencies.

Never Miss a Beat in the Crypto World!

Stay ahead with breaking news, expert analysis, and real-time updates on the latest trends in Bitcoin, altcoins, DeFi, NFTs, and more.

FAQs

How high could Cardano go by the end of 2025?

According to our Cardano price prediction, the altcoin’s price could hit a maximum of $2.05 in 2025. 

What is the price of one ADA token?

At the time of writing, the price of 1 Cardano ADA token was  $ 0.40038423

Is Cardano a good investment in 2025, amidst newer higher-performing entrants?

Cardano is an underrated investment and has a high chance of performing in the next couple of years, considering the plethora of applications.

Is Cardano dead?

Cardano is not dead, as it is witnessing major developmental upgrades, which could boost ADA’s price in the near future. 

Can Cardano overtake Ethereum?

Even the most bullish of Cardano supporters acknowledge that Cardano will only potentially surpass Ethereum within 18 to 20 years.

How much would the price of Cardano be in 2040?

As per our latest ADA price analysis, Cardano could reach a maximum price of $69.33.

How much will the ADA coin price be in 2050?

By 2050, a single Cardano price could go as high as $329.56.

How much is 1 Cardano worth in Canada?

At the time of press, the Cardano price CAD is $0.9141.

❌