Reading view

Bitcoin Price Prediction: After Losing $81K and $75.3K, is BTC Plunging Below $60,000?

Bitcoin Dips Below $89,000 as Bull Correction Deepens— What’s Next for BTC Price

The post Bitcoin Price Prediction: After Losing $81K and $75.3K, is BTC Plunging Below $60,000? appeared first on Coinpedia Fintech News

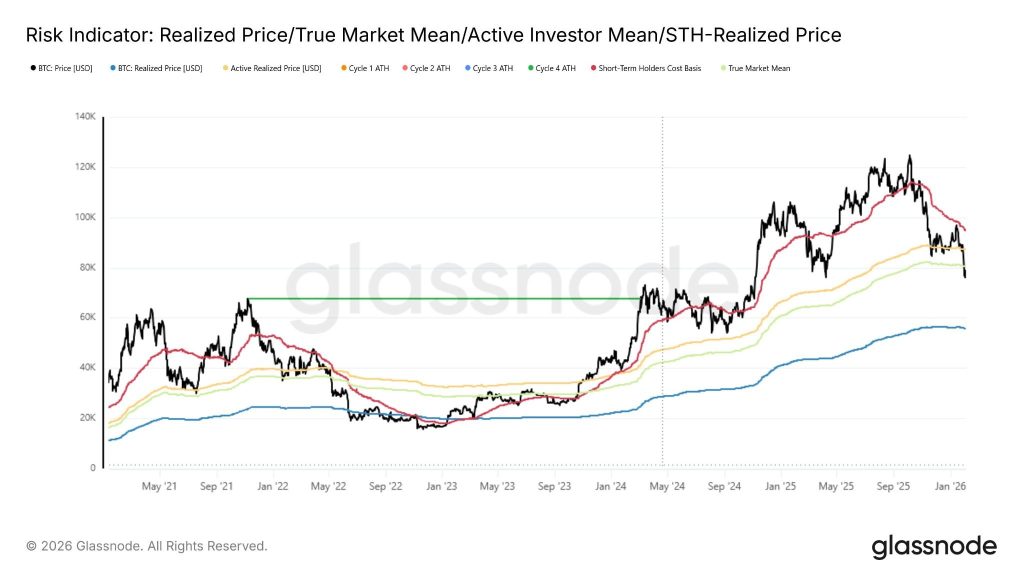
Bitcoin price has officially erased all the gains incurred in the past couple of years, specifically after Donald Trump was elected as the president of the US. The current trade dynamics and the market structure suggest Bitcoin bears may still be in control, highlighting the possibility of a deeper correction in the coming days. 

The BTC price has come under pressure after losing key support zones between $75,000 and $81,000, shifting the short-term market structure in favour of the bears. With the momentum fading and volatility picking up, the attention has now shifted to the next major support and resistance zones. 

BTC Price Rally Resembles a ‘Liquidity Hunt’ 

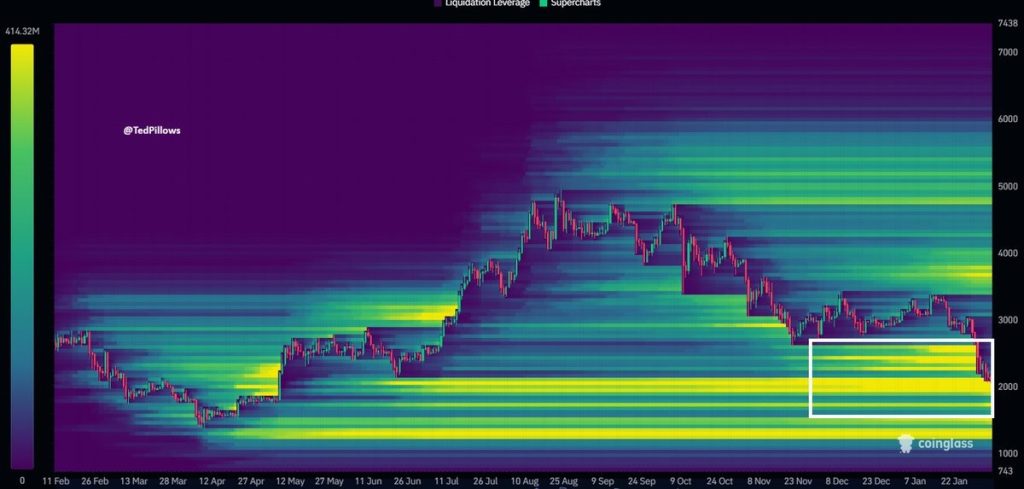
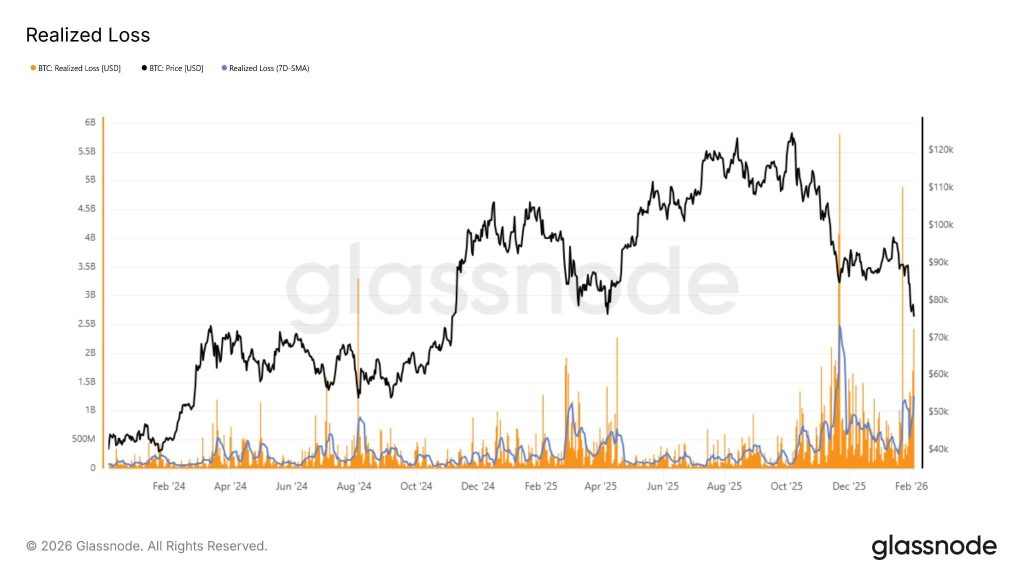
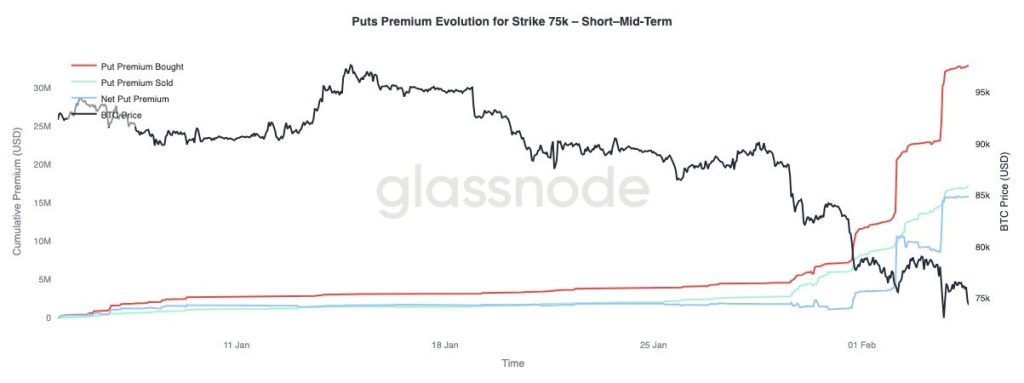
Bitcoin’s recent price action looks less like a clean trend and more like a liquidity-driven move. On the all-leverage liquidation map, the largest clusters of open positions sit below the current price, which makes downside moves easier to trigger.

btc price
Source: X 

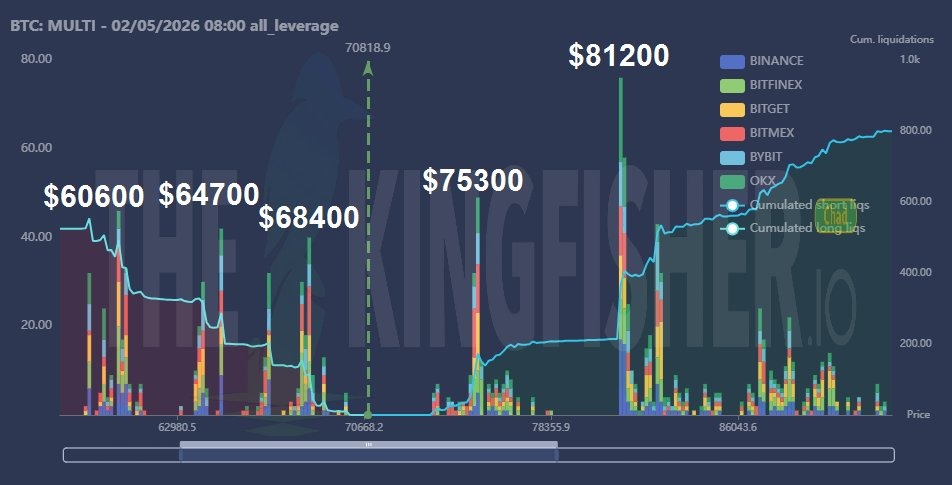
The biggest liquidity pools are stacked around $81,200, $75,300, $68,400, $64,700, and $60,600. Each time BTC loses a support level, the price drifts toward the next pocket where leveraged long positions are concentrated. Those levels act like magnets, as forced liquidations add momentum to the downside.

This also explains why the rebounds have struggled to hold. Without steady spot buying to absorb sell pressure, prices continue to sweep lower liquidity zones. Until that changes, volatility is likely to stay high, and risk remains tilted toward further downside moves.

Will Bitcoin (BTC) Price Test $60,600?

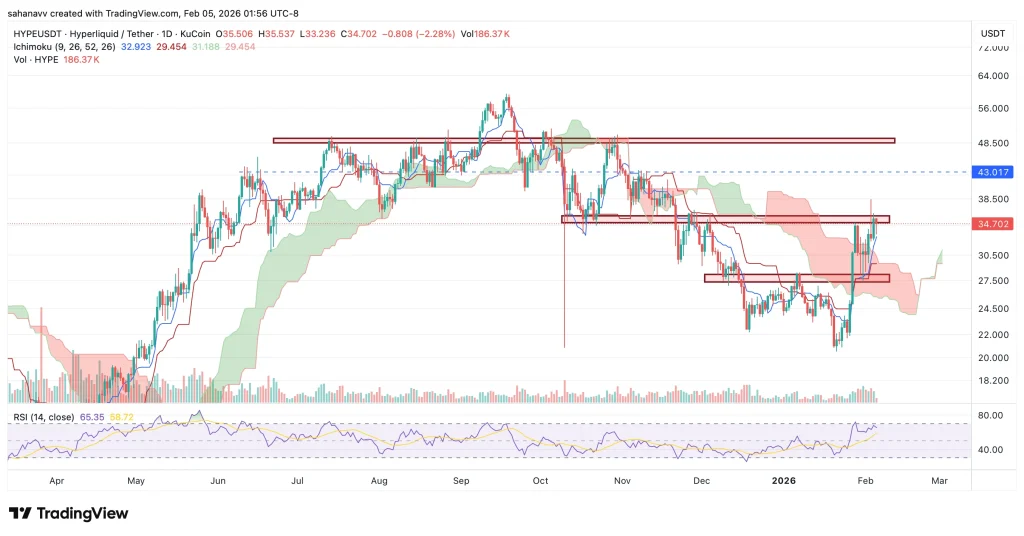
In the long-term, the Bitcoin price broke down from the rising wedge in mid-Q4 2024. This was believed to be a correction that could rebound as the price was accumulating within an ascending trend. However, a rejection of $90,000 has pushed the BTC price into a strong bearish trap. Currently, the support at $74,500 is also broken, which suggests the BTC bears are still in control. 

btc price

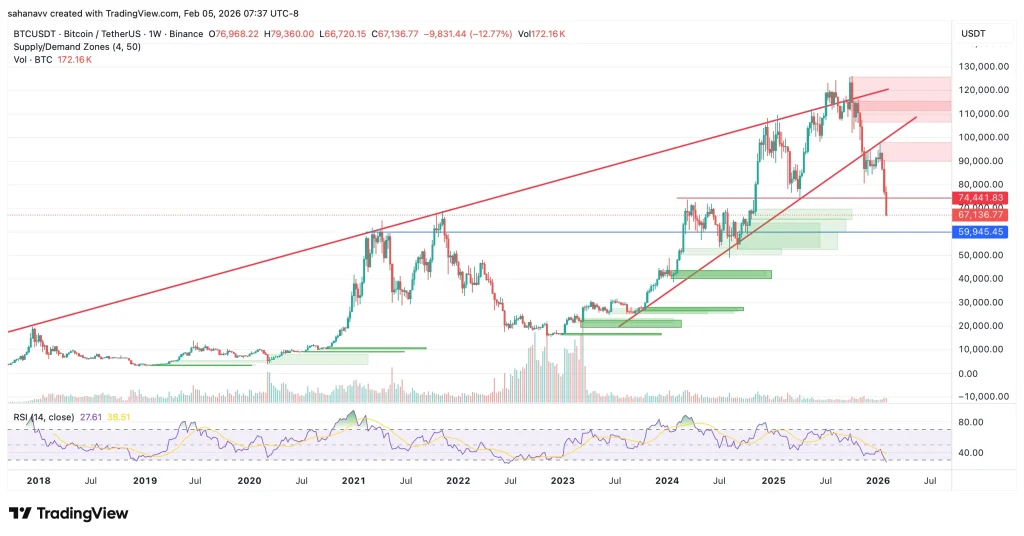
On the price side, Bitcoin has clearly been rejected from the upper supply zone near the $100K–$120K region, confirming strong selling pressure at higher levels. The sell-off has now pushed BTC into a well-defined weekly demand zone around $60K–$65K, an area where buyers have historically stepped in.

RSI adds an important layer here. The weekly RSI has dropped toward the lower end of its range, nearing oversold territory compared to prior cycles. This suggests that while momentum is still weak, selling pressure is starting to look stretched. In past instances, similar RSI conditions inside major demand zones have often preceded either a relief bounce or a period of consolidation rather than an immediate continuation lower.

Put together, the indicators suggest Bitcoin is at a critical turning point: holding this demand zone with stabilizing RSI could trigger a short-term rebound or sideways base, while a breakdown, especially with RSI slipping further, would point to deeper downside risk in the weeks ahead.

The Bottom Line

Bitcoin has now entered a demand zone just below $70,000, where the buyers have previously stepped in. The weekly RSI has dropped to the lower threshold below the lower threshold for the first time since November 2022, followed by a strong rebound backed by volume. But the volume has drained now, indicating a massive drop in the trader’s participation. In such a scenario, the BTC price is feared to drop below $60,000 before the end of the week. 

Chainlink Price Breaks Down—Is LINK Heading Back Into Its 2022–23 Accumulation Range?

Chainlink

The post Chainlink Price Breaks Down—Is LINK Heading Back Into Its 2022–23 Accumulation Range? appeared first on Coinpedia Fintech News

The broader crypto market has slipped into a bearish phase, with Bitcoin dropping below $70,000 and giving up more than 50% from its cycle highs. As downside pressure builds across majors, Chainlink has also erased most of its 2024–25 gains, raising concerns that Chainlink’s price could drift back into the long consolidation range seen during 2022–23.

With price now losing key support levels, traders are watching closely to see whether LINK price enters another extended accumulation phase or if the current weakness marks a short-term corrective pullback that could eventually set the stage for a stronger rebound.

LINK Risks Re-Entering Its 2022–23 Accumulation Zone

Chainlink is starting to look vulnerable as the broader crypto market remains under pressure. After failing to hold the $11–$12 support zone, LINK has slipped lower and is now trading in a price area that previously defined its long consolidation phase in 2022–23. With momentum fading and buyers stepping back, traders are questioning whether this move marks the beginning of another extended accumulation period or just a temporary pullback before a rebound.

On the weekly chart, LINK has clearly lost a key support level that had held through much of 2024 and early 2025. Once the price broke below this zone, it quickly struggled to recover, turning former support into resistance, which is a classic sign of weakening structure.

link price

The highlighted box on the chart marks LINK’s previous accumulation range, where the price spent months moving sideways between roughly $6 and $9. With LINK now trading near $8.8, the price is already testing the upper end of that old range. If buyers fail to step in here, the risk shifts toward range acceptance rather than a quick bounce.

Momentum indicators add to the cautious picture. The RSI has drifted lower, showing fading strength without signaling a full oversold reset, while CMF turning negative suggests capital is slowly flowing out rather than back in.

For now, LINK needs to reclaim the $11–$12 area to shift sentiment back in favor of the bulls. Until that happens, the chart points to continued consolidation or further downside, with the 2022–23 range acting as the key zone to watch.

The Bottom Line

Chainlink price is still under pressure after losing the $11–$12 zone, and for now, the downside risks haven’t eased. In the near term, $8.5–$8.8 is the level to watch this week. If that fails, the price could slide toward $7.5. Looking further into the month, holding below $9 keeps the LINK price exposed to a move back into the $6.5–$7.0 range. Bulls only regain some control if the price manages to reclaim $11, which could allow for a short-term bounce.

Is Ethereum Entering a Distribution Phase? Key On-Chain and Price Signals to Watch

Is Ethereum Price Under Distribution Pressure Exchange Inflows Raises Flags

The post Is Ethereum Entering a Distribution Phase? Key On-Chain and Price Signals to Watch appeared first on Coinpedia Fintech News

The crypto market bears have strengthened since the start of the month as the top tokens, Bitcoin and Ethereum, have attracted significant selling pressure. While BTC price is feared to drop below $60,000, ETH is showing mixed but increasingly cautionary signals. Now that the Ethereum price is about to test one of the crucial support levels at $2000, the question arises whether the distribution phase is about to begin.

Ethereum Transfer Activity Hits 1.17 Million

On-chain data shows Ethereum transfer count has surged to 1.17 million, a level historically associated with late-cycle market behavior. Similar spikes were last seen near market tops in 2018 and 2021, periods that preceded sharp volatility and prolonged consolidations.

eth price
Source: X

While high network activity is often interpreted as bullish, history shows that activity peaks without sustained price expansion can signal distribution. In such phases, large holders continue transacting, but price struggles to trend higher as supply gradually outweighs demand.

Notably, Ethereum’s price has failed to establish a strong upside continuation despite rising transfers, reinforcing the view that network usage is no longer translating into directional price strength.

ETH Price Drifts Toward a High-Liquidity Zone

At the same time, derivatives data highlights a dense liquidity cluster between $1,800 and $2,000, where a large concentration of leveraged positions sits. Liquidation heatmaps show this zone acting as a magnet for price, particularly during periods of weakening momentum.

eth price
Source: X

As ETH moves closer to this range, downside liquidity becomes increasingly attractive from a market-structure perspective. In distribution environments, price often drifts toward areas with maximum liquidation potential, rather than breaking higher resistance levels. This setup suggests that short-term price action may remain reactive and volatility-driven, with sharp moves possible as leverage is flushed out.

What Traders Should Watch Next

Both charts combined indicate active participation with potential supply rotation with the probability of downside tests. The second-largest token now appears to be more vulnerable to liquidity-driven moves due to a lack of strong upside follow-through. These points hint towards a distribution phase where markets transition from momentum-driven to balance-seeking behaviour. 

Overall, the Ethereum (ETH) price is not showing signs of panic or breakdown, but the data suggests the risk remains skewed to the downside in the near term. 

Hyperliquid and MYX Finance Prices Recover Amid Market Correction—Is Bullish Momentum Building? 

Hyperliquid and MYX Finance Prices Recover Amid Market Correction—Is Bullish Momentum Building

The post Hyperliquid and MYX Finance Prices Recover Amid Market Correction—Is Bullish Momentum Building?  appeared first on Coinpedia Fintech News

Bitcoin remains under pressure, trading close to $72,000, despite a recovery from $70,034, while Ethereum hovers around $2,100, struggling to reclaim key short-term resistance. Broader market sentiment stays cautious as derivative positioning turns defensive and spot demand remains muted, keeping upside moves across majors limited.

Despite this risk-off backdrop, select altcoins are beginning to diverge from Bitcoin’s weakness. Prices of Hyperliquid and MYX Finance have staged short-term recoveries, attracting fresh speculative interest. The rebound suggests early positioning rather than trend confirmation, but it highlights how capital is selectively flowing into altcoins even as BTC and ETH remain range-bound under selling pressure.

MYX Finance (MTX) Price Set for a Bullish Breakout

The MYX Finance price has been rising in a bullish pattern since the November rebound, which has kept the bullish possibility alive. After the rebound from the support of the rising parallel channel, the price is consolidating within a tight range, suggesting a strong compression. As the price continues to consolidate within the upper bands of the Bollinger, a breakout appears to be on the horizon. 

myx price

Although the markets are experiencing significant selling pressure, the MYX price is gearing up for a breakout. The MACD is heading for a bullish crossover as the buying volume is rising effectively. Therefore, the price is expected to enter the immediate resistance zone between $7.05 and $7.38 and may further test the resistance of the channel at $8.5. Considering the current market conditions, a breakout seems to be unlikely, but the crypto may continue to maintain an ascending trend consolidation until it rises above $10. 

Hyperliquid (HYPE) Price Enters a Crucial Range

The Hyperliquid price has been maintaining a strong upswing since late January 2026, attracting more than 75% gains. In times when the price is heading towards its ATH, the pullback can be considered as an interim correction. The technicals remain bullish, hinting towards continued price action towards the final resistance zone. 

hype price

The price has entered a decisive phase between $34.94 and $35.95, which can be considered a trend reversal zone, as the price range had been offering strong support earlier. The Ichimoku cloud turns bullish, while the price consolidates above the cloud, hinting towards growing bullish strength. On the other hand, the RSI is hovering around the upper threshold, hinting towards the growing strength of the rally. Therefore, these technicals hint towards a continued upswing and secure the resistance. 

Overall, the rebound in these altcoins appears to be a short-term rotation, but not a clear shift in trend. A sustained upswing in the prices of MYX Finance and Hyperliquid may depend on the growing strength in the top cryptos like Bitcoin & Ethereum. The ETH price is showing stability, while the BTC price may remain volatile and indecisive. Therefore, until Bitcoin rises above the threshold, the consolidation may prevail.

Bitcoin Price Slides to $70,000 as Glassnode Says ‘BTC Bears Are in Control’—$50,000 at Risk?

bitcoin-everlight

The post Bitcoin Price Slides to $70,000 as Glassnode Says ‘BTC Bears Are in Control’—$50,000 at Risk? appeared first on Coinpedia Fintech News

Bitcoin is printing massive bearish candles for the third consecutive day, dragging the price down by more than 10% this week. The BTC price hit an intraday low very close to $70,000, but it did not attract strong buying volume. This raises the possibility of the start of the bearish phase, and the data from Glassnode below hints towards a deeper correction.

Bitcoin Slips Below Key Short-Term Holder Cost Basis

The risk indicator shows Bitcoin trading below the Short-Term Holder (STH) realized price, a level that often defines near-term market control. When BTC holds below this red cost-basis line, recent buyers remain underwater, and upside moves typically face selling pressure.

btc price

At the same time, price is drifting closer to the Active Investor Mean and True Market Mean, suggesting the market is rotating toward lower on-chain cost bases. Historically, this structure reflects bearish dominance in the short term, with price action driven more by risk reduction than fresh accumulation.

Rising Realized Losses Signal Capitulation

The Realised Loss chart shows a sharp rise in realised losses as Bitcoin’s price continues to decline. The recent spikes indicate that a growing number of investors are selling coins at a loss, reflecting rising stress among short-term participants.

btc price

Historically, sustained increases in realized losses tend to appear during corrective or distribution phases, when downside momentum forces weaker hands to exit positions. The elevated 7-day average suggests selling pressure remains active, reinforcing the view that current price action is driven by capitulation rather than confident buying.

Institutional Netflows Turn Negative

The BTC DAT Netflow chart shows a clear shift into negative netflows across spot ETFs, corporate treasuries, and government-linked wallets. This indicates that large holders are distributing rather than accumulating, removing a key source of structural demand.

btc price

As institutional netflows slip below neutral, Bitcoin price action weakens alongside it, suggesting that recent declines are being reinforced by capital outflows from major entities, not just retail selling. Until netflows stabilize or turn positive, upside momentum remains limited.

Put Option Demand Surges as Traders Hedge Against Bitcoin

The chart shows a sharp rise in put premiums bought for the $75K strike, while net put premiums turn decisively positive. This indicates traders are increasingly paying up for downside protection, reflecting growing bearish expectations in the short to mid term.

btc price

At the same time, Bitcoin price trends lower as put demand accelerates, reinforcing the view that market participants are positioning defensively rather than betting on a near-term rebound. Elevated put activity typically signals risk-off sentiment and heightened downside caution.

The Final Verdict: Are the Bitcoin Bears in Control?

The data shows Bitcoin price is under pressure, but not in free fall. The price sitting below the short-term holder cost basis tells us recent buyers are stuck in losses, which explains why every bounce runs into selling. The rise in realized losses confirms that some traders are now exiting positions under stress, not rotating calmly.

What matters more is that big money isn’t stepping in yet. Institutional netflows remain weak, and the jump in put option demand shows traders are paying for protection rather than betting on a quick recovery. That’s a clear sign of caution, not confidence.

Overall, this looks like a defensive, risk-off phase where the market is trying to find balance after excess optimism. Conditions can still stabilize, but until selling pressure cools and demand improves, upside moves are likely to stay limited and fragile.

FAQs

Is Bitcoin starting a bear market?

Current data suggests a bearish short-term phase, with price below key holder cost bases and rising institutional outflows, but this indicates a correction, not necessarily a long-term bear market.

Why is the Bitcoin price dropping sharply?

The drop is driven by several factors: recent buyers are selling at a loss, institutional netflows have turned negative, and traders are actively hedging against further downside with put options.

Are big institutions still buying Bitcoin?

Recent data shows a clear shift; major entities like spot ETFs and corporate treasuries are now in distribution mode, creating net outflows and removing a key source of market demand.

Should I buy the Bitcoin dip right now?

Current indicators show high caution, with weak buying volume and strong defensive hedging. Until selling pressure cools and demand improves, near-term rallies are likely to face significant resistance.

Analyst Warns of Deeper Correction—Ethereum (ETH) Price May Plunge Below $2000

Is Ethereum Price Under Distribution Pressure Exchange Inflows Raises Flags

The post Analyst Warns of Deeper Correction—Ethereum (ETH) Price May Plunge Below $2000 appeared first on Coinpedia Fintech News

The rejection of $3000 has pushed the Ethereum (ETH) price into a strong bearish trajectory. The price is failing to secure an important range of around $2300, which has become a major resistance to break. Meanwhile, the bulls have been defending the pivotal support at $2,150, keeping the bullish possibilities alive. This may point towards an upcoming trend reversal, but a popular analyst, Ali, suggests the bottom has not been reached yet. 

Large Holders Remain in Disbelief

The big players seem to be not confident in the current price rebound, as they have been distributing instead of accumulating. The data from Glassnode shows that the Ethereum whales have been steadily reducing their holdings, possibly relocating them to other tokens. 

ethereum price

The declining bars are the number of wallets holding more than 10,000, which has declined from 1,262 to 1,120. This validates the claim of a possible supply rotation, as they are not aggressively adding or holding at current levels. This points towards a weakening of upside momentum as buying pressure fades off. This may not follow a sudden crash but rather keep the price consolidated within a tight range. 

Ethereum is Yet to Reach the Bottom

A better way to determine whether the ETH price is undervalued or overvalued is to analyse the MVRV values. The chart below shows the Ethereum MVRV ratio and how it behaves at the extreme levels over time. Historically, when ETH’s MVRV moves into the red zone above ~3.2, it has marked overheated conditions and major tops, where profit-taking tends to kick in. On the flip side, when MVRV drops toward the green zone around 0.8–1.0, it has often lined up with cycle bottoms, signaling that ETH is undervalued and long-term accumulation starts.

ethereum price

Right now, MVRV is sitting closer to the lower band, not in extreme greed territory. Historically, the Ethereum price bottoms when the MVRV ratio drops below 0.8. Currently, the ratio sits at 0.96, which suggests the typical bottom conditions haven’t fully formed yet. 

ETH Price May Plunge Below $2000

The second-largest token has been facing strong upward pressure over the past few days; still, the support at $2000 was held tight. However, the data revealed by the MVRV pricing bands suggests the ETH price may find its bottom below $2000. MVRV pricing bands are used to map out where ETH tends to be undervalued, fairly valued, or overheated based on on-chain data rather than pure price action. 

ethereum price

Historically, when ETH trades near the lower blue/green bands (0.8–1.0 MVRV), it has marked strong accumulation zones and cycle lows. On the other hand, moves towards the yellow and red bands (2.4–3.2 MVRV) have aligned with market tops, where price becomes stretched and profit-taking increases. Right now, ETH is trading above the lower bands but well below the red zone, suggesting it’s no longer deeply undervalued, yet still far from euphoric territory.  They hint that Ethereum has room to explore lower levels, and based on this model, a cycle bottom could form below $1,959. 

Wrapping it Up

Ethereum has long been viewed as one of the more stable assets in the crypto market, yet even the strongest ETH bulls are now deep in the red. BitMine, led by Tom Lee, is currently sitting on an estimated loss of nearly $6.8 billion. Meanwhile, prominent crypto whale Garrett Jin has faced losses of around $770 million, including a $195 million ETH long liquidation. In another major hit, Jack Yi, founder of Capital Inc., has reportedly lost close to $680 million.

These losses reflect the broader market environment, where sentiment remains firmly fearful amid extreme volatility across major cryptocurrencies, including Bitcoin and Ethereum. At the same time, buying pressure remains negligible, keeping the probability of a near-term reversal low. Given the current structure, traders may prefer to stay cautious until market conditions stabilize and bulls show clear intent. A sustained move above $3,500 would be required to confirm that ETH is breaking out of bearish influence and regaining upside momentum. Until then, downside risk remains firmly in play.

❌