Reading view

Bonk (BONK) Price Prediction 2026, 2027 – 2030: Will BONK Price Reach $0.00013 by 2030?

Bonk (BONK) Price Prediction

The post Bonk (BONK) Price Prediction 2026, 2027 – 2030: Will BONK Price Reach $0.00013 by 2030? appeared first on Coinpedia Fintech News

Story Highlights

  • The live price of the BONK token is  $ 0.00000623
  • Price predictions for 2026 range from $0.0000160 to $0.0000330
  • BONK could extend toward $0.0001300 by 2030, if recovery structure holds.

Bonk (BONK) has entered a phase where price action matters more than narrative. After witnessing sharp upside volatility followed by an extended cooldown, the Solana-based meme token is now trading within a clearly defined structure, signaling that speculative froth has largely settled.

Unlike its early cycles driven by hype alone, BONK’s current movement reflects broader market positioning, liquidity shifts, and technically respected demand zones. As the market turns its attention toward 2026, BONK’s chart suggests it may be approaching a pivotal phase where consolidation gives way to directional expansion provided key resistance levels are reclaimed.

Bonk Price Today

Cryptocurrency Bonk
Token BONK
Price $0.0000 down -9.67%
Market Cap$ 547,959,325.76
24h Volume$ 131,161,328.2097
Circulating Supply87,995,158,654,161.20
Total Supply87,995,158,654,161.20
All-Time High$ 0.0001 on 20 November 2024
All-Time Low$ 0.0000 on 30 December 2022

Bonk (BONK) Price February 2026 Outlook

As February unfolds, BONK continues to trade above a critical demand band near $0.000015–$0.000017, a zone that has repeatedly absorbed selling pressure in recent months. This area has now become a structural base, indicating that downside momentum is weakening. On the upside, BONK faces immediate resistance around $0.000022, followed by a more decisive barrier near $0.000026. A sustained hold above these levels would signal growing bullish participation, while failure to break higher could result in continued range-bound movement through the month. From a technical standpoint, February’s price behavior is likely to act as a tone-setter, either confirming accumulation or extending the consolidation phase into the second quarter.

Bonk (BONK) Price Prediction 2026

The broader 2026 outlook for BONK hinges on how price reacts to its long-term compression structure. On higher timeframes, BONK is trading within a narrowing range formed by descending resistance and a stable horizontal base, a setup often associated with volatility expansion once resolved.

Bonk (BONK) Price Prediction 2026

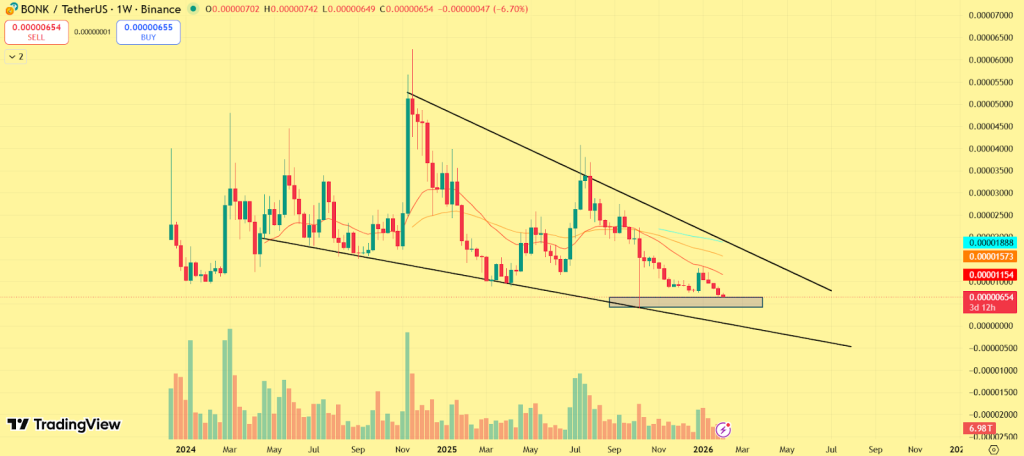
In the early part of 2026, BONK may continue oscillating between $0.000016 and $0.000024, allowing liquidity to build. However, a confirmed breakout above the upper boundary of this range could trigger a shift in market structure, opening the path toward higher price discovery zones.

If bullish momentum strengthens alongside broader market recovery, BONK could advance toward $0.000028, with an extended upside scenario placing the token near $0.000033 by the latter half of 2026. Importantly, pullbacks during this phase are expected to remain corrective as long as price holds above its established base.

Bonk Crypto Price Prediction 2026 – 2030

YearPotential Low ($)Potential Average ($Potential High ($)
20260.00001600.00002450.0000330
20270.00002800.00004100.0000560
20280.00004500.00006700.0000850
20290.00007200.00009800.0001150
20300.00009500.00011200.0001300

Bonk (BONK) Price Forecast 2026

In 2026, Bonk price could project a low price of $0.0000160, an average price of $0.0000245, and a high of $0.0000330.

Bonk Price Prediction 2027

As per the Bonk Price Prediction 2027, BONK may see a potential low price of $0.0000280. Meanwhile, the average price is predicted to be around $0.0000410. The potential high for BONK price in 2027 is estimated to reach $0.0000560.

Bonk (BONK) Price Prediction 2028

In 2028, Bonk  price is forecasted to potentially reach a low price of $0.0000450 and a high price of $0.0000850.

Bonk Coin Price Prediction 2029

Thereafter, the Bonk  (BONK) price for the year 2029 could range between $0.0000720 and $0.0001150.

Bonk Price Prediction 2030

Finally, in 2030, the price of Bonk is predicted to remain steadily positive. It may trade between $0.0000950 and $0.0001300.

Bonk Price Prediction 2031, 2032, 2033, 2040, 2050

The long-term projection assumes Bonk sustains relevance in enterprise blockchain use cases, with growth moderating over time as the asset matures.

YearPotential Low ($)Potential Average ($)Potential High ($)
20310.00011000.00014500.0001750
20320.00014000.00019000.0002400
20330.00018000.00024000.0003200
20400.00042000.00068000.0009500
20500.00085000.0013000.001900

Bonk (BONK) Price Prediction: Market Analysis?

Year202620272030
Changelly$0.0000350$0.0000500$0.0001350
CoinCodex$0.0000300$0.0000590$0.0001120
WalletInvestor$0.0000280$0.0000510$0.0001200

CoinPedia’s Bonk Price Prediction

Coinpedia’s price prediction suggests that BONK could trade between $0.000016 and $0.000033 in 2026, provided the asset sustains its demand zone and confirms a higher-timeframe breakout. Looking ahead, if BONK maintains relevance within high-beta market phases, the token may extend toward $0.000130 by 2030, though price volatility is expected to remain elevated across cycles.

YearPotential Low ($)Potential Average ($)Potential High ($)
20260.00001600.00002450.0000330
Never Miss a Beat in the Crypto World!

Stay ahead with breaking news, expert analysis, and real-time updates on the latest trends in Bitcoin, altcoins, DeFi, NFTs, and more.

FAQs

What is Bonk’s price prediction for 2026?

In 2026, BONK could range between $0.000016 and $0.000033, depending on breakout confirmation above key resistance levels.

Could Bonk (BONK) reach new highs by 2030?

Yes, if bullish momentum continues, BONK may reach up to $0.000130 by 2030 while maintaining a stable long-term base.

What factors influence Bonk’s price movement?

BONK’s price moves are shaped by market positioning, liquidity zones, resistance levels, and broader crypto market trends.

Is Bonk (BONK) a good long-term investment?

If BONK sustains demand zones and market relevance, it shows potential for long-term growth, though volatility remains high.

Dogecoin Price Slips Below $0.10 as Selling Pressure Intensifies, Despite Musk Hints

DOGE Price on the Verge of Breakout—Will Bulls Push It Past $0.215 This Week?

The post Dogecoin Price Slips Below $0.10 as Selling Pressure Intensifies, Despite Musk Hints appeared first on Coinpedia Fintech News

Dogecoin price slid sharply nearly 7% intraday and dipped below the key $0.10 support zone amid broader market weakness. The decline comes despite renewed “moon mission” chatter linked to Elon Musk’s recent social media interaction, showing that the meme coin’s traditional narrative drivers may be losing momentum in the current macro environment.  While DOGE did briefly react to Musk-related posts earlier in the week, the response has so far failed to sustain a bullish trend, leaving price vulnerable as sellers remain in control.

Narrative Fizzles: Musk Moon Comments Barely Move DOGE Price

Elon Musk’s recent reply on X, hinting that SpaceX “maybe next year” could support the long-delayed DOGE-1 lunar mission sparked modest interest in Dogecoin, with markets initially posting gains. However, the hype was short-lived. Unlike past cycles where similar comments triggered extended rallies, DOGE’s bounce lacked follow-through and quickly gave way to renewed selling. 

BREAKING: Elon Musk says SpaceX will likely put Dogecoin on the moon next year, calling a Dogecoin to the moon moment inevitable. pic.twitter.com/ZulhZXDelV

— DogeDesigner (@cb_doge) February 3, 2026

This suggests that narrative catalysts alone are not carrying the same market influence they once did, especially when broader crypto sentiment is under pressure.

ETF Flows Lose Momentum as DOGE Price Fails to Respond

Dogecoin spot ETF data paints a mixed picture rather than a bullish one. During early January, DOGE ETFs recorded a weekly net inflow of roughly $252K, followed by additional single-day inflows near $1.9M–$2.6M in subsequent sessions. These spikes briefly lifted cumulative inflows to around $6.7M, while total net assets hovered near $9.3M.

Dogecoin ETF

However, these inflows failed to persist. Several sessions quickly flipped back into net outflows, highlighting a lack of sustained institutional conviction. Trading volumes also remained uneven, suggesting that most activity was reactive rather than trend-driven. In short, ETF participation exists  but it is tactical, not directional. Without consistent inflows, DOGE has struggled to find a structural bid.

Dogecoin Price Analysis: What the Chart is Really Saying

Dogecoin price has been trading inside a well-defined descending channel, but the latest move is critical, as DOGE price has fallen toward the support trendline that had held since the previous consolidation phase. This drop shifts near-term control firmly toward sellers. Recent rallies are getting cut short earlier, while drops are stretching deeper than before. Each recovery attempt loses momentum near the same zone, while downside moves travel further. At press time, DOGE price trades at $0.098, below the short-term moving averages, underlying weakness. 

Dogecoin price

On the downside, the $0.098–$0.095 zone now stands out as the first major support. A daily close below $0.095 would expose DOGE to a deeper pullback toward the $0.088–$0.090 range, which represents the channel base and a historically reactive level. On the upside, immediate resistance sits near $0.105–$0.108, where price was repeatedly rejected after the breakdown. Above that, the more decisive level remains $0.118–$0.120, coinciding with the descending channel’s midline. Until DOGE reclaims this zone with volume expansion, rebounds are likely to remain corrective rather than trend-reversing.

Liquidation Heatmap Shows Heavy Pressure Below $0.10

Liquidation data shows that Dogecoin has already swept most downside liquidity following the recent sell-off, reducing the immediate incentive for price to push sharply lower from current levels. As DOGE dipped below the $0.10 zone, clusters of long liquidations were largely cleared, easing near-term downside pressure. Now, attention is shifting to overhead liquidity, where dense clusters are building between $0.129 and $0.132. These levels mark areas where a large concentration of short positions remains exposed. If price begins to grind higher and approaches this zone, it could trigger forced short covering, potentially accelerating upside momentum.

DOGE Liquidation

Notably, this setup reflects a market driven more by liquidity positioning than organic spot demand. Traders are watching whether DOGE can attract enough buying pressure to move into these liquidity pockets. Without follow-through, price risks remaining range-bound. However, a decisive push toward these levels could quickly change market dynamics, turning a slow recovery into a sharper liquidity-driven move.

FAQs

Did Elon Musk’s recent tweet affect Dogecoin’s price?

While Musk’s hint about the DOGE-1 mission sparked initial gains, the rally was short-lived, suggesting such narrative catalysts now have less influence amid overall negative market sentiment.

What is the price prediction for Dogecoin (DOGE)?

Dogecoin faces immediate resistance near $0.105-$0.108. A daily close below key support at $0.095 could see a pullback toward $0.088, while reclaiming $0.120 is needed for a potential trend reversal.

Are Dogecoin ETFs a good investment right now?

DOGE ETF flows have been inconsistent, flipping between inflows and outflows, indicating a lack of sustained institutional conviction and making them a tactical, rather than directional, investment currently.

What is the liquidation heatmap saying for Dogecoin?

Liquidation data shows heavy short positions clustered overhead near $0.129-$0.132. A price move toward that zone could trigger a short squeeze, but it requires stronger buying pressure than currently exists.

Crypto Liquidations Top $700M as Bitcoin, Ethereum and Altcoins Extend Selloff

Crypto Liquidations Top $700M as Bitcoin, Ethereum and Altcoins Extend Selloff

The post Crypto Liquidations Top $700M as Bitcoin, Ethereum and Altcoins Extend Selloff appeared first on Coinpedia Fintech News

The broader crypto market came under heavy pressure today as a sharp wave of crypto liquidations ripped through leveraged positions, dragging Bitcoin, Ethereum, and major altcoins lower within hours. Over $700 million in crypto positions were liquidated during the session, with long traders bearing the brunt of the damage. The speed of the move suggests the decline was driven less by fresh selling and more by cascading margin calls as key intraday supports failed.

Crypto Liquidations Drive the Selloff as Leverage Unwinds

Today’s market selloff triggered over $700 million crypto positions liquidated over the past 24 hours, with long positions accounting for the clear majority of losses. Bitcoin led the wipeout, accounting for over $410 million in liquidations, as BTC slipped toward the $71,000 level. Ethereum followed closely, with roughly $208 million in ETH positions liquidated as price dropped near $2,100. XRP and other large-cap altcoins contributed the remainder, as cascading stops were triggered across derivatives markets.

The liquidation skew was heavily long-biased, signaling a mechanical leverage reset rather than panic-driven selling. 

Crypto Liquidations

Open interest fell sharply alongside the liquidations, showing that traders were being forced out of positions instead of exiting voluntarily. In short, today’s move reflects leverage flushing out of the system, not a mass exit by long-term holders.

Bitcoin Price Slides 5% as Liquidation Clusters Get Swept

Bitcoin’s decline accelerated after BTC lost key intraday support and slipped nearly 5% to the $71,000 zone, triggering a sharp liquidation cascade across futures markets. Liquidation data shows roughly $409 million worth of Bitcoin positions were force-closed during the move, with long traders accounting for the overwhelming majority. The selloff was mechanically driven. As Bitcoin price broke below short-term support levels near the mid-$74K range, liquidation clusters stacked around $73K and $72K were rapidly cleared. This forced selling amplified downside momentum, dragging price swiftly toward $71K before bids began to stabilize.

BTC

Importantly, spot market behavior remained relatively composed. Exchange inflows did not spike aggressively, suggesting the move was fueled by excess leverage unwinding, not panic-driven spot selling. In classic fashion, futures markets led the decline, while spot liquidity lagged behind. For now, Bitcoin’s ability to hold above the $70K–$71K region will be closely watched. A failure to stabilize around $70k could expose deeper downside, while consolidation here may signal that the bulk of forced selling has already played out.

Ethereum Price Drops to $2100 as Leverage Reset Mirrors Bitcoin 

Ethereum tracked Bitcoin’s weakness almost tick for tick, falling nearly 5% to around $2,100 as liquidation pressure spilled across correlated markets. Data indicates approximately $208 million in Ethereum futures positions were liquidated, again dominated by long-side losses. ETH’s decline was not driven by Ethereum-specific developments. Instead, it reflected a broader deleveraging event as traders reduced exposure across majors once Bitcoin broke lower. Once ETH price lost support near the $2,250–$2,300 area, liquidation thresholds were quickly hit, accelerating the slide toward $2,100.  

ETH

From here, Ethereum’s short-term outlook hinges on whether $2,000 can hold as a stabilization zone. A sustained failure below this level would keep pressure on the downside, while consolidation could allow volatility to compress as leverage resets.

Market Outlook

Today’s market sell-off carries a clear message: the market was over-leveraged. The $700M liquidation wave acted as a reset mechanism, forcing out crowded bullish positions without triggering mass spot exits. If liquidation pressure continues to ease and open interest stabilizes, markets may attempt to consolidate at lower levels. However, until Bitcoin and Ethereum reclaim broken supports, volatility is likely to remain elevated. For now, crypto markets are not collapsing, they are deleveraging. History shows that how price behaves after leverage resets often defines the next major trend.

FAQs

What caused the crypto market to crash today?

A sharp $700 million liquidation wave triggered a cascade of forced selling in leveraged futures markets, rapidly pulling down Bitcoin, Ethereum, and altcoin prices within hours.

How much was liquidated in the crypto market selloff?

Over $700 million in crypto positions were liquidated, with Bitcoin longs accounting for over $410 million and Ethereum longs for roughly $208 million of that total.

What does a long liquidation mean in crypto?

It means traders who bet on prices rising using borrowed funds were forced to sell as prices fell, triggering more automatic sell orders and accelerating the downturn in a short-term cascade.

XRP Price Crashes 10%, But This Isn’t Panic Selling Here’s What On-Chain Data Shows

XRP Price Drops 10% as Leverage Dries Up and Whale Activity Remains Absent

The post XRP Price Crashes 10%, But This Isn’t Panic Selling Here’s What On-Chain Data Shows appeared first on Coinpedia Fintech News

XRP price saw a sharp downside pressure during the latest session, dropping close to 10% before stabilizing near intraday lows. The move unfolded alongside broader market weakness, but on-chain data shows XRP’s decline is being driven less by panic selling and more by a structural reset in positioning. As price slipped, leverage exited aggressively, and large holders stayed on the sidelines. Together, these forces reshaped XRP’s short-term outlook, shifting focus away from momentum and toward whether the market can form a durable base.

Leverage Unwinds as Open Interest Falls to Multi-Month Lows

The most significant signal behind XRP’s decline is the sharp contraction in derivatives positioning. Open interest has now dropped to levels last seen in November 2024, effectively erasing the speculative buildup that accumulated during prior recovery attempts. Unlike liquidation-driven crashes, this reset unfolded gradually, with traders closing positions voluntarily rather than being forcibly liquidated.

XRP Open Interest

With leverage largely flushed, XRP no longer faces the same downside risk from overcrowded long positioning. However, the reset also means the market lacks speculative momentum needed for a quick rebound.

Whale Activity Remains Muted Despite Lower XRP Prices

While derivatives exposure has been reduced, large holders have yet to step in meaningfully. On-chain data shows no notable increase in whale accumulation during the sell-off. Wallet activity among large XRP holders remains muted, suggesting institutional and high-net-worth participants are waiting for stronger confirmation before deploying capital.

XRP whale flows

In previous XRP recoveries, whale inflows often provided a stabilising base, absorbing sell pressure and helping price form durable support. The absence of that behaviour this time leaves XRP exposed to extended consolidation, even as selling pressure eases. Simply put, leverage has exited, but strong hands have not yet replaced it.

XRP Price Slips to Channel Lows: What’s Next?

XRP price has been trapped inside a falling channel for months. The latest drop has pushed the price toward the lows of the channel, a structure that has guided price action for several months. The decline accelerated after XRP failed to hold the channel’s midline, triggering a clean rejection and confirming sellers control in the short term. Currently, XRP price slid into a high-confluence demand zone around $1.40, making it a technically significant region. Historically, XRP has shown short-term stabilization when price reaches this zone.

XRP Price

XRP price action shows longer lower wicks, hinting that selling pressure is slowing, but there is no confirmed reversal yet. As long as XRP trades below the channel midline and former support level of $1.30, any rebound risks being corrective. A sustained recovery would require a decisive reclaim of broken resistance. Failure to hold the current demand zone of $1.30-$1.40, however, could expose XRP to a deeper move into lower liquidity pockets near $1.10.

FAQs

What is causing the current decline in XRP price?

XRP’s drop is driven by a structural reset, not panic selling. Leverage is unwinding, and large holders are waiting, removing speculative momentum for a quick rebound.

Is now a good time to buy XRP after its price drop?

Currently, large “whale” investors aren’t accumulating, suggesting a wait for stability. With price in a falling channel, it may consolidate further before a durable base forms.

What does XRP need for a sustained price recovery?

XRP needs to reclaim and hold above the $1.30-$1.40 zone as solid support, alongside renewed buying interest from large holders, to signal a potential trend reversal.

Quant Price Prediction 2026, 2027 – 2030: How High Can QNT Go in the Next Decade?

Quant Price Prediction

The post Quant Price Prediction 2026, 2027 – 2030: How High Can QNT Go in the Next Decade? appeared first on Coinpedia Fintech News

Story Highlights

  • The price of the Quant token is  $ 62.55674802.
  • Price predictions for 2026 range from $150 to $280.
  • QNT could extend toward $1000 by 2030, if the recovery structure holds.

Quant (QNT) enters 2026 in a position that few infrastructure-focused crypto assets currently share: technically compressed, fundamentally steady, and largely absent from short-term speculation. While much of the market continues to rotate between momentum-driven narratives, Quant’s price action has quietly tightened into a multi-year range, reflecting restraint rather than weakness. Quant’s positioning has remained consistent. Built around its Overledger technology, the project continues to focus on enterprise-grade blockchain interoperability rather than retail experimentation. 

This long-term orientation has allowed Quant to develop outside the spotlight, even as speculative capital flowed elsewhere. Technically, this divergence is beginning to show. Volatility has contracted, downside reactions have become more controlled, and long-term support zones are holding with increasing reliability. As the market looks ahead to 2026, the key question is whether this prolonged compression marks exhaustion, or the early stages of a broader repricing cycle.

Quant Price Today

Cryptocurrency Quant
Token QNT
Price $62.5567 down -7.54%
Market Cap$ 755,231,228.99
24h Volume$ 18,677,988.7621
Circulating Supply12,072,738.00
Total Supply14,881,364.00
All-Time High$ 428.3847 on 11 September 2021
All-Time Low$ 0.1636 on 23 August 2018

Quant (QNT) Price February 2026 Outlook

As February 2026 unfolds, Quant continues to trade within a clearly defined range, holding above its long-term support band near $110–$130 while facing overhead pressure near the $170–$180 region. This sideways movement reflects balance rather than weakness. Importantly, downside attempts remain shallow, with buyers consistently stepping in near the same demand zone. At the same time, sellers are failing to generate impulsive follow-through on rejection. As long as QNT remains above structural support and avoids a breakdown below the base, the broader trend bias remains neutral-to-constructive. A decisive move above $180 would shift momentum in favor of buyers and open the door for a broader 2026 expansion phase.

Quant (QNT) Price Prediction 2026

The year 2026 is shaping up to be a transition period for Quant rather than an explosive cycle top. The dominant feature on higher timeframes is a multi-year compression pattern, which historically tends to resolve with directional expansion once supply is absorbed. During the early months of 2026, QNT is likely to continue consolidating between $120 and $180, allowing the market to establish value and clear remaining overhead supply. This phase may test investor patience, but it also strengthens the structure.

Chainlink Price Prediction 2026

If Quant successfully reclaims and holds above the $200 psychological level later in the year, it would confirm a shift from accumulation into expansion. In that scenario, price could gradually advance toward the $240–$280 zone before year-end, with pullbacks remaining corrective rather than trend-breaking.

Quant Crypto Price Prediction 2026 – 2030

YearPotential Low ($)Potential Average ($Potential High ($)
2026120180280
2027180260380
2028270390560
2029420620820
20307008501000

Quant (QNT) Price Prediction 2026

In 2026, Quant price could project a low price of $120, an average price of $180, and a high of $280.

Quant (QNT) Price Forecast 2027

As per the Quant Price Prediction 2027, QNT may see a potential low price of $180. Meanwhile, the average price is predicted to be around $260. The potential high for QNT price in 2027 is estimated to reach $380.

QNT Price Prediction 2028

In 2028, the Quant price is forecasted to potentially reach a low price of $270 and a high price of $560.

Quant Price Prediction 2029

Thereafter, the Quant  (QNT) price for the year 2029 could range between $420 and $820.

Quant (QNT) Price Prediction 2030

Finally, in 2030, the price of Quant is predicted to remain steadily positive. It may trade between $700 and $1000.

Quant Price Prediction 2031, 2032, 2033, 2040, 2050

The long-term projection assumes Quant sustains relevance in enterprise blockchain use cases, with growth moderating over time as the asset matures.

YearPotential Low ($)Potential Average ($)Potential High ($)
20317209001120
203278010201280
203385011501450
2040110015002300
2050180025003000

Quant (QNT) Price Prediction: Market Analysis?

Year202620272030
Changelly$250$350$900
CoinCodex$220$310$780
WalletInvestor$245$340$820

CoinPedia’s Quant Price Prediction

Coinpedia’s price prediction suggests that Quant appears to be approaching the later stages of a prolonged consolidation phase. If price continues to defend long-term support and eventually breaks above key resistance zones, QNT could trade near $280 by the end of 2026, with long-term potential extending toward $1,000 by 2030, depending on broader market participation and adoption growth.

YearPotential Low ($)Potential Average ($)Potential High ($)
2026120180280
Never Miss a Beat in the Crypto World!

Stay ahead with breaking news, expert analysis, and real-time updates on the latest trends in Bitcoin, altcoins, DeFi, NFTs, and more.

FAQs

What is Quant (QNT) used for?

Quant is used to power Overledger, a platform that connects different blockchains so enterprises and banks can build secure multi-chain applications.

What is the price prediction for Quant (QNT) in 2026?

Quant is expected to range between $120 and $280 in 2026, with price strength improving if it holds support and clears $200.

How much will 1 QNT be worth in 2030?

If adoption continues, 1 QNT could trade between $700 and $1,000 by 2030, reflecting steady enterprise growth rather than hype cycles.

What is the Quant (QNT) price prediction for 2050?

By 2050, QNT could trade between $1,800 and $3,000 if it remains relevant in enterprise blockchain infrastructure long term.

What makes Quant different from other crypto projects?

Quant focuses on enterprise blockchain interoperability via Overledger, prioritizing real-world use cases over short-term hype.

Is Quant (QNT) a good investment in 2026?

Quant shows steady fundamentals and strong long-term support. If it holds key levels and breaks resistance, 2026 could favor gradual upside.

Solana Price Slips Below $100 as ETF Stability Fails to Support Price: What Comes Next for SOL?

Why Solana Price Fell Harder Than Bitcoin During the Recent Market Crash Will it Hit $100

The post Solana Price Slips Below $100 as ETF Stability Fails to Support Price: What Comes Next for SOL? appeared first on Coinpedia Fintech News

Solana price fell sharply in today’s session, sliding close to 7% and breaking below the $100 mark, a level that had acted as short-term psychological support. The move marks a clear technical breakdown, with price slipping out of its recent consolidation range as sellers maintained control throughout the session. The decline unfolded without a liquidation shock or ETF disruption, pointing instead to a demand-driven selloff. Spot market weakness, fading on-chain activity, and thinning liquidity combined to push SOL lower, raising questions over whether the market is entering a deeper corrective phase or simply resetting before the next attempt higher.

ETF Inflows Hold, But Solana Price Still Slips Lower

Solana’s ETF-linked exposure remained stable, but it failed to cushion the price as spot selling intensified. U.S. Solana spot ETFs posted a modest daily net inflow of $1.24 million, lifting cumulative inflows to $877.75 million, while total net assets hovered around $854.3 million, a level that has largely moved sideways in recent sessions.

SOL ETF

Beneath the surface, however, spot markets told a different story. Data shows net spot outflows nearing $29.9 million, coinciding with SOL’s breakdown below the $100 psychological level. This divergence proved critical. While ETFs neither saw aggressive redemptions nor meaningful dip buying, spot sellers dominated liquidity, leaving the market vulnerable once key support gave way. The result was a swift slide below the $100 mark, underscoring a familiar dynamic: ETF stability alone is not enough to support price when spot flows turn decisively negative.

On-Chain Data Shows TVL Decline as Capital Pulls Back

Solana’s on-chain metrics confirm that the latest price weakness is being accompanied by a measurable pullback in deployed capital. Network data shows Solana’s total value locked (TVL) has slipped by roughly 5–7% over the past week, easing from recent local highs as traders reduced exposure across DeFi protocols. While, the stablecoin market capitalization on Solana has also flattened, with balances holding near recent levels instead of expanding, a signal that fresh liquidity is no longer aggressively entering the ecosystem. Historically, periods where stablecoin supply stops growing tend to coincide with cooling momentum rather than trend acceleration.

SOL TVL Data

Transaction activity remains elevated compared to late 2025 averages, but growth has slowed noticeably from January’s peak levels. In parallel, wallet interaction data shows fewer large inflows, suggesting institutional and high-net-worth participants are waiting for clearer price confirmation before redeploying capital. Taken together, the numbers point to controlled capital rotation, not network stress. Solana’s on-chain health remains intact, but the contraction in TVL and stagnant stablecoin flows indicate that the network is in a risk-off consolidation phase, limiting upside pressure until liquidity conditions improve.

Solana Price Slips Below $100 as Structure Tilts Bearish

Solana’s sharp 7% daily drop confirms a structural failure below the $100 psychological level. Today’s drop pushed SOL decisively beneath this pivot, shifting short-term control back to sellers and exposing the lower end of the established range. SOL price has been trading inside a broad horizontal distribution, capped near $110–$115 and supported around $88–$92. The latest decline followed a lower high near $108, completing a classic range rejection pattern rather than a trend continuation setup. The breakdown below $100 is critical because it removes the midpoint support of this range, increasing the probability of a full rotation toward the lower boundary. The price action also shows SOL slipping below its rising mid-range trend guide, signaling momentum deterioration rather than healthy consolidation. 

SOL Price

As long as price remains capped below $100–$102, upside attempts are likely to be corrective in nature, with sellers defending that zone aggressively. In this context, the $90–$92 area becomes the immediate level to watch, as it aligns with prior demand absorption and multiple historical reactions. A clean daily close below $88 would invalidate the current range and open downside risk toward $78–$80, where the next high-timeframe demand zone emerges. On the flip side, stabilization above $90 followed by a reclaim of $100 would signal that today’s sell-off was a liquidity sweep rather than a trend shift, allowing for a recovery move back toward $108–$110  though still within range, not a breakout.

UNUS SED LEO (LEO) Finds Its Footing Near $8: Can the Recovery Hold?

UNUS SED LEO (LEO) Finds Its Footing Near $8 Can the Recovery Hold

The post UNUS SED LEO (LEO) Finds Its Footing Near $8: Can the Recovery Hold? appeared first on Coinpedia Fintech News

LEO price is attempting to steady itself after a recent pullback, rising more than 2% in the latest session as buyers stepped in near the $8 level. The move comes after several days of persistent selling that pushed the token toward a price zone that has repeatedly acted as a floor in the past.

While the rebound is modest, it stands out because it comes at a time when broader market conditions remain uncertain. Instead of accelerating lower, LEO slowed its decline, found support, and began to move higher, raising an important question for traders: Is this just a temporary bounce, or a sign that downside pressure is starting to fade?

LEO Price Action Stabilizes After Testing Demand Zone

LEO’s recent decline pushed the token toward the $8 demand zone, a region that has historically acted as a buying region. After sliding for several sessions, LEO finally found support around $8,demand zone. As price reached this level, selling pressure visibly weakened. The recent bounce reflects defensive buying, not aggressive accumulation. The daily RSI has moved out of the oversold region and is now hovering around 40s. While this does not confirm bullish momentum yet, it does indicate that selling pressure has cooled. In strong bearish trends, RSI tends to remain pinned below 30-35, something LEO has avoided during this bounce.

LEO price

At the same time, MACD remains negative but is flattening, with the histogram showing declining bearish momentum. This often precedes range formation or a short-term relief move, especially when price is sitting on a well-defined zone like $8. While LEO price is still trading below its 50-day and 100-day EMAs, which keeps the broader structure cautious. 

Where LEO Price Goes Next?

Zooming out, LEO price remains inside a broader consolidation range rather than a clear trend. The recent rebound does not invalidate the larger sideways structure, but it does reinforce the idea that the token is respecting the demand zone of $8. On the upside, the first hurdle to watch sits around the $9-$9.50 region. This region has repeatedly acted as a reaction zone where prior rebounds stalled. A clean move above it would indicate improving strength and open the door toward the upper range near $10. However, resistance remains heavy, without a strong follow-through, LEO price may struggle to sustain gains beyond the mid-range. That keeps the outlook balanced rather than outright bullish.

Meanwhile, UNUS SED LEO is showing early signs of a base-building phase. The higher-lows on shorter timeframes and reduced selling pressure point toward stabilization. Still, confirmation requires continuation above resistance, not just a bounce from support. If buyers fail to build momentum and price drifts back below $8, the token likely returns to consolidation. A break below $7.50 would expose lower demand zones and invalidate the current recovery attempt.

FAQs

How high will the LEO price rise by the end of 2026?

According to our UNUS SED LEO price prediction, the digital asset might hit a maximum of $16 by the end of 2026.

Is the UNUS SED LEO (LEO) coin a good investment for the future?

In the cryptocurrency industry, LEO is among the active virtual currencies. Its value could increase if lending and saving protocols gain greater traction.

What will be the maximum price of UNUS SED LEO by the year 2030?

With a potential surge, the LEO price may reach a maximum of $44 by the end of the year 2030.

Monero Price Rebounds at Channel Support: Is XMR Headed Back Toward $500?

Monero Price Prediction January 2026: The Privacy Sector Giant Prepares for a $1,000 Run

The post Monero Price Rebounds at Channel Support: Is XMR Headed Back Toward $500? appeared first on Coinpedia Fintech News

Monero (XMR) is showing early signs of stabilization after a prolonged decline, rising over 3% on the day as price reacts from a technically significant support zone. The bounce comes at a critical moment, with XMR retesting the lower edge of a multi-week rising channel while broader crypto markets remain fragile. This creates a familiar dilemma: Is the move simply a relief bounce inside a weakening trend, or the early phase of a rotation back toward the upper channel near $500?

Monero Price Defends Channel Support: Reversal Imminent?

Monero’s price has defended the channel support zone of $380 and showed a pullback during the intraday session. This bounce has remained orderly rather than impulsive. As XMR approached the lower edge of the channel, selling pressure slowed gradually, with downside wicks expanded, suggesting sellers are no longer in control at current levels. Technically, the $360-$380 region has emerged as a demand zone.

Monero price chart

As long as Monero price holds above this zone, the broader channel structure remains intact. The immediate test now lies at $390-$400, where sellers placed their positions. A strong break of this region would shift the corrective structure to neutral-bullish, opening the door toward $420-$450. While further strength above the 50-day EMA mark could extend the recovery toward the $480-$500 zone back into focus as a rotational target rather than a distant hope. On the other side, a break below $360, however, would invalidate the channel and expose deeper downside making the current bounce technically decisive.

Open Interest and Liquidation Map Point to Short-Covering Risk

Derivatives data adds weight to the rebound scenario. Monero’s future open interest has risen above $142 million, up more than 4% even as price stabilizes, a sign that traders are adding exposure, not exiting. This increase in open interest alongside price rise often signals shorts being forced to defend positions, especially when price sits near crucial support. 

XMR Liquidation map

Liquidation heatmap data shows a clean cluster of short liquidation levels stacked above the current range, particularly between $390 and $410. If XMR price pushes into this zone, forced short closures could accelerate upside momentum, turning a slow rebound into a sharp squeeze. At the same time, downside liquidation pressure appears relatively thin below current price levels, reinforcing the idea that sell-side leverage has already been flushed during the prior decline.

Broader Context Keeps Reversal in Check

Despite the improving micro-structure, Monero is still trading within a broader environment of risk aversion, where capital remains selective and volatility elevated. Privacy-focused assets have lagged during recent market weakness, making confirmation, not anticipation. This means the rebound needs a follow-through, not just reaction. Without acceptance above reclaimed resistance, the move risks fading into another lower-high sequence. As XMR price remains at a decision point, holding above the support zone of $360 keeps the path toward $400-$420 viable.

FAQs

Is Monero (XMR) showing signs of a price reversal?

Monero is stabilizing at a key support zone, suggesting selling pressure is easing, but a confirmed reversal needs a breakout above $400.

Why is Monero price bouncing despite weak crypto markets?

XMR is reacting to strong technical support and short-covering pressure, even as overall market sentiment remains cautious.

What price levels should traders watch next for XMR?

Immediate resistance sits near $390–$400. A clean break could open the path toward $420–$450, while a drop below $360 weakens the setup.

❌