ONDO price is hovering around $0.2539, up roughly 20% from its recent $0.2017 low, and the timing isn’t random. While broader markets remain choppy, Ondo Global Markets has already crossed $10 billion in cumulative volume since launch, a detail that cuts through the noise faster than most price charts do.
And yes, that matters. This isn’t about vibes or speculative excitement. It’s about usage. Tokenized RWAs are still the fastest-growing corner of crypto, mostly because they do something radical: they work. Global access, smoother settlement, fewer intermediaries, these are the unglamorous stuff that institutions actually care about.
Since launch, Ondo Global Markets has pushed past $10 billion in total volume. That number doesn’t come from retail gambling on memes. It comes from tokenized stocks and structured products steadily finding demand.
Tokenized stocks keep growing.
Since launch, Ondo Global Markets has surpassed $10 billion in total volume.
Tokenized RWAs continue to be the industry's fastest growing sector, unlocking global access to the world's largest markets. pic.twitter.com/PxzB8fqCto
Well, here’s the kicker: tokenization isn’t just a crypto buzzword anymore. It’s becoming financial plumbing. Industry commentary continues to frame tokenization as a way to make markets faster and more efficient, cutting down friction that traditional systems still haven’t solved.
So when volume keeps stacking up, it signals something simple and that is Ondo isn’t being “tested” anymore. It’s being used.
But let’s be real. Accessibility is only half the story. Trust is the other half. And this is where institutional behavior quietly enters the frame.
An asset manager has taken another formal step toward launching an exchange-traded product tied to Ondo by submitting an amended S-1 filing. No approvals yet. No victory laps either. Still, the filing keeps the process alive and confirms that tokenization-focused products are staying on regulatory radars.
“Tokenization has the potential to really improve operational efficiencies.”
What the ONDO Price Chart isn’t Saying?
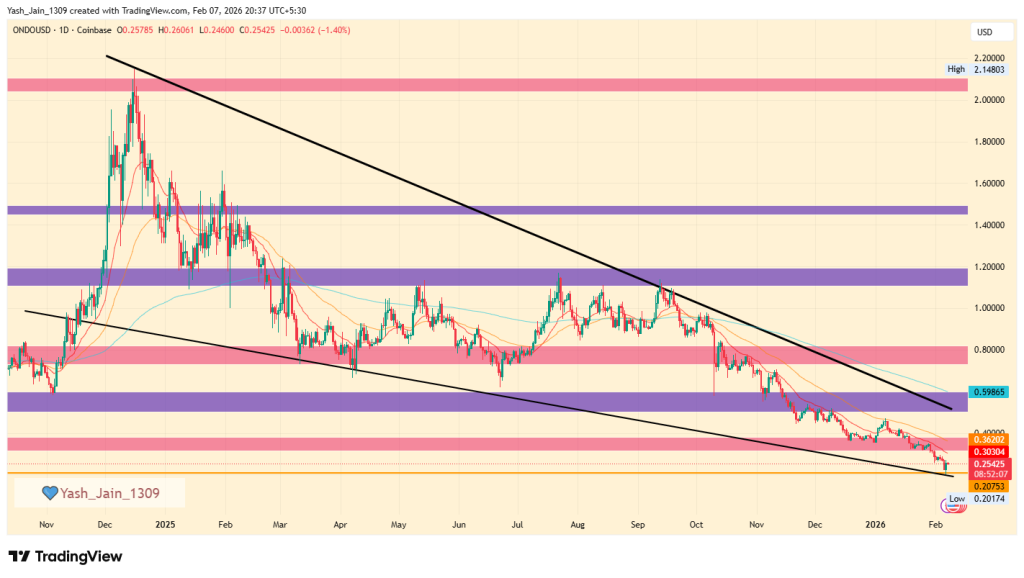
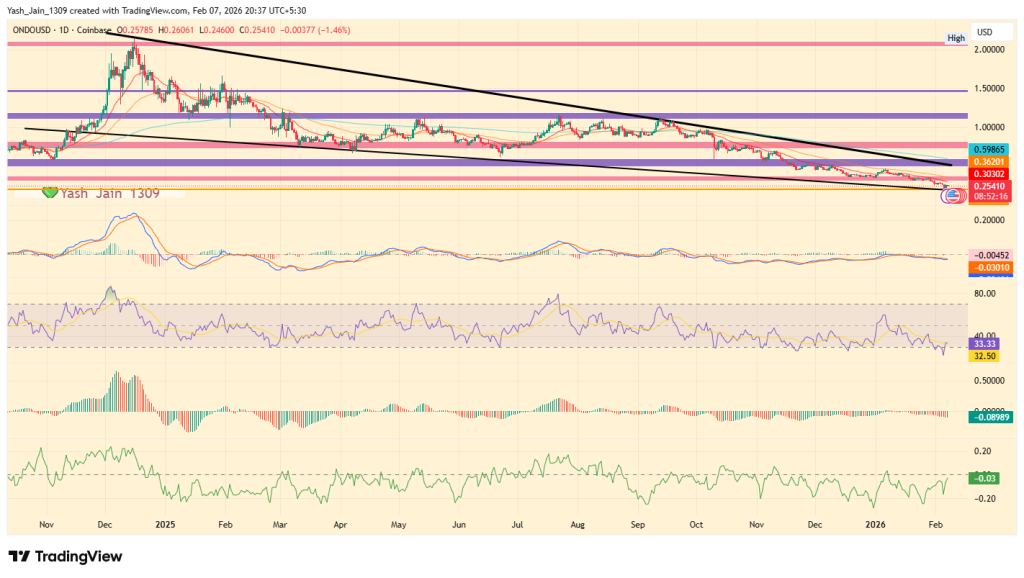
Now for the part traders keep staring at. The ONDO price chart shows price compressing near the lower boundary of a falling wedge, a structure aligning closely with the February 2024 base. Technically, it’s a pressure zone.
Momentum indicators are trying to turn. CMF is climbing. MACD and AO are improving. RSI is crawling out of oversold territory. None of this guarantees upside, but it does suggest selling pressure isn’t accelerating anymore.
If demand actually shows up, the ONDO/USD structure opens space toward the $0.60 region. Beyond that, higher levels come into view only if participation expands meaningfully. That’s where any ONDO price prediction becomes conditional, not confident.
And for now, ONDO price remains stuck between solid fundamentals and a market that still isn’t ready to reward them.
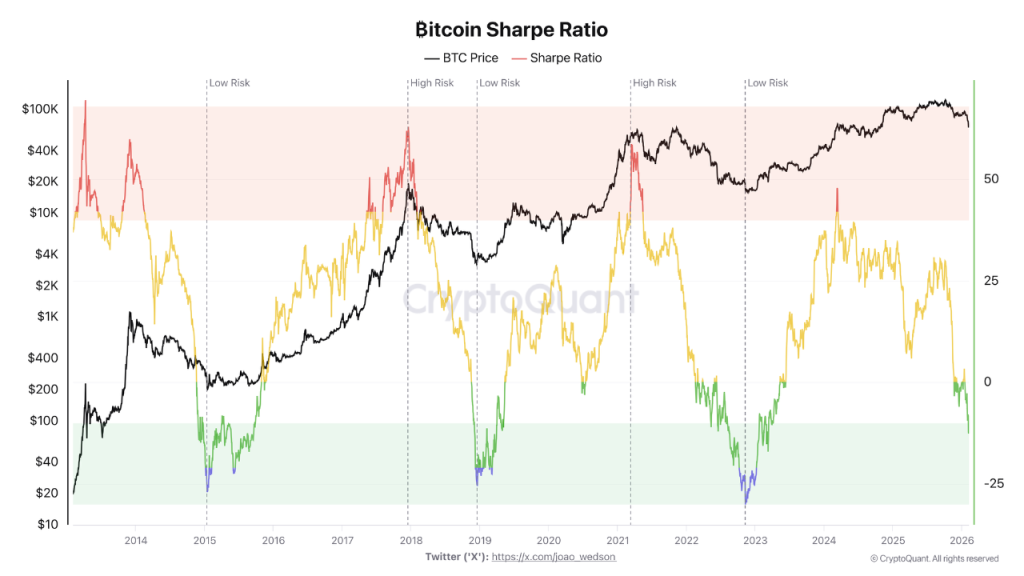
The BTC price is hovering near $68,890 today after a brief recovery from $60K. But, the key risk metric, the Sharpe Ratio, shows intact caution. It shows that BTC’s sharpe ratio has slipped into a historical bear-market zone. Rather than signaling an immediate bottom, this shift highlights rising risk relative to returns, a dynamic that has often appeared near long, complex market turning phases.
Sharpe Ratio signals growing stress, not capitulation
The Sharpe Ratio, which measures risk-adjusted returns, has now entered a zone historically associated with the later stages of Bitcoin bear markets. In practical terms, this means investors are currently taking on elevated risk for relatively weak performance.
Meanwhile, the ratio continues to deteriorate, underscoring that recent BTC returns remain insufficient to justify volatility. At the same time, this type of compression has often emerged before broader trend stabilization, not during periods of optimism.
Importantly, the Sharpe Ratio should not be interpreted as a timing tool. Rather, it reflects the consequences of price behavior already in motion. As BTC crypto performance weakens on a risk-adjusted basis, more participants find themselves underwater, increasing stress across shorter time horizons.
Contrarian dynamics begin to surface
Still, market history shows that extreme Sharpe Ratio readings often align with contrarian opportunity zones. That does not imply an imminent reversal. Instead, it suggests the market may be entering a phase where long-term positioning slowly becomes more defensible.
From a behavioral perspective, prolonged underperformance tends to reduce speculative excess, gradually shifting ownership toward participants with longer holding periods.
That said, patience remains critical. This phase can persist for months, and the BTC price today may continue adjusting lower before risk metrics begin to improve meaningfully.
BTC price chart highlights key technical magnets
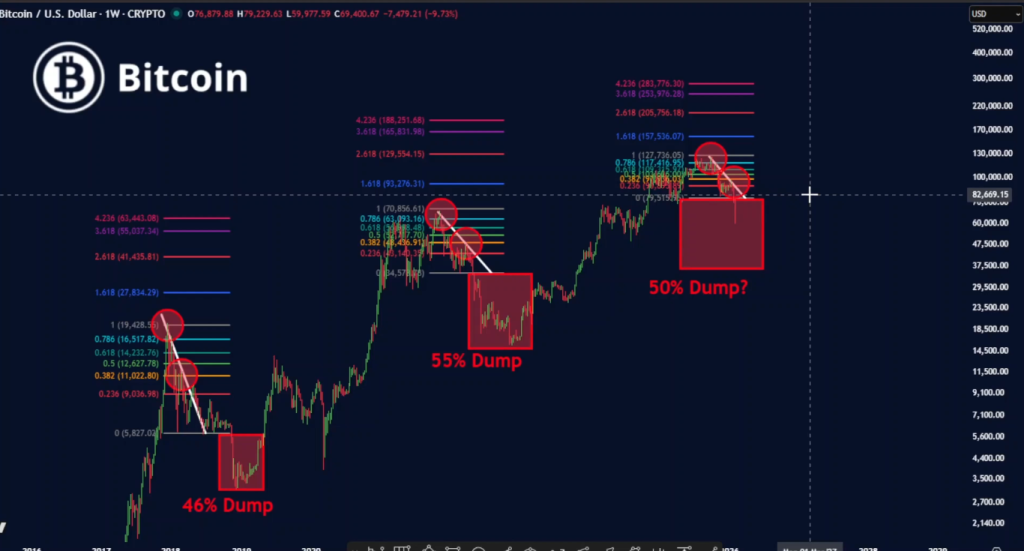
From a technical perspective, the experts presents his theory that BTC price chart reinforces cautious outlook and shows historical dip odds. Following a peak near $126,000, Bitcoin respected the 0.382 Fibonacci retracement around $78,000, an area that acted as a structural drift zone. Once that level was lost, technical focus shifted lower.
The next major retracement level sits near the 0.618 zone around $48,000, a level that may act as a longer-term magnet should corrective pressure persist.
Risk management takes center stage
As a result, investors are increasingly weighing two broad approaches. One involves gradually building exposure as risk metrics approach historically lower-risk zones. The other prioritizes confirmation, waiting for the Sharpe Ratio to clearly improve before increasing allocation. Neither path implies urgency.
Still, the current setup emphasizes discipline. The BTC price USD remains sensitive to liquidity conditions, and the developing structure suggests that time, rather than speed, is the primary variable. In this environment, BTC price behavior reflects positioning stress more than directional conviction, a dynamic that continues to shape the evolving BTC price forecast.
Price predictions for 2026 range from $0.80 to $4.15.
Long-term forecasts suggest ONDO could reach $9.30 by 2030.
ONDO Finance in the RWA sector is a hot topic, investors are closely eyeing its future potential. Especially as its native token ONDO continues to build credibility and momentum through high-profile developments.
Moreover, Ondo Finance is known to be a leading RWA provider on the Solana chain and it is witnessing growing institutional interest, ONDO has solidified itself as a major player in the Real World Asset (RWA) space.
With such attraction, the ONDO price prediction 2026 is what analysts and retail investors are intrigued about. But how far can it go from here? Let’s dive into the detailed ONDO price forecast from 2025 to 2030.
ONDO/USD has been declining since early 2025, reaching a support level around $0.20 in February 2026. A potential reversal may occur if it breaks the $0.60 resistance. Key targets for Q1 2026 are $0.80 and $1.20.
ONDO Price Prediction February 2026
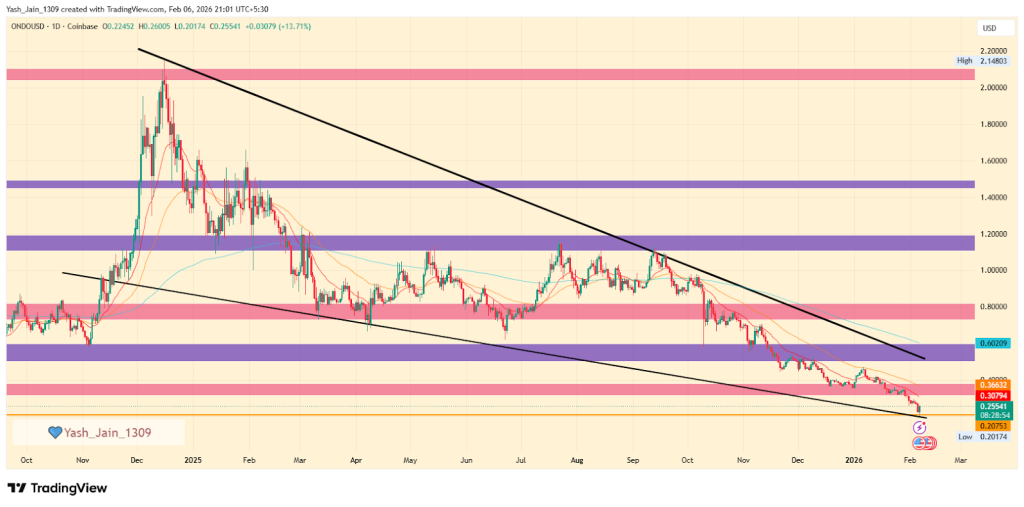
On the daily chart, the ONDO price fall continued in January and February, and also began on a bearish note.
It is now retesting the lower border of the falling wedge pattern. This support is the level where buying could be happening, and once it overflows with demand, a rise could burst its way out. Also, the falling wedge range is narrowing, and ONDO/USD is at a key support level. February could see a revisit to the $0.50-$0.60 range. If it breaks above this level, it may aim for $0.80, which could be a significant target for February. However, if it fails to do so, the price may continue to consolidate around the support level or potentially decline further.
ONDO Price Prediction 2026
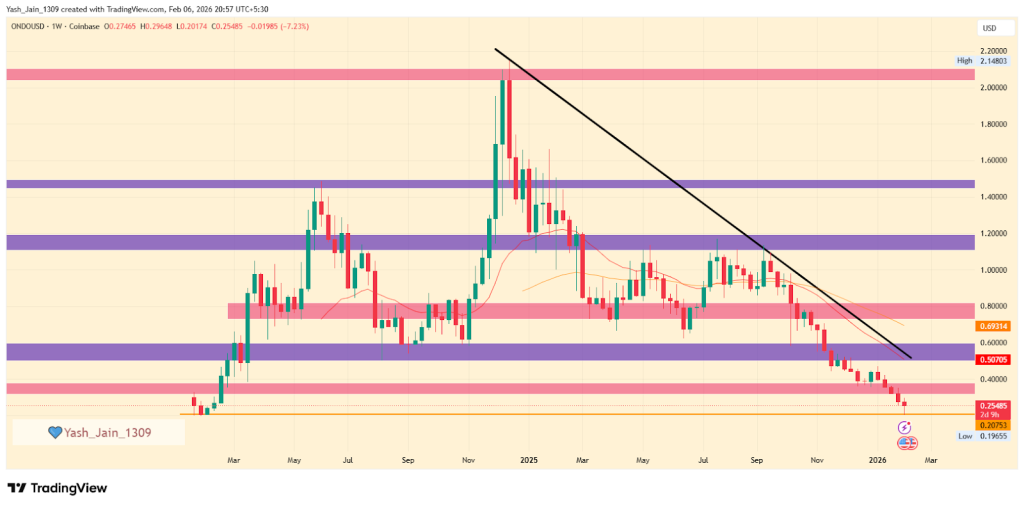
The weekly chart for ONDO/USD shows a declining trend since the start of 2025, following a high of $2.14. The descending trendline acted as a strong hurdle, characterized by lower highs and lower lows in price action, indicating reduced price volatility. The persistent bearish pressure on the weekly chart signals bear dominance.
The same price fall continued in Q1 2026, and January and early February have taken a severe hit, but it has reached February 2024 based support around $0.20 in early February 2026, which indicates that a reversal may be possible before Q1 completes in March 2026.
Looking ahead to the first quarter of 2026, the market may be ready for a rally, especially if it breaks through the $0.60 resistance. The recent establishment of $0.20 as a support level, along with increased demand for ONDO, suggests that buyers may be willing to re-enter the market at this price.
If the market surpasses the $0.60 resistance following $0.50, the next big targets for ONDO/USD would be $ 0.80 and $1.20 for Q1 2026.
ONDO Price Analysis: Onchain Outlook
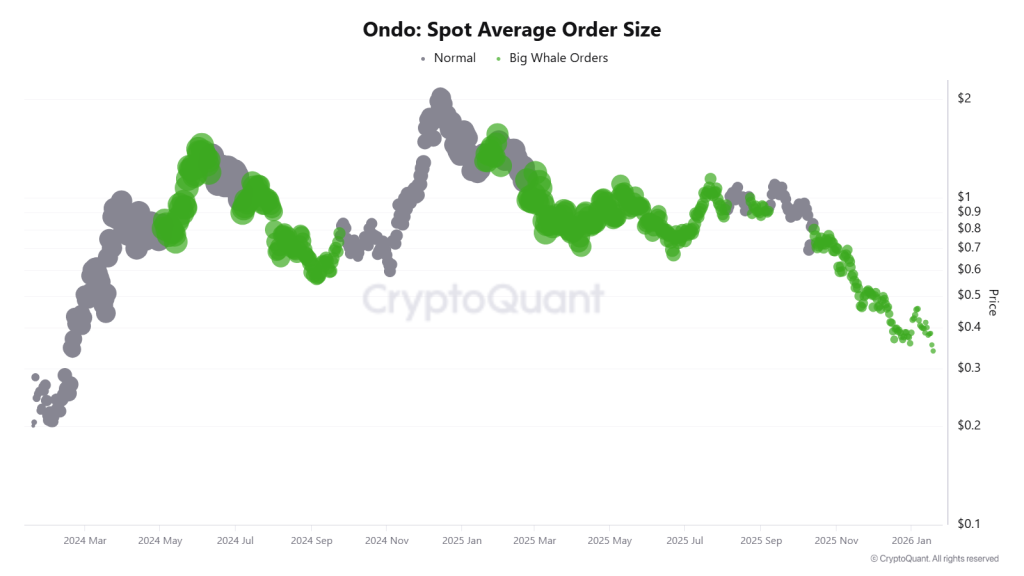
The on-chain data indicate that although the price is currently capped and has been consolidating for several months, the on-chain metrics have strengthened significantly despite the weak ONDO price action. Since January 2024, the number of confirmed transactions sent to a project’s contracts has increased. By December 2025, the project had surpassed 1.3 million transactions, making it the second-largest project for real-world asset (RWA) issuance after BitGo.
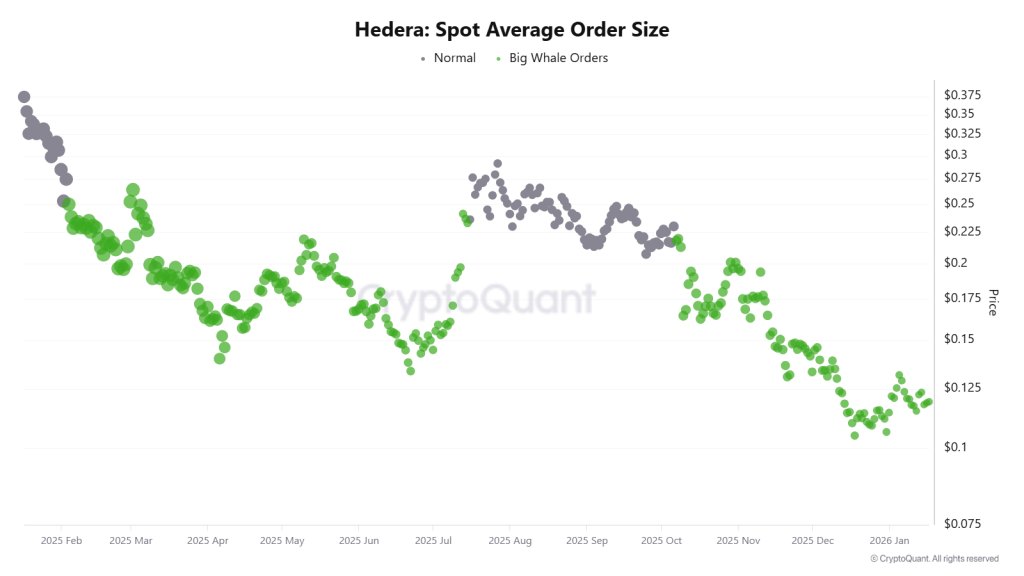
Additionally, the “Spot Average Order Size” maintains high levels (represented by green dots) while the price is declining; it is a classic signal of Whale Absorption. Therefore, this Consistent whale activity confirms institutional conviction in the RWA (Real World Asset) sector.
ONDO Cryptocurrency Price Target 2026 – 2030
Year
Potential Low ($)
Potential Average ($)
Potential High ($)
2026
1.65
2.75
4.15
2027
2.20
3.65
5.25
2028
2.95
4.30
6.90
2029
4.75
5.60
8.45
2030
5.35
7.45
9.30
Ondo Coin Future Forecast 2026
The price projection of ONDO crypto for 2026 could range between $0.20 to $2.15, with an average trading price of roughly $1.25.
Ondo Token Price Prediction 2027
This altcoin could hit a potential high of $5.25 in 2027, with a potential low of $2.10, and an average price of $3.65.
ONDO Price Prediction Next Bullrun 2028
By 2028, forecasts indicate a potential low of $2.95 and a high of $6.90. This could bring the average price to $4.30.
Ondo Price Forecast Long-term 2029
During 2029, the price of the Ondo token is anticipated to reach a minimum of $4.75, with a maximum of $8.45, and an average price of $5.60.
ONDO Coin Price Growth Potential 2030
ONDO coin price may reach a high of $9.30 in 2030. With a potential low of $5.35. With this, the average price could settle at around $7.45.
Market Analysis
Firm Name
2025
2026
2030
Changelly
$1.32
$1.87
$8.26
priceprediction.net
$1.34
$2.03
$8.43
DigitalCoinPrice
$2.01
$2.29
$5.01
Never Miss a Beat in the Crypto World!
Stay ahead with breaking news, expert analysis, and real-time updates on the latest trends in Bitcoin, altcoins, DeFi, NFTs, and more.
FAQs
How much is Ondo crypto worth today?
At the time of writing, the price of the Ondo token was $ 0.25827081.
What is the ONDO price prediction for 2026?
ONDO price in 2026 is projected to range between $1.65 and $4.15, with an average near $2.75 if RWA adoption continues to grow.
Is Ondo Finance a good long-term investment?
Ondo Finance shows long-term potential due to strong on-chain growth and its leading role in the real-world asset sector, though market risk remains.
What is the Ondo price prediction for 2030?
By 2030, ONDO price could reach up to $9.30, with sustained growth driven by institutional adoption and expansion of tokenized assets.
The live price of the Hyperliquid crypto is $ 33.18341266.
The 2025 HYPE price suggests it could hit $40-$105 in 2026.
Forecasts suggest that HYPE could reach a potential average price by 2030 of around $125, with highs up to $185.
The crypto market is buzzing with excitement over Hyperliquid and its native token, HYPE. As a decentralized, paperless alternative to platforms like Binance and Coinbase, Hyperliquid is quickly gaining traction, prompting investors to look closely at the HYPE price prediction for 2026 and beyond.
With its unique “HyperBFT” consensus mechanism, lightning-fast transactions, and zero KYC hurdles, Hyperliquid is rewriting the rules of perpetual trading. Beyond its consensus mechanism, Hyperliquid also allows users to trade crypto perpetual futures, including major assets like BTC, ETH, SOL, AVAX, and SUI, even without owning the underlying asset.
As the platform gains traction for its streamlined trading experience, many investors are now turning to analyze the HYPE token price outlook. But does its innovative model signal long-term growth for HYPE Token Price?
In this article, we dive deep into market sentiment and Hyperliquid price projections from 2026 to 2030.
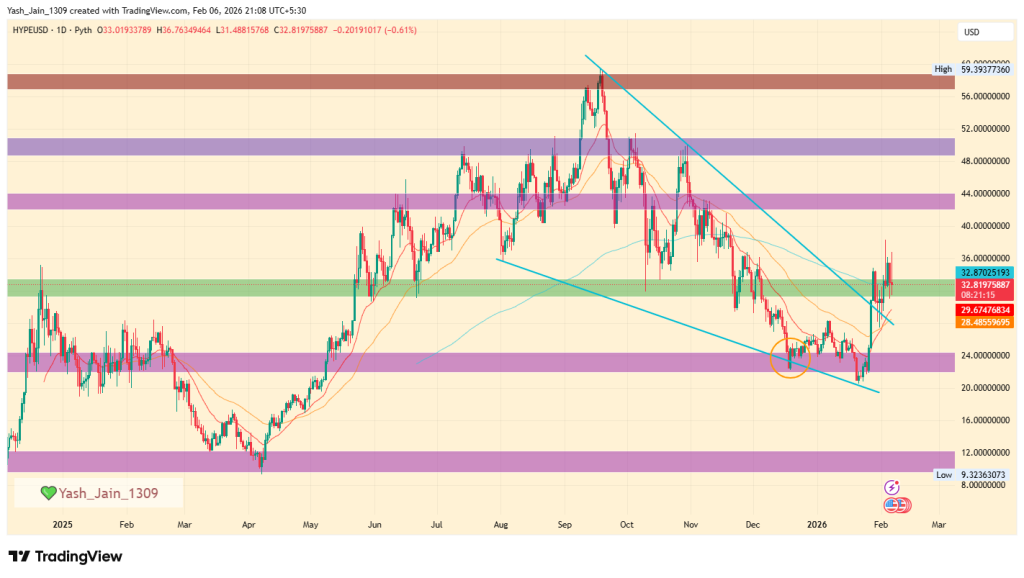
In January 2026, the price rallied 70% from $20 to $35, signaling strong bullish sentiment. The breakout from a falling wedge pattern, starting from a demand zone around $22-$24, signals a rally in Q1 2026. If the market clears consolidation near $33, we could see prices rise toward $42 soon.
Hyperliquid Price Prediction 2026
After closing 2025 around $24, January 2026 kicked off with a stunning rally in the final week, soaring 70% from $20 to $35. This surge unmistakably shows that bulls are aggressively buying, determined to drive HYPE prices back up. The Q4 2025 chart has clearly formed a falling wedge pattern, and with this recent movement, a breakout has been achieved. The January rally originates directly from its lower boundary, perfectly aligning with a robust horizontal demand zone around $22-$24. This optimal setup strongly signals a powerful rally that is set to unfold in Q1 2026.
We have already witnessed a breakout from the pattern, and the retest phase that began in early February on the upper border confirms our expectations. Once the market breaks through the current consolidation around $33, a significant rally toward the $42 mark is inevitable. This crucial breakout will undoubtedly attract even more buying interest, reinforcing the bullish sentiment and setting the stage for substantial gains ahead.
HYPE On-Chain Outlook
The Dune analytics dashboard provided an quick on-chain overview of the utility metrics of the Hyperliquid token (HYPE), which appears to be improving significantly with each passing month.
HyperEVM total transaction fees have surpassed 235.57K and are at an ATH, and total trading volume has crossed $3.64 trillion and is at an ATH. Even its revenue has reached an ATH, crossing $993 million.
All the major metrics suggest that it is experiencing great adoption among peers, and its on-chain metrics are proof of that, suggesting that if the rally occurs, then 2026 might end on very good numbers.
Hyperliquid Coin Price Targets 2026 – 2030
Year
Potential Low ($)
Potential Average ($)
Potential High ($)
2026
25
50
90
2027
40
75
105
2028
55
95
130
2029
85
110
155
2030
105
125
185
HYPE Price Projection 2026
By 2026, the value of a single Hyperliquid token price could reach a maximum value of $90 with a potential low of $25. With this, the average price could land at around the $50 level.
Hyperliquid Coin Price Prediction 2027
During 2027, the HYPE could reach a maximum value of $105 with a potential low of $40. Considering this, the average price of this altcoin could settle at around $75.
HYPE Crypto Price Action 2028
The Hyperliquid price could achieve the $130 milestone by the year 2028. On the flip side, the altcoin could record a low of $55 and an average price of $95.
Hyperliquid Price Analysis 2029
The HYPE crypto prediction for the year 2029 could range between $85 to $155 and the average price could be around $110.
HYPE Price Prediction 2030
Looking forward to 2030, the Hyperliquid Price may range between $105 and $185, and a potential average value of around $125.
Market Analysis
Firm Name
2025
2026
2030
Binance
$37
$63
$164
DigitalCoinPrice
$76
$54
$97
*The aforementioned targets are the average targets set by the respective firms.
CoinPedia’s HYPE Price Projection
This Layer-1 project has taken the crypto market by storm within a short time frame. With a market cap of over $7 billion, this altcoin has successfully secured a position in the top 25. Moreover, with the mass adoption, this altcoin could claim a spot in the top 10 during the upcoming bull run.
If the bullish sentiment intensifies, the Hyperliquid price will reach a high of $41.39 this year. On the flip side, if the market experiences unfavorable events, this could result in this altcoin settling at a low of $14.65.
Year
Potential Low
Potential Average
Potential High
2025
$14.65
$28.02
$41.39
Never Miss a Beat in the Crypto World!
Stay ahead with breaking news, expert analysis, and real-time updates on the latest trends in Bitcoin, altcoins, DeFi, NFTs, and more.
FAQs
What is Hyperliquid (HYPE) and why is it gaining popularity?
Hyperliquid is a fast, decentralized trading platform with no KYC and low fees, making HYPE popular among traders seeking speed and independence.
What is the Hyperliquid (HYPE) price prediction for 2026?
HYPE price in 2026 is projected to range between $25 and $90, with an average near $60 if adoption and trading volumes keep rising.
What could HYPE be worth by 2030?
Long-term projections suggest HYPE might reach an average of $125 by 2030, with possible highs near $185 if platform usage keeps expanding.
Is Hyperliquid (HYPE) a good long-term investment?
HYPE may appeal to long-term investors due to strong platform growth, but like all crypto, it carries risk and requires careful research.
Hedera Price prediction highlights HBAR could reach $0.45-$1.05 in 2026.
The Long-term forecasts suggest HBAR could hit $2.20 by 2030, indicating stable growth potential.
Hedera has been making waves in the cryptocurrency space, with a fast and secure blockchain that offers a distinct approach to transaction processing compared to Ethereum and other smart contract chains. It’s permission-only, meaning the blockchain is managed by private companies. Limiting what types of decentralised applications are allowed is what makes Hedera stand out from the rest.
Having entered the top 20 digital assets by market cap in 2024, it is now eyeing a potential leap into the top 10 by the end of 2025. Hedera has also recently ramped up its development activities for its ecosystem. Its ecosystem is strengthening, despite its capped price action. With increasing real-world use cases, institutional interest, and strategic partnerships, many are closely tracking HBAR price chart 2025 to gauge how high the token can rise.
With major companies like Google, IBM, and Chainlink Labs backing the project, and discussions about SEC approved HBAR ETF would flood string liquidity. Many are intrigued that: Will the HBAR Price Reach $1? Let’s discuss this in our Hedera price prediction 2025 article.
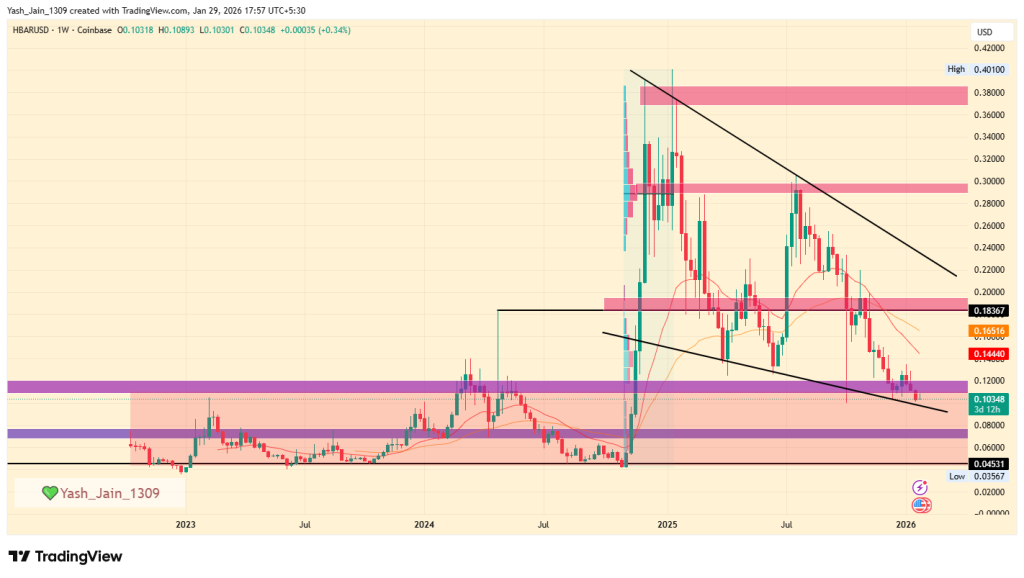
HBAR’s price fell to $0.105 by January 2026, despite having an ETF and direct access to institutional flows, due to low demand. If support holds at $0.075 to $0.080, a recovery rally may emerge in Q1 2026. However, falling below this level could raise investor concerns, while a price increase could encounter resistance at $0.1930, with further potential at $0.2835 and $0.4010.
HBAR Price Prediction 2026: What’s Next for Hedera?
The HBAR price has experienced a prolonged period of consolidation below $0.120, lasting nearly 2 years from 2023 to the third quarter of 2024. Then a rally in Q4 2024 pushed it to $0.4010. But by the end of 2025, it is back below $0.120, and by the end of January 2026, it has slipped to $0.105.
Despite an ETF, the price is witnessing lower demand and consolidating at the lower border of a falling wedge. This setup looks promising if $0.100-$0.105 holds its support, which closely aligns with the pattern’s lower border.
As we look ahead to the first quarter of 2026, there’s optimism based on this pattern. Currently, a strong range-bound price action is witnessed. A successful recovery rally from this point would indicate robust demand and could signal a stronger upward move.
On the other hand, entering below this price zone could also raise concerns among investors, as market fluctuations and investor sentiment may lead to uncertainty. But, if it really spikes, then $0.1930 is key resistance in the immediate term and beyond this, 2026 could revisit $0.2835, followed by $0.4010 high.
HBAR On-Chain & ETF analysis
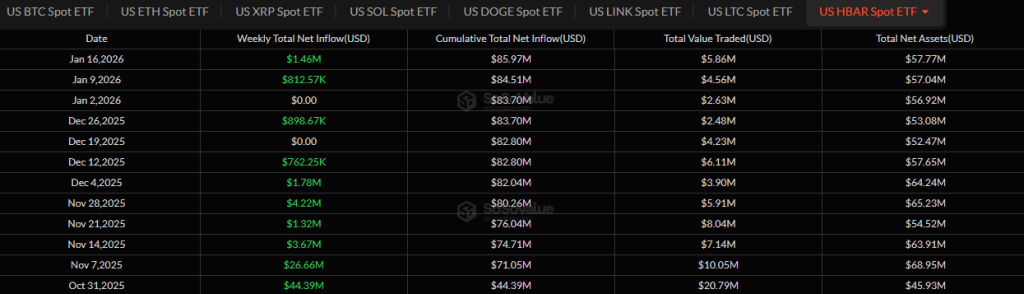
The HBAR ETF is gaining momentum once again, with $1.46 million in inflows this week. The last time we saw such significant inflows was in early December, when it reached $1.78 million. This suggests liquidity is flowing into HBAR, potentially signaling a price rise.
Also, large orders from whales have been increasing since mid-October, suggesting that they are purchasing HBAR on every price decline.
Year
Potential Low
Potential Average
Potential High
2026 (conservative)
$0.15
$0.40
$0.75
HBAR Price Prediction 2026 – 2030
Year
Potential Low
Potential Average
Potential High
2026
$0.45
$0.80
$1.05
2027
$0.60
$0.95
$1.20
2028
$0.65
$1.10
$1.40
2029
$0.70
$1.35
$1.60
2030
$0.95
$1.70
$2.20
HBAR Price Prediction 2026
Moving forward to 2026, forecast prices and technical analysis project that Hedera’s price is expected to reach a minimum of $0.45. The price could escalate to $1.05 on the higher end, with an average trading price hovering around $0.80.
HBAR Price Forecast 2027
Looking ahead to 2027, the optimism around Hedera will lead to steady growth. Hence, the HBAR price is forecasted to reach a low of $0.60, with a potential high touching $1.20 and an average forecast price of $0.95.
Hedera Price Forecast 2028
As we advance to 2028, with moderate gains, the HBAR predictions indicate that the price of a single HBAR could reach a minimum of $0.65, with the ceiling potentially rising to $1.40. Within the range, the average price will be $1.10.
HBAR Price Target 2029
By the time 2029 rolls around, it’s predicted that Hedera’s price will maintain its upward trajectory, reaching a minimum of $0.70, with the maximum price possibly reaching $1.60 and an average of $1.35, reflecting cautious optimism.
Hedera Price Prediction 2030
By the end of this decade, HBAR is predicted to touch its lowest price at $0.95, aiming for a high of $1.70 and an average price of $2.20. Hence, the prediction suggests stable long-term growth for Hedera’s market value.
Market Analysis
Firm
2026
2030
Changelly
$0.370
$1.74
priceprediction.net
$0.40
$1.99
DigitalCoinPrice
$0.50
$1.07
Coinpedia’s Hedera Price Prediction
By the end of 2025, the recovery run in HBAR prices is expected to continue with a gradual rise in momentum. Hence, by the end of 2025, Coinpedia’s HBAR price forecast expects a potential high of $0.80 with a solid support at $0.40, making an average of $0.60.
Year
Potential Low
Potential Average
Potential High
2025
$0.40
$0.60
$0.80
Never Miss a Beat in the Crypto World!
Stay ahead with breaking news, expert analysis, and real-time updates on the latest trends in Bitcoin, altcoins, DeFi, NFTs, and more.
FAQs
What is the HBAR price prediction for 2026?
HBAR price in 2026 is projected to trade between $0.45 and $1.05, with an average near $0.80 under favorable market conditions.
What is the Hedera price prediction for 2030?
By 2030, HBAR price could rise to around $2.20 if network growth, partnerships, and broader crypto adoption continue steadily.
Is Hedera a good long-term investment?
Hedera shows long-term potential due to enterprise adoption, real-world use cases, and strong governance, though price cycles still affect returns.
The LINK price is trading near $8.60, under pressure despite a fresh catalyst from the Chainlink Reserve, which added over 125,000 LINK in a single update. While broader crypto markets weaken, on-chain accumulation and ETF flows suggest a widening disconnect between price action and underlying demand.
The Chainlink Reserve continues to expand its footprint as a long-term sustainability mechanism for the network. According to official data, the reserve has accumulated 125,454.48 LINK, bringing total holdings to approximately 1.9 million LINK. This reserve is funded through a combination of off-chain enterprise revenue and on-chain service usage, reinforcing its role as infrastructure rather than a market-facing liquidity tool.
RESERVE UPDATE
Today, the Chainlink Reserve has accumulated 125,454.48 LINK.
Meanwhile, this steady accumulation occurs independently of short-term LINK price USD fluctuations. That separation is notable. Historically, reserves of this nature tend to grow during periods of suppressed market confidence, when usage-driven revenues quietly outpace speculative demand.
At the same time, the reserve’s design reduces reliance on inflationary incentives, aligning with Chainlink’s broader goal of long-term network sustainability rather than cyclical price appreciation.
ETF Inflows Contrast Broader Crypto Outflows
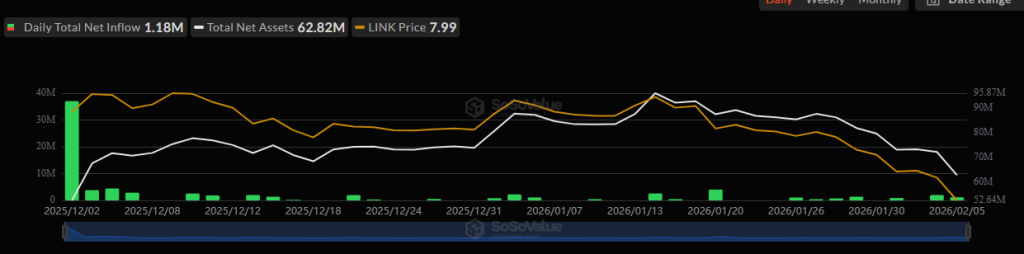
From a flows perspective, Chainlink stands out. While Bitcoin and Ethereum ETFs have experienced consistent outflows during recent market stress, LINK ETF products have yet to record a single day of net outflows. Data shows cumulative inflows of $78.63 million, representing roughly 1.11% of LINK’s market capitalization.
Notably, institutional vehicles such as Grayscale and Bitwise have maintained their exposure even as volatility increased. That persistence suggests portfolio-level conviction rather than momentum-driven positioning. Still, ETF stability alone has not insulated the LINK price chart from downside pressure.
Whale Distribution Adds Near-Term Pressure
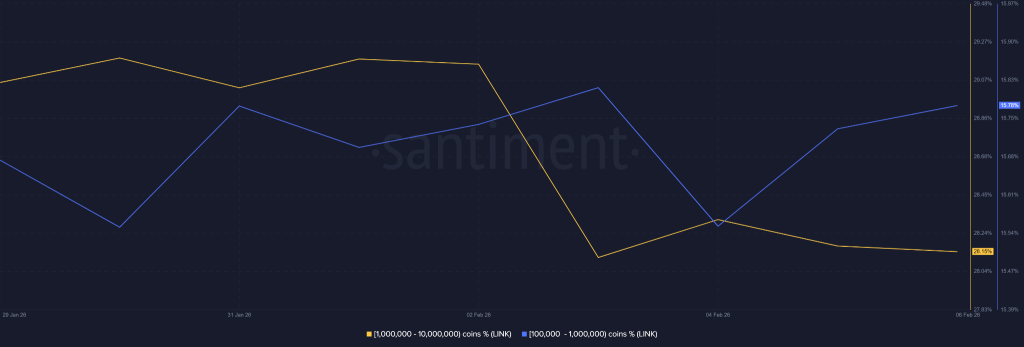
That said, on-chain supply distribution reveals a more complex picture. Addresses holding between 1 million and 10 million LINK have been net sellers over the past 48 hours. This cohort historically acts as a liquidity driver during periods of market stress, and their activity aligns with recent downside moves.
Conversely, wallets holding 100,000 to 1 million LINK continue to accumulate. This divergence suggests a transfer of supply from larger entities to mid-sized holders rather than broad capitulation. Still, until selling from the upper bracket cools, downward pressure on LINK crypto markets may persist.
Technical Zones and Risk Framing
From a technical perspective, analysts continue to closely monitor lower channel supports. If demand weakens further, $5 appears as a historically relevant zone where price compression previously stabilized. A deeper downside scenario places attention on the $1.20 region, which aligns with long-term cycle extremes rather than base expectations.
Still, the LINK price analysis suggests that these levels on chart function more as stress-test markers than forecasts. With the LINK price already down materially from cycle highs, further declines would likely require sustained macro deterioration and continued whale distribution.
BTC price rebounded to nearly $69,500 after briefly breaking down toward $60,000 in recent week, triggering debate over whether the move reflects stabilization or a classic dead-cat bounce. While crowd sentiment has flipped deeply bearish, on-chain data shows rising whale exchange activity, adding complexity to Bitcoin’s short-term outlook.
Crowd Psychology Turns Deeply Bearish After Sharp Selloff
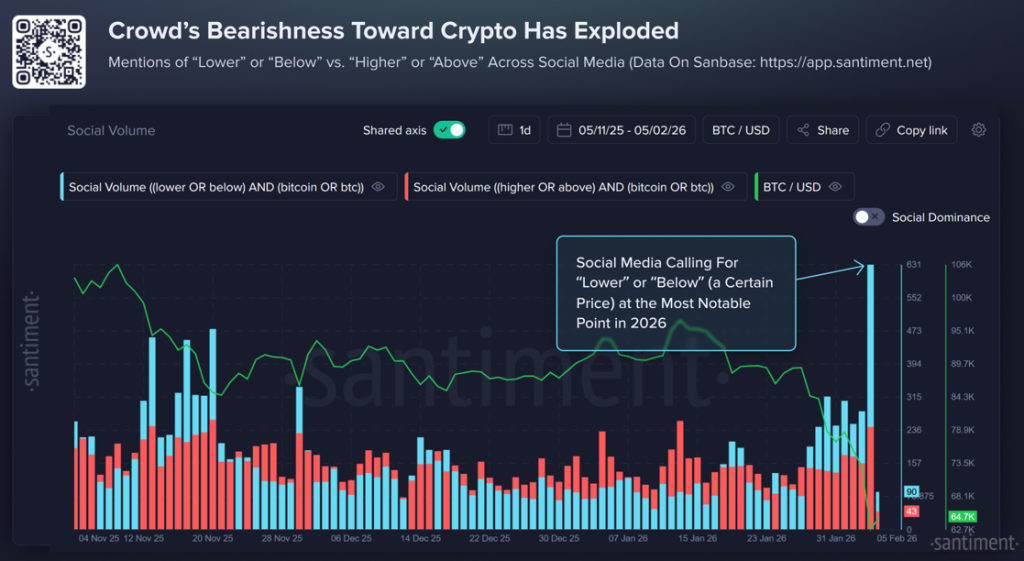
When markets fall aggressively, expectations often follow price. After BTC price slipped to $60,000, social sentiment quickly shifted toward calls for “lower” and “below,” signaling widespread fear among retail participants. Historically, such spikes in bearish crowd language tend to occur closer to local inflection zones rather than continuation peaks.
Meanwhile, data tracking social volume suggests that pessimism has intensified rather than faded during the rebound toward $69,500. This imbalance indicates that confidence in the recovery remains fragile, even as price attempts to stabilize. Still, extreme fear phases often reduce immediate selling pressure, particularly if weaker hands have already exited.
Dead Cat Bounce or Short-Term Relief Rally?
That said, the ongoing recovery raises an very important question on the BTC price chart: is this merely mechanical short covering, or a response to sentiment exhaustion? Since, markets rarely move in straight lines, and violent declines are often followed by reflexive rebounds.
From a technical perspective, BTC price USD is hovering just above the weekly 200-EMA band, an area closely watched by long-term participants. A sustained hold above this region could allow price to revisit higher liquidity zones crossing the $70,000 area towards $80K-$85K. However, failure to defend this band would increase downside exposure toward the mid-$50,000s.
Whale Exchange Activity Adds Caution to the Setup
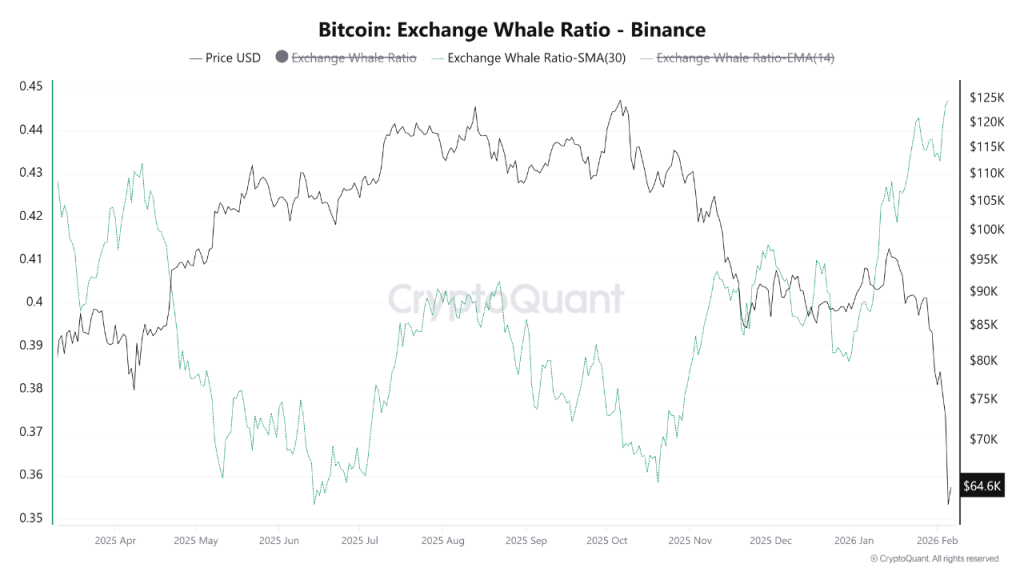
At the same time, on-chain behavior introduces a more defensive note. The Exchange Whale Ratio on Binance, smoothed over 30 days, has climbed to 0.447, its highest reading since March 2025. This suggests that large holders now account for a disproportionate share of exchange inflows.
Historically, elevated whale ratios coincide with phases of distribution or hedging rather than accumulation. As shown on the chart, this spike aligns closely with Bitcoin’s recent price decline, reinforcing the idea that larger players remain active on the sell side. Until this metric begins to cool, downside risk remains structurally present.
Contradictory Signals Keep BTC Price Range-Bound
Still, the divergence between retail fear and whale pressure creates a complex environment. While extreme pessimism among smaller participants can support short-term rebounds, continued whale dominance in exchange inflows limits upside follow-through.
From a broader lens, BTC crypto markets appear to be undergoing a reset rather than a directional trend. If price stabilizes above key moving averages, the BTC price prediction narrative could temporarily shift toward consolidation or relief rallies. Conversely, renewed weakness below support could open the path toward the $53,000 region, where prior demand has historically emerged.
In this context, BTC price remains caught between sentiment exhaustion and structural selling, making the coming weeks particularly sensitive to crowd behavior and on-chain flow shifts.
Bitcoin is currently trading at: $ 69,200.90254962
Predictions suggest BTC to hit $150K to $250K before 2026 ends.
Long-term forecasts estimate BTC prices could hit $900K by 2030.
The Bitcoin price prediction 2026 is becoming increasingly bullish as the 2025’s second half comes to a close soon, with all-time highs of $125K reached this year as the highest point.
As a wave of bullish momentum sweeps into the market, investors and traders are intrigued by its next stop.
The year was marked by optimism, driven by massive inflows into spot Bitcoin ETFs, skyrocketing institutional adoption, clearer regulations, and unwavering political support. There were several macro downturns, too, that capped BTC’s uptrend, like trade tariffs and wars.
Despite that, BTC holds its level, making it now seen as “a hedge against inflation” more than ever. Major players, including MicroStrategy, Metaplanet, and several other entities, are boldly adding BTC to their balance sheets, signaling unshakable adoption and confidence in its future.
The market enthusiasm is at a fever pitch, investors are buzzing with questions: “Can Bitcoin sustain its meteoric rise?” and “Will it redefine the financial landscape in the next five years?” This Bitcoin price prediction 2026 – 2030 dives deep into the trends driving this historic rally. Read on for the full scoop.
Coinpedia’s BTC Price Prediction 2026
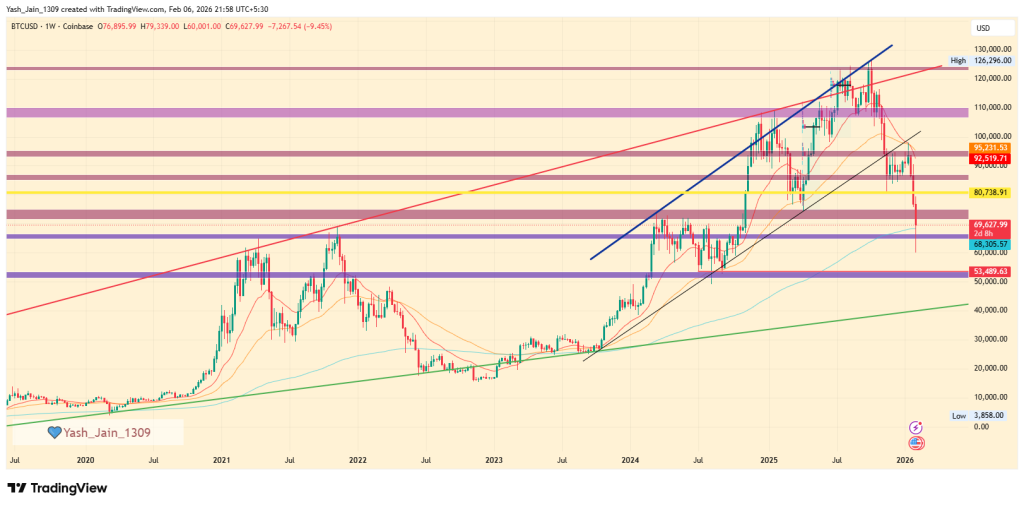
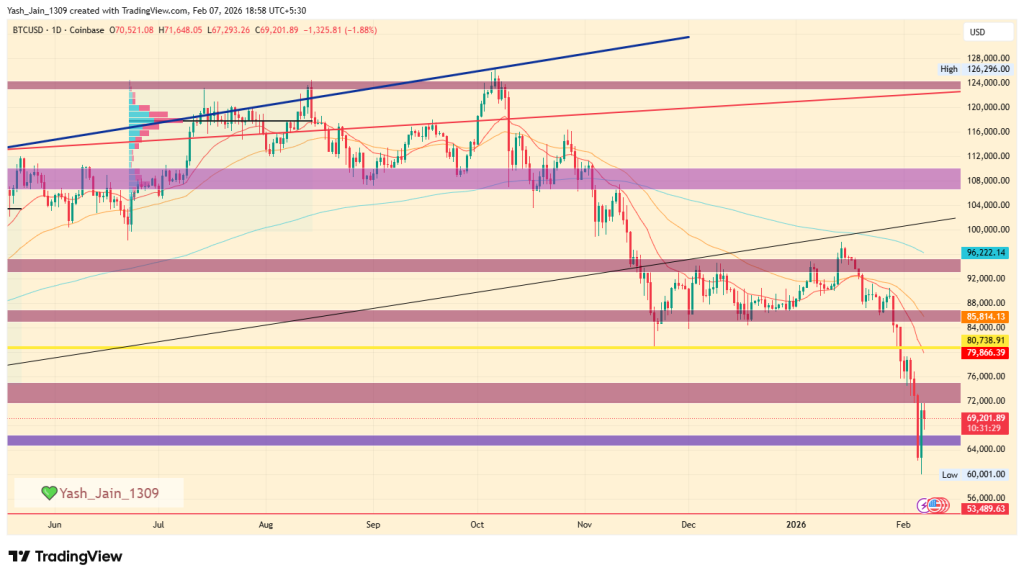
In December 2025, Bitcoin price faced resistance leading to a decline to $80,738 by January’s end. This slipped to 200-day EMA by early February. Now, a demand spike is seen but if it jumps beyond $70K, a retest of $80K-$85K is expected; below $65K could lead to a drop to $53K in Q1 2026.
What is the Bitcoin price prediction for today?
The BTC price may range between $67,364.44 and $71,681.31 today.
In early February, BTC dipped to $60, and the next day the fall reversed, briefly touching $ 70 K. Now, if it breaches $70K, we can see a retest of $75K and $80K, but if it fails to clear $70K, a fall to $65K is imminent, which could extend even further.
Bitcoin Price Prediction 2026
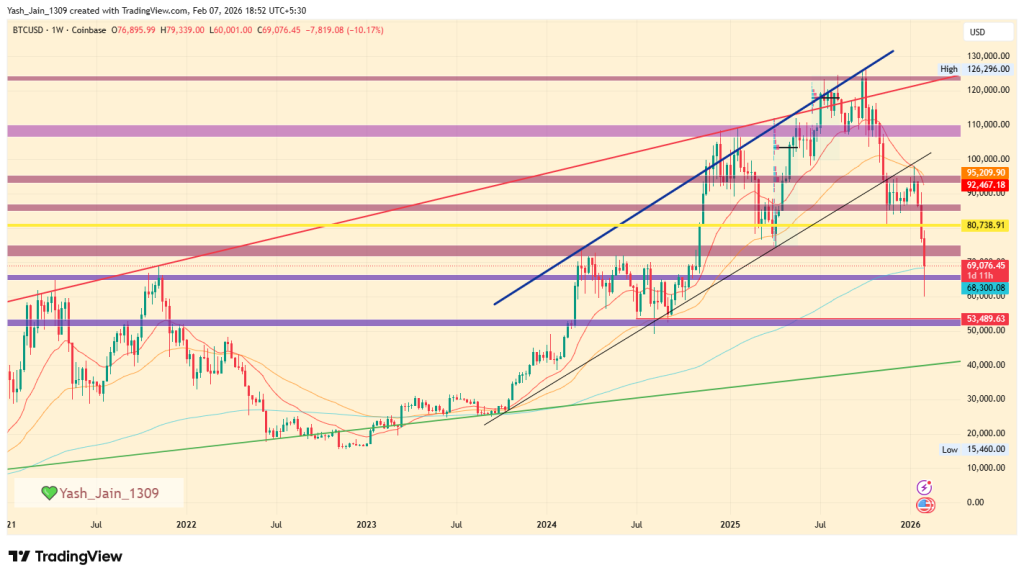
In December 2025, the Bitcoin price retested the lower border of the ascending wedge pattern as resistance, with a slight bullish attempt that proved to be a fakeout, leading to a deeper decline. This is exactly what was witnessed in January, when the fall worsened to $80738 by the end of January, and early February even briefly penetrated the 200-day EMA band. But a sudden spike came from this area, as it was an earlier demand area. If it moves beyond $70K a retest of $80K-$85K range is expected. But if the 200-EMA is lost, then the $65K support area holds extreme value. If BTC/USD doesn’t take support and keeps falling, the odds suggest that, beneath $65K, Q1 2026 could see the price fall towards $53K.
Month
Potential Low
Potential Average
Potential High
2026
$60,000-$95,000
$100,000 – $108,000
$115,000 – $118,000
Bitcoin Price On-chain Outlook
The on-chain data has showed strong accumulation in 2025 and sustained declines in exchange reserves. Crucially, this confirms the elevated institutional commitment, which is evident even in the US Spot ETFs data figures and the corporate adoption also reinforces this trend, with public company holdings nearly doubling since the start of the year.
Ultimately, a Bitcoin price prediction 2025 suggests that the future potential depends strictly on how sustained buying demand remains, as well as geopolitical stability and regulatory clarity.
If the current bullish sentiment persists, the BTC price is expected to reach a cycle high target of $150,000. Conversely, should global uncertainty intensify and sentiment turn negative, the downside risk is projected to find strong support around the $70,000 mark.
The BTC price range in 2026 is expected to be between $150K and $230K.
BTC Price Prediction 2027
Subsequently, the Bitcoin price range can be between $170K to $330K during the year 2027.
Bitcoin Predictions 2028
With the next Bitcoin halving, the price will see another bullish spark in 2028. Specifically, as per our Bitcoin Price Prediction, the potential BTC price range in 2028 is $200K to $450K.
BTC Price 2029
Thereafter, the BTC price for the year 2029 could range between $275K and $640K.
Bitcoin Price Prediction 2030
Finally, in 2030, the price of Bitcoin is predicted to maintain a positive trend. Indeed, the BTC price is expected to reach a new all-time high, ranging between $380K and $900K.
Based on the historic market sentiments and trend analysis of the largest cryptocurrency by market capitalization, here are the possible Bitcoin price targets for the longer time frames.
Year
Potential Low ($)
Potential Average ($)
Potential High ($)
2031
$540,830.43
$901,383.47
$1,261,936.86
2032
$757,162.60
$1,261,936.86
$1,766,711.60
2033
$1,059,945.80
$1,766,711.60
$2,473,477.75
2040
$5,799,454.28
$9,665,757.13
$13,532,059.98
2050
$161,978,188.65
$269,963,647.74
$377,949,106.84
Bitcoin Prediction: Analysts and Influencers’ BTC Price Target
As per the Bitcoin price forecast by Blockware Solutions, the price of 1 BTC could hit $400,000
Cathie Wood predicts the price of BTC to achieve the $3.8 million mark by 2030.
Michael Saylor-led MicroStrategy expects Bitcoin to soar beyond $13 million by 2045.
ARK Invest has increased its bullish BTC price target to $2.4 million by 2030.
Never Miss a Beat in the Crypto World!
Stay ahead with breaking news, expert analysis, and real-time updates on the latest trends in Bitcoin, altcoins, DeFi, NFTs, and more.
FAQs
What are the biggest risks to Bitcoin’s price in 2026?
Major risks include global recessions, tighter crypto regulations, declining liquidity, or a sustained breakdown below key support levels.
How much will BTC be worth in 2030?
Bitcoin price forecasts for 2030 range from $380K to $900K, driven by scarcity, long-term adoption, and expanding institutional participation.
What will be the price of Bitcoin in 2050?
While uncertain, many long-term projections suggest Bitcoin could exceed $1 million by 2050 if it becomes a global store of value.
Is Bitcoin still a good hedge against inflation in the long term?
Bitcoin’s fixed supply makes it attractive as an inflation hedge, especially during currency debasement and long-term economic uncertainty.
XRP price currently stands at $2.99, with a market capitalization of $179.79 billion. Analysts and AI forecasts alike suggest that XRP could reach $5.05 by the end of 2025. Long-term XRP price predictions also place it as high as $26.50 by 2030, with an ultra-bullish target of $526 by 2050.
Ripple (XRP) remains one of the top five crypto assets in the world, gaining traction as institutional adoption ramps up and its prolonged legal battle approaches resolution. Since President Trump’s return to office, XRP has seen a resurgence in on-chain activity, investor sentiment, and even XRP ETF approved turned it into a bluechip asset.
Now, making this the most ideal time for XRP price prediction 2026-2030 to be in more focus. Read this to know in depth what’s coming next in XRP.
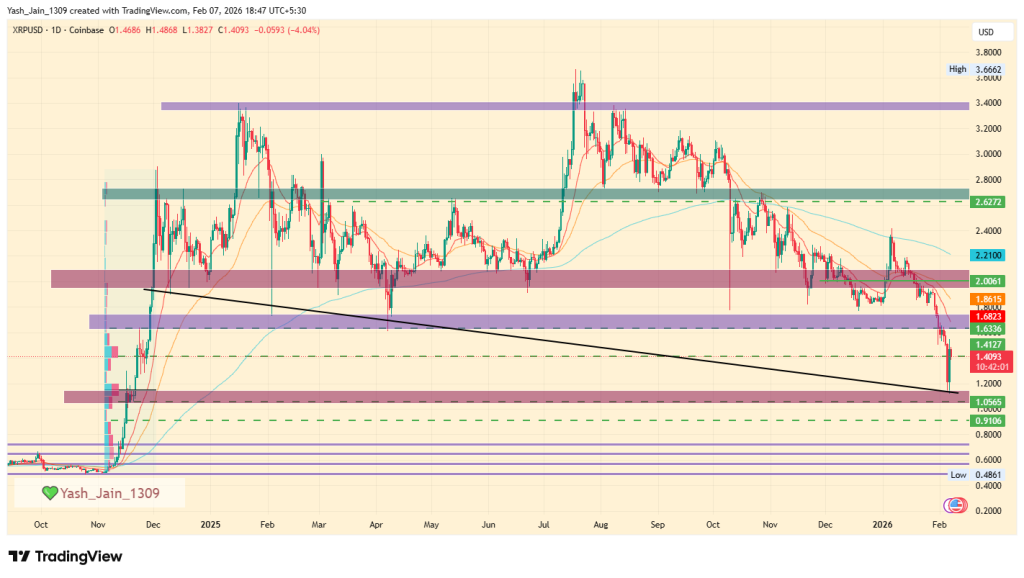
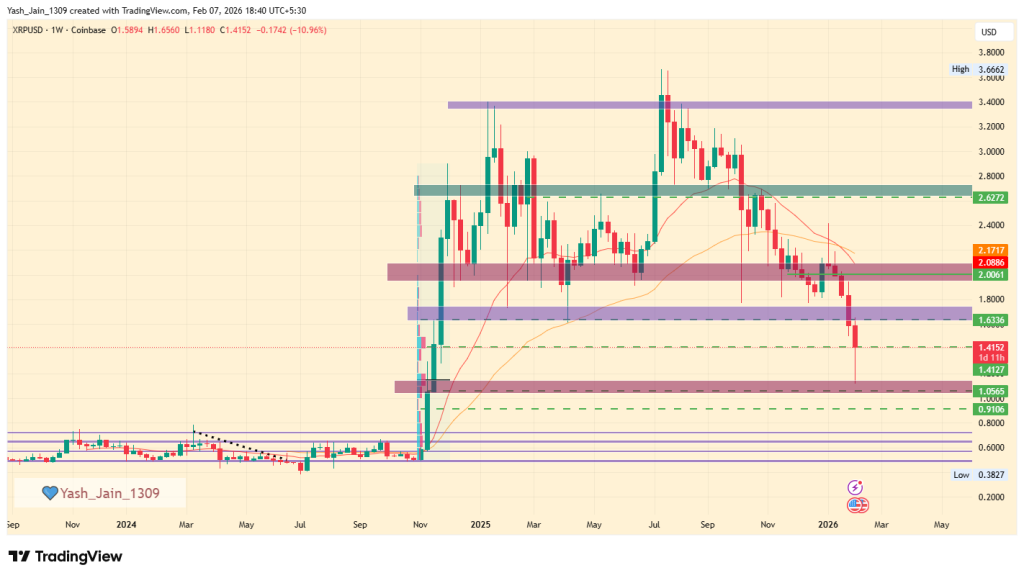
XRP has dropped to $1.15, testing demand from late Q4 2024. If it breaks $1.63, it could rise to $2.00 or $2.62. If not, it may fall to $1.00 and consolidate there in Q1 2026.
XRP Price Prediction For February 2026
A long-term declining trendline just retested in early February, and a notable spike was witnessed, which shows a rise in demand, but the rest of February’s direction will depend on its ability to clear $1.63 if it jumps, then $1.75 and $2.00 are key resistance, but if it falls, then $1.00 is a key support.
XRP Price Prediction 2026
On the weekly chart, XRP’s price shows significant weakness, falling to $1.15, a retest of the demand area built in late Q4 2024. But early February saw a quick reversal from a short-term demand.
Now, if we see recovery ongoing and manages to flip $1.63, the recovery can continue towards $2.00 or even $2.62 in Q1 2026. However, if $1.63 poses as resistance and reverses, then a fall to $1.00 is expected, and Q1 could spend consolidating around $1.0.
Year
Potential Low
Potential Average
Potential High
2026
$1.75
$3.45
$5.05
XRP Onchain Outlook
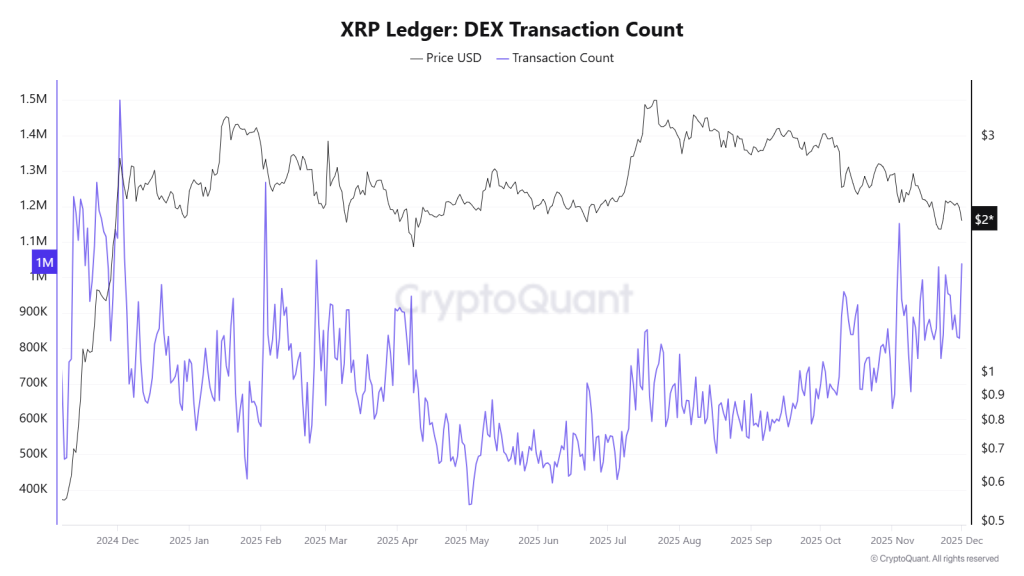
The XRP Ledger: DEX Transaction Count chart indicates a significant bullish divergence starting from May 2025. While the price is consolidating, the activity in decentralised exchanges (DEX) is increasing sharply.
The high transaction volume, which includes both orders placed and cancelled, shows that experienced traders are actively positioning themselves and adding liquidity in anticipation of a future price movement.
As a result, this on-chain metric suggests that the market is preparing for a powerful and sustainable rally in the XRP price ahead.
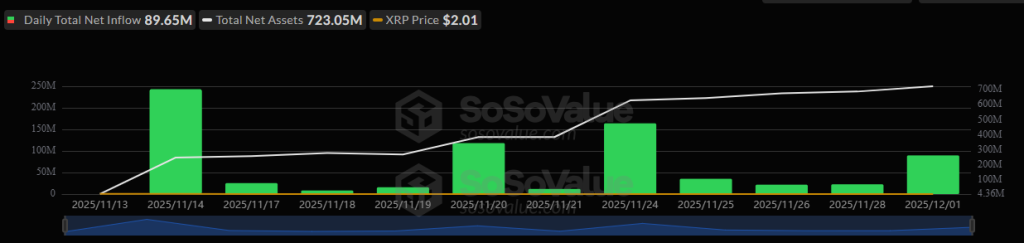
Also, the biggest fact right now in December is that altcoin liquidity is drying up. Projects securing new liquidity channels like ETFs have a better chance of long-term survival, and since November 14th, the XRP ETF has been seeing positive inflows consistently, despite what price action is, and so far, Cumulative Total Net Inflow has crossed $756 million, while total net assets are worth $723.05 million, by December 1st.
Ripple XRP Price Prediction 2026 – 2030
Year
Potential Low ($)
Potential Average ($)
Potential High ($)
XRP Price Prediction 2026
5.50
6.25
8.50
Ripple Price Prediction 2027
7.00
9.0
13.25
XRP Price Prediction 2028
11.25
13.75
16.00
XRP Price Prediction 2029
14.25
16.50
21.50
XRP Price Prediction 2030
17.00
19.75
26.50
This table, based on historical movements, shows XRP price prediction 2030 to reach $26.50 based on compounding market cap each year. This table provides a framework for understanding the potential XRP price movements. Yet, the actual price will depend on a combination of market dynamics, investor behavior, and external factors influencing the cryptocurrency landscape.
Based on historic price sentiments and XRP’s rising popularity, here are the XRP future price projections beyond 2030, where Ripple price forecasts suggest that it has become more speculative. Therefore, assuming continued adoption and dominance, XRP may see aggressive valuations in the decades ahead.
Year
Potential Low ($)
Potential Average ($)
Potential High ($)
2031
25.00
29.50
35.25
2032
31.50
36.75
41.25
2033
35.75
42.25
47.75
2040
97.50
135.50
179.00
2050
219.25
331.50
526.00
A look at this table, highlights the XRP price prediction 2040 and XRP price prediction 2050 potential high ambitious targets but this reflect a transformative vision for XRP as a dominant global payment player.
Market Analysis
Firm Name
2025
2026
2030
Changelly
$2.05
$3.49
$17.76
Coincodex
$2.38
$1.83
$1.66
Binance
$2.16
$2.27
$2.76
Never Miss a Beat in the Crypto World!
Stay ahead with breaking news, expert analysis, and real-time updates on the latest trends in Bitcoin, altcoins, DeFi, NFTs, and more.
FAQs
What will XRP be in 2026 price prediction?
XRP price predictions for 2026 range between $3.45 and $5.05, depending on ETF inflows, market sentiment, and sustained demand above key levels.
What will XRP be worth in 2030?
By 2030, XRP forecasts suggest a potential range of $17 to $26.50 if adoption grows and Ripple maintains its role in global payments.
How much will 1 XRP be worth in 2040?
Long-term projections estimate XRP could trade between $97 and $179 by 2040, assuming continued network usage and institutional integration.
Is XRP a good investment going into 2026?
XRP’s outlook for 2026 depends on ETF inflows, broader crypto sentiment, and its ability to hold key support levels above $2.
The live price of the Cardano token is $ 0.26988313.
Price prediction suggests potential to reach $2.75 to $3.25 by year-end 2026.
Long-term forecasts indicate ADA could hit $10.25 by 2030.
The Cardano price prediction 2026 is generating significant buzz in the crypto market, as the last quarter is soon to close in few days, boosting interest for the next altcoin. The 2025 for ADA/USD began with numerous fundamental updates strengthening its future, including the transformative Plomin Hard Fork, but 2026 seems even more constructive.
Now, Questions abound: “Will Cardano spearhead the altcoin movement?” and “What heights can ADA reach by 2050?” Explore this Cardano price prediction 2026 and beyond, filled with expert insights and ambitious forecasts.
Coinpedia’s Cardano Price Prediction
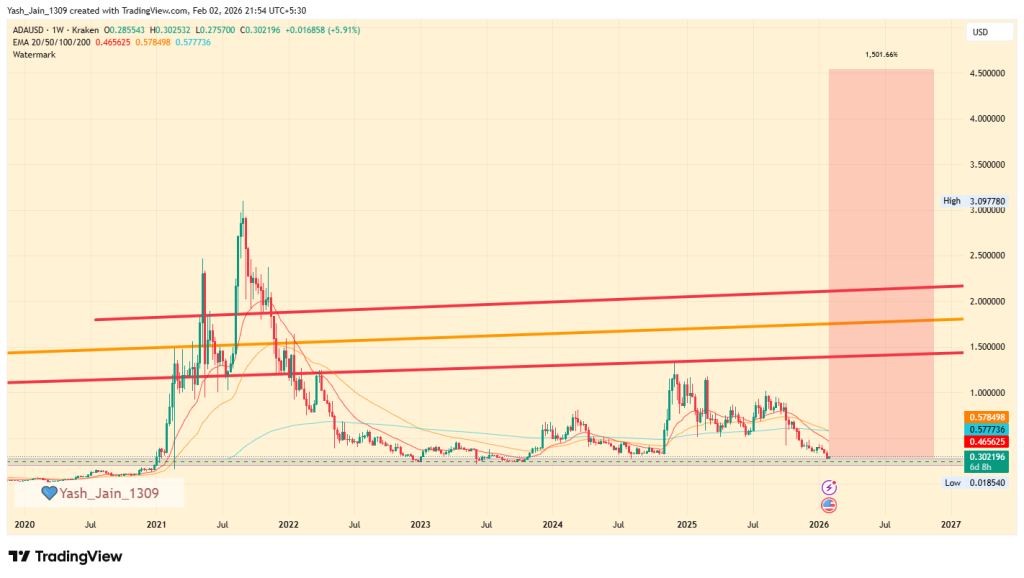
The Cardano price outlook for 2026 is promising, driven by its extraordinary 4,000% surge in 2020 and currently holding strong at a significant support level. With a positive shift in market sentiment, even a moderate increase could lead to a remarkable 1,000% rise, positioning Cardano around $4.50.
A more conservative target of $1.40 indicates a solid 300% gain based on existing trends. Analysts are broadly optimistic that upcoming ETF approvals will boost institutional adoption and market stability, with price projections ranging from $2.05 to $2.80.
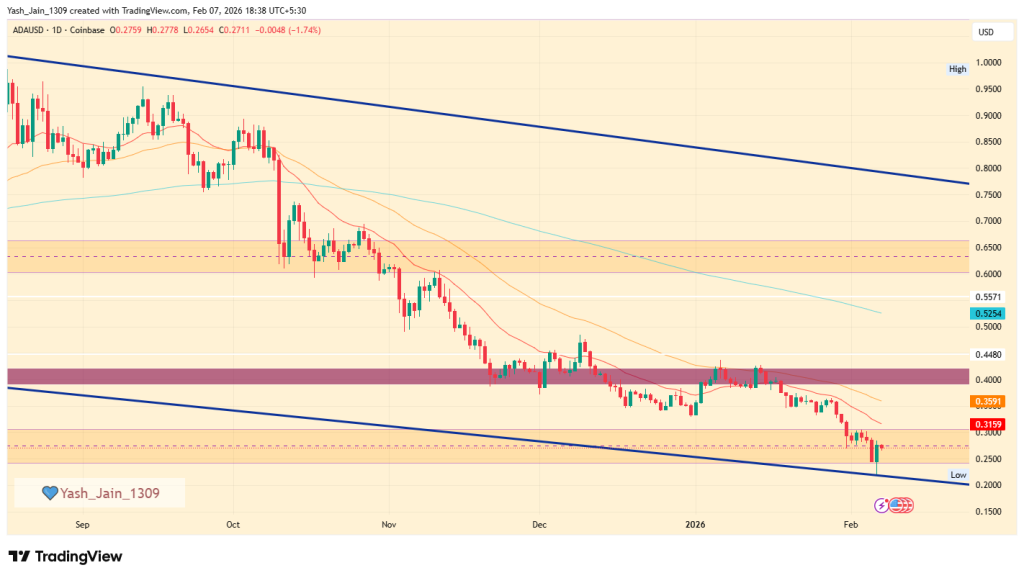
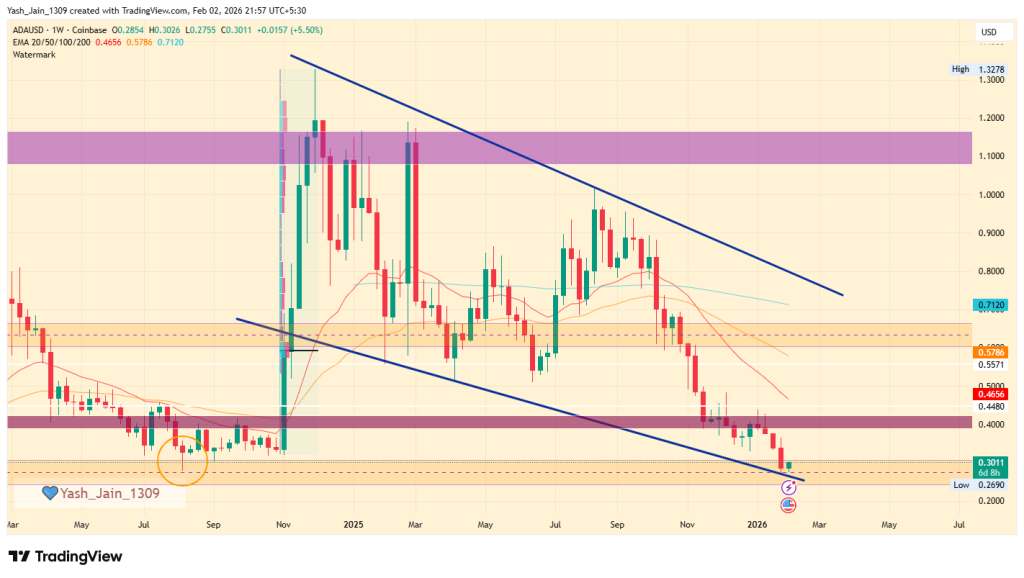
The ADA price movement is currently facing a notable sell-off; however, early February has unveiled a critical demand zone where fresh buying interest is likely to emerge, setting the stage for a potential bullish rally. Moreover, the lower boundary of the falling wedge is acting as solid support, suggesting that a price spike could be on the horizon. So its anticipated that ADA could very well hit $0.60 this month.
Cardano AI Price Prediction For February 2026
Source
Low Price
Average Price
High Price
Gemini
$0.85 – $0.95
$1.00 – $1.20
$1.30 – $1.50+
BlackBox
$0.65
$1.00
$1.50
ChatGPT
$0.75
$0.95
$1.25
ADA Price Prediction 2026
The Cardano price forecast for 2026 points to an important support level on its weekly chart, a range that has consistently acted as a strong pivot point for price trends, and is currently giving off signals of another potential rally. This support level is known for displaying remarkable resilience over time, suggesting that if Cardano price USD can maintain its position above this threshold once again, it could pave the way for significant price movements in 2026.
Looking back at Cardano’s historical performance on the weekly chart, it shows an extraordinary rally in 2020, when the asset posted staggering gains of nearly 4,000%. During that bullish phase, the Cardano price USD spent an extended period consolidating around the dynamic support trendline, which appears to be a strategic accumulation at discounts from smart money, contributing significantly to its eventual surge.
If the current market sentiment shifts positively, a resurgence in investor confidence could lead to a recovery. Not ambitiously, even modestly, past performance could give a tremendous surge. Last year’s performance was 4000%. If we assume 1/4 of that momentum, it would result in an increase of approximately 1000%, potentially elevating Cardano’s price to $4.50 by 2026.
Conversely, a more conservative approach suggests a realistic price target of around $1.40, indicating a potential increase of about 300%. This estimate remains feasible, especially since it is based on fundamental analyses and market trends that are not reliant on speculative triggers, such as the possible approval of exchange-traded funds (ETFs).
Additionally, many experts propose that these ETFs could significantly impact the market by boosting institutional investment and improving market stability. In a situation where ETF approvals occur and retail investor excitement rises, Cardano’s price could realistically range from $2.05 to $2.80.
Scenario
Potential Low
Average Price
Potential High
Without ETF Approval
$0.85
$1.10
$1.25
With ETF Approval + Retail Surge
$1.20
$1.65
$2.05
Bullish Breakout (with ETF & macro support)
$1.50
$2.05
$2.80
Cardano On-chain Analysis
As per Cardano’s on-chain metrics, “Smart Money” accumulation phase is the best observation right now, because the divergence between retail and institutional holders is more vivid than ever.
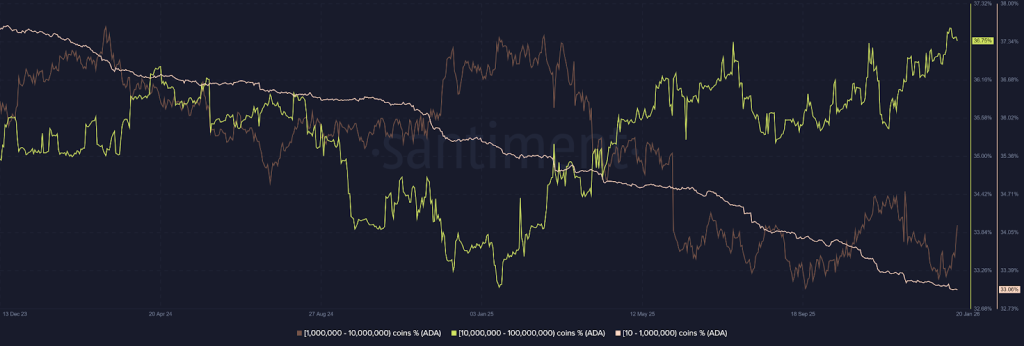
As the number of addresses holding between 10 and 1 million ADA is declining, and the consistent surge in the 10 million to 100 million coin bracket confirms this, this represents a major supply consolidation. The observation shows that these mega-whales are strategically absorbing the “weak hands” during price dips, effectively building a rock-solid fundamental floor for the asset. Also, the fact that the 1M to 10M coin bracket is also growing confirms that professional high-net-worth investors seem to be positioning for a recovery, too.
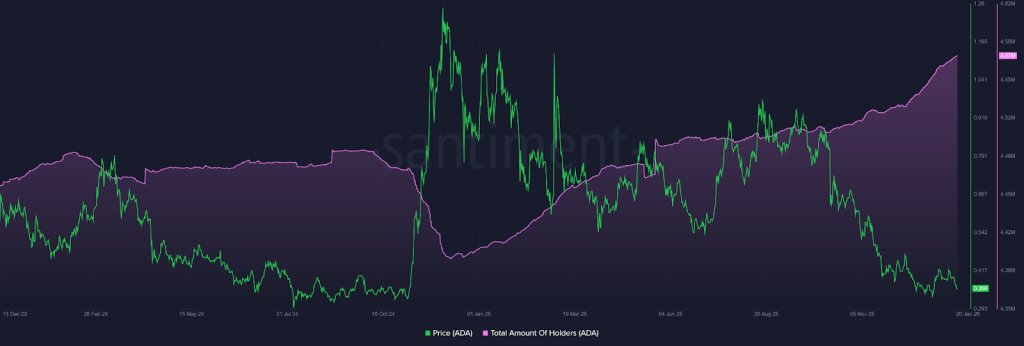
Similarly, the surge to 4.57 million total holders despite a grueling 2025 proves that Cardano’s ecosystem is expanding its reach even in a “stress test” environment. This growth in the holder base suggests that the asset is not being abandoned; rather, it is being redistributed into a more stable, long-term foundation. When a holder count rises as prices fall, it signals that the market views current levels as a deep-value opportunity rather than a reason to exit.
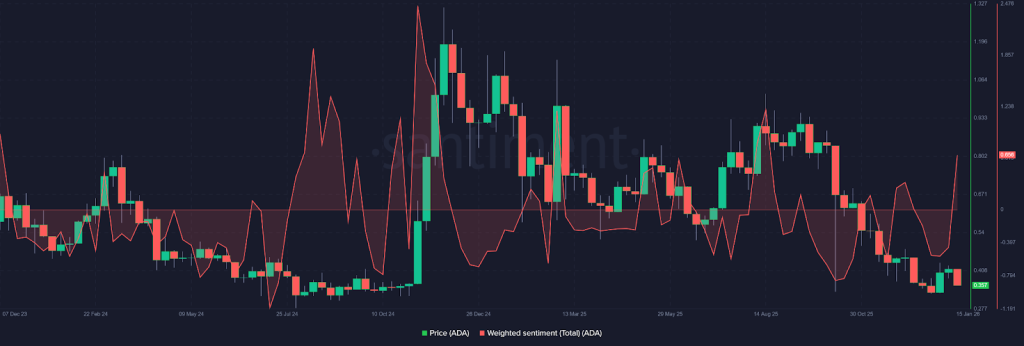
Additionally, the Weighted Sentiment flipping the 0 line to 0.656 is a crucial momentum trigger. Professionally, this “0-line flip” indicates that the aggregate social and market bias has shifted from fear to optimism.
Combined with the strategic whale accumulation, this sentiment pivot suggests that the “disbelief” phase is ending and that a bullish rally is likely once the remaining retail sell pressure is fully absorbed by the growing whale cohorts.
Cardano (ADA) Price Prediction 2026 – 2030
Price Prediction
Potential Low ($)
Average Price ($)
Potential High ($)
2026
2.75
3.00
3.25
2027
4.50
4.75
5.00
2028
5.25
5.50
5.75
2029
6.75
7.25
7.75
2030
9.00
9.75
10.25
This table, based on historical movements, shows ADA prices to reach $10.25 by 2030 based on compounding market cap each year. This table provides a framework for understanding the potential Cardano price movements. Yet, the actual price will depend on a combination of market dynamics, investor behavior, and external factors influencing the cryptocurrency landscape.