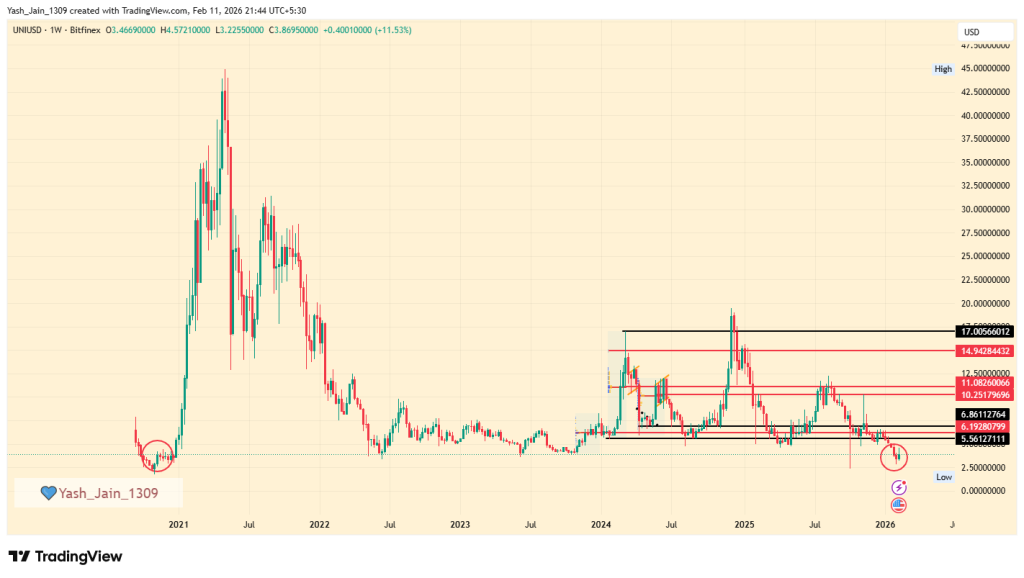
The Uniswap price chart just printed a sharp 15% intraday rise, and this time it’s not just retail noise. Infact, Whale transaction counts have spiked aggressively and the timing is hard to ignore. UNI recently tapped $2.35, a level closely aligned with late-2020 support zones. Now, heavy capital is stepping in post BlackRock news.
Is the rise from UNI’s lowest point in years a Coincidence? Maybe or Maybe not. let’s look closer for a much clearer perspective.
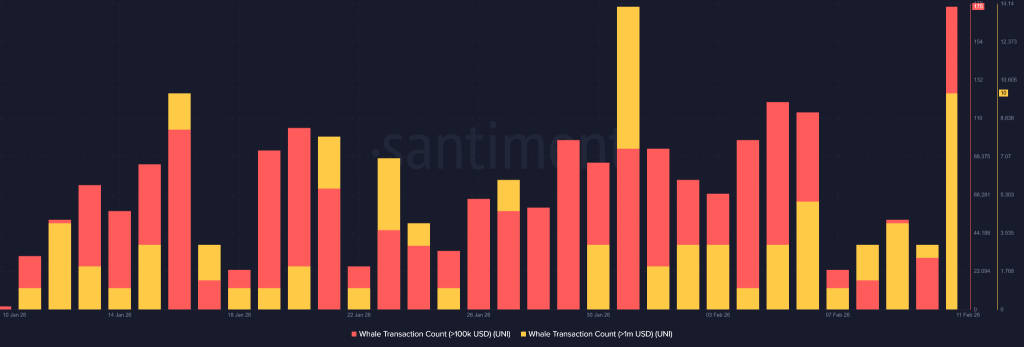
Why Whales Are Moving & Buying in Sync in Uniswap crypto
Over the past 24 hours, based on Santiment onchain data, 10 addresses have executed transactions exceeding $1 million. At the same time, more than 175 addresses moved over $100K each, both are classified as whale transactions. That’s not random liquidity shuffling, infact that’s concentrated involvement.
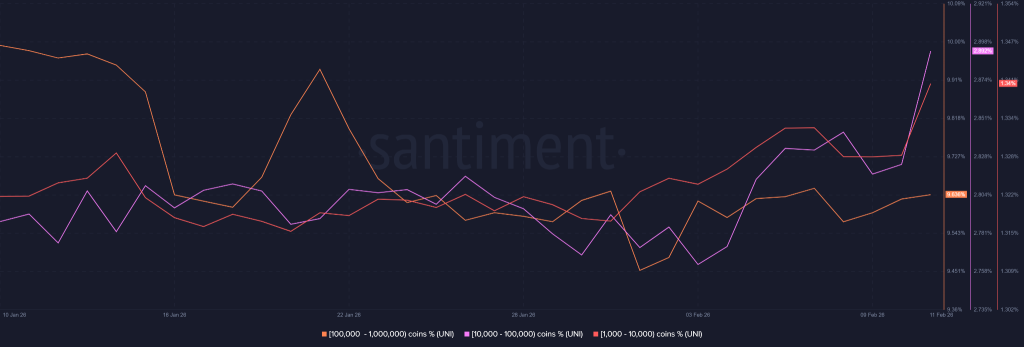
Meanwhile, whale cohorts holding between 1,000 and 1 million UNI have increased their balances. In plain terms, larger players aren’t just trading the bounce they’re mass accumulating.
On the Uniswap price chart, this activity coincides with price stabilizing near long-term structural support. And while broader market sentiment remains fragile, this sort of synchronized whale behavior tends to precede volatility one way or another.
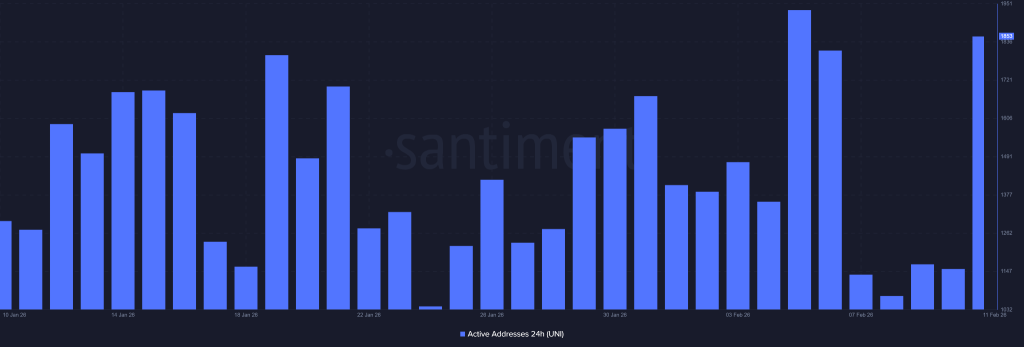
Network Activity Rebound Supports Bullish View For Uniswap price
Now here’s where it gets interesting. Daily active addresses jumped to 1,853 from around 1,150 in prior days. That’s a material uptick in on-chain participation. Interest in Uniswap crypto isn’t just speculative but real users are interacting again and that’s the most positive thing happened.
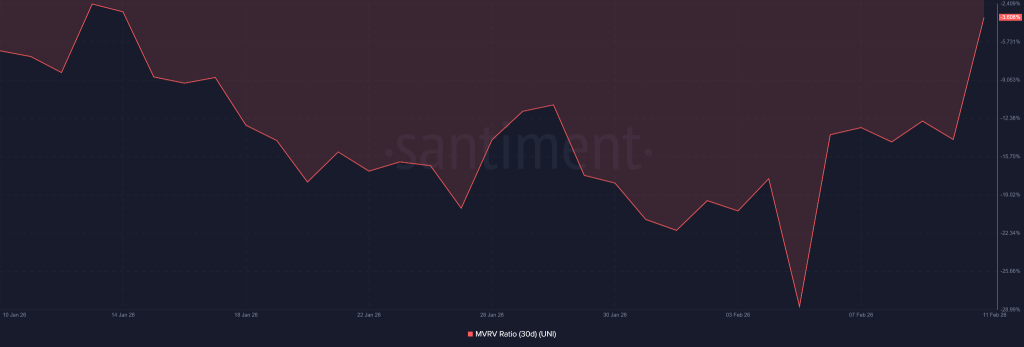
At the same time, the 30-day MVRV ratio has improved. That metric essentially tracks whether recent buyers are underwater. With it recovering, traders from the past month are beginning to regain position strength. If momentum continues, short-term recovery pressure could build.
Still, let’s be real. A bounce doesn’t automatically mean a trend shift.
BlackRock Catalyst
So why the sudden spark in what was otherwise a bearish atmosphere?
Uniswap Labs and Securitize announced a partnership with BlackRock to enhance DeFi liquidity for institutional investors via the USD Institutional Digital Liquidity Fund (BUIDL). The collaboration enables on-chain trading of BUIDL shares through UniswapX, an auction-driven protocol.
That headline alone was enough to jolt the UNI/USD pair higher.
Institutional bridges tend to shift perception fast. And perception, especially in crypto, often drives short-term price action harder than fundamentals.
UNI/USD Key Deciding Resistance Looms
Now comes the harder part, as the intraday spike loved by all and bullish speculation already jumped. But, the worries has not over yet, as immediate resistance range sits between $5.50 and $7.00.
Clearing that band would suggest the Uniswap price is re-entering a broader bullish range. Failure to build above current momentum, however, could send UNUSD back into consolidation most likely under $4.00 again, until macro sentiment improves.
So, what’s next? For now, the Uniswap price analysis suggests that it is responding to whale accumulation, improving on-chain metrics, and an institutional headline. Whether this develops into a sustained move depends less on today’s spike and more on whether the broader market narrative decides to cooperate.
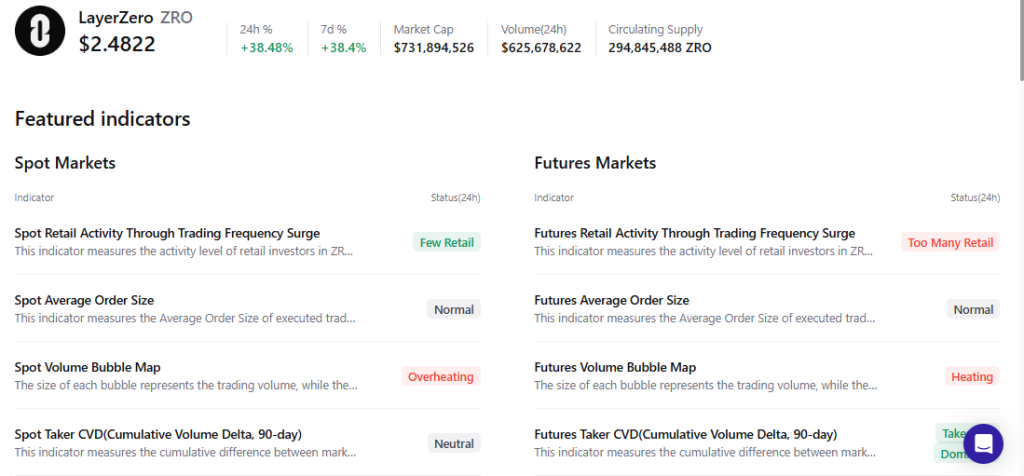
The LayerZero price doesn’t usually move quietly. This time, it detonated. A 38% intraday spike and over 75% in seven days. And suddenly, ZRO is the token everyone’s pretending they were watching all along.
What lit the match? Institutional gravity. An announcement confirming a Ark Invest CEO Cathie Wood’s advisory board addition hit the tape, reinforcing a clear narrative: finance is shifting on-chain, and LayerZero intends to be part of that infrastructure layer. Add to that a strategic investment from Tether tied to interoperability tech used by USDt0, and the story writes itself, as this shows credibility, capital, and long-term positioning.
But let’s be real. The market doesn’t move on vision alone. It moves on positioning.
LayerZero Price Surged WIth Institutional Boost
The news cycle delivered exactly what speculative markets crave for. Institutional attention, Reduced perceived project risk, Signals of long-term relevance and most importantly the fresh capital that’s looking for exposure.
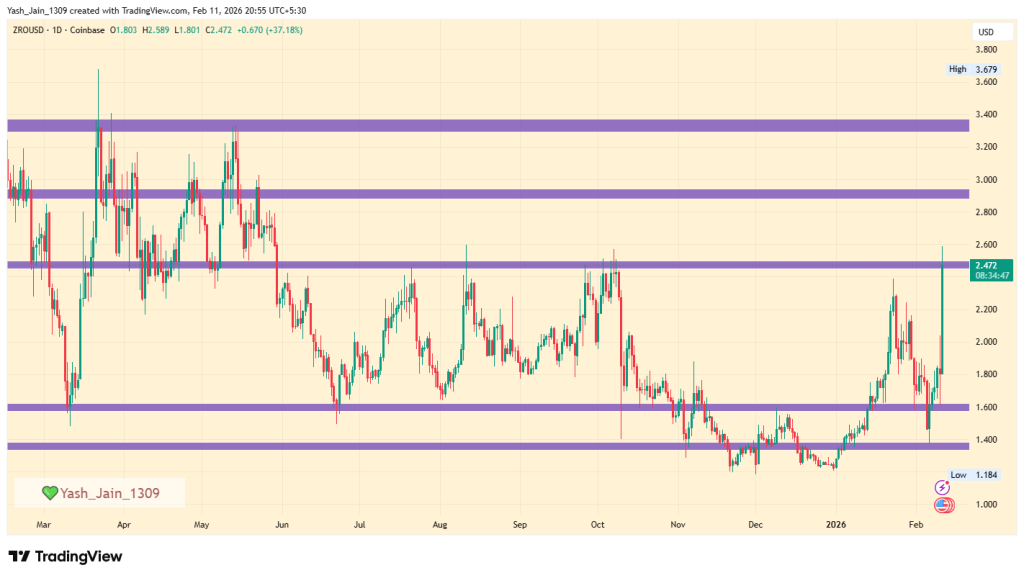
That cocktail pushed the LayerZero price sharply higher and flipped sentiment fast. On the LayerZero price chart, the vertical structure is hard to ignore. ZRO/USD didn’t grind up. It sprinted.
And whenever a chart starts sprinting, traders start sweating.
Big Resistance Lies Ahead In ZRO/USD
Here’s the technical friction point. On the daily timeframe, ZRO/USD is facing resistance in the $2.45–$2.50 range. That’s the immediate ceiling. Price pushing beyond it won’t be easy, and the current hesitation suggests the rally may be running hot.
Now, the nearest round number support sits near $2.00, where possibly other major players are having eye at. If momentum cools and since overheated metrics suggest it might then that’s the level traders are quietly circling.
The broader LayerZero price prediction now hinges on one simple condition: a sustained daily close above $2.45–$2.50. Without that confirmation, upside targets near $2.90 and even $3.30 remain conditional, not promised.
Why A Dip is Likely, Because of Overheating OnChain Signals
And here’s the uncomfortable part. CryptoQuant metrics flag the asset as overheated. Futures retail activity over the past 24 hours has surged, suggesting too many late entrants are piling in at once. Historically, when retail crowds futures positioning, larger players tend to reassess risk.
Volume bubble maps across both futures and spot markets echo that heating pattern. Translation? The move may be extended in the short term.
Now, could the LayerZero crypto rally ignore these warning signs and continue higher? Absolutely. Markets love squeezing doubters. But confirmation matters.
So what’s next in LayerZero price?
If buyers defend $2.00 and build structure, the narrative holds. If price reclaims and closes firmly above the resistance band, momentum traders will chase toward higher targets.
Until then, the LayerZero price sits at a crossroads charged with institutional narrative fuel, but flashing technical exhaustion lights at the same time.
Price prediction for 2026 suggests a potential high of $55.
Long-term forecasts indicate LINK could reach $195 by 2030.
Chainlink has emerged as a game-changing decentralized oracle network, enabling smart contracts to connect seamlessly with real-world data, APIs, and traditional financial systems. As the crypto market evolves, Chainlink’s role continues to expand, especially with its Cross-Chain Interoperability Protocol (CCIP) gaining traction. Its native token, LINK, not only powers the ecosystem but has also caught the attention of investors and analysts. As a result, institutional interest surged, leading to the launch of the LINK ETF by Grayscale in early December 2025.
With LINK price showing signs of a potential breakout and strong on-chain fundamentals backing its rise, the big question remains: Can LINK coin price hit $50 in December 2025? Let’s dive into this detailed Chainlink price prediction 2026–2030 to find out.
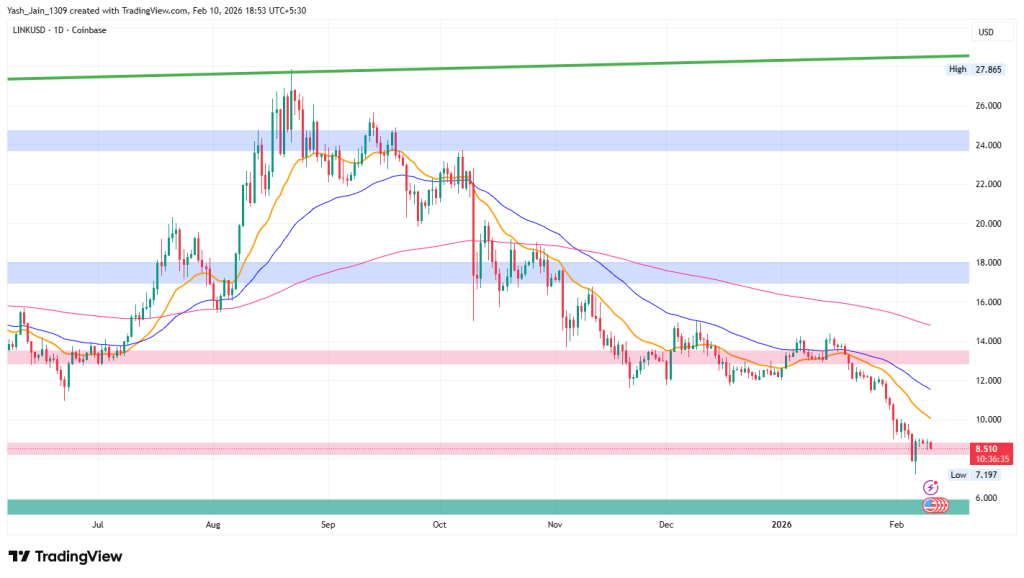
Chainlink (LINK) is currently around $8.50, and odds suggests a dip to crucial support between $4.15 and $6.05 is highly likely if bearish sentiment elevates more. In shortterm, from $8.50 bulls may try a fight to $12 or $15, but persistent bearish pressure might lead it back to the lower range.
Chainlink Price Targets February 2026
In January, the LINK price failed to hold $13 and collapsed to $7 by early February. But, with a slight recovery, it is trying hard to sustain in $8.50 range. If it redevelops as a support, then a revisit to $12 or $15 could be expected, but if $8.50 loses, then $4.15-$6.05 could be the last line of defense.
Chainlink Price Prediction 2026
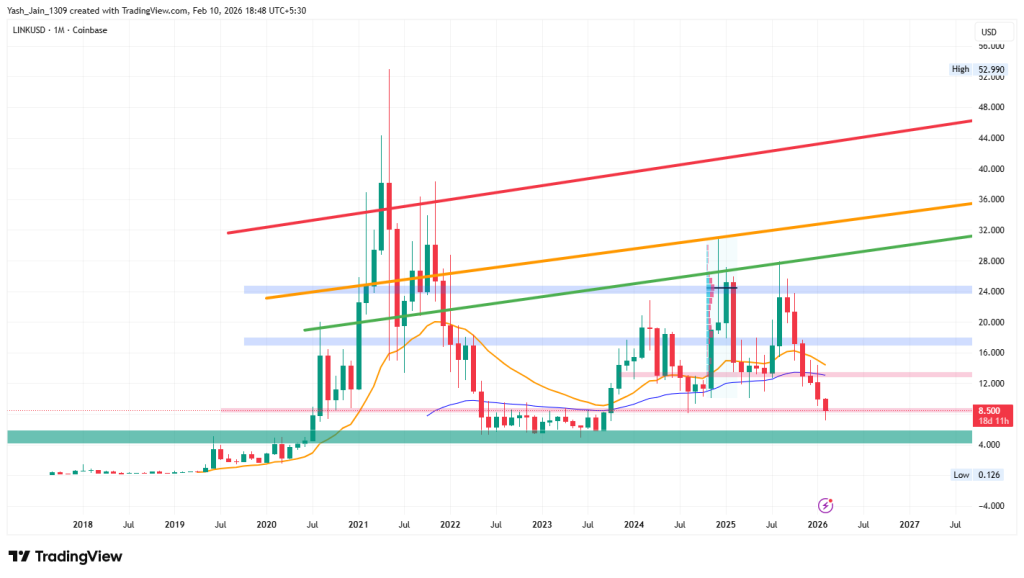
The weekly chart highlights an important price range for Chainlink (LINK) between $4.15 and $6.05. For many years, this range has provided crucial support, preventing the price from declining further.
In 2023, the price surged from this range, reaching a high of $31 by late 2024. However, bearish market conditions took over, leading to a consistent decline from 2025 onward. Early 2026 continued this downward trend, with the price now struggling around $8.50.
This support level is significant in the short term, as a reversal from this point could lead to a retest of the $12 or $15 levels. Historically, prices do not drop straight down without a challenge from bullish investors. However, if selling pressure remains strong and demand fails to meet expectations, the price may approach the $4.15 to $6.05 demand area again.
Looking ahead, the Chainlink price prediction for 2026 indicates the potential for a significant price surge similar to the explosive rally observed in 2020. Analysts suggest that if momentum and market sentiment align positively, the price could see a reversal, but it would take time to process that kind of price action.
Year
Potential Low ($)
Potential Average ($)
Potential High ($)
2026
35
50
55
Chainlink On-Chain Analysis
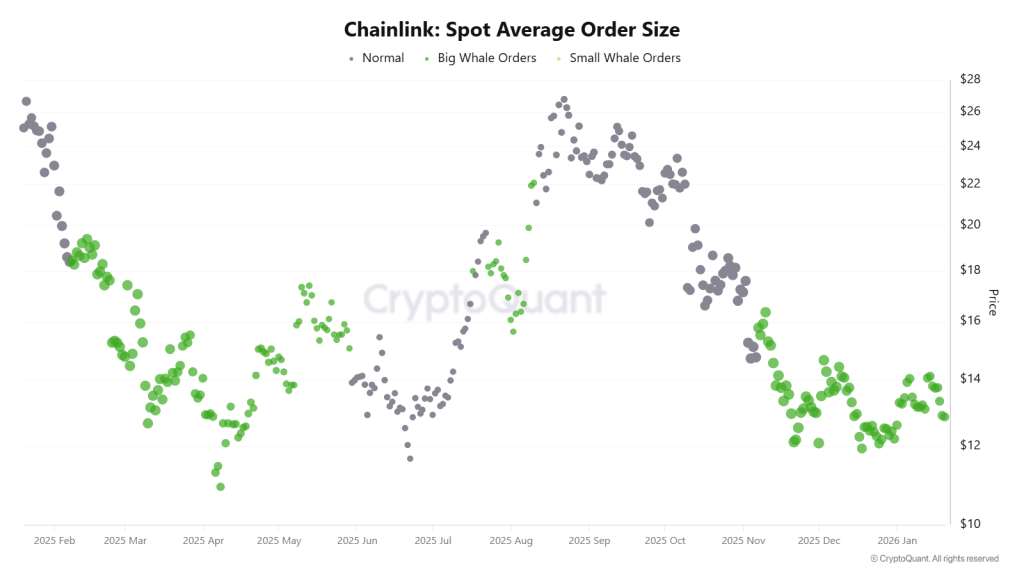
In the LINK on-chain metrics, both spot and futures markets are clearly exhibiting a Taker Buy-Dominant phase. It shows that buyers are actively executing at market prices without waiting for pullback opportunities. This is simply a strong sense of conviction rather than speculative strategies.
Additionally, the Average Order Size in both the spot and futures markets has escalated into the “Big Whale” category. This shift signals the involvement of institutional participants, who significantly influence LINK’s market structure, rather than retail trading flows.
Chainlink Price Targets 2026 – 2030
Year
Potential Low ($)
Potential Average ($)
Potential High ($)
2026
35
50
55
2027
48
64
80
2028
58
85
104
2029
70
108
141
2030
85
147
195
This table, based on historical movements, shows Chainlink price to reach $195 by 2030 based on compounding market cap each year. This table provides a framework for understanding the potential LINK price movements. Yet, the actual price will depend on a combination of market dynamics, investor behavior, and external factors influencing the cryptocurrency landscape.
LINK Crypto Price Forecast 2026
As per Chainlink’s Price forecast for 2026, the high price could be $55, the low may reach $35. This makes the average around $50.
LINK Price Prediction 2027
Moving to 2027, the LINK Price projects that it might hit a high price of $80 potentially. With a $48 low and an average of $64.
Chainlink Price Analysis 2028
Moving to 2028, the Chainlink Price Forecast predicts a high price of $104. On the flip side, the low may fall to $58, and the average is projected to be around $85.
LINK Coin Price Prediction 2029
As per Chainlink Price Forecast 2029, LINK’s high price is predicted to be $141, with a low of $70 and an average of $108.
Chainlink Price Prediction 2030
Finally, as per the Chainlink Price Forecast 2030, LINK’s price can reach a high price of $195. With a low of $85 and an average of $147.
Market Analysis
Firm Name
2026
2030
Changelly
$25.83
$140.70
coincodex
$6.44
$14.79
Binance
$18.43
$22.40
Mitrade
$32.22
$139.2
Investing Haven
$54.10
$80
Flitpay
$62.6
$110
*The aforementioned targets are the average targets set by the respective firms.
Never Miss a Beat in the Crypto World!
Stay ahead with breaking news, expert analysis, and real-time updates on the latest trends in Bitcoin, altcoins, DeFi, NFTs, and more.
FAQs
How much is Chainlink worth?
At the time of writing, the value of one LINK crypto token was $ 8.30107549.
What is the price prediction for Chainlink in 2026?
Chainlink price prediction for 2026 suggests LINK could trade between $35 and $55, with an average price near $50 under bullish conditions.
How much will 1 Chainlink be worth in 2030?
By 2030, 1 Chainlink could be worth between $85 and $195, depending on adoption, market cycles, and long-term crypto growth.
Where will Chainlink be in 5 years?
In five years, Chainlink is expected to be a core Web3 infrastructure, with broader adoption and a potential price range of $80–$140.
Is Chainlink a good long-term investment?
Chainlink is considered strong long term due to its real-world utility, oracle dominance, institutional adoption, and expanding cross-chain ecosystem.
What factors influence Chainlink price predictions?
LINK price is driven by oracle demand, CCIP adoption, staking growth, institutional interest, crypto market cycles, and global liquidity trends.
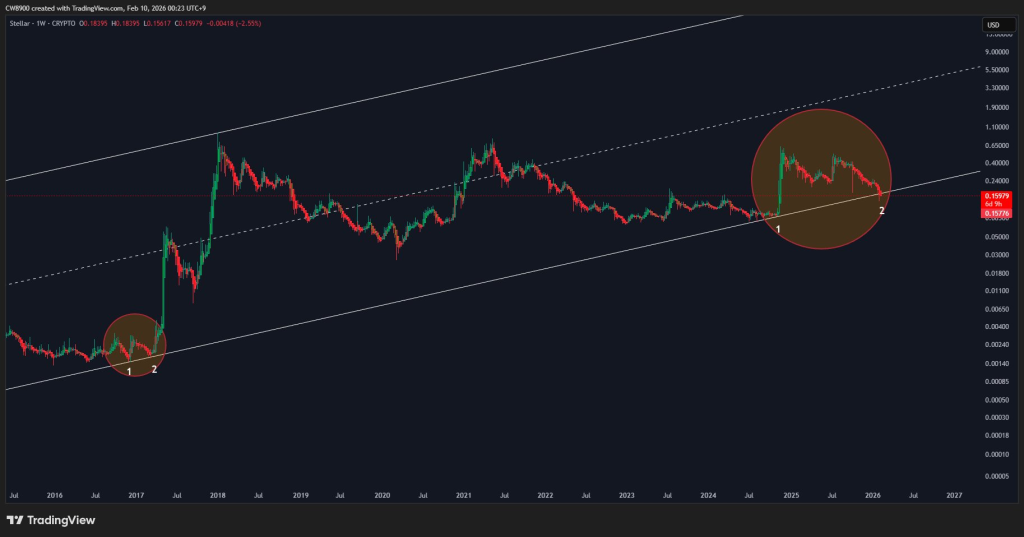
The Stellar price has a habit of moving when nobody’s watching. And right now, the data flashing in the background doesn’t look like noise, but it looks like intent. While timelines chase candles, capital has been positioning itself calmly, almost politely, across major exchanges. That usually ends one way.
Binance alone saw $124M in 7-day volume, Coinbase $71M, and Upbit chipped in another $65M. When writing, the Stellar price chart is hoping for fireworks, but current broader market activity and sentiment are capping the momentum. This shows trading activity is high in the XLM/USD price.
Volume Without the Drama
What makes this setup uncomfortable is how price action looks. Per Coinglass, the sustained spot volume across the week suggests this isn’t a weekend spike or a leverage-fueled shortterm sprint. It’s infact a repeat participation.
Now, combine this rising activity with a $5.26B market cap and roughly $89M in open interest, and it shows something traders hate admitting: positioning is building quietly in Stellar crypto.
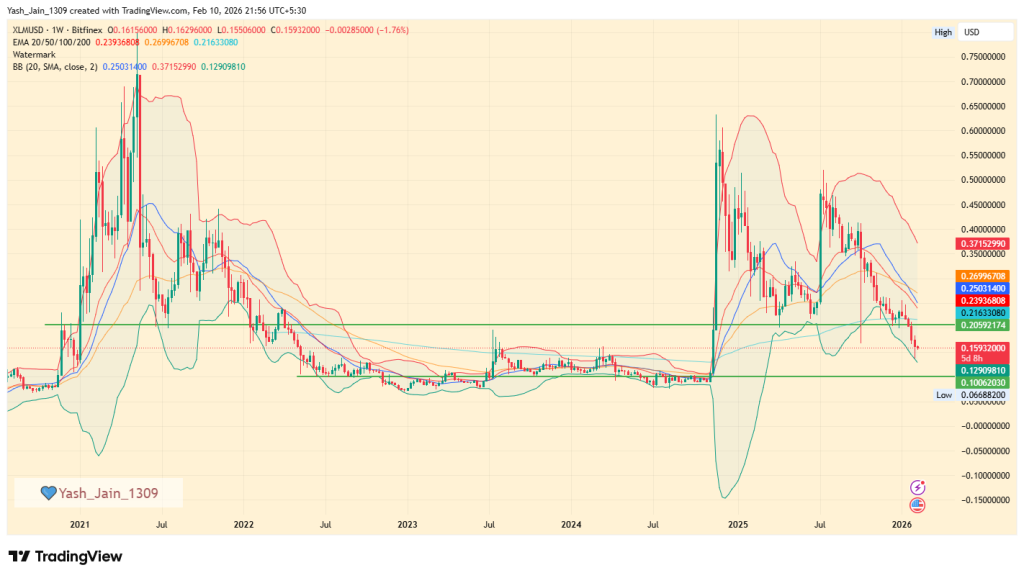
XLM/USD isn’t screaming for now or may be a dip to $0.10 is coming before it grabs on to liquidity and show a reversal. But, one thing is clear that it’s whispering the positive longterm momentum quietly building.
A Familiar Pattern Returns
Now here’s where it gets awkwardly familiar. Back in 2017, Stellar price touched the lower channel twice before the market flipped. What followed wasn’t subtle, during that cycle that lasted over 280 days, XLM price expanded by roughly 49,500%.
Now, the odds are high that it helps predict the likelihood of a mirror rally. That’s not a prediction; it’s a data point that still sits on the Stellar price chart like an unanswered question.
Under the hood, Stellar crypto keeps stacking fundamentals while price drifts.
The network is ISO 20022 compliant, aimed squarely at cross-border payment infrastructure. Over the past seven days, Stellar ranked third among public chains by TVL growth, posting close to a 10% increase. That’s usage, not speculation.
Even more interesting, an old IMF discussion resurfaced featuring Stellar leadership in the context of global payments and financial plumbing. Not exactly meme-coin territory.
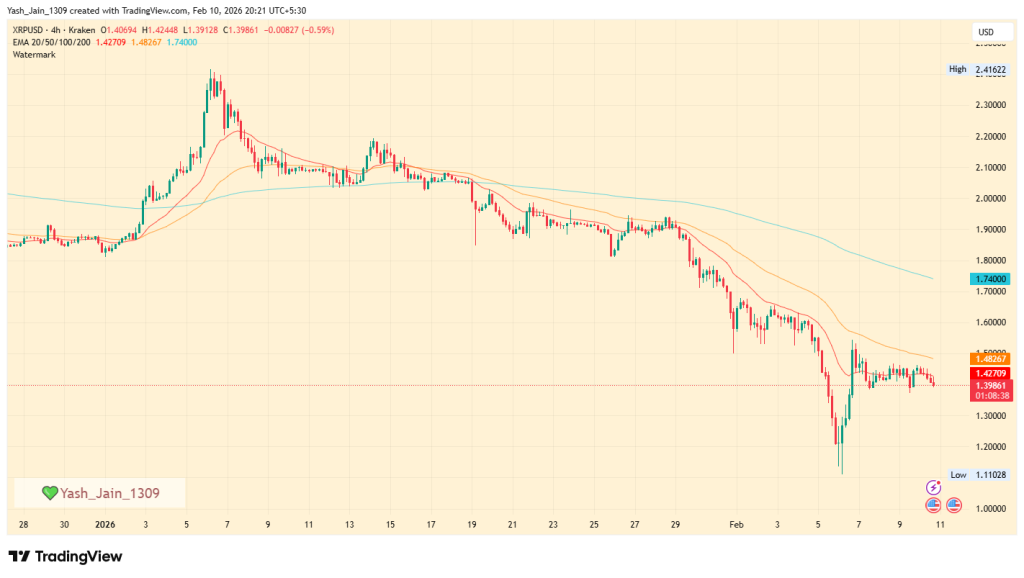
This week started with Russia dropping a regulatory bombshell, and the market barely blinked. The XRP price is still hovering around $1.42 24 hours after Russia’s news came to light, which introduced this bill to legalize XRP and crypto access for all investors. On paper, this opens the gates for roughly 146 million people. In narrative terms, it sounds massive. In price action? Its influence is not so much. Traders, for now, seem unimpressed and are looking for XRP’s next possible move.
Russia Opens the Door, Market Hesitates
The bill instantly fueled social buzz, with XRP framed as a “math-based payment mechanism” quietly favored by elite financial circles since 2013, according to a leaked email from Jeffrey Epstein. The implication is clear that XRP crypto was designed for institutions, not for speculation. That contrast has reignited long-standing debates around crypto’s real utility.
But price doesn’t trade on ideology alone. Despite the headlines, XRP/USD hasn’t seen an aggressive inflow. Instead, it’s choosing to follow broader markets trend and as a result its hovering just above $1.41 support, suggesting traders are watching, not chasing.
XRP Price Chart Sends Mixed Signals
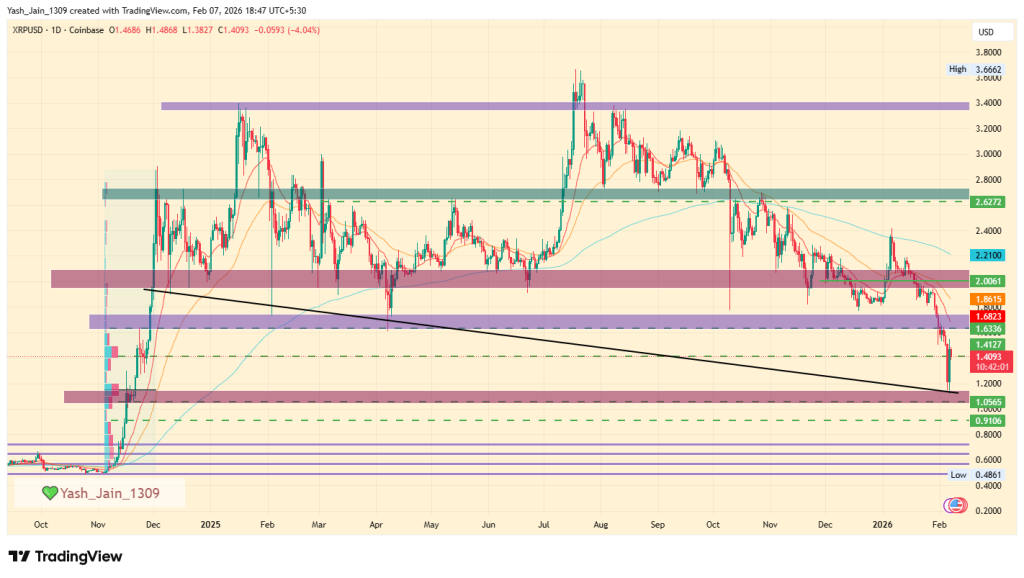
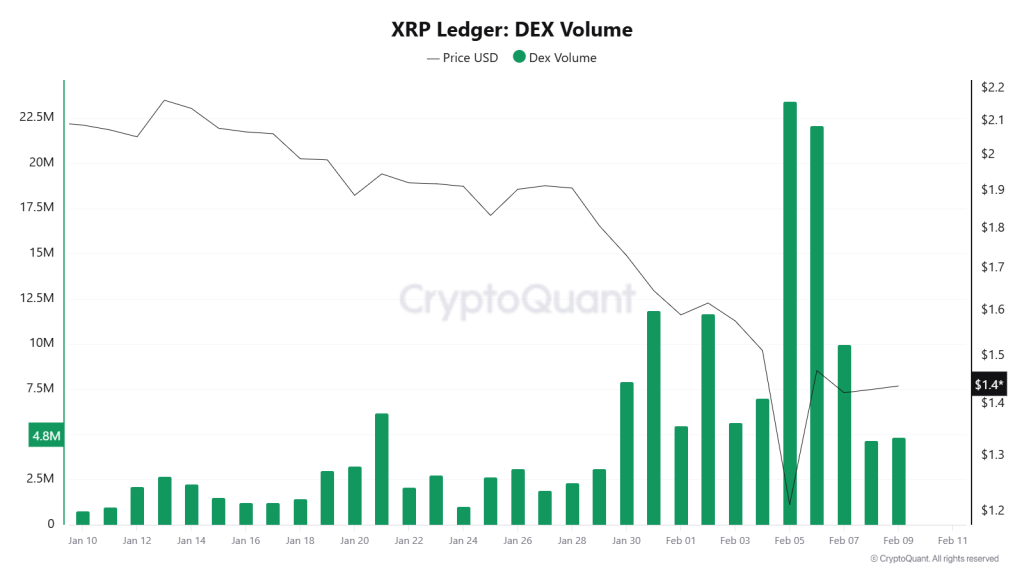
Over-analysing the past 30-day data and the XRP price chart makes things murkier. Just days ago, XRP/USD briefly dropped to $1.10, marking its lowest level in months. That move triggered immense spikes in DEX activity and sparked a bounce that looked strong at first glance.
This illustrates that the fall was massive, but the recovery wasn’t impressive as it lacked follow-through. Structurally, the rebound appears mechanical rather than conviction-driven. Buyers stepped in, yes no doubt about their entry, but they entered very cautiously. Now, the situation suggests that if $1.41 cracks, the technical path back to $1.10 is wide open, and markets clearly know it.
Narratives Clash, Numbers Don’t Care
Social media optimism keeps pushing aggressive XRP price prediction targets; some are still north of $10 this year. But Skeptics remain louder than ever, arguing that those levels are detached from the current market structure.
BREAKING
"I can't believe some people on the internet think $XRP will go over $10 this year, it's not going to happen, it’s just not" – Jim Cramer pic.twitter.com/XssRmbW4Np
For now, XRP price action suggests traders are waiting for proof, not promises. So what’s next? If support holds, XRP stabilizes and absorbs the news quietly, a steady recovery may come in the short term. But if it doesn’t, the downside narrative would accelerate quickly, as higher-timeframe charts are mostly bearish-dominant.
Analysts predict PEPE could reach $0.0000539 by 2026.
Long-term forecasts suggest potential highs of $0.0002733 by 2030.
Pepe Coin (PEPE), the memecoin inspired by the iconic frog meme, has rapidly become a standout in the crypto world. Ranked just behind Dogecoin and Shiba Inu, PEPE’s explosive rise—boasting gains of over +130325085.96% from its all-time low—has captured investor attention globally.
As it maintains its position among top memecoins, many are now asking: Will PEPE price go parabolic by the end of 2025? In this article, explore CoinPedia’s in-depth PEPE coin price prediction for 2025, and discover long-term forecasts that look ahead to 2030.
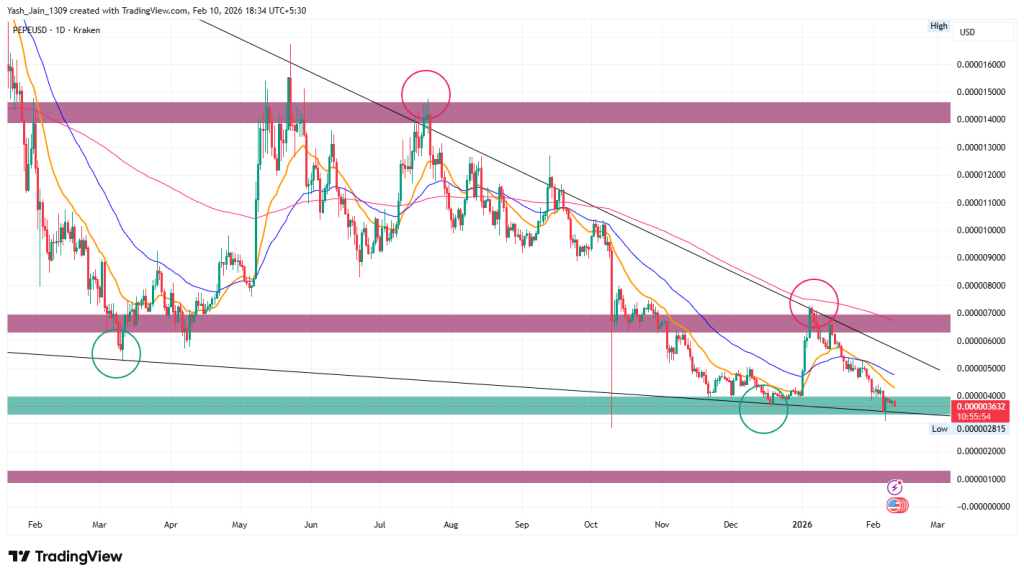
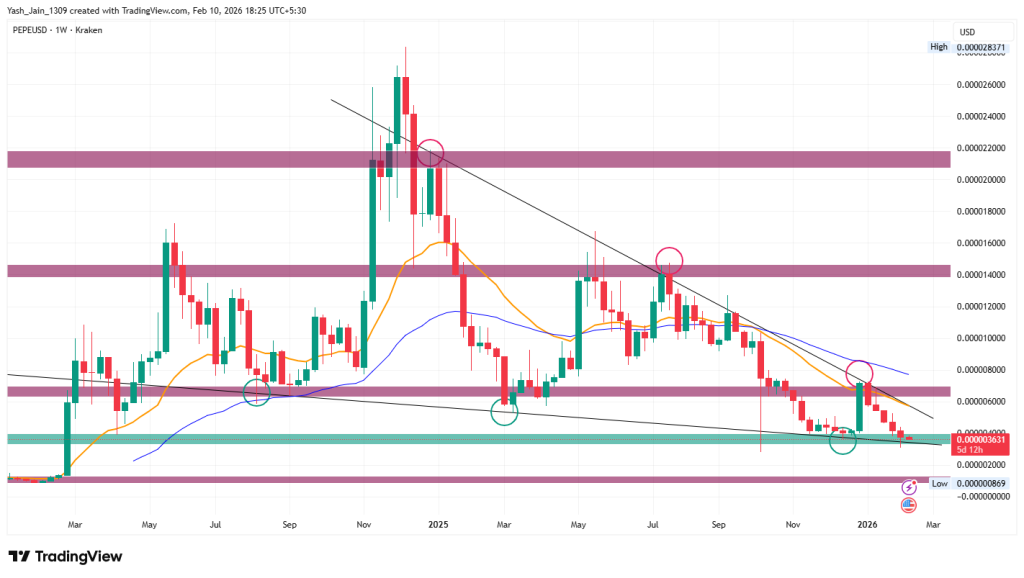
PEPE’s price has struggled due to low liquidity and cautious investor sentiment, continuing into Q1 2026. A price rise is possible in the remaining Q1 2026 if new capital enters, odds have been high with PEPE/USD’s tightening trading range. However, without this influx, a decline towards $0.00000120 may occur.
PEPE Price Prediction 2026
PEPE’s price has struggled in Q4 2025 due to low liquidity and cautious investor sentiment. This has continued in January 2026, and February is following that cautious investor, too.
The broader market is in an extreme fear phase, and prices are collapsing. However, if new capital flows in, a price rise is likely in the rest of Q1 2026, as this outlook is supported by a tightening trading range, which indicates a potential breakout more than ever. The PEPE price has faced challenges for several months, falling short of the expectations set by experts and investors alike, primarily due to an overarching risk-off sentiment within the memecoin space.
However, it’s essential to acknowledge that the current low market liquidity and cautious investor behavior have kept new capital on the sidelines amid a series of bearish trends.
Nevertheless, it is also a fact that entering the crypto market through memecoins remains one of the most accessible and easiest methods available. Therefore, should new liquidity begin to flow in, we can undoubtedly anticipate a bigger rise in PEPE’s price. Q1 2026 stands out as an ideal timeframe for this potential resurgence, and the compression of the falling wedge shows compression of the trading range that confirms the effectiveness and reliability of these trendlines that have been containing the price of PEPE since 2025, and the odds of a rally to pop out soon have greatly risen.
But, if it fails and collapses, then a decline toward $0.00000120 is expected, where we saw a rally sprouting back in early 2024.
PEPE On-Chain Outlook
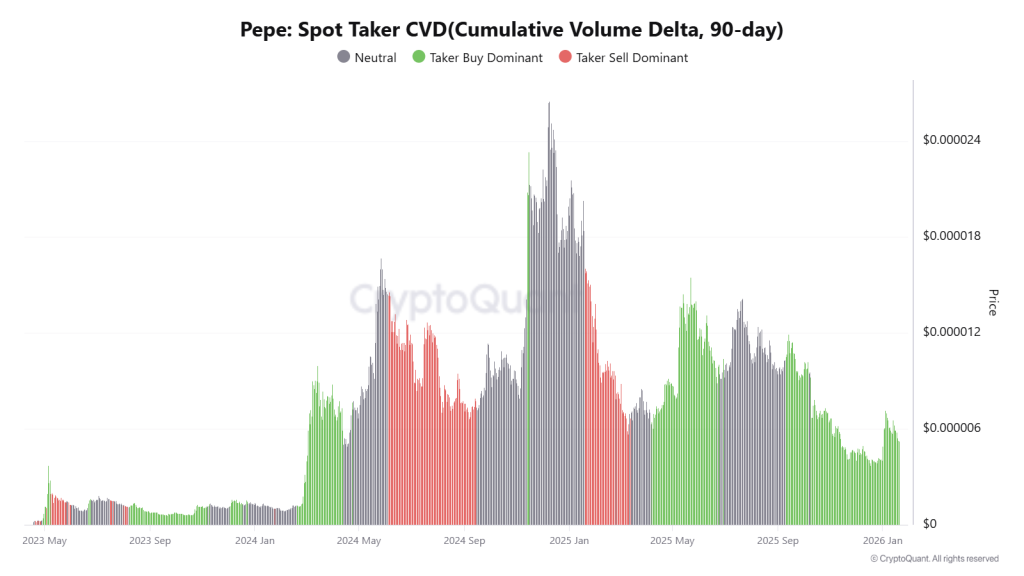
As per the metric “90-day Spot Taker CVD”, the cumulative difference between market buy and market sell volumes has turned positive and is increasing, indicating that high-conviction traders are aggressively market-buying PEPE rather than waiting for passive fills at lower prices.
This aggressive participation is a hallmark of a robust accumulation phase, in which market demand begins to outpace available liquidity, often serving as a precursor to a volatile price expansion.
Given that similar green clusters on the historical chart preceded significant rallies in mid-2024 and mid-2025, the current uptick suggests that “smart money” is positioning for a major move as the asset stabilizes near its current support levels in January 2026.
PEPE Price Prediction 2026 – 2030
Year
Potential Low ($)
Potential Average ($)
Potential High ($)
2026
0.0000179
0.0000359
0.0000539
2027
0.0000269
0.0000539
0.0000809
2028
0.0000404
0.0000809
0.0001214
2029
0.0000607
0.0001214
0.0001822
2030
0.0000910
0.0001822
0.0002733
This table, based on historical movements, shows PEPE price to reach $0.0002733 by 2030 based on compounding market cap each year. This table provides a framework for understanding the potential PEPE price movements. Yet, the actual price will depend on a combination of market dynamics, investor behavior, and external factors influencing the cryptocurrency landscape.
Pepecoin Price Forecast 2026
Our PEPE price prediction suggests that the price of PEPE in 2026 might range between $0.0000179 and $0.0000539, with the average price of the meme coin at $0.0000359.
Pepe Coin Price Prediction 2027
For 2027, we predict that the price of PEPE could range between $0.0000269 and $0.0000809, and the average price of the meme coin is expected to be around $0.000539.
Pepecoin Price Targets 2028
As per our Pepe Coin Price Prediction, in 2028, the price could range between $0.0000404 to $0.0001214, with the average price of the meme coin at $0.0000809.
Pepecoin Price Projection 2029
For 2029, the price of PEPE could range between $0.0000607 and $0.0001822, with the average price of the meme coin expected to be around $0.0001214.
Pepe Coin Price Prediction 2030
Based on our Pepecoin price forecast, the price of PEPE in 2030 might range between $0.0000910 to $0.0002733, with the average price of the meme coin predicted to be around $0.0001822.
PEPE Coin Market Analysis
Firm Name
2026
2030
Changelly
$0.0020
$0.015
CoinCodex
$ 0.000026
$ 0.000047
Binance
$0.000014
$0.000017
Never Miss a Beat in the Crypto World!
Stay ahead with breaking news, expert analysis, and real-time updates on the latest trends in Bitcoin, altcoins, DeFi, NFTs, and more.
FAQs
How much is Pepe coin worth?
The current price of Pepecoin is $ 0.00000368.
What factors could drive PEPE’s price growth in the coming years?
PEPE’s price depends on meme coin market sentiment, liquidity inflows, social media trends, and broader crypto cycles rather than fundamentals alone.
Is PEPE a high-risk investment compared to other cryptocurrencies?
Yes. As a meme coin, PEPE is highly volatile and sentiment-driven, making it riskier than utility-based cryptocurrencies with real-world use cases.
How does PEPE compare with Dogecoin and Shiba Inu?
PEPE competes mainly on community hype and trading momentum, while DOGE and SHIB benefit from longer histories and broader ecosystem support.
What is PEPE price prediction for 2026?
PEPE could trade between $0.0000179 and $0.0000539 in 2026, depending on meme coin demand, liquidity inflows, and overall crypto market momentum.
What is PEPE price prediction for 2027?
In 2027, PEPE may range from $0.0000269 to $0.0000809 if bullish sentiment and retail participation remain strong across meme coins.
What is PEPE price prediction for 2028?
PEPE’s price in 2028 could move between $0.0000404 and $0.0001214, driven by broader market cycles rather than project fundamentals.
What is PEPE price prediction for 2030?
By 2030, PEPE could reach up to $0.0002733 in optimistic scenarios, though prices will remain highly sensitive to market sentiment and risk appetite.
Analysts project Dogecoin could reach $0.75 to $1.25 by the end of 2026.
Long term projection highlights that by 2030 it could even reach the $3 mark.
Dogecoin, the original meme coin, has cemented its status as a crypto legend. Known for its viral appeal and a fiercely loyal community, it continues to capture headlines and investor interest. Following Donald Trump’s election win, speculation around a potential Dogecoin ETF fueled a surge in optimism.
Now, that speculation has become a reality. With the September 18 launch of the REX-Osprey DOGE ETF, trading under the ticker DOJE and carrying a 1.5% fee, the path has been cleared for institutional access. This groundbreaking debut makes it the first U.S.-listed spot ETF for Dogecoin and significantly raises the odds for similar approvals from major players like Bitwise and Grayscale before year-ends.As growing optimism and increasing adoption reshape the market, traders are asking: “Will Dogecoin go back up?” and “Can DOGE hit $1?” In this article, we dive into a detailed technical analysis and a long-term Dogecoin price prediction 2025 to 2030.
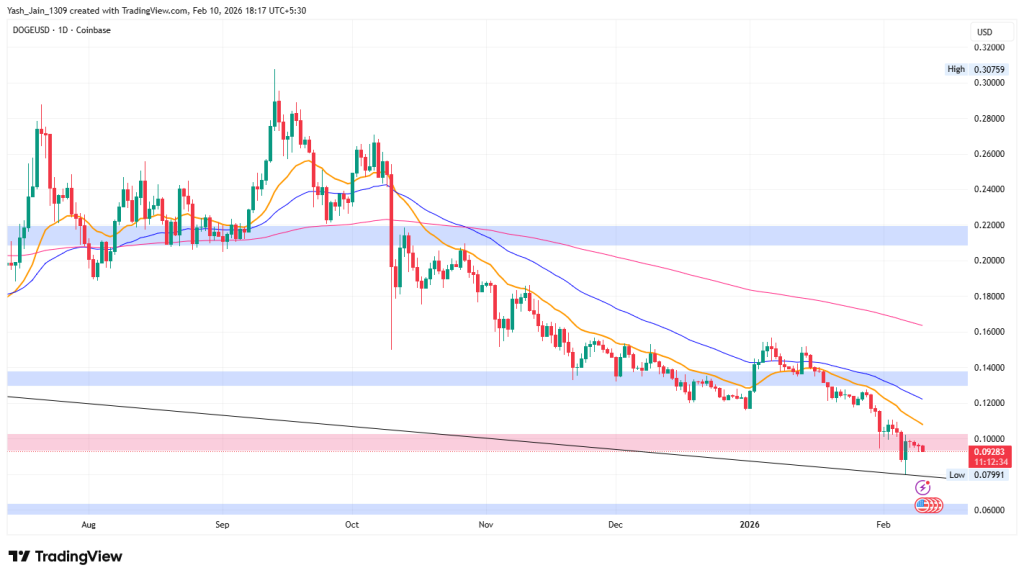
In January, prices fell, and by February, DOGE fell further, retesting a trendline after briefly dropping below $0.10. Influenced by the broader market’s decline, the DOGE/USD market is fearful. DOGE may decline to the $0.055-$0.060 support range if broader conditions worsen, but if it reaches this area, then a reversal could happen if accumulation increases, with $0.21 and $0.39 as resistance levels for recovery.
Dogecoin Price Prediction 2026
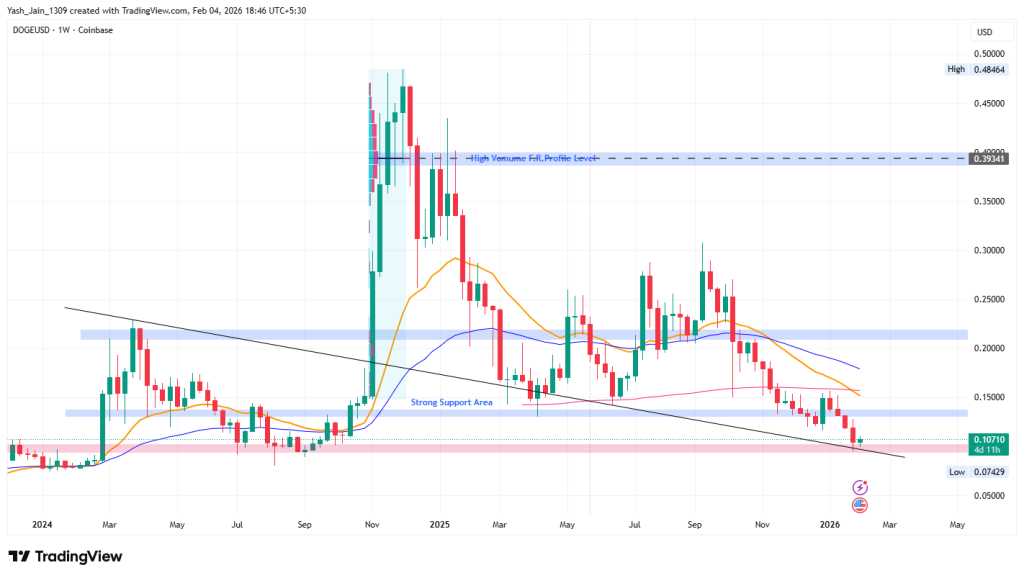
In January, the price consistently declined on the weekly chart. Now, in early February, it has retested the downward trendline after breaching the $0.10 support area. This ongoing decline has affected multiple price levels, and the broader market is being significantly impacted by other major cryptocurrencies like BTC, XRP, and SOL, which have instilled extreme fear among investors.
At this point, DOGE seems poised for further decline towards the support area of $0.055-$0.060, a range that previously contributed to a substantial rise in late 2023. If it reaches this demand area and accumulation increases, we could see a reversal, with $0.21 and $0.39 identified as key hurdles for a long-term recovery rally.
Year
Potential Low ($)
Potential Average ($)
Potential High ($)
2026 (conservative)
0.13
0.39
1.00
DOGE On-Chain Outlook
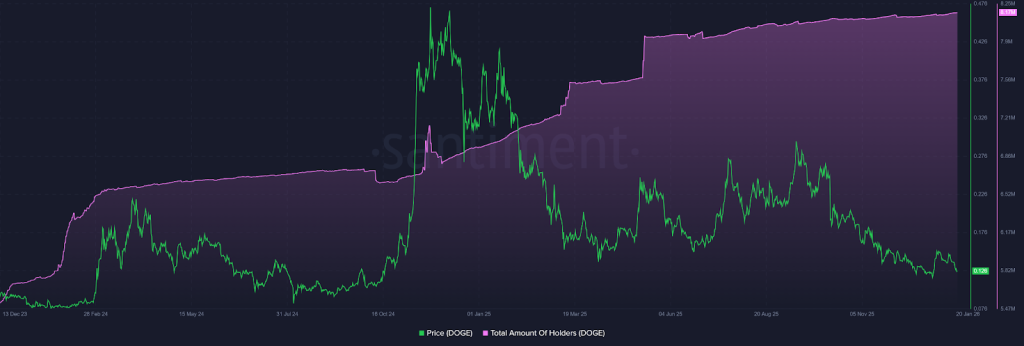
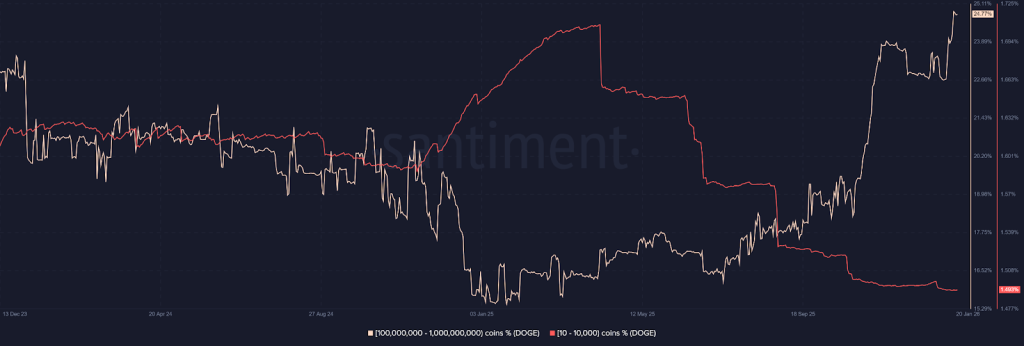
Despite the price facing challenges after peaking at $0.46 in late 2024 and then falling, 2025 is a very tough year for its investors. But the total number of holders has surged to an impressive 8.17 million, indicating strong investor accumulation.
Similarly, large holders are showing strategic accumulation patterns that suggest bullish sentiment. While the number of retail holders holding between 10 and 10,000 coins has been declining, those holding between 100 million and 1 billion coins continue to increase, reinforcing a positive outlook for the asset.
Dogecoin Price Prediction 2026 – 2030
Year
Potential Low ($)
Potential Average ($)
Potential High ($)
2026
0.75
1.00
1.25
2027
1.15
1.35
1.50
2028
1.25
1.75
2.00
2029
1.50
2.15
2.65
2030
2.50
2.75
3.00
This table, based on historical movements, shows DOGE price to reach $3 by 2030 based on compounding market cap each year. This table provides a framework for understanding the potential DOGE price movements. Yet, the actual price will depend on a combination of market dynamics, investor behavior, and external factors influencing the cryptocurrency landscape.
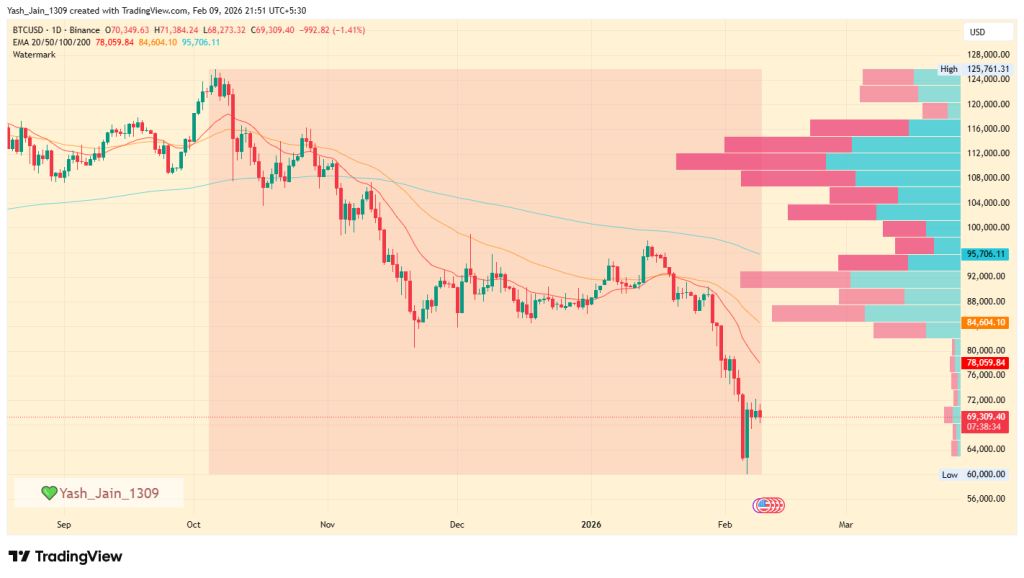
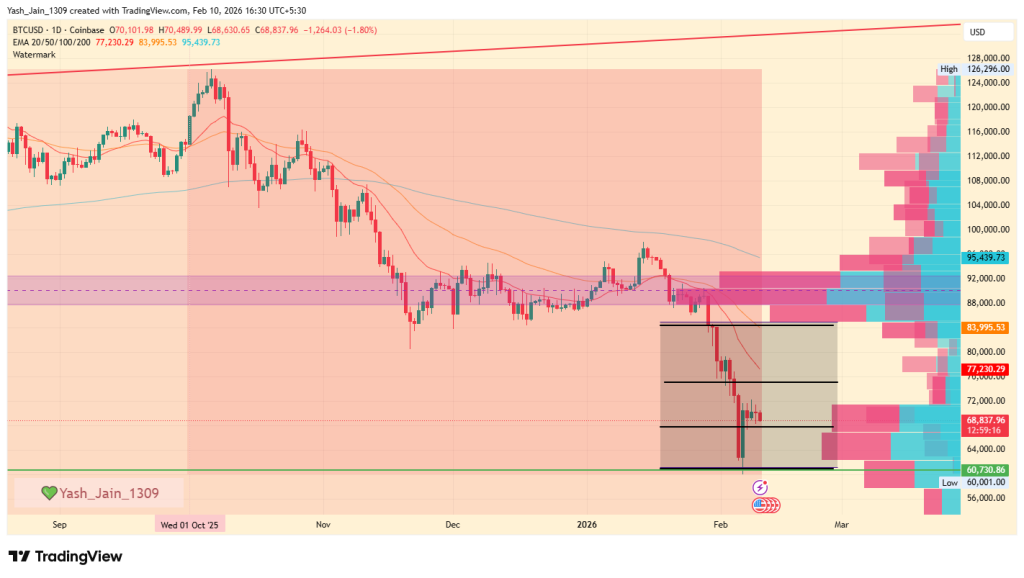
Bitcoin price is hovering near the $70,000 mark in early February 2026, a strong drawdown from the late-January highs near $90K. The selloff was sharp, confidence faded quickly, and now the market is stuck watching one range obsessively and that is $60K to $65K. Lose that, and things could get messy fast in shortterm.
The damage along the way is already clear. Multiple support levels failed during the drop, forcing traders into a wait-and-see mode. Big bets are on pause. Everyone wants proof that a short-term bottom actually exists before stepping back in.
Fear Dominates as Structure Stays Bearish
Now is a time when every investor and trader wants a clear view, not a sugarcoating. To them sentiment has turned really ugly and a position without knowing the risk could create serious consequences.
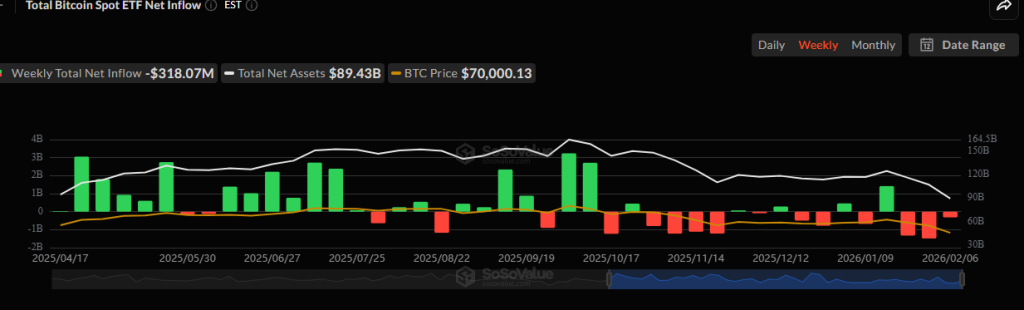
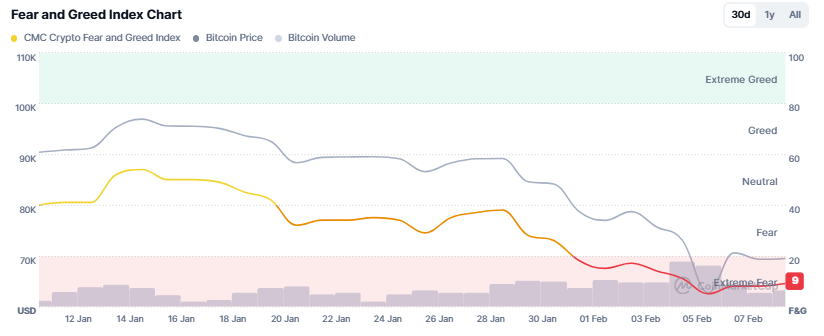
Because, the Crypto Fear and Greed Index still remains deep in Extreme Fear territory. At the same time, spot Bitcoin ETFs continue to bleed capital, with weekly flow data showing persistent outflows stretching back from September 2025 and extending into early February. That’s not the backdrop of a confident market.
Zoom out on the Bitcoin price chart and the technical picture lines up with the mood. The 50-day EMA is still below the 200-day EMA, keeping the death cross active since mid-November. Adding to the pressure, a short-term death cross between the 20-day and 50-day EMAs printed in late January, confirming near-term weakness.
As a result, traders now treat the $60,000–$65,000 zone as the last meaningful cushion. A clean break there could invite forced selling rather than measured exits.
Short-term Indicators Hint at Relief, Cautiously
That said, not everything is screaming collapse, at least not on the daily timeframe.
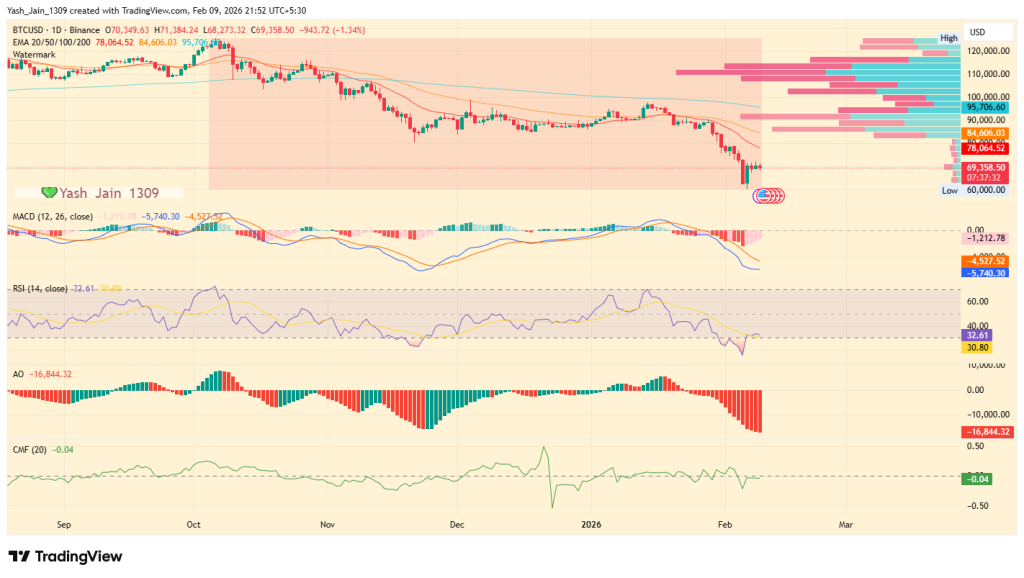
RSI on the daily chart is recovering from deeply oversold levels and currently sits near 32.5, suggesting selling pressure may be losing some intensity on daily timeframe chart. Meanwhile, MACD remains in a bearish cross, but the gap between signal lines is narrowing. In plain terms, downside momentum is slowing with recent bullish move in past few days.
CMF, however, is still negative at around –0.05. Until it flips above the zero line, money flow doesn’t support a sustained bounce. This keeps any Bitcoin price prediction in the “short-term relief only” category rather than any kind of trend reversal not even in the shortterm view.
Leverage Tells a More Dangerous Story
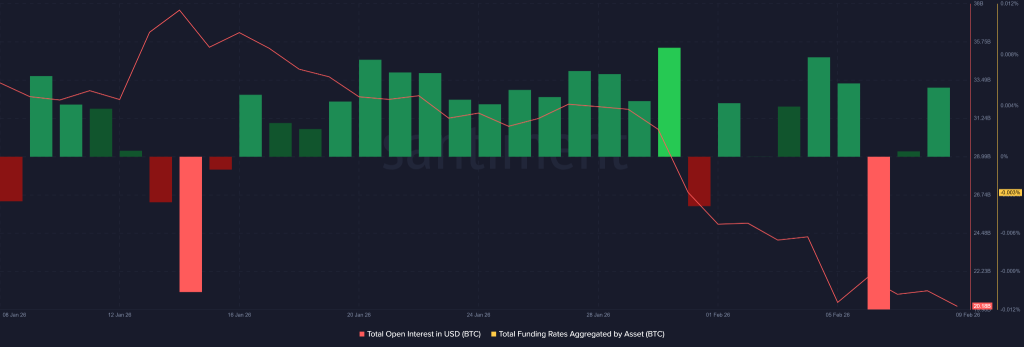
Derivatives data adds another layer of concern. As per Santiment data, the Open Interest has been falling seamleslly from 30 days high of 38 million OI to only 20 billion OI positions, while BTC price struggles, a sign that traders are exiting positions rather than committing fresh capital.
The brief funding spike on February 6 looked dramatic, but it functioned more like a short squeeze than genuine demand. Once funding flipped back to positive, the market became crowded with over-leveraged longs.
That’s the trap. Positive funding without rising participation leaves buyers exposed. Without new money entering, even a modest dip could trigger liquidations, dragging Bitcoin/USD back toward lower support.
For now or this month, Bitcoin price may attempt a bounce toward $74,750 or even $84,900 if buyers show up decisively. But until the 200-day EMA near $95,700 is reclaimed, the broader structure stays tilted firmly toward the bears.
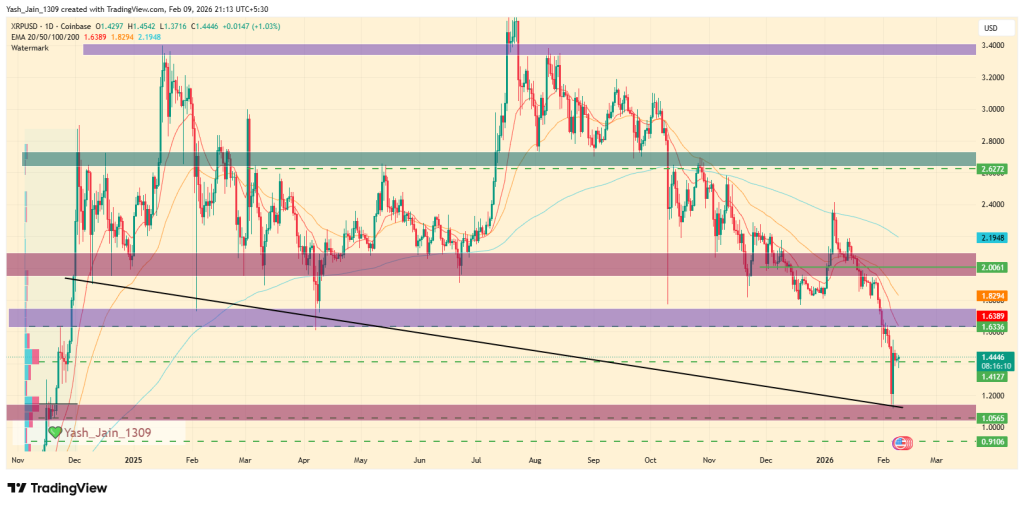
XRP price is hovering around $1.43, barely holding above the $1.41 support, and the market tone isn’t exactly comforting. Just days ago on the weekly chart, XRP briefly slid to $1.10 which was its lowest level in several months, it barely stopped just above the psychologically loaded $1.00 mark.
That bounce looked encouraging on the surface. Underneath, not so much. Because while price recovered, confidence didn’t.
Longer-term holders still remain shaky, and the structure around the XRP price chart suggests the rebound may have been more mechanical than conviction-driven. This isn’t panic yet, but it’s fragile on the inside.
One thing investors and traders must know to be clear. That a dip to $1.10 and a spike back isn’t meaningless, at least for now. Because it means that buyers did step in, and the $1.00-$1.10 zone still commands respect from bulls. But here’s the problem, in the short-term it looks like a spike but on the long-term chart the recovery didn’t flinch XRP price meaningfully towards the broader trend.
From a technical standpoint, XRP/USD is still skating dangerously close to failure. If $1.41 gives way, price action opens a clean path back toward $1.10. And if that level fails to hold on a retest, the downside narrative intensifies fast.
So yes, support exists. But it’s being tested by hesitation, not confidence. And, if it returns back the $1.00 consolidation could start.
Derivatives Data Leans Heavily Toward More Downside
Now for the uncomfortable part. Derivatives positioning also doesn’t agree with the idea of a stable base forming.
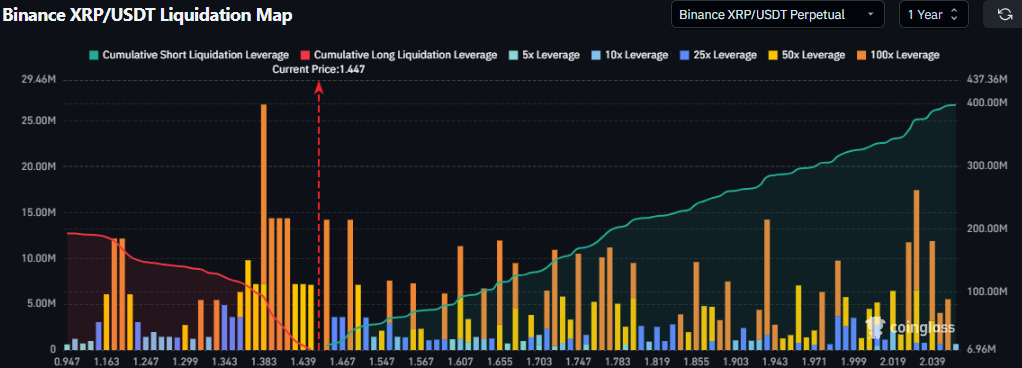
Liquidation data shows roughly $390 million stacked on the short side compared with just over $190 million in long exposure. That imbalance matters. It suggests traders are leaning into weakness, not preparing for a sustained rebound.
In other words, the futures market isn’t buying the bounce. It’s betting against it.
And if XRP price drifts lower again, that heavy short positioning could amplify volatility rather than cushion it. This is why any XRP price prediction right now carries asymmetric risk.
Supply Distribution Shows Whales Quietly Heading for Exits
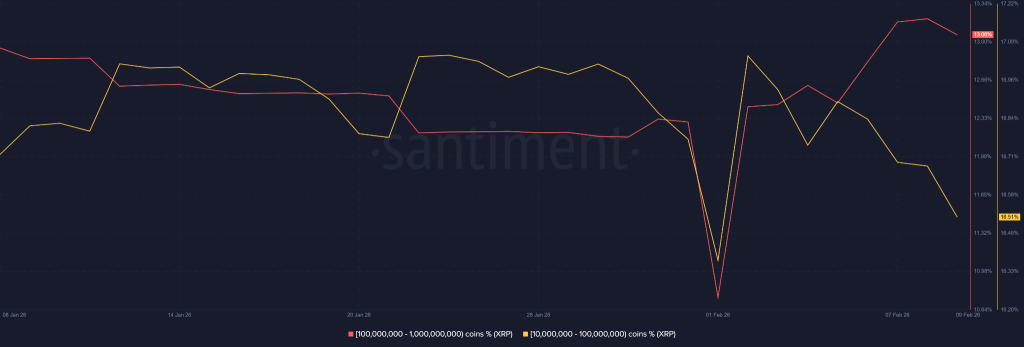
Meanwhile, on-chain behavior isn’t offering much comfort either. Per Santiment data, the metric Supply distribution by balance tells a clear story. Addresses holding between 10 million and 100 million XRP have been steadily selling since early February, which is responsible for the crash in XRP. More concerning, now wallets in the 100 million to 1 billion XRP range have turned bearish in the last 24 hours with metric showing a downside u-curve.
That shift matters. Larger holders don’t usually rush. When they start leaning toward distribution, it often precedes deeper price tests.
If selling pressure continues and XRP revisits $1.00, the risk isn’t just a clean breakdown. Cascading liquidations could follow, reinforcing bearish momentum across both spot and derivatives markets.
For now, XRP price remains above support. But the longer it lingers without demand stepping in, the thinner that safety net becomes.
Bitcoin is currently trading at: $ 69,204.63229986
Predictions suggest BTC to hit $150K to $250K before 2026 ends.
Long-term forecasts estimate BTC prices could hit $900K by 2030.
After a historic 2025 that saw Bitcoin shatter records and flip the legendary $125,000 mark, the market has taken a sharp, cooling turn. The early weeks of 2026 have been defined by a “sell-the-news” reality check, leaving many to wonder if the bull run has finally run out of steam or if we are simply witnessing the ultimate “buy the dip” opportunity.
The landscape has shifted. With a pro-crypto administration in the White House and institutional giants like MicroStrategy and Metaplanet treating BTC as a foundational reserve asset, the rules of the game have changed. No longer just a speculative play for retail traders, Bitcoin is now a geopolitical chess piece and a corporate balance sheet staple.
But as the price tests crucial support levels, the big question remains: Is this a temporary correction before a march toward $200,000, or the start of a long-term reset?
In this deep dive, we break down the Bitcoin price prediction for 2026–2030, exploring the massive trends, regulatory shifts, and institutional moves driving this historic cycle. If you want to know where the floor is and how high the ceiling goes. read on for the full scoop.
Coinpedia’s BTC Price Prediction 2026
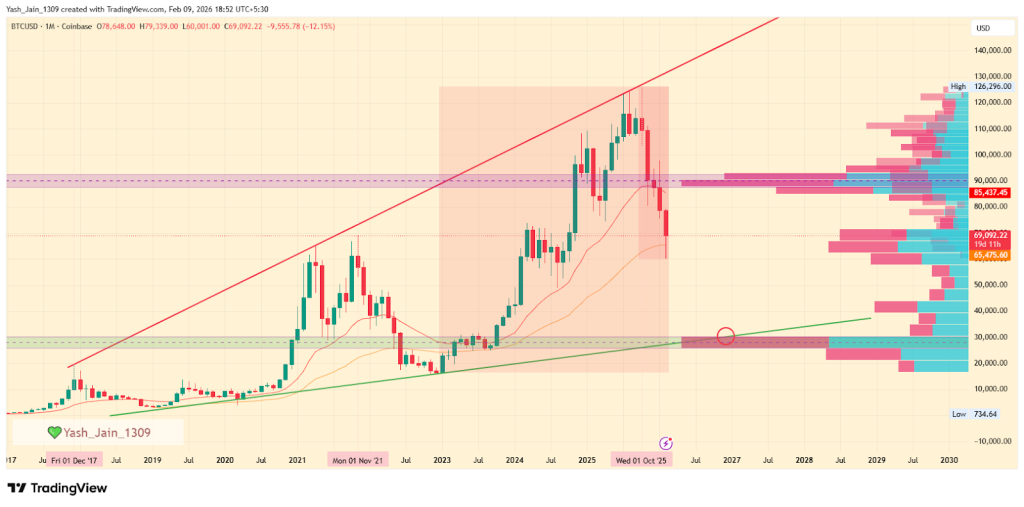
In early 2026, Bitcoin is in a correction phase after peaking at around $126,296 in October 2025. A potential bottom may occur around December 2026, with significant support expected between $25,900 and $30,350. Historical trends suggest this decline could reach 70%-76%, potentially bringing Bitcoin down to the lower border of the ascending broadening wedge’s support. This period may mark the end of the bear market, with 426 days in total, similar to historical correction periods, and pave the way for a rally in the next year.
What is the Bitcoin price prediction for today?
The BTC price may range between $68,291.03 and $71,076.80 today.
As of early February 2026, Bitcoin is trading near $ 70,000 after a sharp crash from the late January 90K area. In the immediate term, $60K support plays a key role in preventing BTC from falling further.
So far, several key levels have broken along the way, and that shift has traders watching for a clear short-term bottom before they start retaking bigger bets.
Overall, the Sentiment still feels shaky, leaning more toward the bearish side. The Crypto Fear and Greed Index still sits in Extreme Fear, and spot Bitcoin ETFs have continued to withdraw funds based on weekly flows data, September 2025 onwards. Major outflows occurred, even in early February.
Also, the 50-day EMA is technically below the 200-day EMA, so the death cross signal has remained alive since mid-November. The short-term EMA death cross between the 20-day and 50-day EMA bands occurred in late January, confirming the bearishness in the short term.
Therefore, Traders now treat $60,000-$65,000 as the next line of support. Lose it, and forced selling can follow. February has started choppy, and it stays that way until buyers return in size again. If they do, $74,750 stays target 1 for February, and $84,900 is the target 2 in the short term.
While the entire bearish structure remains dominant, a tilt towards the bullish structure, with the 200-day EMA band at $95,700 defeated, will be key. Till then, the overall structure remains on the bearish side.
Bitcoin Price Prediction 2026
The current price action in early 2026 confirms that Bitcoin price is following a well-defined historical rhythm within its long-term ascending wedge. After reaching a peak of approximately $126,296 in October 2025, the market has entered a significant correction phase.
This peak was not accidental; it represented a direct hit on the upper resistance boundary of the wedge pattern that has governed Bitcoin’s macro price action for years. Historically, these touches lead to extended periods of decline the first major crash from $21,000 lasted 427 days, while the second from $69,000 lasted 426 days. If this 14-month corrective cycle holds true, we are looking at a “target date” for a definitive bottom around December 2026.
The intensity of the sell-off in February 2026 was largely driven by a failure to reclaim the $87,800–$92,950 supply range. According to the anchored volume profile, this zone represented the highest momentum area of the previous bearish move, and once it flipped from support to resistance, the downward pressure has accelerated. Since markets don’t go straight, there will be attempts to rise, but the likelihood is high that they will occur in the future as fakeouts and result in further decline.
As we look toward the remainder of 2026, the charts suggest that the most significant high-momentum demand area sits much lower, specifically between $25,900 and $30,350.
This range represents a crucial “interest zone” where institutional buyers previously stepped in and where the lower support of the ascending wedge is likely to converge by year-end.
Statistically, Bitcoin’s major crashes have shown a trend of diminishing returns in terms of percentage drawdowns. The late 2017 onwards crash saw an 87.25% decline, and the 2022 crash reached 78.65%. Following this trajectory of “dampening volatility,” the current third crash is projected to result in a 70%-76% approx decline. From the $126,000 ATH, a 76% correction would push the price toward that critical $30,000 region.
Consequently, the prediction for December 2026 is a final test of the wedge’s lower border within this demand zone, marking the end of the current bear cycle and setting the stage for the next period of accumulation and next big rally could occur in 2027 onwards.
BTC Price Indicator Analysis 2026
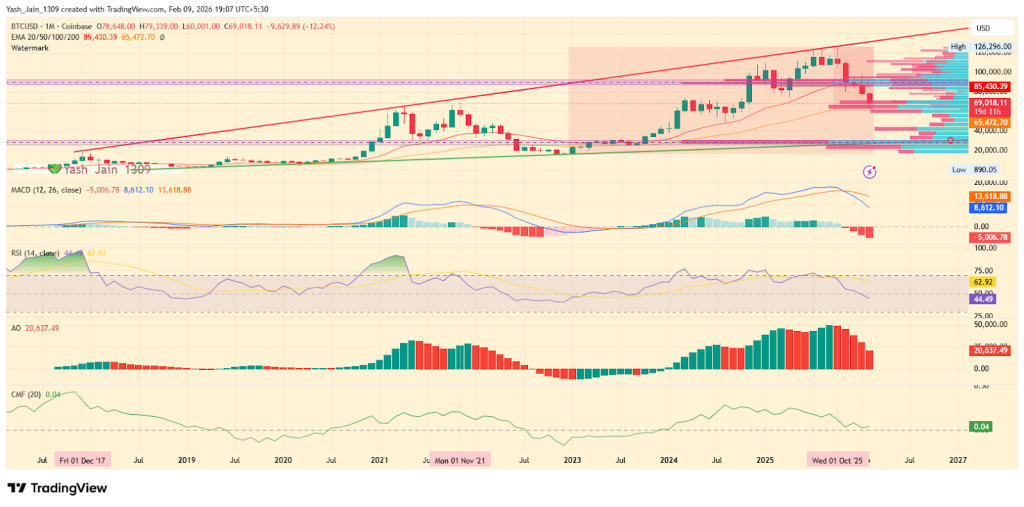
Similarly, the technical indicators shows that Bitcoin price has already entered a danger zone we haven’t seen in years. On a deeper look at the monthly RSI, BTC has a legendary track record of never hitting “oversold” levels; it usually bottoms out right around the 40 mark. Right now, we’re sitting at 44.49 and sliding fast. This isn’t just a dip it’s the classic signal that the bearish momentum is finally taking over and heading for that historical floor.
The indicators under the hood are screaming the same thing. The MACD has already locked in a bearish cross, and the gap between the lines is widening. In past crashes, the selling hasn’t stopped until those lines flattened out near the zero mark. We aren’t even close to that “exhaustion” point yet, meaning there is plenty of room for this to bleed out further.
Even the “smart money” indicator (CMF) is still showing positive inflows for now, but that’s actually the scary part. Once that green line snaps below zero and heads toward -0.20, that’s when the real panic hits. We aren’t at the end of the crash; we’re in the middle of it. Don’t mistake this for exhaustion, as the collapse toward the pattern’s lower border would soon intensify.
Month
Potential Low
Potential Average
Potential High
2026
$30,000-$45,000
$90,000 – $101,000
$115,000 – $118,000
Bitcoin Price On-chain Outlook
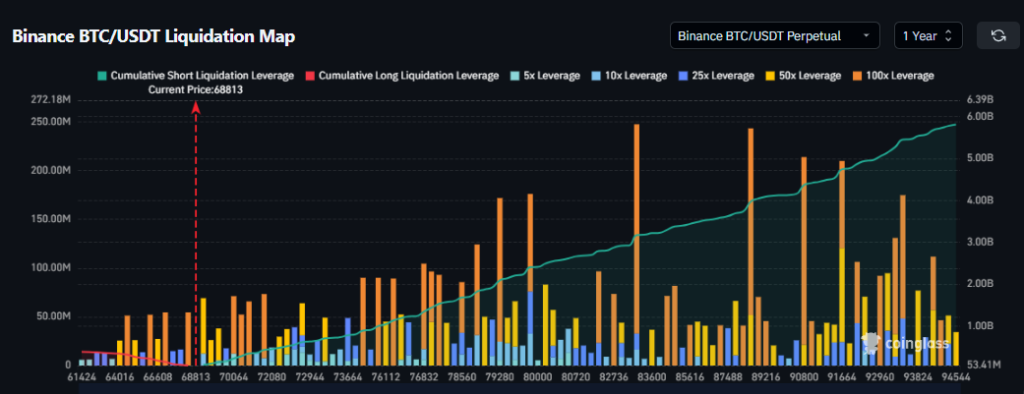
Liquidation data shows roughly $5.81 billion on the short side, compared with just over $380 million on the long side. That imbalance matters because it’s completely dominated by bears and bulls, with no room for survival. It suggests traders are leaning into weakness rather than preparing for a sustained rebound.
In other words, the futures market isn’t buying the bounce. It’s betting against it.
And if BTC price drifts lower again, that heavy short positioning could amplify volatility rather than cushion it. This is why any BTC price prediction right now carries asymmetric risk.
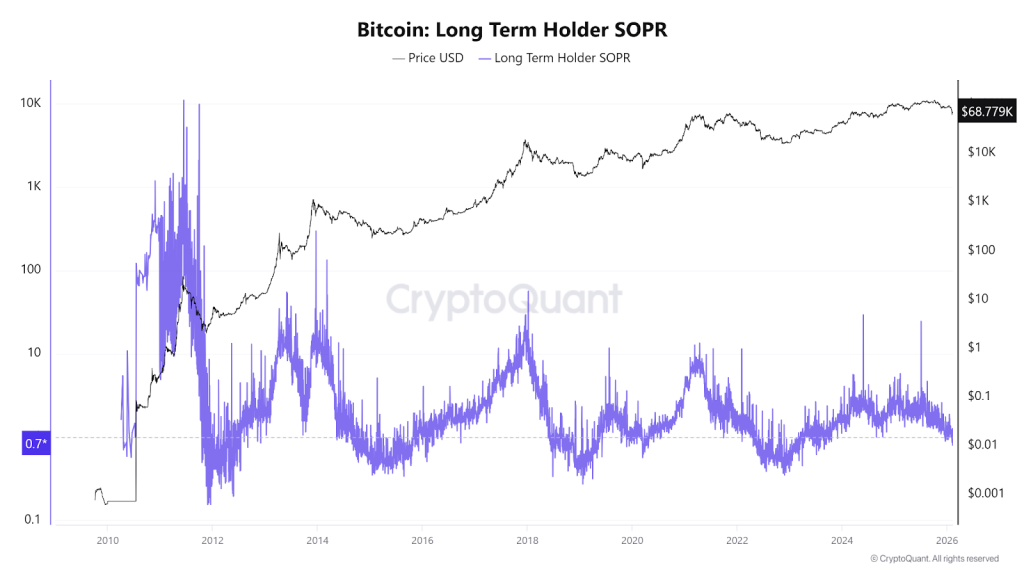
Moreover, the BTC long-term holder SOPR chart shows a current value of 0.7, which is below 1, indicating that more long-term investors are selling at a loss. And it’s seen when more holders keep selling at a loss, this metric has a history of hitting the 0.2-0.3 mark, which has truly seen a fresh demand. For now, the long-term trend is more bearish.
Recent Events Affecting Bitcoin’s Price
The transition from late 2025 into early 2026 saw Bitcoin flip from a booming success story into a struggling “bear market.” After hitting its peak in October, the excitement cooled off fast as the fundamental pillars holding up the price began to crumble at the same time.
By December, the “cheap money” era felt officially over. The Federal Reserve confirmed that high interest rates weren’t going anywhere, and the nomination of Kevin Warsh to replace Jerome Powell signaled a shift toward even tighter financial discipline. This left investors spooked, fearing a future without the safety net of central bank support.
The situation worsened in January when big institutional players started pulling their money out of spot ETFs to lock in profits. At the same time, rising tensions between the U.S. and Iran proved that Bitcoin isn’t yet seen as a “safe haven” but investors ditched crypto for actual gold to avoid the risk.
Finally, a “double blow” of bad news drained what was left of the market’s momentum. Crucial crypto legislation, the CLARITY Act, got stuck in the Senate, leaving the industry in legal limbo. Meanwhile, new fears about quantum computing threats to blockchain security started to circulate. Together, these events broke the market’s confidence, pushing the price toward the lower end of its long-term trend.
Bitcoin Crypto Price Prediction 2026 – 2030
Year
Potential Low ($)
Potential Average ($)
Potential High ($)
BTC Price Forecast 2026
150K
200K
230K
BTC Price Prediction 2027
170K
250K
330K
Bitcoin Predictions 2028
200K
350K
450K
BTC Price 2029
275K
500K
640K
Bitcoin Price Prediction 2030
380K
750K
900K
BTC Price Forecast 2026
The BTC price range in 2026 is expected to be between $150K and $230K.
BTC Price Prediction 2027
Subsequently, the Bitcoin price range can be between $170K to $330K during the year 2027.
Bitcoin Predictions 2028
With the next Bitcoin halving, the price will see another bullish spark in 2028. Specifically, as per our Bitcoin Price Prediction, the potential BTC price range in 2028 is $200K to $450K.
BTC Price 2029
Thereafter, the BTC price for the year 2029 could range between $275K and $640K.
Bitcoin Price Prediction 2030
Finally, in 2030, the price of Bitcoin is predicted to maintain a positive trend. Indeed, the BTC price is expected to reach a new all-time high, ranging between $380K and $900K.
Based on the historic market sentiments and trend analysis of the largest cryptocurrency by market capitalization, here are the possible Bitcoin price targets for the longer time frames.
Year
Potential Low ($)
Potential Average ($)
Potential High ($)
2031
$540,830.43
$901,383.47
$1,261,936.86
2032
$757,162.60
$1,261,936.86
$1,766,711.60
2033
$1,059,945.80
$1,766,711.60
$2,473,477.75
2040
$5,799,454.28
$9,665,757.13
$13,532,059.98
2050
$161,978,188.65
$269,963,647.74
$377,949,106.84
Bitcoin Prediction: Analysts and Influencers’ BTC Price Target
“Jack Dorsey, former Twitter CEO (now X), predicts Bitcoin could exceed $1 million by 2030 due to its ecosystem growth and increasing adoption.”
Cathie Wood, CEO of Ark Invest, projects Bitcoin to reach $1.5 million by 2030, driven by institutional adoption and its position as digital gold.”
“Wall Street broker Bernstein believes 2026 will mark the start of a tokenization “supercycle,” maintaining its $150,000 Bitcoin price target for this year and $200,000 for the 2027 cycle peak.”
“Brad Garlinghouse, the Ripple CEO, predicts Bitcoin will hit $180,000 in 2026, due to favorable market and regulatory conditions.”
Never Miss a Beat in the Crypto World!
Stay ahead with breaking news, expert analysis, and real-time updates on the latest trends in Bitcoin, altcoins, DeFi, NFTs, and more.
FAQs
What are the biggest risks to Bitcoin’s price in 2026?
Major risks include global recessions, tighter crypto regulations, declining liquidity, or a sustained breakdown below key support levels.
How much will BTC be worth in 2030?
Bitcoin price forecasts for 2030 range from $380K to $900K, driven by scarcity, long-term adoption, and expanding institutional participation.
What will be the price of Bitcoin in 2050?
While uncertain, many long-term projections suggest Bitcoin could exceed $1 million by 2050 if it becomes a global store of value.
Is Bitcoin still a good hedge against inflation in the long term?
Bitcoin’s fixed supply makes it attractive as an inflation hedge, especially during currency debasement and long-term economic uncertainty.
XRP price currently stands at $2.99, with a market capitalization of $179.79 billion. Analysts and AI forecasts alike suggest that XRP could reach $5.05 by the end of 2025. Long-term XRP price predictions also place it as high as $26.50 by 2030, with an ultra-bullish target of $526 by 2050.
Ripple (XRP) remains one of the top five crypto assets in the world, gaining traction as institutional adoption ramps up and its prolonged legal battle approaches resolution. Since President Trump’s return to office, XRP has seen a resurgence in on-chain activity, investor sentiment, and even XRP ETF approved turned it into a bluechip asset.
Now, making this the most ideal time for XRP price prediction 2026-2030 to be in more focus. Read this to know in depth what’s coming next in XRP.
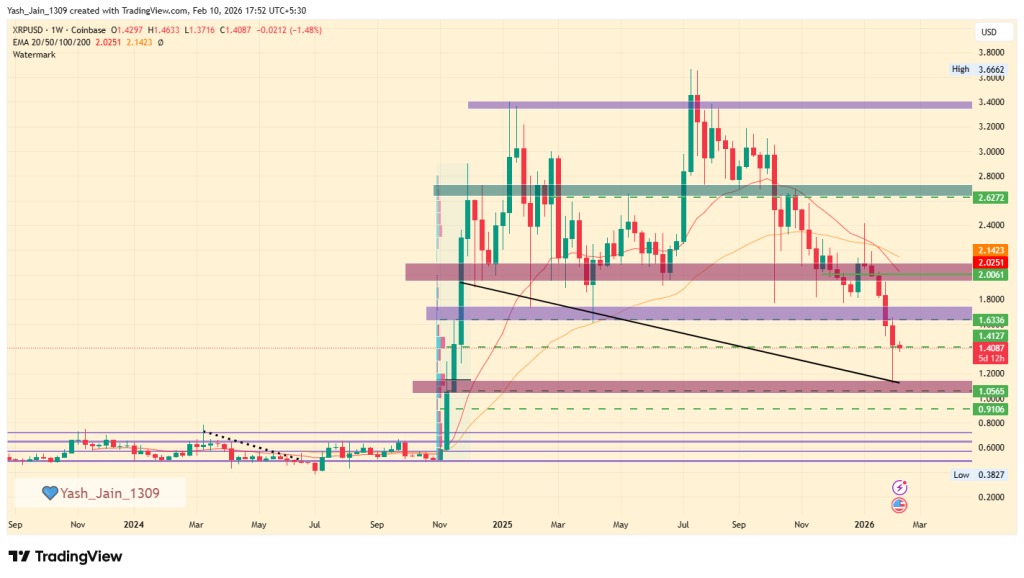
XRP has dropped to $1.15, testing demand from late Q4 2024. If it breaks above $1.63, it might rise to $2.00 or $2.62. If not, it could fall to $1.00 and consolidate there in Q1 2026.
XRP Price Prediction For February 2026
A long-term declining trendline was retested in early February, resulting in a notable spike that indicates a rise in demand. However, the direction for the rest of February will depend on whether the price can break through the $1.63 resistance level. If it gains momentum, the next key resistance levels to watch are $1.75 and $2.00. Conversely, if the price falls, $1.00 will serve as an important support level.
XRP Price Prediction 2026
On the weekly chart, XRP’s price shows significant weakness, falling to $1.15, which retests the demand area established in late Q4 2024. However, early February saw a quick reversal from this short-term demand level.
If the price continues to recover and manages to surpass $1.63, the uptrend could continue toward $2.00 or even $2.62 in Q1 2026. On the other hand, if $1.63 acts as resistance and the price reverses, we can expect a decline to $1.00, with Q1 possibly spent consolidating around the $1.00 level.
Year
Potential Low
Potential Average
Potential High
2026
$1.75
$3.45
$5.05
XRP Onchain Outlook
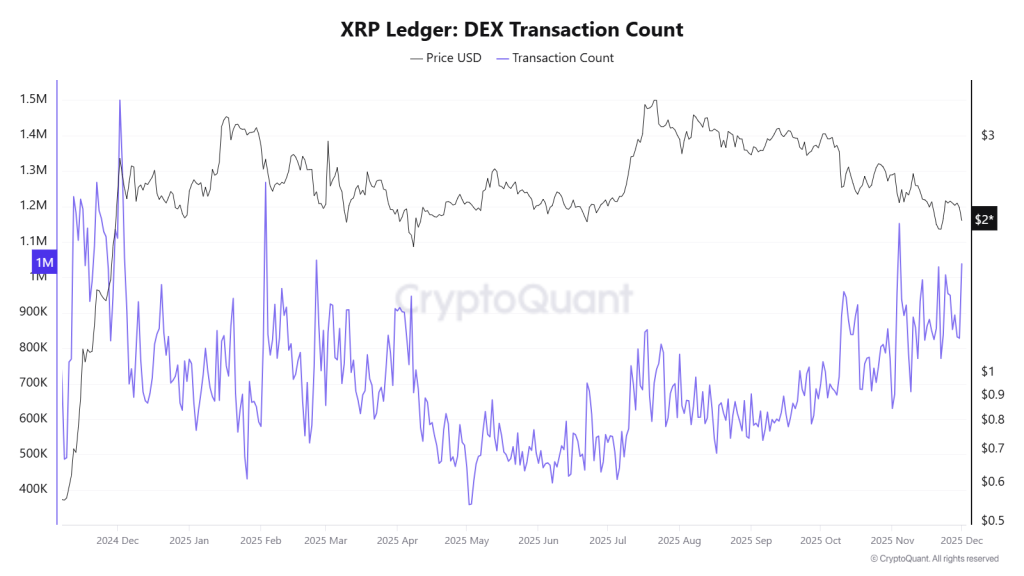
The XRP Ledger: DEX Transaction Count chart indicates a significant bullish divergence starting from May 2025. While the price is consolidating, the activity in decentralised exchanges (DEX) is increasing sharply.
The high transaction volume, which includes both orders placed and cancelled, shows that experienced traders are actively positioning themselves and adding liquidity in anticipation of a future price movement.
As a result, this on-chain metric suggests that the market is preparing for a powerful and sustainable rally in the XRP price ahead.
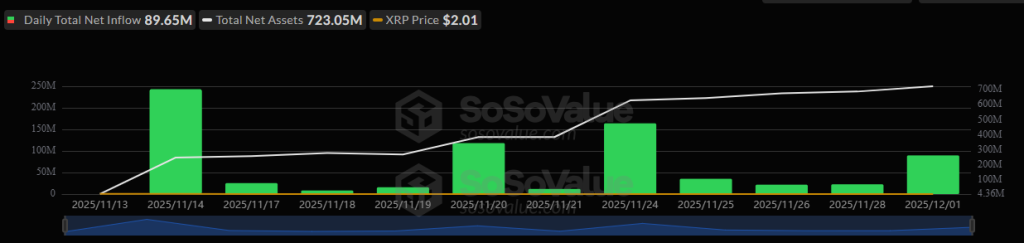
Also, the biggest fact right now in December is that altcoin liquidity is drying up. Projects securing new liquidity channels like ETFs have a better chance of long-term survival, and since November 14th, the XRP ETF has been seeing positive inflows consistently, despite what price action is, and so far, Cumulative Total Net Inflow has crossed $756 million, while total net assets are worth $723.05 million, by December 1st.
Ripple XRP Price Prediction 2026 – 2030
Year
Potential Low ($)
Potential Average ($)
Potential High ($)
XRP Price Prediction 2026
5.50
6.25
8.50
Ripple Price Prediction 2027
7.00
9.0
13.25
XRP Price Prediction 2028
11.25
13.75
16.00
XRP Price Prediction 2029
14.25
16.50
21.50
XRP Price Prediction 2030
17.00
19.75
26.50
This table, based on historical movements, shows XRP price prediction 2030 to reach $26.50 based on compounding market cap each year. This table provides a framework for understanding the potential XRP price movements. Yet, the actual price will depend on a combination of market dynamics, investor behavior, and external factors influencing the cryptocurrency landscape.
Based on historic price sentiments and XRP’s rising popularity, here are the XRP future price projections beyond 2030, where Ripple price forecasts suggest that it has become more speculative. Therefore, assuming continued adoption and dominance, XRP may see aggressive valuations in the decades ahead.
Year
Potential Low ($)
Potential Average ($)
Potential High ($)
2031
25.00
29.50
35.25
2032
31.50
36.75
41.25
2033
35.75
42.25
47.75
2040
97.50
135.50
179.00
2050
219.25
331.50
526.00
A look at this table, highlights the XRP price prediction 2040 and XRP price prediction 2050 potential high ambitious targets but this reflect a transformative vision for XRP as a dominant global payment player.
Market Analysis
Firm Name
2025
2026
2030
Changelly
$2.05
$3.49
$17.76
Coincodex
$2.38
$1.83
$1.66
Binance
$2.16
$2.27
$2.76
Never Miss a Beat in the Crypto World!
Stay ahead with breaking news, expert analysis, and real-time updates on the latest trends in Bitcoin, altcoins, DeFi, NFTs, and more.
FAQs
What will XRP be in 2026 price prediction?
XRP price predictions for 2026 range between $3.45 and $5.05, depending on ETF inflows, market sentiment, and sustained demand above key levels.
What will XRP be worth in 2030?
By 2030, XRP forecasts suggest a potential range of $17 to $26.50 if adoption grows and Ripple maintains its role in global payments.
How much will 1 XRP be worth in 2040?
Long-term projections estimate XRP could trade between $97 and $179 by 2040, assuming continued network usage and institutional integration.
Is XRP a good investment going into 2026?
XRP’s outlook for 2026 depends on ETF inflows, broader crypto sentiment, and its ability to hold key support levels above $2.
The live price of the Cardano token is $ 0.26220655.
Price prediction suggests potential to reach $2.75 to $3.25 by year-end 2026.
Long-term forecasts indicate ADA could hit $10.25 by 2030.
The Cardano price prediction 2026 is generating significant buzz in the crypto market, as the last quarter is soon to close in few days, boosting interest for the next altcoin. The 2025 for ADA/USD began with numerous fundamental updates strengthening its future, including the transformative Plomin Hard Fork, but 2026 seems even more constructive.
Now, Questions abound: “Will Cardano spearhead the altcoin movement?” and “What heights can ADA reach by 2050?” Explore this Cardano price prediction 2026 and beyond, filled with expert insights and ambitious forecasts.
Coinpedia’s Cardano Price Prediction
The Cardano price outlook for 2026 is promising, driven by its extraordinary 4,000% surge in 2020 and currently holding strong at a significant support level. With a positive shift in market sentiment, even a moderate increase could lead to a remarkable 1,000% rise, positioning Cardano around $4.50.
A more conservative target of $1.40 indicates a solid 300% gain based on existing trends. Analysts are broadly optimistic that upcoming ETF approvals will boost institutional adoption and market stability, with price projections ranging from $2.05 to $2.80.
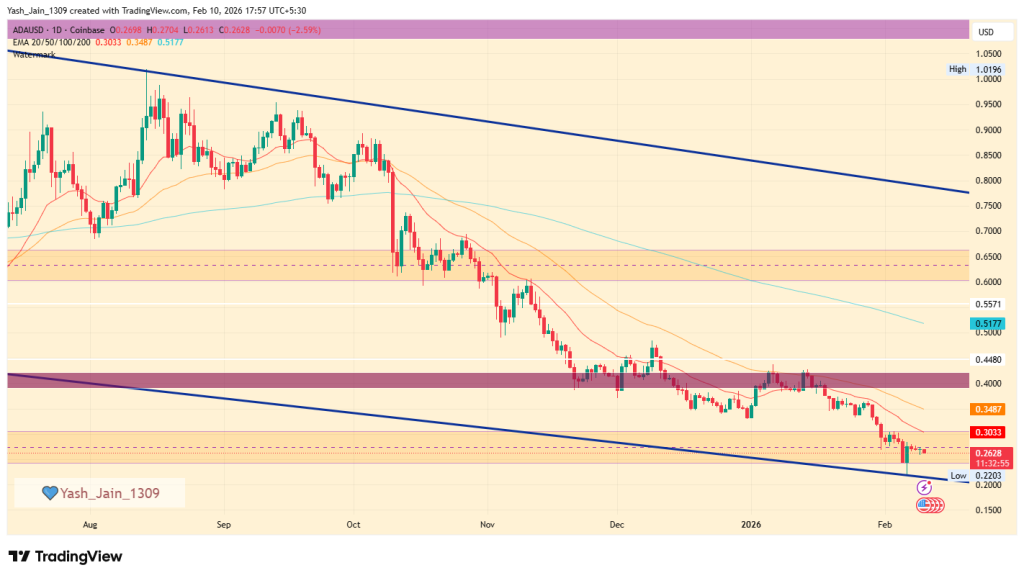
The ADA price is currently experiencing a significant sell-off. However, early February has revealed a crucial demand zone where new buying interest is likely to emerge, setting the stage for a potential bullish rally. Additionally, the lower boundary of the falling wedge is providing solid support, indicating that a price spike could be imminent. Therefore, it is anticipated that ADA could potentially reach $0.60 this month. On the other hand, if BTC collapses again, ADA might drop to $0.20 or even lower.
Cardano AI Price Prediction For February 2026
Source
Low Price
Average Price
High Price
Gemini
$0.85 – $0.95
$1.00 – $1.20
$1.30 – $1.50+
BlackBox
$0.65
$1.00
$1.50
ChatGPT
$0.75
$0.95
$1.25
ADA Price Prediction 2026
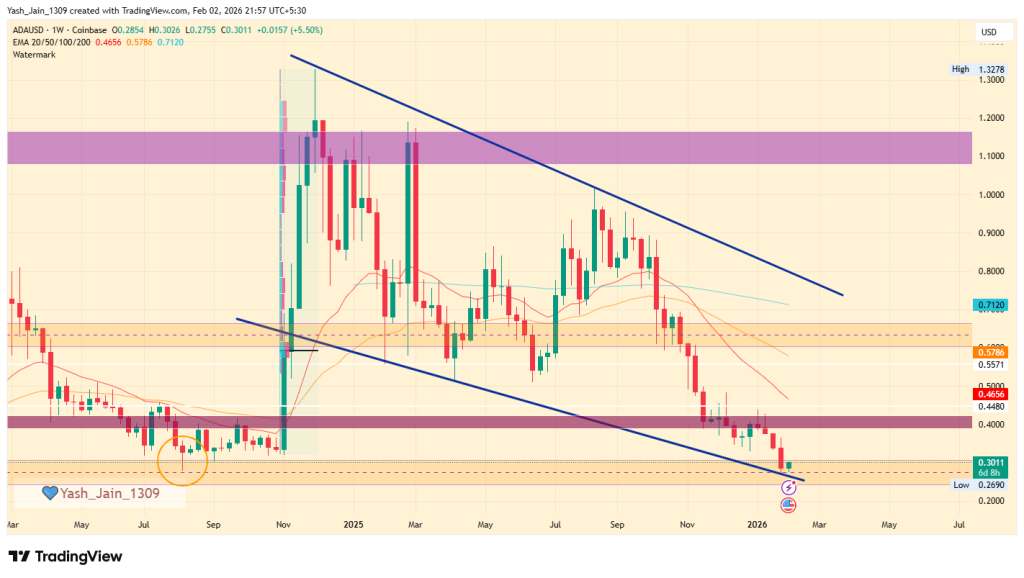
The Cardano price forecast for 2026 points to an important support level on its weekly chart, a range that has consistently acted as a strong pivot point for price trends, and is currently giving off signals of another potential rally. This support level is known for displaying remarkable resilience over time, suggesting that if Cardano price USD can maintain its position above this threshold once again, it could pave the way for significant price movements in 2026.
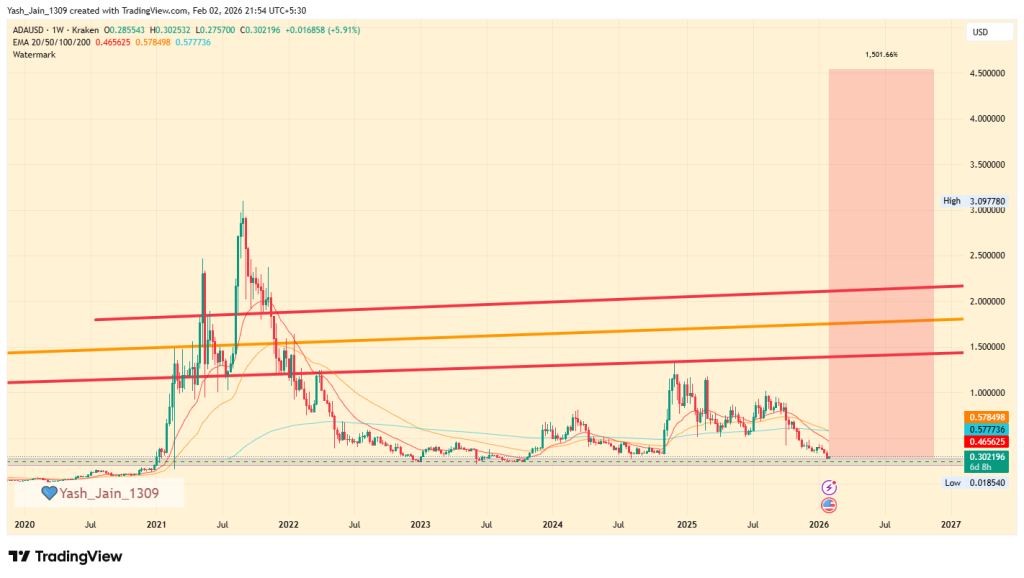
Looking back at Cardano’s historical performance on the weekly chart, it shows an extraordinary rally in 2020, when the asset posted staggering gains of nearly 4,000%. During that bullish phase, the Cardano price USD spent an extended period consolidating around the dynamic support trendline, which appears to be a strategic accumulation at discounts from smart money, contributing significantly to its eventual surge.
If the current market sentiment shifts positively, a resurgence in investor confidence could lead to a recovery. Not ambitiously, even modestly, past performance could give a tremendous surge. Last year’s performance was 4000%. If we assume 1/4 of that momentum, it would result in an increase of approximately 1000%, potentially elevating Cardano’s price to $4.50 by 2026.
Conversely, a more conservative approach suggests a realistic price target of around $1.40, indicating a potential increase of about 300%. This estimate remains feasible, especially since it is based on fundamental analyses and market trends that are not reliant on speculative triggers, such as the possible approval of exchange-traded funds (ETFs).
Additionally, many experts propose that these ETFs could significantly impact the market by boosting institutional investment and improving market stability. In a situation where ETF approvals occur and retail investor excitement rises, Cardano’s price could realistically range from $2.05 to $2.80.
Scenario
Potential Low
Average Price
Potential High
Without ETF Approval
$0.85
$1.10
$1.25
With ETF Approval + Retail Surge
$1.20
$1.65
$2.05
Bullish Breakout (with ETF & macro support)
$1.50
$2.05
$2.80
Cardano On-chain Analysis
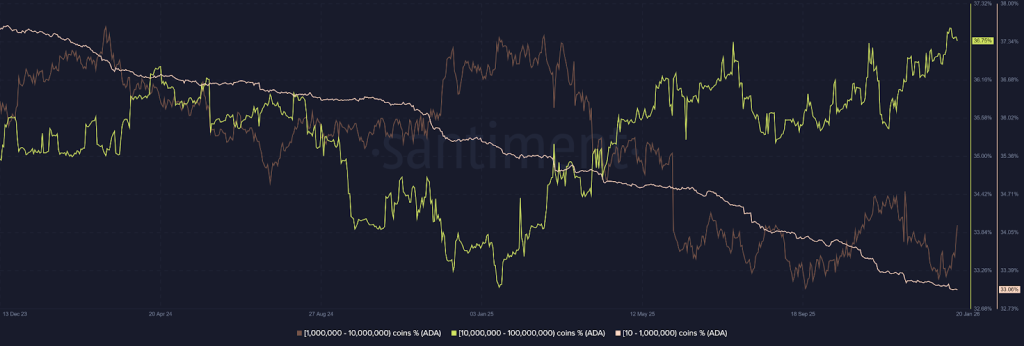
As per Cardano’s on-chain metrics, “Smart Money” accumulation phase is the best observation right now, because the divergence between retail and institutional holders is more vivid than ever.
As the number of addresses holding between 10 and 1 million ADA is declining, and the consistent surge in the 10 million to 100 million coin bracket confirms this, this represents a major supply consolidation. The observation shows that these mega-whales are strategically absorbing the “weak hands” during price dips, effectively building a rock-solid fundamental floor for the asset. Also, the fact that the 1M to 10M coin bracket is also growing confirms that professional high-net-worth investors seem to be positioning for a recovery, too.
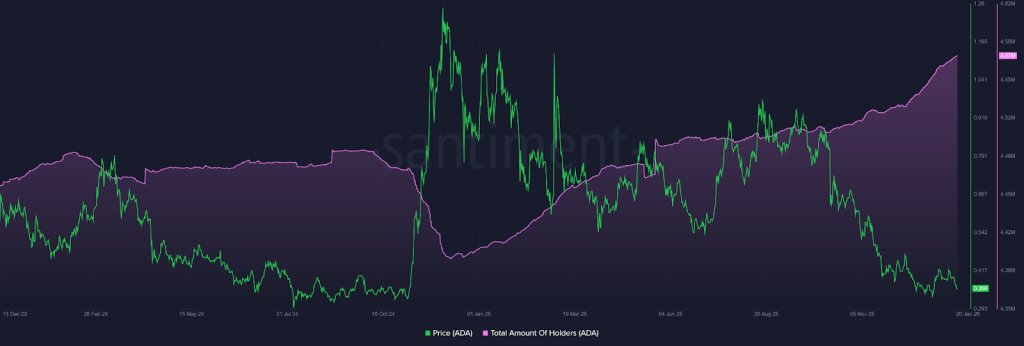
Similarly, the surge to 4.57 million total holders despite a grueling 2025 proves that Cardano’s ecosystem is expanding its reach even in a “stress test” environment. This growth in the holder base suggests that the asset is not being abandoned; rather, it is being redistributed into a more stable, long-term foundation. When a holder count rises as prices fall, it signals that the market views current levels as a deep-value opportunity rather than a reason to exit.
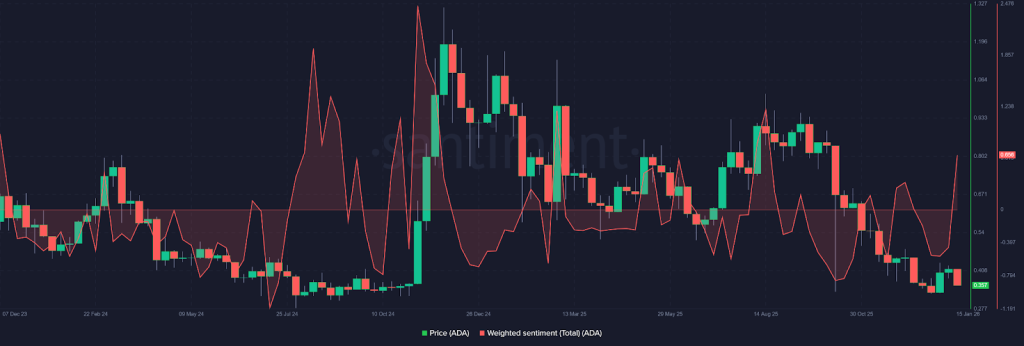
Additionally, the Weighted Sentiment flipping the 0 line to 0.656 is a crucial momentum trigger. Professionally, this “0-line flip” indicates that the aggregate social and market bias has shifted from fear to optimism.
Combined with the strategic whale accumulation, this sentiment pivot suggests that the “disbelief” phase is ending and that a bullish rally is likely once the remaining retail sell pressure is fully absorbed by the growing whale cohorts.
Cardano (ADA) Price Prediction 2026 – 2030
Price Prediction
Potential Low ($)
Average Price ($)
Potential High ($)
2026
2.75
3.00
3.25
2027
4.50
4.75
5.00
2028
5.25
5.50
5.75
2029
6.75
7.25
7.75
2030
9.00
9.75
10.25
This table, based on historical movements, shows ADA prices to reach $10.25 by 2030 based on compounding market cap each year. This table provides a framework for understanding the potential Cardano price movements. Yet, the actual price will depend on a combination of market dynamics, investor behavior, and external factors influencing the cryptocurrency landscape.


 BREAKING
  XRP Avengers