Reading view

Bitcoin Shorts Surge as Funding Turns Deeply Negative—Is a Short Squeeze Coming?

Bitcoin Price Crash Today Has Bitcoin Entered a Bear Market

The post Bitcoin Shorts Surge as Funding Turns Deeply Negative—Is a Short Squeeze Coming? appeared first on Coinpedia Fintech News

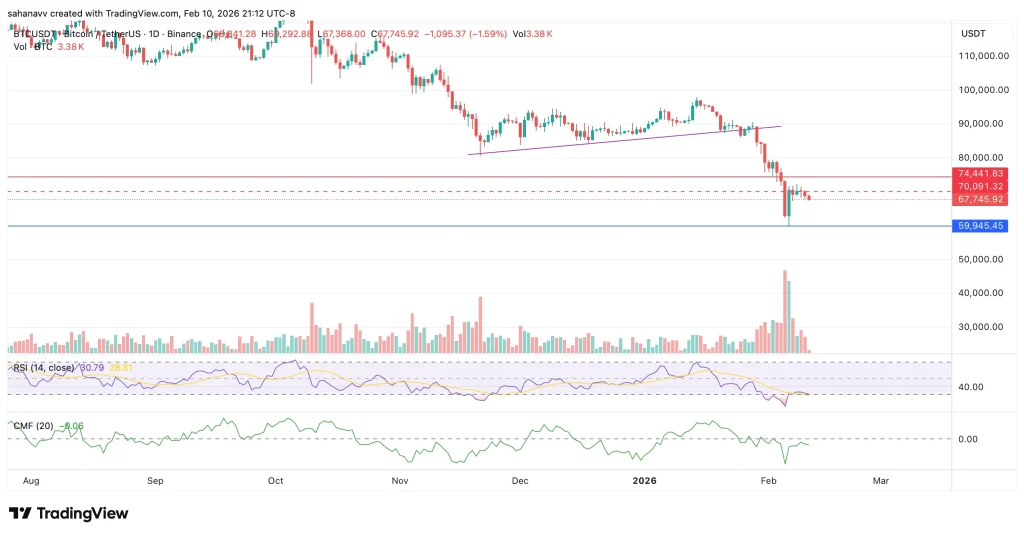
The Bitcoin price is yet again facing significant upward pressure as the token has plunged below $66,000 from an intraday high of over $68,400. Observing the current trade dynamics, it appears that the star crypto is entering a high-tension phase as traders are now expecting the price to plunge. The short bets are increasing notably and have reached a level that usually results in sharp volatility. This suggests the BTC price may get exposed to more sell pressure or a sudden short squeeze may catch bears off-guard. 

With Bitcoin hovering near key technical levels, the imbalance between rising short interest and cooling spot momentum is creating a fragile setup. The question now is whether this wave of bearish bets will push BTC lower or fuel the next breakout.

Bitcoin Short Positioning Hits Extreme Levels

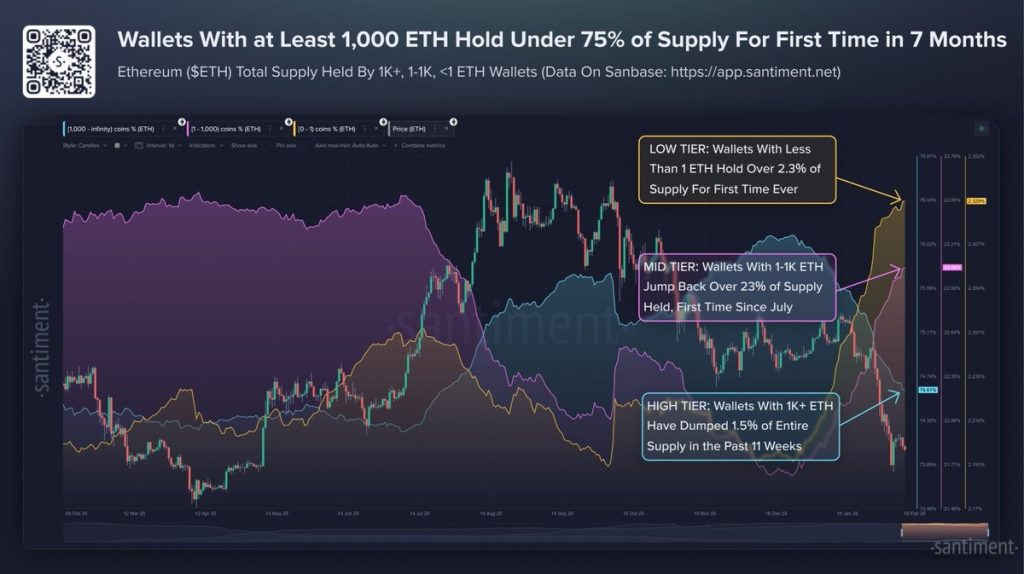
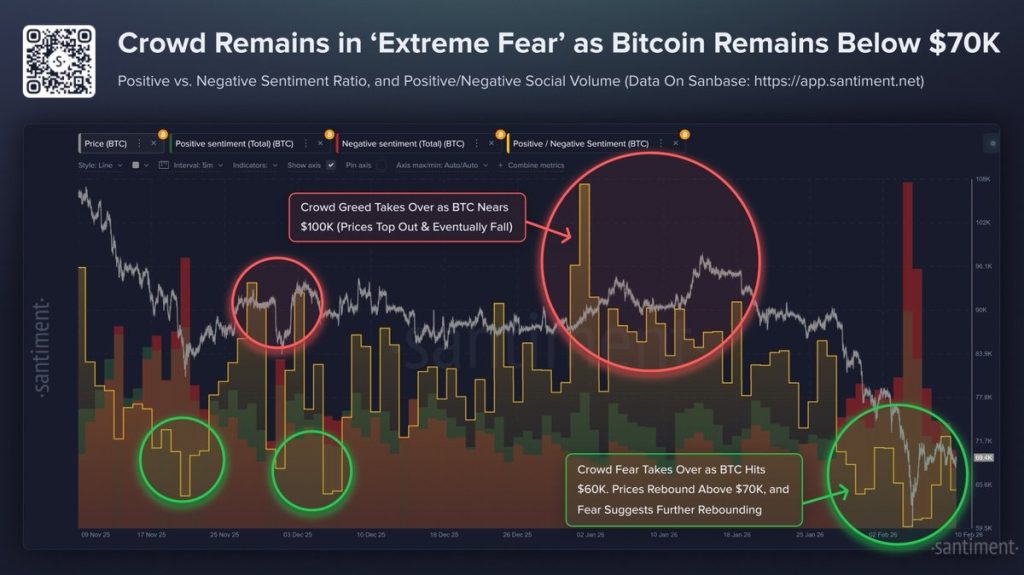
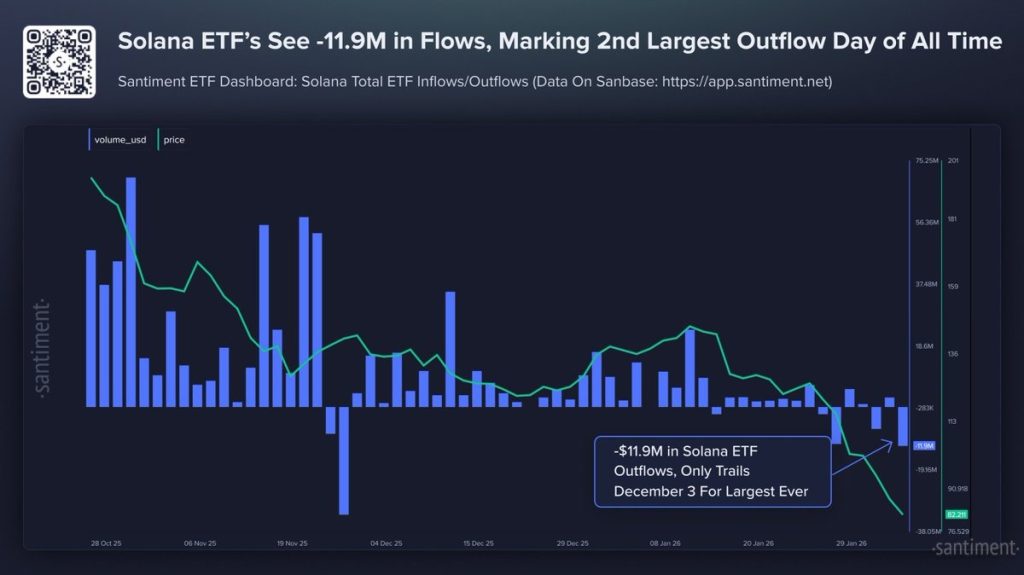
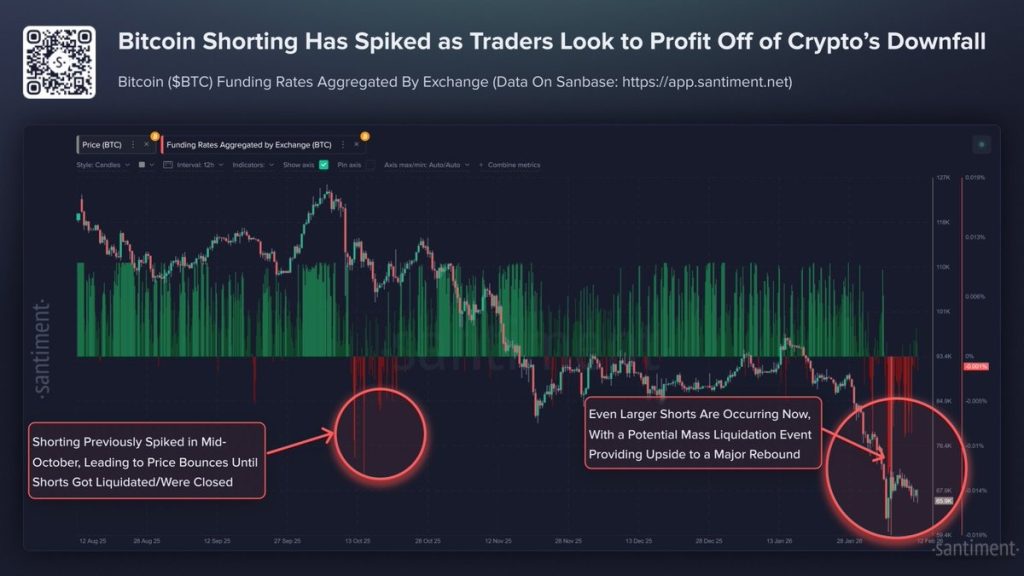
Recent derivatives data from Santiment show a clear spike in short exposure, with funding rates slipping deeply into negative territory. Negative funding means short traders are paying longs to keep their positions open, a sign that bearish sentiment has become crowded.

When funding stays mildly negative, it often reflects healthy hedging. But when it turns sharply negative, it suggests positioning is becoming one-sided. Markets tend to punish extreme consensus. If too many traders lean in the same direction, even a small upward move can trigger forced liquidations, accelerating the price higher in a short squeeze.

btc price

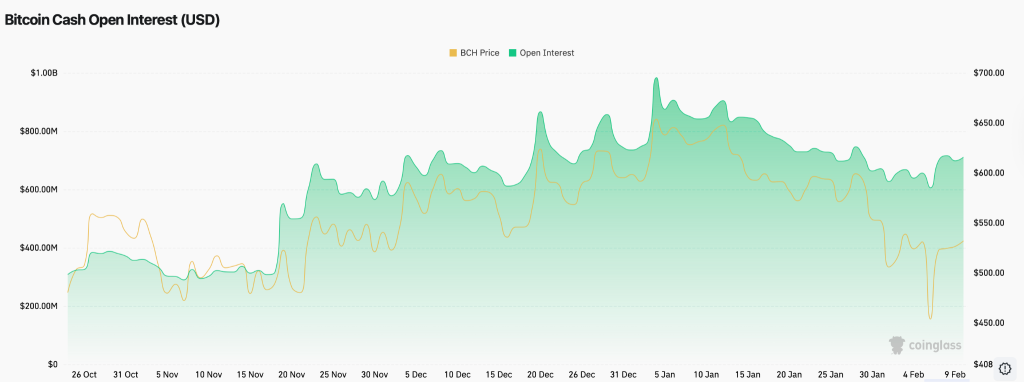
At the same time, open interest remains elevated, indicating that leverage is still active in the system. High open interest combined with negative funding creates a volatility setup, price does not stay compressed for long under these conditions.

The key now is whether spot demand can absorb selling pressure. If buyers defend support levels, the imbalance in shorts could fuel a rapid breakout. If support breaks, however, the crowded short trade may continue to build, reinforcing downside momentum.

Key Levels That Could Trigger the Next Move

Bitcoin is compressing between clear technical boundaries, and with funding deeply negative, these levels now carry even more weight.

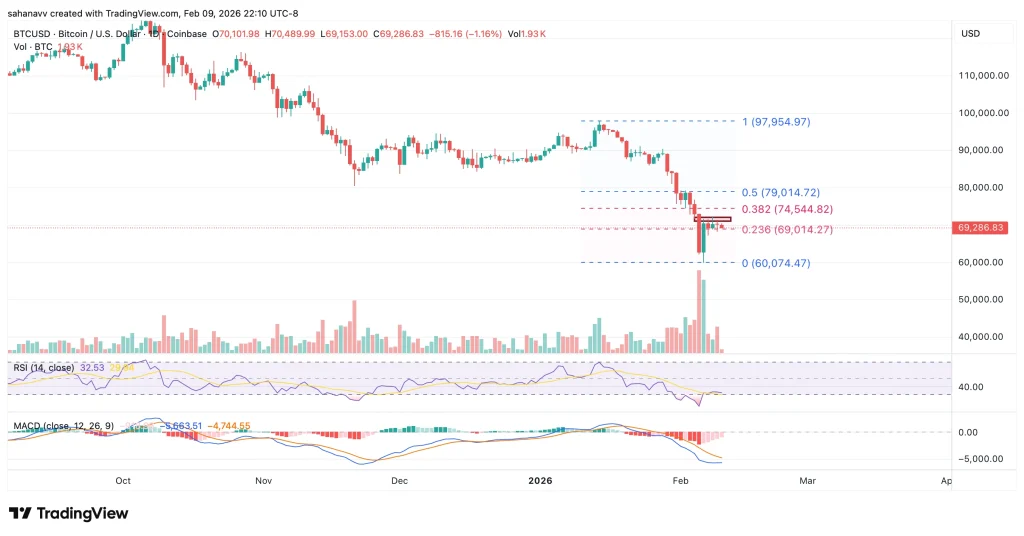
Immediate Resistance: $70,000–$72,000


This zone has capped recent recovery attempts. A strong daily close above $72,000 with expanding spot volume could trigger a short squeeze. If that happens, liquidation clusters sit near $75,500, followed by $78,000. A squeeze extension could target the $82,000–$85,000 liquidity pocket, where prior distribution occurred.

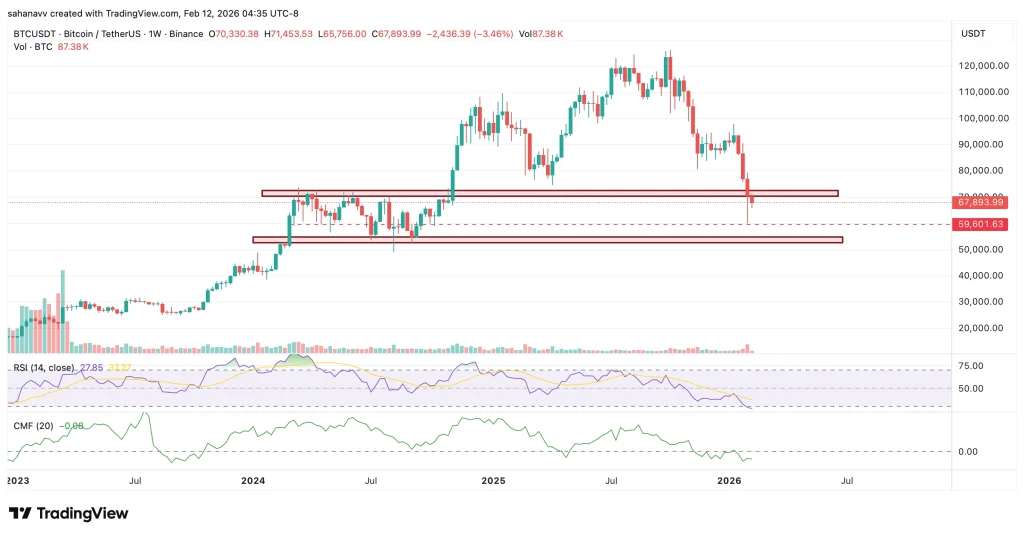
Immediate Support: $59,000 – $60,000


This is the current pivot zone. A decisive breakdown below $59,000 on rising volume would invalidate squeeze expectations in the short term. In that case, downside targets sit at $54,000, followed by the major demand block around $50,000–$52,000.

Open interest remains elevated, meaning leverage is still active. If price breaks either boundary with conviction, volatility could expand quickly. For traders, the setup is clear: above $72K favors squeeze dynamics; below $59K shifts the structure toward a deeper correction.

What’s Next for Bitcoin Price as Shorts Crowd the Market?

Bitcoin price is sitting at a leverage-heavy turning point. Deeply negative funding shows that traders are leaning aggressively short, but extreme positioning alone does not guarantee a squeeze. It simply increases the probability of volatility.

If the BTC price reclaims $72,000 with strong spot demand, the imbalance in shorts could fuel a move toward $75,500 and potentially $78,000. However, without real buying pressure, rallies may continue to fade. On the downside, losing $59,000 would confirm that sellers remain in control, opening the door to $54,000 and possibly the $50,000–$52,000 demand zone.

Altcoin Market on the Brink—Is a Massive Breakdown Toward $500B Coming?

altcoins

The post Altcoin Market on the Brink—Is a Massive Breakdown Toward $500B Coming? appeared first on Coinpedia Fintech News

The altcoin market is approaching a critical technical moment. Excluding Bitcoin and Ethereum, the total crypto market capitalization is testing a long-standing ascending trendline that has supported prices since late 2023. At the same time, a large head-and-shoulders pattern is forming on the higher timeframe—a structure often associated with trend reversals. If confirmed, this breakdown could drag the altcoin market cap toward the $500 billion mark in the coming weeks.

With volatility rising and liquidity tightening across the broader crypto market, traders are now watching closely to see whether this is just another pullback or the start of a deeper correction.

Head-and-Shoulders Pattern Signals Weakening Momentum

The chart below shows a clear three-peak structure, a left shoulder formed after an early rally, a higher head marking the cycle peak and a right shoulder printing a lower high, which is a key sign that buying strength is fading. This pattern becomes active once the price breaks below the neckline, which in this case aligns closely with the rising green macro trendline.

altcoin

The projected move from a head & shoulder pattern breakdown is measured from the top of the head to the neckline. Applying this projection to the current chart structure, it points towards a downside target between $500 billion and $520 billion in total altcoin market capitalisation. Currently, the levels are hovering around $690 billion, which implies a potential 25% to 30% decline if selling pressure accelerates. 

This move could increase Bitcoin dominance, trigger sharper corrections in mid- and small-cap altcoins and postpone any immediate altseason narrative. 

What’s Next for the Altcoins?

Bearish scenario: If the breakdown holds and the trendline fails to recover, the technical structure favors a deeper correction toward $580B and potentially $500B. This would mark a broad market reset and likely extend underperformance across the altcoin sector.

Bullish scenario: If buyers step in aggressively and reclaim the broken support, pushing market cap back above $750B–$820B, the breakdown would turn into a false move. In that case, altcoins could stabilize and resume upside momentum.

For now, the structure and sentiments remain cautious, and the upcoming weekly close will determine whether altcoins will face a deeper correction or rebound, transforming this into a small shakeout. 

Bitcoin Stuck in a Range: When Will BTC Price Finally Break Above $70,000?

Will BTC, ETH and XRP Rally As Trump Formally Nominates Kevin Warsh as Fed Chair

The post Bitcoin Stuck in a Range: When Will BTC Price Finally Break Above $70,000? appeared first on Coinpedia Fintech News

Bitcoin price has entered a decisive phase after losing upside momentum and slipping back into a historically sensitive price region. What initially looked like a routine pullback from the 2025 highs is now evolving into a broader consolidation structure, with price compressing between major supply and demand zones.  

The key question for traders is no longer whether volatility will return but from which direction the breakout will come. And if the breakout heads north, will the BTC price rise above $70,000?

Bitcoin Is Entering a Bearish Range as Momentum Fades

On the weekly timeframe, Bitcoin has broken back below the $70,000 psychological level, which previously acted as a strong acceptance zone during the 2024–2025 markup phase. The rejection from the $110,000–$120,000 region formed a classic distribution top, followed by a series of lower highs—an early signal that market structure was weakening.

The chart highlights a multi-month consolidation that originally acted as a launchpad for the late-2024 rally. Bitcoin has now returned to that same region, but instead of bouncing impulsively, the price is showing hesitation and thinner buying interest.

btc price

Bitcoin’s structure now reflects a clear shift in behaviour, with the former $70,000 support zone now acting as firm resistance. Instead of sharp, confident moves higher, candles have become choppier and more overlapping, a sign of consolidation. Momentum is also cooling, as the weekly RSI has slipped into the low 40s and CMF remains negative, pointing to steady capital outflows. Together, this suggests Bitcoin is going through a reset phase rather than attracting aggressive buying.

Price is now rotating between two clearly defined macro levels:

  • Primary Resistance: $69,000 – $72,000
  • Major Support/Demand Zone: $50,000–$54,000
  • Mid-Level Liquidity Pivot: ~$59,600 (currently being tested)

This structure resembles a range re-accumulation failure turning into redistribution, where former support flips into resistance—a pattern commonly seen during mid-cycle corrections.

Will the Bitcoin (BTC) Price Rise Above $70,000?

Bitcoin is no longer trending—it is trading between $50K and $70K after an overheated rally. The next major move will likely come from a volatility expansion out of this range. A weekly close above $72,000, supported by stronger volume and improving momentum, would signal that buyers are regaining control. In that bullish case, Bitcoin could target $78,000 first, followed by a move toward $88,000–$95,000 later in the month. 

However, failure to hold the mid-range support near $59,000 would shift focus lower, opening the door for a retest of $54,000 and possibly the $50,000 demand zone. For now, BTC remains in a reset phase, and only a decisive breakout will determine whether $70,000 turns back into support or remains a ceiling.

Cardano Drops 4% After CME Futures Launch—Sell the News or Deeper Correction Ahead?

Has ADA Price Fallen Too Far? What Cardano’s Price Structure Signals Next

The post Cardano Drops 4% After CME Futures Launch—Sell the News or Deeper Correction Ahead? appeared first on Coinpedia Fintech News

The Cardano price slipped 4.21% in the last 24 hours, falling to around $0.253 and underperforming a broadly weak crypto market. The decline came just a day after ADA futures officially launched on the CME — a development many viewed as bullish.

Instead of rallying, ADA sold off. The reaction points to a classic “sell the news” move, unfolding at a time when broader market sentiment remains fragile. So What’s next for the ADA price? 

CME Futures Launch Triggers “Sell the News” Move

The launch of ADA futures on CME marked an important institutional milestone. However, instead of attracting sustained spot demand, the event sparked a surge in speculative derivatives activity.

When leveraged volume rises without strong spot buying, the price often struggles to hold gains. In weak markets, positive developments can become liquidity events where traders take profits or open short-term positions.

Key Cardano Price Levels to Watch

Cardano’s price has been maintaining a steep bearish trend since October 2025, losing over 70% since then. The bears have held a strong dominance over the rally, which has strengthened the bearish trend. As the selling pressure intensified, the token lost the local support at $0.277 that pushed the price to $0.25. With the volume and volatility squeezing, the focus has again shifted to $0.22 support as technicals flash a bearish flag. 

ada price

Technically, ADA is approaching oversold territory, with the RSI near 32. The price is also testing important retracement levels, suggesting the market is at a decision point.

Key levels to monitor:

  • Support: $0.226
  • Breakdown risk: $0.20
  • Resistance on a bounce: $0.28–$0.31

If Cardano holds above $0.226, a short-term relief bounce remains possible. However, a daily close below this level could invite further downside toward the $0.20 psychological zone.

Volume will be important. Any recovery needs strong participation to signal real buying interest.

The Bottom Line: Market Outlook Remains Cautious

Cardano’s drop does not appear to be isolated. The entire crypto market has been under pressure, with total market capitalization down more than 3% and Bitcoin sliding alongside it.

There is also a noticeable rotation of capital into AI-focused equities, limiting upside across digital assets. At the same time, continued outflows from U.S. spot Bitcoin ETFs have added structural selling pressure.

In this environment, altcoins like ADA tend to suffer more during risk-off phases. The current move reflects broader market weakness rather than a Cardano-specific breakdown.

For now, the trend remains under pressure. Cardano’s decline reflects a mix of macro headwinds and a lack of sustained spot demand following the CME futures launch.

Oversold conditions could support a tactical bounce, but the structure remains fragile. The key question is whether ADA can defend $0.226 and attract real buyers—or whether broader weakness will continue to weigh on the price.

What Are Ethereum Whales Up To as ETH Trades Below Their Cost Basis: Accumulating or Distributing?

Ethereum Whale Awakens After 9 Years, Moves $145M to Gemini

The post What Are Ethereum Whales Up To as ETH Trades Below Their Cost Basis: Accumulating or Distributing? appeared first on Coinpedia Fintech News

The Ethereum price has just slid below $2000 as the broader market sentiments have dropped, with the Bitcoin price plunging below $67,000. The latest data indicates the value of the second-largest token has dropped below the average cost basis of the whales. This has been a decisive moment in the past that has triggered deeper sell-offs or marked the beginning of a strong accumulation phase. 

Recent on-chain data reveals mixed signals. Accumulation addresses are increasing inflows, and staking participation continues to rise, yet some large wallets have trimmed holdings. At the same time, a massive leveraged long has entered the market, adding another layer of risk.

Now that the large holders are experiencing unrealized loss, the question arises: What are Ethereum whales doing now? Are they quietly adding to the position while the ETH price remains under pressure, or are they reducing exposure and redistributing supply? 

ETH Trading Below Whale Realized Price—Why It Matters


The realized price for whales is the average on-chain cost basis of large holders, typically wallets holding a defined minimum balance. It shows where whales, as a group, last accumulated their coins. When Ethereum trades below the realized price of accumulation wallets, it means long-term holders are underwater. This often creates two outcomes: panic selling or aggressive averaging down.

eth price

Historically, sustained trading below whale realized price signals structural weakness and slower recoveries. Quick reclaim, however, often marks local bottoms, as whale demand absorbs panic selling. On the other hand, the inflows into these accumulation addresses are increasing, which signals conviction rather than capitulation. The whales appear to be adding exposure despite short-term weakness, reflecting a long-term bullish outlook. 

1,000+ ETH Wallets Reduce Holdings—Distribution or Rotation?

On the other hand, there has been a clear shift in the Ethereum supply ownership. The data from Santiment shows that large wallets or whales, have been reducing their exposure, where the total supply has dropped below 75% for the first time in the past seven months. According to the chart, these whales have offloaded roughly 1.5% of the total ETH supply over the last 11 weeks, which lines up with the broader price weakness. That’s classic distribution into strength, not aggressive dip-buying.

eth price

At the same time, mid-tier wallets (1–1K ETH) have stepped in, pushing their supply share back above 23% for the first time since July. Even more telling, small holders (<1 ETH) now control over 2.3% of supply for the first time, suggesting steady retail accumulation. From a trading perspective, this kind of top-down redistribution usually means reduced upside momentum in the short term.

$115 Million Leveraged Long Adds Liquidation Risk

The data below shows that a whale has opened a $115 million Ethereum long position using 15x leverage, with the liquidation level sitting near $1,318. The account is fully long ETH with 100% long exposure and zero shorts, holding a massive $115M perpetual position at around $2,059 entry, while ETH is trading closer to $1,951. This is not spot accumulation. It is directional leverage.

eth price
Source: X

The account is sitting on a weekly realized loss of ~$6.6M, with uPnL down ~$6.4M and ROE at -83.6%. The PnL curve shows brief relief rallies, but they fail to hold—classic signs of buying dips in a downtrend. Despite having $27M in free margin, the max drawdown of 40%+ signals poor timing rather than forced liquidation risk. 

What This Suggests for Ethereum Price

Ethereum is currently in a high-conviction but high-risk zone.

  • Accumulation addresses are buying below the cost basis.
  • Staking activity continues to rise.
  • Large wallets are partially redistributing supply.
  • Leverage exposure is increasing.

This combination suggests structural confidence but fragile short-term conditions. However, the institutional conviction remains visible in staking activity. BitMine recently staked 140,400 ETH, bringing its total staked holdings to nearly 3 million ETH. Roughly 69% of its ETH exposure is now locked. Rising staking participation reduces the liquid supply in the market. Structurally, this supports long-term price stability.

Therefore, if spot demand puts pressure, the Ethereum (ETH) price could stabilise and build a base. If leverage unwinds first, volatility may expand before a clearer trend emerges. The next directional move will likely depend on whether accumulation outpaces speculative risk.

FAQs

What is Ethereum’s price prediction for 2026?

Ethereum could trade between key support near $2,500 and a potential high around $6,000 in 2026 if adoption grows and bullish momentum holds.

What will be the price of Ethereum in 2027?

Ethereum is forecast to trade between $7,000 and $21,000 in 2027, with the average price near $14,000 if bullish momentum continues.

How much will 1 ETH be worth in 2030?

Based on current projections, 1 ETH could trade between $23,000 and $71,000 by 2030, depending on adoption, market cycles, and macro trends.

Top Gainers for the Day—Prices of pippin, LayerZero & River Explode as Market Consolidates

icp price

The post Top Gainers for the Day—Prices of pippin, LayerZero & River Explode as Market Consolidates appeared first on Coinpedia Fintech News

Bitcoin’s rally has paused at a critical level, with price action compressing into a narrow range and momentum indicators flashing early signs of hesitation. As the top crypto struggles to extend its upside, traders are beginning to rotate capital into select altcoins in search of higher short-term returns.

This shift is already visible across the market. Tokens like Pippin, LayerZero, and River prices have surged more than 20% in a single session, signaling renewed risk appetite beyond Bitcoin. The move suggests that while BTC consolidates, speculative interest may be quietly building in the broader altcoin space.

PIPPIN Price Eyes Breakout as Ichimoku Signals Bullish Shift

PIPPIN price has staged a sharp V-shaped recovery after bouncing from the $0.15 lows, signaling strong dip-buying interest. The recent upswing shows improving momentum, with buying pressure gradually increasing. Although volume remains near average levels, price action suggests traders are positioning for a larger move.

The token is now approaching a key resistance zone, and a decisive push above this range could reignite momentum toward a potential new all-time high this month.

pippin price

On the daily chart, PIPPIN has entered the Ichimoku cloud, indicating a transition from a bearish phase into consolidation. More importantly, the conversion line (Tenkan-sen) is attempting to cross above the baseline (Kijun-sen), a move that would confirm strengthening bullish momentum.

Meanwhile, the RSI is trending higher and approaching overbought territory, reflecting growing buying interest. If momentum sustains, PIPPIN could test the crucial $0.50–$0.54 resistance zone. A confirmed breakout above this range may open the door for fresh highs in the coming weeks.

ZRO Price Eyes Breakout as Weekly Momentum Turns Bullish

LayerZero (ZRO) price is posting its strongest weekly candle since March 2025, signaling a clear shift in momentum. The latest surge has pushed ZRO toward the upper boundary of a descending parallel channel, a structure that has capped upside for months. While the breakout is not confirmed yet, bullish pressure is clearly building.

zro price

On the weekly chart, the price has briefly moved above the upper Bollinger Band, a sign of expanding volatility and potential breakout strength. At the same time, the RSI is trending higher without showing bearish divergence, supporting the case for continued upside momentum.

However, confirmation remains key. A decisive move above the $2.90–$3.10 resistance zone is crucial to validate a trend reversal. This range has historically acted as both support and resistance, making it a critical pivot area. Sustaining above these levels could open the door for a broader bullish phase in the coming weeks.

River (RIVER) Price Rebounds From Key Demand Zone

RIVER price has bounced strongly from the crucial $13–$14 demand zone, signaling renewed buying interest after a sharp correction from the recent highs above $45. The rebound suggests short-term selling pressure may be easing as buyers attempt to regain control.

river price

The price is now stabilizing near the $18–$19 range, which could act as immediate support if sustained. A continued push higher may bring the major resistance zone between $42 and $46 back into focus, a range that previously triggered strong rejections.

Technically, the MACD shows signs of fading bearish momentum, while the DMI indicates weakening selling strength. If volume expands with price, RIVER could attempt to build a higher low. However, losing $18 may open the door for another retest of the $13 support zone.

The Bottom Line

Overall, PIPPIN, ZRO, and RIVER prices are showing early signs of strength as Bitcoin consolidates, hinting at a short-term rotation into altcoins. PIPPIN is attempting a resistance breakout after a V-shaped recovery, ZRO is pressing against a key channel ceiling near $3, and RIVER is rebounding from a critical demand zone. While momentum indicators favor the bulls, confirmation above major resistance levels remains essential. Sustained volume expansion will determine whether this evolves into a broader altcoin breakout phase.

Bitcoin Stabilises, Yet Traders Remain Sceptical-Here’s What Next for BTC Price Rally

Why Is Bitcoin Crashing Today Analysts Say Synthetic BTC Supply Is the Real Problem

The post Bitcoin Stabilises, Yet Traders Remain Sceptical-Here’s What Next for BTC Price Rally appeared first on Coinpedia Fintech News

Bitcoin’s bounce from below $60,000 was sharp enough to shift sentiment in the short term, but the follow-through hasn’t been as convincing. After the recovery, the BTC price has moved into a sideways range and continues to struggle around the $70,000 level, failing to secure a sustained breakout despite multiple pushes higher.

What’s also noticeable is the drop in trading volume during this consolidation. Momentum has cooled, and participation appears thinner compared to the initial rebound. From a structural standpoint, Bitcoin is holding its gains, but it isn’t expanding either.

This raises a fair question: is the Bitcoin price building a base for the next leg higher, or simply pausing after a relief move?

‘Crowd’ Remains in Fear as BTC Price Traders Below $70,000

The relationship between price and sentiment is often cyclical, and the chart clearly highlights that dynamic. As shown in the Santiment chart below, crowd sentiment has slipped back into “extreme fear” territory even after Bitcoin rebounded from the sub-$60,000 lows. While price has stabilised below the $70,000 level, the positive-to-negative sentiment ratio remains heavily skewed toward caution.

btc price

Historically, the chart shows that spikes in greed, particularly when Bitcoin approached higher levels, often coincided with local tops. In contrast, periods marked by intense fear, such as the recent dip toward $60,000, have tended to appear near short-term bottoms or recovery phases. The green-circled zones reflect moments where fear dominated, yet price eventually rebounded.

At present, social volume data indicates bearish discussions outweigh bullish ones, reinforcing the idea that retail traders remain hesitant. This divergence, stabilizing price but lingering fear, suggests disbelief still dominates market psychology, and sentiment may only shift meaningfully if Bitcoin reclaims and sustains levels above key resistance.

Bitcoin Price Prediction for February 2026: Is a Move Above $75,000 Possible?

After briefly stabilizing near the $70,000 resistance, Bitcoin’s upward momentum has started to weaken, and the chart reflects that shift clearly. Price failed to sustain multiple attempts above this level and has since rolled over, slipping back toward the $67,000–$68,000 region. The rejection near resistance suggests buyers are losing control in the short term.

btc price

Volume behavior reinforces this cooling momentum. During the sharp drop toward the $60,000 zone, trading activity spiked significantly, but it has since contracted sharply. This drop in participation has compressed volatility, leaving Bitcoin stuck in a tighter range rather than building expansion strength.

Momentum indicators also lean cautiously. The RSI, after rebounding from oversold levels, is now flattening and showing signs of bearish divergence, signaling that the recovery lacks strong follow-through. Meanwhile, the CMF remains below the zero line, indicating weak capital inflows and limited accumulation.

With the price hovering just above the $59,900 support, Bitcoin is sitting on fragile ground. A decisive breakdown below this level could open the door for a renewed move under $60,000, while reclaiming $70,000 remains necessary to shift the near-term outlook back toward bullish control.

Jupiter (JUP) Price Slides Close to October 2025 Lows — Is a Rebound Forming?

JupUSD Stablecoin

The post Jupiter (JUP) Price Slides Close to October 2025 Lows — Is a Rebound Forming? appeared first on Coinpedia Fintech News

Jupiter (JUP) price has entered a make-or-break zone after months of steady decline, which is now slowly gaining attention. Currently trading around $0.1464, the crypto is down by more than 4% in the past 24 hours, and more than 90% from the highs. The chart suggests that the token has been under persistent distribution phase, which is believed to be fading. With this, the JUP price is pressing up against an area where reactions have mattered in the past. 

With volatility compressing and technicals heading towards the reversal zone, Jupiter is believed to be entering a decisive phase. Now, traders are wondering whether this consolidation will result in a rebound or begin another leg lower.

On the weekly timeframe, it shows a transition from expansion to contraction. Price previously broke down from a major supply zone between $0.55 and $0.65, an area that has since flipped into firm resistance. Since that rejection, JUP has followed a clean bearish structure, printing a sequence of lower highs and lower lows. The trading activity has steadily thinned out, suggesting waning participation often appears when a market is waiting for its next catalyst.

jup price

The RSI is hovering around 30–33, close to oversold but without a clear bullish divergence, which means downside pressure hasn’t fully burned off yet. MACD remains below the zero line and is beginning to flatten, hinting at stabilization rather than an outright reversal. Price is currently holding just above the $0.13–$0.15 demand zone, an area that previously acted as a base during early consolidation. A clean weekly close below $0.14 would weaken that structure and likely expose JUP to a deeper slide toward $0.10–$0.08, where liquidity is thinner but historically reactive.

On the upside, any bounce is likely to face resistance near $0.20–$0.24, with heavier supply waiting closer to $0.33. Only a sustained reclaim above $0.35 would meaningfully neutralize the broader bearish structure.

Jupiter (JUP) price is still in a range-to-breakdown environment, not a confirmed bottoming phase. Holding above $0.14 keeps short-term relief bounces on the table, but a loss of that level would likely accelerate downside toward $0.10.   

Why is Bitcoin Cash (BCH) Price Rising Today? Is a 25% Upside Move Taking Shape?

Why is Bitcoin Cash (BCH) Price Rising Today? Is a 25% Upside Move Taking Shape?

The post Why is Bitcoin Cash (BCH) Price Rising Today? Is a 25% Upside Move Taking Shape? appeared first on Coinpedia Fintech News

Bitcoin Cash (BCH) price is starting to move higher again after spending time trading sideways, catching the attention of the broader crypto market. The recent bounce suggests that buyers are slowly stepping back in, helping the price recover from its recent dip.

While it’s still too early to call a full breakout, the improving price action has sparked discussion about whether BCH could be setting up for a larger move. If buying momentum continues and key levels hold, a potential 25% upside may come into view — though the market will need further confirmation before that scenario plays out.

Open Interest Turns Higher After Prolonged Decline

The chart shows Bitcoin Cash open interest starting to climb again after a prolonged decline, even as the price has settled into a period of consolidation. Since late November, open interest has risen from around $300–$350 million to roughly $650–$700 million, suggesting that traders are increasingly positioning through derivatives.

bch price

What stands out is that this rise in open interest hasn’t been matched by a strong price breakout. Instead, BCH has moved sideways following its recent rally, pointing to a market that is waiting for direction rather than committing fully.

At the same time, active address counts have fallen, signaling a slowdown in on-chain activity and fewer users transacting on the network. Together, this suggests that current price stability is being supported more by leveraged positioning than fresh spot demand. While this can set the stage for a larger move, it also leaves the price more sensitive to sudden shifts in sentiment.

BCH Price Holds Key Support as Structure Remains Intact

From a price-structure perspective, Bitcoin Cash continues to hold an important technical footing. Price is respecting a multi-year ascending trendline, which has acted as reliable support through previous pullbacks and remains intact despite recent volatility. This suggests that the broader uptrend has not yet broken down.

bch price

In the near term, BCH is also defending a key support zone between $508.9 and $527.3, where buyers have repeatedly stepped in. This area aligns closely with the weekly 50-period moving average, reinforcing it as a strong demand zone rather than a short-term bounce level.

Momentum indicators are beginning to stabilize as well. The weekly RSI, after plunging toward oversold levels, is now flattening and attempting to turn higher. While confirmation is still needed, this behavior opens the door for a potential bullish divergence if the price continues to hold support.

If BCH maintains this structure, a move toward $650–$700 comes into focus, representing the next major resistance zone. A sustained breakout above that area could open room for a broader move toward $780–$800, roughly aligning with a potential 25% upside from current levels.

FAQs

Why is Bitcoin Cash price going up?

The price is stabilizing and moving higher as it holds a key multi-year support trendline, with rising open interest indicating traders are repositioning for a potential move.

Is Bitcoin Cash a good investment right now?

BCH shows stabilizing technical structure, but current activity is driven more by derivatives positioning than fresh user demand, indicating higher volatility risk for investors.

How high can Bitcoin Cash go?

If BCH breaks out, the next major resistance is $650-$700. A sustained move above that could open a path toward the $780-$800 range, depending on broader market confirmation.

BinanceCoin Price Prediction: Can This Institutional Milestone Help BNB Price Reach $1000?

BNB Price Prediction 2025–2026 Analysts See Rally Toward $1,150–$1,500

The post BinanceCoin Price Prediction: Can This Institutional Milestone Help BNB Price Reach $1000? appeared first on Coinpedia Fintech News

In the past few days, the BinanceCoin price has remained largely still without any major movements. With the reduced volume and volatility, the price has refrained from reaching the crucial resistance at $730. On the other hand, the BNB has reached an institutional milestone after the futures linked to the asset went live on the ICE Futures US, the US-based derivatives platform owned by Intercontinental Exchange. 

The launch allows regulated institutional participants, including hedge funds, banks, and professional trading firms, to gain exposure to BNB through cash-settled futures, priced using the CoinDesk BNB Benchmark Rate. This marks the first time BNB price has been made accessible through a US-regulated futures venue, placing it alongside a small group of crypto assets with institutional-grade derivatives infrastructure.

Is a Move Back to $1,000 Realistic?

The introduction of regulated futures initially supported two-way positioning, enabling both long and short exposure. As a result, their early impact tends to be felt more in trading volume and market structure than in immediate price appreciation. However, no major impact is seen with the BNB price currently, as the price is stuck below $650. The strength of the rally has dropped and has remained lower. This suggests that the price may continue to remain within an accumulated range while the volume and volatility are both squeezed to a large extent. 

bnb price

The short-term price action of BinanceCoin price shows a brief consolidation within a range. The Bollinger bands have begun to go parallel with each other, suggesting a huge drop in the voaltilty. On the other hand, the RSI remains stuck within the lower bands, and in such a case, a steep upswing may not be realistic. However, if the price manages to secure the resistance at $736, it will open the doors to enter the crucial resistance zone between $781 and $787. 

A rise above this range could push the price into the bullish range and attract a strong buying volume. However, a move back to $1000 could require additional factors that likely need to align. These include renewed spot demand, supportive conditions across the wider crypto market, continued growth in BNB ecosystem usage, and greater regulatory clarity around Binance-linked assets. 

The Bottom Line

Viewed in context, the launch of BNB futures on ICE Futures US represents a credibility and maturity milestone, rather than a short-term price catalyst. It signals that the BNB price is increasingly being treated as an asset that institutions want the ability to hedge and trade within regulated markets.

While this shift may support BNB’s long-term outlook, price recovery will ultimately depend on broader market dynamics and sustained demand — not derivatives access alone.

Bitcoin Sell-Off Eases as Institutional Buying Emerges: Is a BTC Price Rally On the Cards?

Bitcoin Price Analysis Could BTC Surge Above $100K Next Week

The post Bitcoin Sell-Off Eases as Institutional Buying Emerges: Is a BTC Price Rally On the Cards? appeared first on Coinpedia Fintech News

Bitcoin’s recent sell-off appears to be losing momentum as signs of institutional buying begin to surface across the market. After weeks of sustained downside pressure, selling intensity has moderated, and price action is showing early signs of stabilisation near key support levels. 

At the same time, market data points to large investors quietly building positions at lower prices, even as overall sentiment remains cautious. While it is still too early to call a full trend reversal, the change in market behavior has raised an important question: Is Bitcoin (BTC) price setting the stage for a short-term recovery, or simply taking a breather before its next move?

Institutional Accumulation Begins to Pick Up

The chart shows a clear pickup in Bitcoin inflows to accumulation addresses over the past few weeks. After spending much of the recent correction near relatively muted levels, daily inflows have surged sharply, with several spikes moving above 15,000 BTC, and recent peaks approaching the 20,000 BTC mark.

bitcoin price

What’s notable is that this rise in accumulation is happening while Bitcoin’s price remains well below recent highs. Historically, similar bursts of inflows have tended to appear when selling pressure starts to ease and long-term investors step in during periods of uncertainty. While this doesn’t guarantee an immediate rebound, it does suggest that larger players are becoming more active at current levels.

That said, accumulation alone is not a confirmation signal. For Bitcoin to transition into a sustained recovery, these elevated inflows would need to persist and be accompanied by an improving price structure and follow-through demand across the market.

Has Whale Accumulation Impacted Price Action?

Despite the recent increase in whale and long-term holder accumulation, Bitcoin’s price response has so far remained muted and structurally weak.

On the daily chart, BTC is trading around $69,300, sitting just above the 0.236 Fibonacci retracement at $69,014, which has acted as short-term support following the sharp sell-off. The bounce from the recent low near $60,074 (0 Fib) shows that buyers did step in aggressively, but follow-through has been limited.

bitcoin price

The RSI is hovering around 32–34, still in bearish territory and only marginally recovering from oversold conditions. Besides, MACD remains deeply negative, with the histogram expanding to the downside, indicating that downside momentum has slowed but has not yet reversed. This suggests that while whale accumulation may have helped establish a temporary price floor near $60K, it has not yet translated into sustained upside momentum.

Key Levels to Watch Next

For accumulation to meaningfully impact price action, Bitcoin needs to reclaim higher technical levels:

  • Immediate resistance: $74,500–$75,000- A daily close above this zone would signal improving short-term structure and confirm that buyers are gaining control.
  • Bullish confirmation zone: $79,000–$80,000- A move into this range would indicate that the recent sell-off was corrective rather than the start of a deeper downtrend.
  • Downside risk: Failure to hold $69,000 increases the risk of a retest of the $60,000–$62,000 demand zone, where the strongest buying response was last seen.

Conclusion: What Traders Need to Watch?

Whale accumulation appears to be absorbing downside pressure, but Bitcoin’s price action still points to consolidation rather than a confirmed reversal. After rebounding from the $60,000–$62,000 zone, BTC is holding near $69,000, suggesting sellers have slowed but buyers have yet to take control.

As long as the Bitcoin (BTC) price remains below $74,500, upside moves are likely to stay corrective. A break above this level would improve the outlook and open room toward $79,000–$80,000, while a loss of $69,000 would put the $60,000–$62,000support area back in focus.

XRP SOPR Turns Negative as Holders Realise Losses—Is the Price at Risk of Slipping Below the $1?

Top XRP Price Predictions

The post XRP SOPR Turns Negative as Holders Realise Losses—Is the Price at Risk of Slipping Below the $1? appeared first on Coinpedia Fintech News

XRP has returned to focus as recent price weakness coincides with a noticeable shift in on-chain behavior. The token is currently trading in a very tight range, with both volume and volatility compressing significantly. At the same time, on-chain data indicates that a growing number of market participants are selling XRP at a loss. This combination of muted price action and rising holder stress has raised concerns about the near-term outlook, keeping the $1 level in focus as traders assess the risk of further downside.

XRP SOPR Turns Negative, Signalling Loss-Driven Selling

The on-chain data from Glassnode shows clear signs of stress among XRP holders. The Spent Output Profit Ratio (SOPR) has dropped below the key 1.0 level, which means that, on average, XRP is now being sold at prices lower than where it was bought. The 7-day average SOPR has dropped from around 1.16 in mid-2025 to about 0.96, highlighting a steady increase in loss-driven selling.

xrp price

Historically, this kind of setup has appeared during periods of heavy pressure rather than during strong trends. A similar pattern played out between September 2021 and May 2022, when XRP spent months consolidating after holders absorbed losses. While a negative SOPR does not guarantee an immediate recovery, it often suggests that much of the emotional selling is already underway, a phase that can eventually lead to stabilization once selling pressure begins to fade.

Will XRP Price Drop Below $1 And Keep Grinding?

XRP price has struggled to deliver any meaningful upside since July 2025, when the price was rejected from its all-time high. Since then, the weekly structure has remained weak, marked by a steady sequence of lower highs and lower lows, reflecting sustained bearish control. More recently, however, price action has slowed considerably, with both buyers and sellers showing little urgency. This pause suggests XRP may either be entering a prolonged consolidation phase or quietly building toward a larger move.

xrp price

From a broader perspective, the weekly structure shows limited demand until the $0.50 region, a zone where buyers previously stepped in aggressively. Adding to this, open interest has been declining alongside price, indicating traders are closing positions rather than aggressively shorting. This behavior often appears in the later stages of a bearish trend, when selling pressure begins to fade. With positioning thinning out, XRP is more likely to drift sideways or grind slowly rather than see a sharp continuation lower in the near term.

What’s Next for XRP Price?

XRP price remains in a wait-and-watch phase as long as the price holds above the $1.00 psychological zone. A sustained breakdown below this level could open the door for a deeper move toward $0.75, with $0.50 standing out as the next major demand area where buyers previously stepped in aggressively. On the upside, bulls would need a clear weekly reclaim above $1.25–$1.30 to signal improving structure and shift momentum toward $1.50. Until then, thinning open interest and muted volatility suggest consolidation or a slow grind is more likely than a sharp trend move.

Solana (SOL) Price Breaks Key Support—Is $50 the Next Level to Watch?

SOL Price Tests Critical Support Amid XRP’s Expanding Cross-Chain Liquidity

The post Solana (SOL) Price Breaks Key Support—Is $50 the Next Level to Watch? appeared first on Coinpedia Fintech News

Solana price saw a sharp pullback at the start of the month, with the price sliding to a low near $67.48. Since then, the recovery has looked fragile. After losing an important support zone, SOL has moved into a weaker position, allowing sellers to regain control. Buyers tried to steady the price during the consolidation phase, but the lack of strong follow-through has kept downside risks alive, shifting focus toward the $50 area as the next key support.

The move has closely followed Bitcoin’s recent breakdown below a major psychological level. While Ethereum and XRP managed to defend their supports, Solana struggled to build momentum after its bounce, raising concerns that the current setup could still open the door to a deeper pullback.

Big Players Step Back From Solana

Since their launch, Solana ETFs have largely recorded consistent net inflows, with outflows remaining limited and short-lived. However, the chart above highlights a clear shift in that trend. There have been a few instances where outflows briefly overtook inflows, signalling cooling institutional interest, and the latest data points to one of the most notable moves so far.

solana price

According to Santiment, Solana ETFs recently saw nearly $11.9 million in net outflows, marking the second-largest outflow day on record, trailing only December 2025. This comes at a time when SOL has already shed over 62% of its market capitalization in the past four months, reinforcing the view that institutional sentiment has weakened alongside price.

Historically, sharp ETF outflows during extended downtrends have often coincided with late-stage selling or capitulation, rather than the start of fresh declines. While this does not confirm a bottom, the scale of the outflow suggests traders are becoming increasingly cautious, a dynamic that has, in past cycles, preceded periods of stabilization once selling pressure begins to exhaust.

Is Solana (SOL) Price Heading to $50?

Selling pressure has picked up again on Solana’s weekly chart, even after a brief rebound attempt. As the chart shows, buyers failed to deliver sustained follow-through, keeping SOL capped below key resistance zones. Last week’s sharp spike in trading volume triggered heightened volatility, but with volume now cooling and price stuck in a tight range, momentum has clearly weakened.

solana price

More importantly, the weekly Gaussian Channel has flipped bearish, signaling that SOL may have entered a broader downtrend phase rather than a short-lived correction. This shift aligns with the confirmed breakdown of a head-and-shoulders pattern on the weekly timeframe, a structure that often precedes extended downside if price fails to reclaim lost levels.

On a slightly constructive note, the weekly RSI appears to have bottomed and is attempting a rebound, suggesting selling pressure may be slowing. However, until momentum improves and price reclaims key resistance levels, the broader setup continues to favor caution, keeping the risk of further downside open as the month progresses.

The Bottom Line

Solana remains in a fragile position as long as the price stays below the $105–$110 resistance zone. Failure to reclaim this range could keep downside pressure intact, opening the door for a move toward $77–$75, where short-term demand may attempt to slow the decline. A deeper breakdown would bring the $50–$55 region into focus, aligning with historical support. 

On the upside, bulls need a strong weekly close back above $115 to invalidate the bearish setup and shift momentum toward $135–$150. Until then, risk remains skewed to the downside.

❌