The ADA price might not always react to governance edits or backend integrations, but beneath the surface, Cardano is stacking infrastructure at a serious pace. While traders obsess over the ADA/USD pair and short-term volatility, the ecosystem is quietly expanding its technical footprint. And not all of that work makes headlines.
The Quiet Builders Behind Cardano
Cardano’s ecosystem often gets attention for launches, debates, and big roadmap promises. But as highlighted recently, much of the heavy lifting happens out of sight. The CIP (Cardano Improvement Proposal) process, which shapes technical standards across the network, has reportedly been pushed forward this year through relentless editing, review cycles, coordination, and detail-oriented revisions.
It’s unglamorous work. Typos fixed. Drafts cleaned up. Proposals nudged across the finish line. Yet without that stewardship, the broader Cardano machine doesn’t function smoothly. Infrastructure maturity rarely shows up directly on the ADA price chart, but it lays the groundwork for long-term ecosystem stability.
XRP and Cross-Chain Conversations
Meanwhile, the ecosystem narrative is widening. As discussions around potential $XRP integration into Cardano’s DeFi landscape are now circulating publicly. The idea centers on interoperability, so that it can act as a bridge between ecosystems rather than competition between them.
Cardano founder Charles Hoskinson discusses exploring $XRP integration possibilities within Cardano’s DeFi landscape.
A potential bridge between ecosystems, positive signal for broader blockchain interoperability. pic.twitter.com/KSkl69bxlO
If such integration materializes, it would signal a broader strategic posture: Cardano positioning itself as connective tissue in a multi-chain future. For ADA price prediction discussions, that kind of interoperability theme often feeds longer-term speculation, though tangible impact depends on execution and adoption.
But that’s not the only cross-chain move in play.
LayerZero and Omnichain Expansion
One of the most significant updates comes from the approval of a major interoperability integration: LayerZero joining the ecosystem. LayerZero is described as one of Web3’s most adopted omnichain messaging protocols, linking 150+ blockchains and enabling access to 400+ tokens and more than $80 billion in omnichain assets.
That’s scale. The integration is framed as the largest cross-chain connectivity expansion in Cardano’s history, opening doors to stablecoin liquidity, tokenized real-world assets, and shared DeFi infrastructure across networks. Delivery now moves into deployment, with milestones expected as progress continues.
BREAKING NEWS
CARDANO IS GOING POST-QUANTUM WITH GOOGLE & MICROSOFT@IOHK_Charles says Cardano is working alongside Google, Linux, and Microsoft Research on Nightstream, a cutting-edge post-quantum cryptography project.
At the same time, Cardano is reportedly collaborating with Google, Linux, and Microsoft Research on a post-quantum cryptography initiative called Nightstream. Built on lattice-based cryptography, it’s designed to be quantum-resistant and AI hardware compatible, this is a long-horizon play that signals technical ambition beyond current market cycles.
In the short term, infrastructure milestones don’t guarantee immediate reactions on the ADA/USD chart. But steady interoperability expansion, governance maturation, and research-level partnerships collectively reshape how ADA price is evaluated in long-term positioning conversations.
The Bitcoin price is once again sitting in “Extreme Fear.” Historically, that label has marked some of the best accumulation zones the market has ever seen. But 2026 isn’t seeing one particular event based crash. And the structure behind current selloff looks very different.
Let’s rewind. Back in 2012, price collapsed to $7.10. During the Mt. Gox crisis, it dropped to $421.55. The 2017–2018 crash bottomed at $3,129.39. The COVID panic low came in at $3,852.65. Then the FTX-driven washout pushed price to $15,642.12. Each of those moments coincided with extreme fear readings. Each time, institutional interest was minimal, and government support was nonexistent, and retail capitulation defined the mood. And eventually, rallies followed.
Extreme Fear Then and Now
Fast forward to the 2026 crash. A low of $60,001.01 on Coinbase has printed in February while sentiment sits in the same “Extreme Fear” zone.
On paper, that sounds familiar. Historically, fear extremes have aligned with major bottoms on the Bitcoin price chart. But here’s the complication: the market today is saturated with institutional flows, ETF structures, and macro-driven liquidity cycles.
This isn’t just retail panic anymore. The fear and greed index may reflect retail sentiment, but in a market increasingly influenced by ETF sponsors and large capital allocators, that dial might not be accurate this time.
ETFs and Macro Pressure
Well, here’s the reason why a dip has more odds. If institutions tend to scale in at discounted levels, the indicator could simply be lagging liquidation events rather than signaling recovery. In other words, extreme fear might just be a snapshot of damage already done and its not confirmation that selling pressure has ended.
Macro-driven selloffs also muddy the picture. BTC/USD doesn’t move in isolation when broader markets tighten. Risk-off environments can override sentiment-based signals, especially if forced liquidations are still unfolding.
Historically, the most powerful accumulation phases began when even dip-buyers went quiet. We’re approaching that disbelief phase, but whether it’s fully played out is another question.
Whale Activity Adds Pressure
And then there’s whale activity. A prominent known whale wallet recently deposited another 5,000 $BTC thats worth $348.82 million into Binance. Large inflows to exchanges often precede potential distribution. That doesn’t guarantee selling, but it adds supply-side uncertainty at a fragile moment.
Bitcoin just reclaimed $70,000 — but Garrett Jin(#BitcoinOG1011short) is selling again!
Extreme fear alone isn’t a timing tool. Until forced liquidations ease and spot demand absorbs supply without heavy reliance on sentiment gauges, the Bitcoin price remains vulnerable to another leg lower beneath $60K even if history suggests these zones eventually become accumulation opportunities.
XRP price currently stands at $2.99, with a market capitalization of $179.79 billion. Analysts and AI forecasts alike suggest that XRP could reach $5.05 by the end of 2025. Long-term XRP price predictions also place it as high as $26.50 by 2030, with an ultra-bullish target of $526 by 2050.
Ripple (XRP) remains one of the top five crypto assets in the world, gaining traction as institutional adoption ramps up and its prolonged legal battle approaches resolution. Since President Trump’s return to office, XRP has seen a resurgence in on-chain activity, investor sentiment, and even XRP ETF approved turned it into a bluechip asset.
Now, making this the most ideal time for XRP price prediction 2026-2030 to be in more focus. Read this to know in depth what’s coming next in XRP.
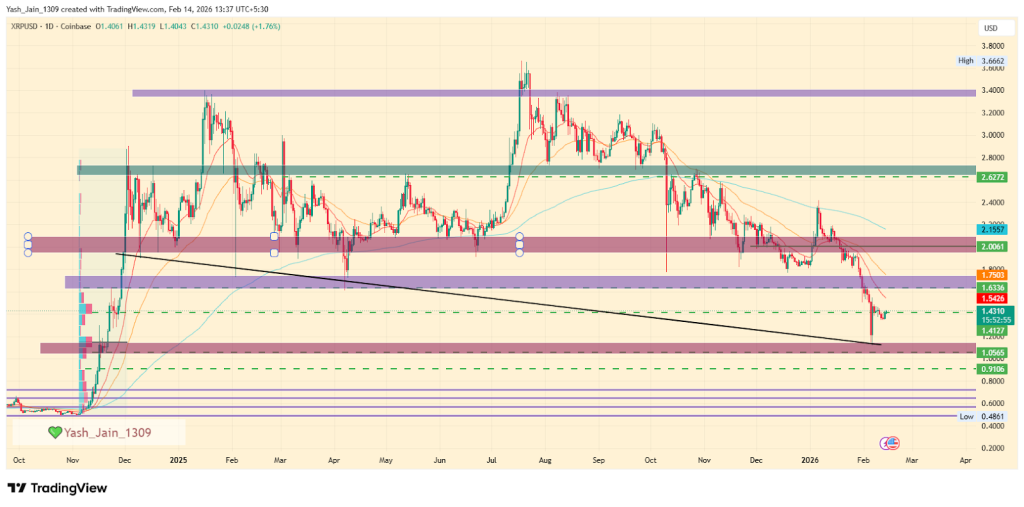
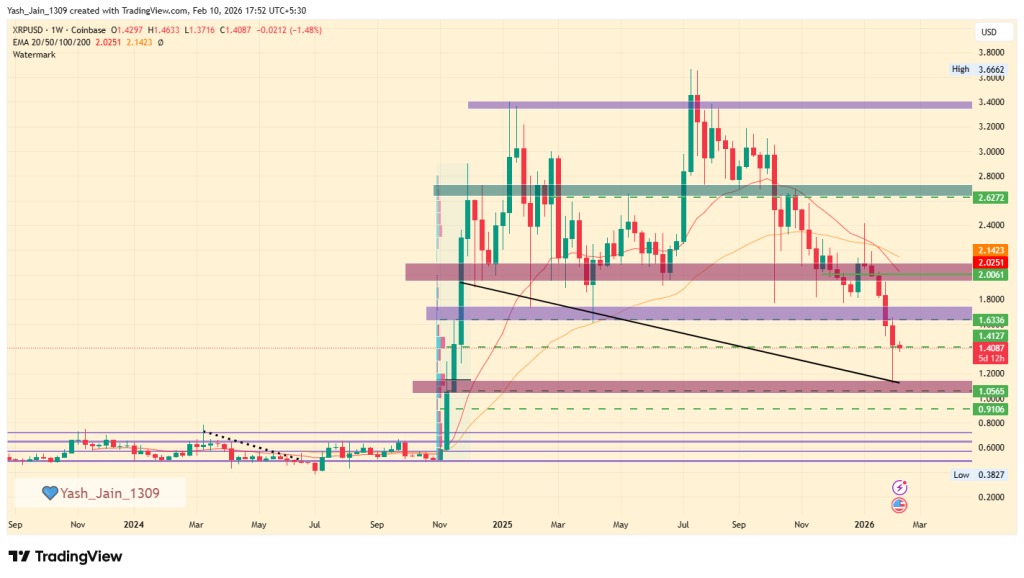
XRP has dropped to $1.15, testing demand from late Q4 2024. If it breaks above $1.63, it might rise to $2.00 or $2.62. If not, it could fall to $1.00 and consolidate there in Q1 2026.
XRP Price Prediction For February 2026
In February, a long-term declining trendline was retested, leading to a significant increase from a monthly low of $1.15, which indicates a rise in demand.
The direction for the remainder of February will depend on whether the XRP price can break through the resistance level of $1.63. If it gains momentum, the next key resistance levels to watch are $1.75 and $2.00. On the other hand, if the price declines, the $1.00 level will act as an important support level.
XRP Price Prediction 2026
On the weekly chart, XRP’s price shows significant weakness, falling to $1.15, which retests the demand area established in late Q4 2024. However, early February saw a quick reversal from this short-term demand level.
If the price continues to recover and manages to surpass $1.63, the uptrend could continue toward $2.00 or even $2.62 in Q1 2026. On the other hand, if $1.63 acts as resistance and the price reverses, we can expect a decline to $1.00, with Q1 possibly spent consolidating around the $1.00 level.
Year
Potential Low
Potential Average
Potential High
2026
$1.75
$3.45
$5.05
XRP Onchain Outlook
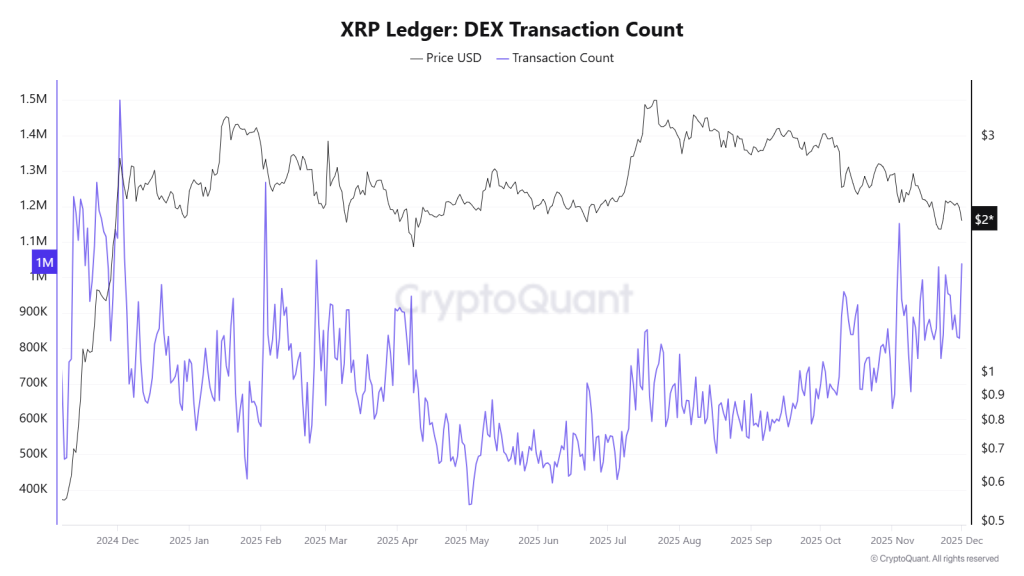
The XRP Ledger: DEX Transaction Count chart indicates a significant bullish divergence starting from May 2025. While the price is consolidating, the activity in decentralised exchanges (DEX) is increasing sharply.
The high transaction volume, which includes both orders placed and cancelled, shows that experienced traders are actively positioning themselves and adding liquidity in anticipation of a future price movement.
As a result, this on-chain metric suggests that the market is preparing for a powerful and sustainable rally in the XRP price ahead.
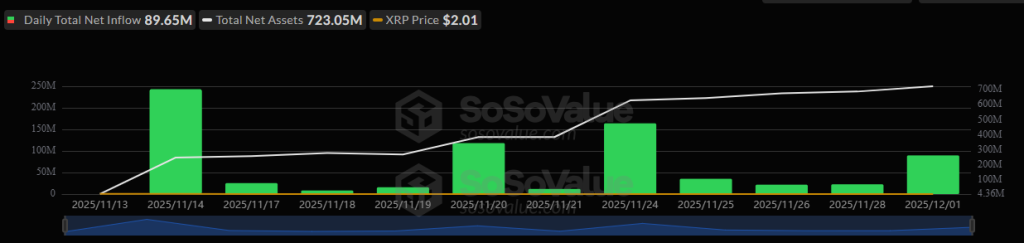
Also, the biggest fact right now in December is that altcoin liquidity is drying up. Projects securing new liquidity channels like ETFs have a better chance of long-term survival, and since November 14th, the XRP ETF has been seeing positive inflows consistently, despite what price action is, and so far, Cumulative Total Net Inflow has crossed $756 million, while total net assets are worth $723.05 million, by December 1st.
Ripple XRP Price Prediction 2026 – 2030
Year
Potential Low ($)
Potential Average ($)
Potential High ($)
XRP Price Prediction 2026
5.50
6.25
8.50
Ripple Price Prediction 2027
7.00
9.0
13.25
XRP Price Prediction 2028
11.25
13.75
16.00
XRP Price Prediction 2029
14.25
16.50
21.50
XRP Price Prediction 2030
17.00
19.75
26.50
This table, based on historical movements, shows XRP price prediction 2030 to reach $26.50 based on compounding market cap each year. This table provides a framework for understanding the potential XRP price movements. Yet, the actual price will depend on a combination of market dynamics, investor behavior, and external factors influencing the cryptocurrency landscape.
Based on historic price sentiments and XRP’s rising popularity, here are the XRP future price projections beyond 2030, where Ripple price forecasts suggest that it has become more speculative. Therefore, assuming continued adoption and dominance, XRP may see aggressive valuations in the decades ahead.
Year
Potential Low ($)
Potential Average ($)
Potential High ($)
2031
25.00
29.50
35.25
2032
31.50
36.75
41.25
2033
35.75
42.25
47.75
2040
97.50
135.50
179.00
2050
219.25
331.50
526.00
A look at this table, highlights the XRP price prediction 2040 and XRP price prediction 2050 potential high ambitious targets but this reflect a transformative vision for XRP as a dominant global payment player.
Market Analysis
Firm Name
2025
2026
2030
Changelly
$2.05
$3.49
$17.76
Coincodex
$2.38
$1.83
$1.66
Binance
$2.16
$2.27
$2.76
Never Miss a Beat in the Crypto World!
Stay ahead with breaking news, expert analysis, and real-time updates on the latest trends in Bitcoin, altcoins, DeFi, NFTs, and more.
FAQs
What is the XRP price prediction for 2026?
Analysts estimate XRP could trade between $1.75 and $5.05 in 2026, depending on ETF inflows, adoption growth, and overall crypto market momentum.
What is the XRP price prediction for 2030?
XRP price predictions for 2030 range from $17 to $26.50 if adoption, ETF growth, and crypto market expansion continue steadily.
How much will 1 XRP be worth in 2040?
By 2040, forecasts suggest XRP could trade between $97 and $179 if global payment adoption and institutional demand expand significantly.
Is XRP a good long-term investment?
XRP may suit long-term investors who believe in cross-border payment adoption and regulatory clarity, but price volatility remains a key risk.
What factors could drive XRP price higher?
ETF inflows, Ripple network expansion, legal clarity, and rising on-chain activity are major factors that could support higher XRP prices.
Bitcoin is currently trading at: $ 69,824.78791785
Predictions suggest BTC to hit $150K to $250K before 2026 ends.
Long-term forecasts estimate BTC prices could hit $900K by 2030.
After a historic 2025 that saw Bitcoin shatter records and flip the legendary $125,000 mark, the market has taken a sharp, cooling turn. The early weeks of 2026 have been defined by a “sell-the-news” reality check, leaving many to wonder if the bull run has finally run out of steam or if we are simply witnessing the ultimate “buy the dip” opportunity.
The landscape has shifted. With a pro-crypto administration in the White House and institutional giants like MicroStrategy and Metaplanet treating BTC as a foundational reserve asset, the rules of the game have changed. No longer just a speculative play for retail traders, Bitcoin is now a geopolitical chess piece and a corporate balance sheet staple.
But as the price tests crucial support levels, the big question remains: Is this a temporary correction before a march toward $200,000, or the start of a long-term reset?
In this deep dive, we break down the Bitcoin price prediction for 2026–2030, exploring the massive trends, regulatory shifts, and institutional moves driving this historic cycle. If you want to know where the floor is and how high the ceiling goes. read on for the full scoop.
Coinpedia’s BTC Price Prediction 2026
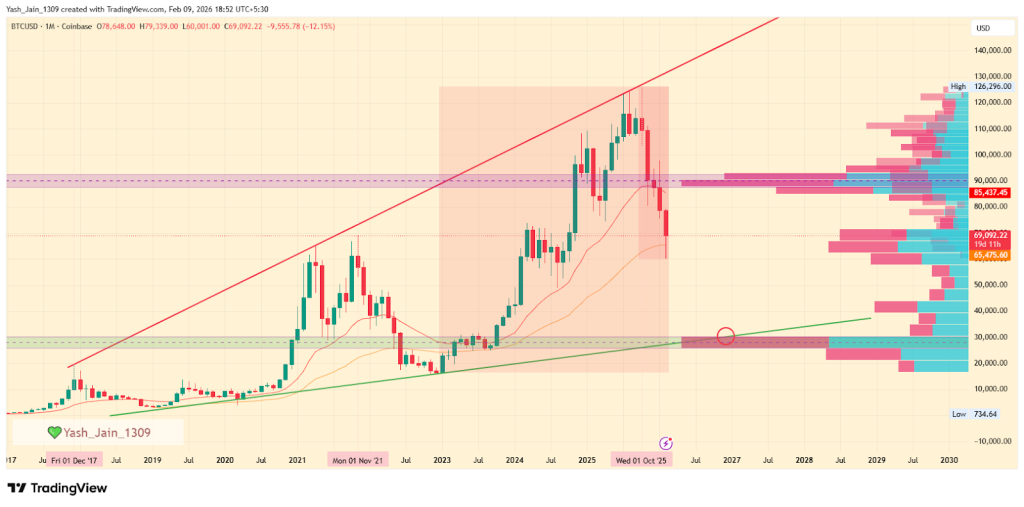
In early 2026, Bitcoin is in a correction phase after peaking at around $126,296 in October 2025. A potential bottom may occur around December 2026, with significant support expected between $25,900 and $30,350. Historical trends suggest this decline could reach 70%-76%, potentially bringing Bitcoin down to the lower border of the ascending broadening wedge’s support. This period may mark the end of the bear market, with 426 days in total, similar to historical correction periods, and pave the way for a rally in the next year.
What is the Bitcoin price prediction for today?
The BTC price may range between $66,571.61 and $69,665.79 today.
As of mid-February 2026, Bitcoin price is hovering near $70,000 after experiencing a sharp drop from the late January level of around $90,000. In the short term, the $60,000 support level is crucial in preventing BTC from seeking lower areas.
So far, several key levels have been breached, prompting traders to wait for a clear indication of a short-term bottom before making larger bets. Overall, market sentiment clearly appears shaky, leaning more toward the bearish side. The Crypto Fear and Greed Index remains in the Extreme Fear zone, and Bitcoin ETFs have not getting enough inflows since September 2025.
Additionally, the 50-day EMA is currently below the 200-day EMA, indicating that the death cross signal has been in effect since mid-November. A short-term death cross between the 20-day and 50-day EMA bands occurred in late January, further confirming the prevailing bearish trend.
As a result, traders are now looking at the $60,000-$65,000 range as the next line of support. If this level is breached, it could trigger forced selling. February has started off choppy, and this volatility may continue until buyers return in significant numbers. If they do, the first target for February will be $74,750, with a second target of $84,900 in the short term.
While the bearish structure remains dominant, a shift toward a bullish trend will depend on overcoming the $95,700 level of the 200-day EMA. Until that happens, the overall market outlook remains bearish.
Bitcoin Price Prediction 2026
The current price action in early 2026 confirms that Bitcoin price is following a well-defined historical rhythm within its long-term ascending wedge. After reaching a peak of approximately $126,296 in October 2025, the market has entered a significant correction phase.
This peak was not accidental; it represented a direct hit on the upper resistance boundary of the wedge pattern that has governed Bitcoin’s macro price action for years. Historically, these touches lead to extended periods of decline the first major crash from $21,000 lasted 427 days, while the second from $69,000 lasted 426 days. If this 14-month corrective cycle holds true, we are looking at a “target date” for a definitive bottom around December 2026.
The intensity of the sell-off in February 2026 was largely driven by a failure to reclaim the $87,800–$92,950 supply range. According to the anchored volume profile, this zone represented the highest momentum area of the previous bearish move, and once it flipped from support to resistance, the downward pressure has accelerated. Since markets don’t go straight, there will be attempts to rise, but the likelihood is high that they will occur in the future as fakeouts and result in further decline.
As we look toward the remainder of 2026, the charts suggest that the most significant high-momentum demand area sits much lower, specifically between $25,900 and $30,350.
This range represents a crucial “interest zone” where institutional buyers previously stepped in and where the lower support of the ascending wedge is likely to converge by year-end.
Statistically, Bitcoin’s major crashes have shown a trend of diminishing returns in terms of percentage drawdowns. The late 2017 onwards crash saw an 87.25% decline, and the 2022 crash reached 78.65%. Following this trajectory of “dampening volatility,” the current third crash is projected to result in a 70%-76% approx decline. From the $126,000 ATH, a 76% correction would push the price toward that critical $30,000 region.
Consequently, the prediction for December 2026 is a final test of the wedge’s lower border within this demand zone, marking the end of the current bear cycle and setting the stage for the next period of accumulation and next big rally could occur in 2027 onwards.
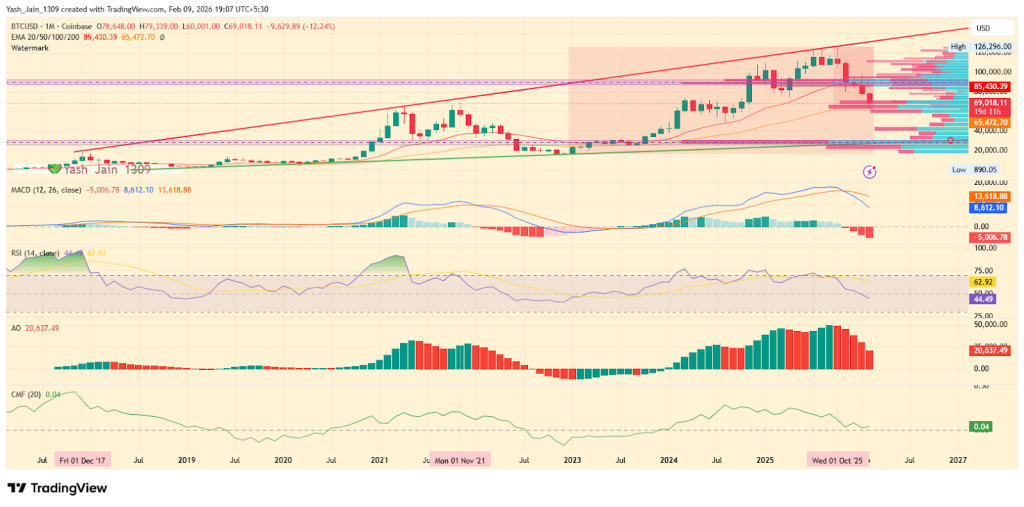
BTC Price Indicator Analysis 2026
Similarly, the technical indicators shows that Bitcoin price has already entered a danger zone we haven’t seen in years. On a deeper look at the monthly RSI, BTC has a legendary track record of never hitting “oversold” levels; it usually bottoms out right around the 40 mark. Right now, we’re sitting at 44.49 and sliding fast. This isn’t just a dip it’s the classic signal that the bearish momentum is finally taking over and heading for that historical floor.
The indicators under the hood are screaming the same thing. The MACD has already locked in a bearish cross, and the gap between the lines is widening. In past crashes, the selling hasn’t stopped until those lines flattened out near the zero mark. We aren’t even close to that “exhaustion” point yet, meaning there is plenty of room for this to bleed out further.
Even the “smart money” indicator (CMF) is still showing positive inflows for now, but that’s actually the scary part. Once that green line snaps below zero and heads toward -0.20, that’s when the real panic hits. We aren’t at the end of the crash; we’re in the middle of it. Don’t mistake this for exhaustion, as the collapse toward the pattern’s lower border would soon intensify.
Month
Potential Low
Potential Average
Potential High
2026
$30,000-$45,000
$90,000 – $101,000
$115,000 – $118,000
Bitcoin Price On-chain Outlook
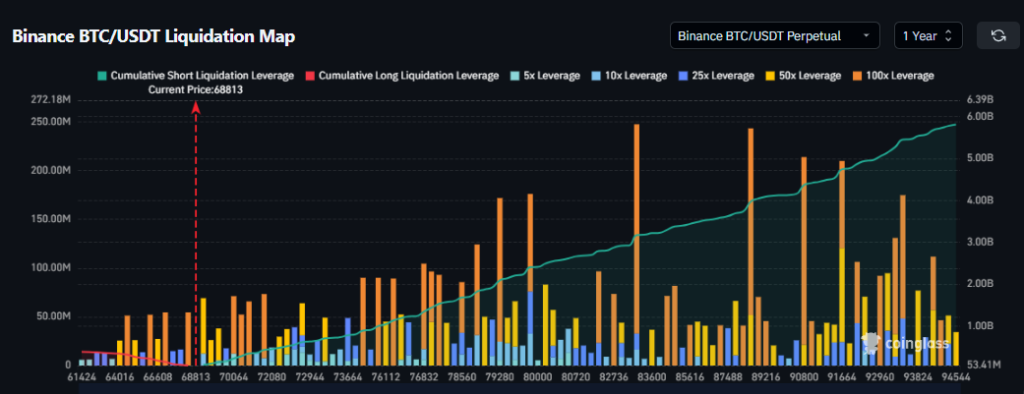
Liquidation data shows roughly $5.81 billion on the short side, compared with just over $380 million on the long side. That imbalance matters because it’s completely dominated by bears and bulls, with no room for survival. It suggests traders are leaning into weakness rather than preparing for a sustained rebound.
In other words, the futures market isn’t buying the bounce. It’s betting against it.
And if BTC price drifts lower again, that heavy short positioning could amplify volatility rather than cushion it. This is why any BTC price prediction right now carries asymmetric risk.
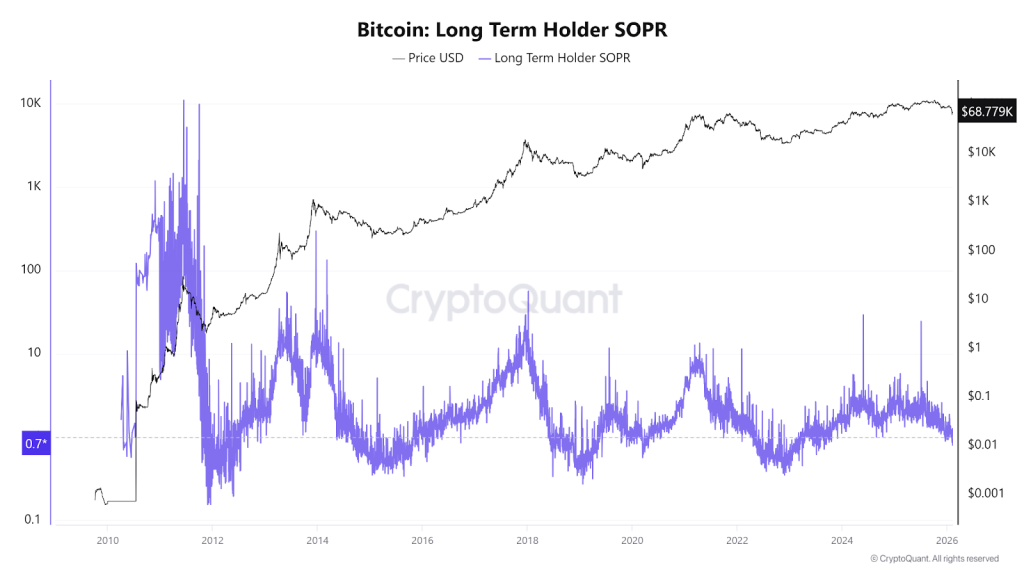
Moreover, the BTC long-term holder SOPR chart shows a current value of 0.7, which is below 1, indicating that more long-term investors are selling at a loss. And it’s seen when more holders keep selling at a loss, this metric has a history of hitting the 0.2-0.3 mark, which has truly seen a fresh demand. For now, the long-term trend is more bearish.
Recent Events Affecting Bitcoin’s Price
The transition from late 2025 into early 2026 saw Bitcoin flip from a booming success story into a struggling “bear market.” After hitting its peak in October, the excitement cooled off fast as the fundamental pillars holding up the price began to crumble at the same time.
By December, the “cheap money” era felt officially over. The Federal Reserve confirmed that high interest rates weren’t going anywhere, and the nomination of Kevin Warsh to replace Jerome Powell signaled a shift toward even tighter financial discipline. This left investors spooked, fearing a future without the safety net of central bank support.
The situation worsened in January when big institutional players started pulling their money out of spot ETFs to lock in profits. At the same time, rising tensions between the U.S. and Iran proved that Bitcoin isn’t yet seen as a “safe haven” but investors ditched crypto for actual gold to avoid the risk.
Finally, a “double blow” of bad news drained what was left of the market’s momentum. Crucial crypto legislation, the CLARITY Act, got stuck in the Senate, leaving the industry in legal limbo. Meanwhile, new fears about quantum computing threats to blockchain security started to circulate. Together, these events broke the market’s confidence, pushing the price toward the lower end of its long-term trend.
Bitcoin Crypto Price Prediction 2026 – 2030
Year
Potential Low ($)
Potential Average ($)
Potential High ($)
BTC Price Forecast 2026
150K
200K
230K
BTC Price Prediction 2027
170K
250K
330K
Bitcoin Predictions 2028
200K
350K
450K
BTC Price 2029
275K
500K
640K
Bitcoin Price Prediction 2030
380K
750K
900K
BTC Price Forecast 2026
The BTC price range in 2026 is expected to be between $150K and $230K.
BTC Price Prediction 2027
Subsequently, the Bitcoin price range can be between $170K to $330K during the year 2027.
Bitcoin Predictions 2028
With the next Bitcoin halving, the price will see another bullish spark in 2028. Specifically, as per our Bitcoin Price Prediction, the potential BTC price range in 2028 is $200K to $450K.
BTC Price 2029
Thereafter, the BTC price for the year 2029 could range between $275K and $640K.
Bitcoin Price Prediction 2030
Finally, in 2030, the price of Bitcoin is predicted to maintain a positive trend. Indeed, the BTC price is expected to reach a new all-time high, ranging between $380K and $900K.
Based on the historic market sentiments and trend analysis of the largest cryptocurrency by market capitalization, here are the possible Bitcoin price targets for the longer time frames.
Year
Potential Low ($)
Potential Average ($)
Potential High ($)
2031
$540,830.43
$901,383.47
$1,261,936.86
2032
$757,162.60
$1,261,936.86
$1,766,711.60
2033
$1,059,945.80
$1,766,711.60
$2,473,477.75
2040
$5,799,454.28
$9,665,757.13
$13,532,059.98
2050
$161,978,188.65
$269,963,647.74
$377,949,106.84
Bitcoin Prediction: Analysts and Influencers’ BTC Price Target
“Jack Dorsey, former Twitter CEO (now X), predicts Bitcoin could exceed $1 million by 2030 due to its ecosystem growth and increasing adoption.”
Cathie Wood, CEO of Ark Invest, projects Bitcoin to reach $1.5 million by 2030, driven by institutional adoption and its position as digital gold.”
“Wall Street broker Bernstein believes 2026 will mark the start of a tokenization “supercycle,” maintaining its $150,000 Bitcoin price target for this year and $200,000 for the 2027 cycle peak.”
“Brad Garlinghouse, the Ripple CEO, predicts Bitcoin will hit $180,000 in 2026, due to favorable market and regulatory conditions.”
Never Miss a Beat in the Crypto World!
Stay ahead with breaking news, expert analysis, and real-time updates on the latest trends in Bitcoin, altcoins, DeFi, NFTs, and more.
FAQs
What are the biggest risks to Bitcoin’s price in 2026?
Major risks include global recessions, tighter crypto regulations, declining liquidity, or a sustained breakdown below key support levels.
How much will BTC be worth in 2030?
Bitcoin price forecasts for 2030 range from $380K to $900K, driven by scarcity, long-term adoption, and expanding institutional participation.
What will be the price of Bitcoin in 2050?
While uncertain, many long-term projections suggest Bitcoin could exceed $1 million by 2050 if it becomes a global store of value.
Is Bitcoin still a good hedge against inflation in the long term?
Bitcoin’s fixed supply makes it attractive as an inflation hedge, especially during currency debasement and long-term economic uncertainty.
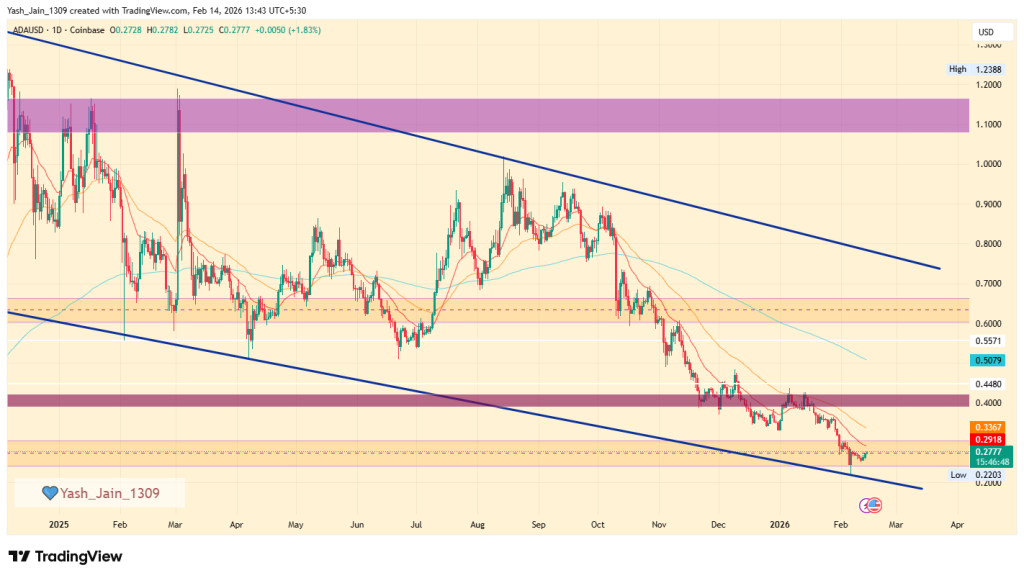
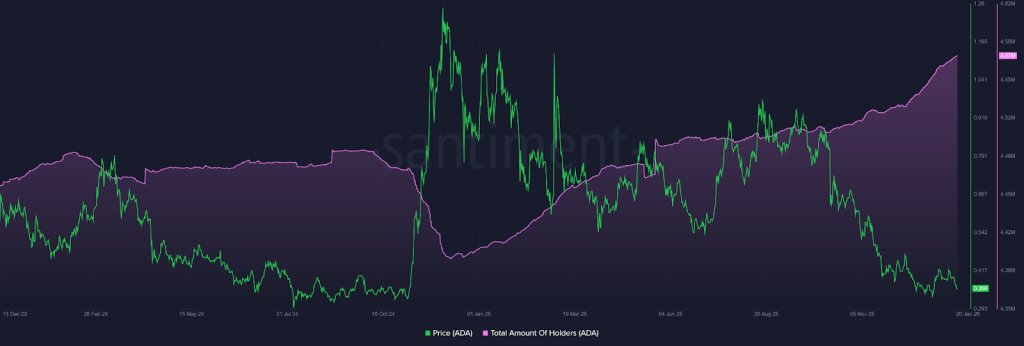
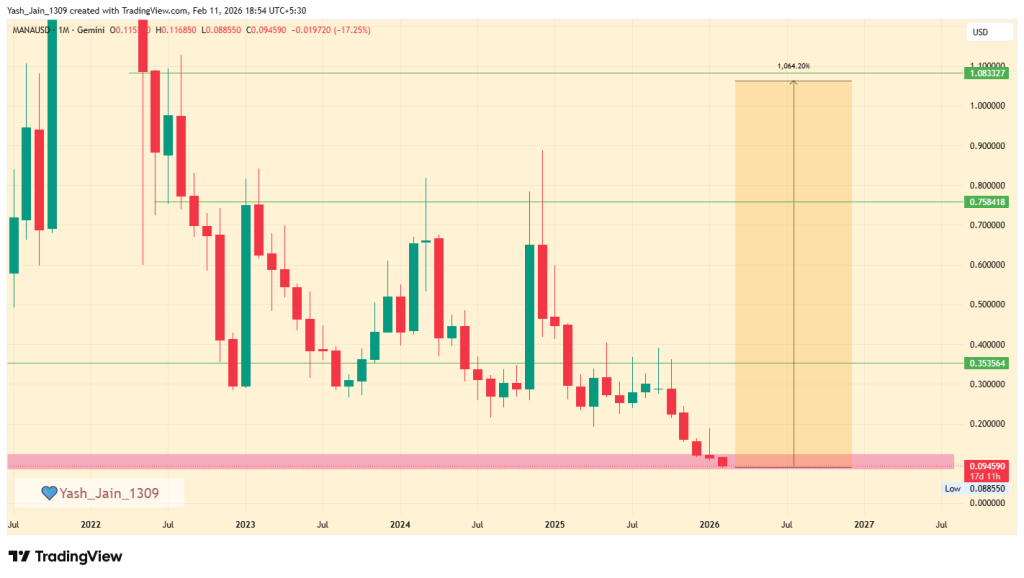
The live price of the Cardano token is $ 0.27932615.
Price prediction suggests potential to reach $2.75 to $3.25 by year-end 2026.
Long-term forecasts indicate ADA could hit $10.25 by 2030.
The Cardano price prediction 2026 is generating significant buzz in the crypto market, as the last quarter is soon to close in few days, boosting interest for the next altcoin. The 2025 for ADA/USD began with numerous fundamental updates strengthening its future, including the transformative Plomin Hard Fork, but 2026 seems even more constructive.
Now, Questions abound: “Will Cardano spearhead the altcoin movement?” and “What heights can ADA reach by 2050?” Explore this Cardano price prediction 2026 and beyond, filled with expert insights and ambitious forecasts.
Coinpedia’s Cardano Price Prediction
The Cardano price outlook for 2026 is promising, driven by its extraordinary 4,000% surge in 2020 and currently holding strong at a significant support level. With a positive shift in market sentiment, even a moderate increase could lead to a remarkable 1,000% rise, positioning Cardano around $4.50.
A more conservative target of $1.40 indicates a solid 300% gain based on existing trends. Analysts are broadly optimistic that upcoming ETF approvals will boost institutional adoption and market stability, with price projections ranging from $2.05 to $2.80.
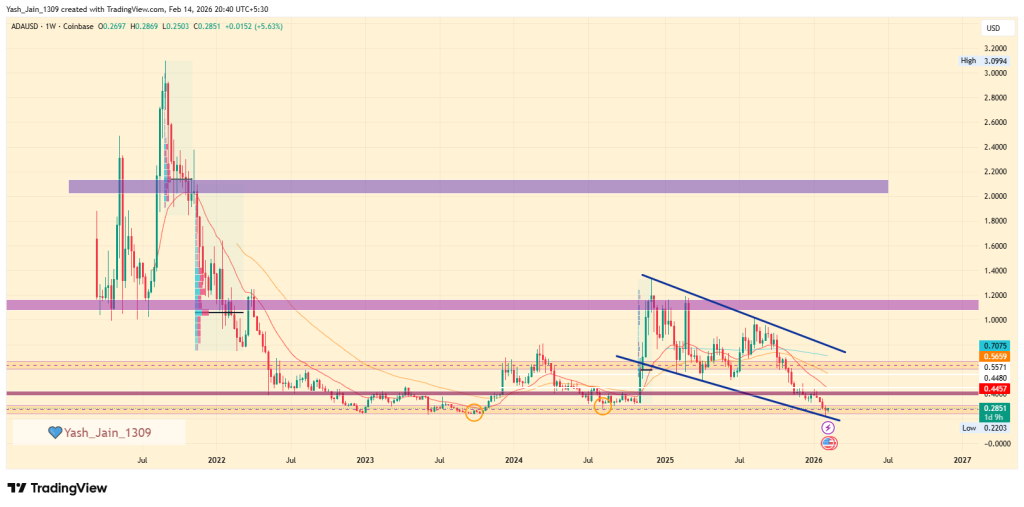
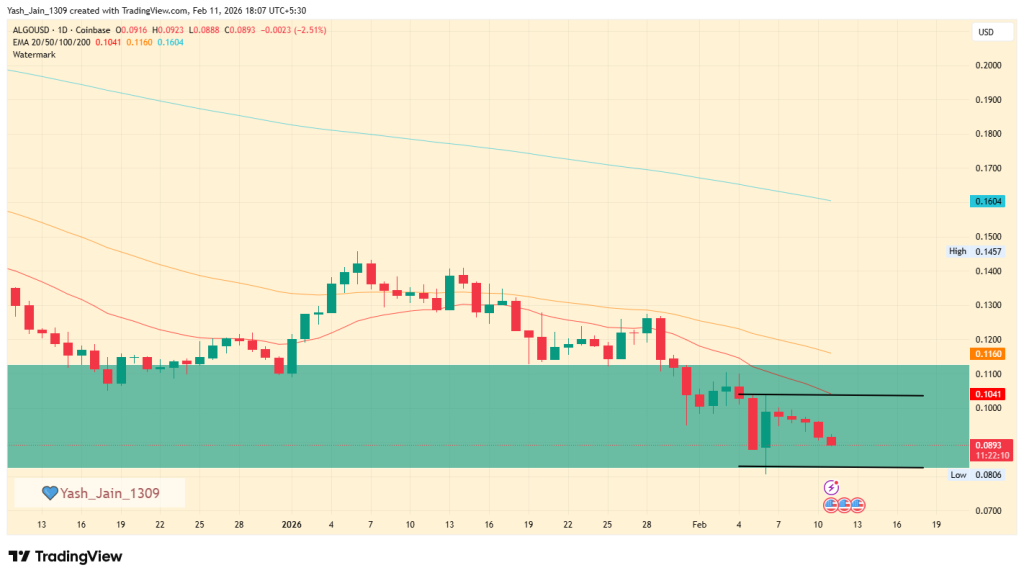
The ADA price is currently experiencing a significant sell-off. However, early February has revealed a crucial demand zone where new buying interest is likely to emerge, setting the stage for a potential bullish rally. Additionally, the lower boundary of the falling wedge is providing solid support, indicating that a price spike could be imminent. Therefore, it is anticipated that ADA could potentially reach $0.60 this month. On the other hand, if BTC collapses again, ADA might drop to $0.20 or even lower.
Cardano AI Price Prediction For February 2026
Source
Low Price
Average Price
High Price
Gemini
$0.85 – $0.95
$1.00 – $1.20
$1.30 – $1.50+
BlackBox
$0.65
$1.00
$1.50
ChatGPT
$0.75
$0.95
$1.25
ADA Price Prediction 2026
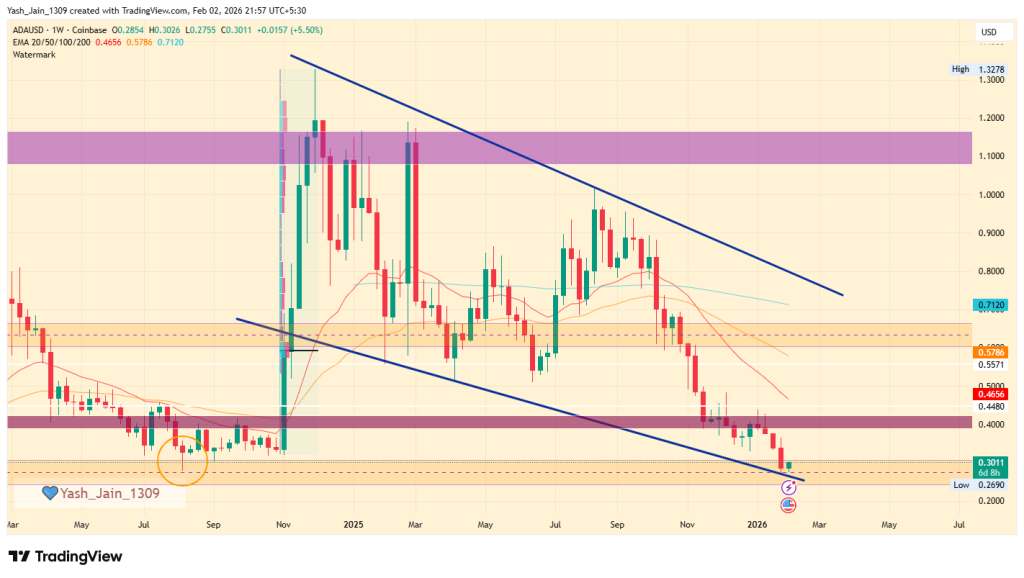
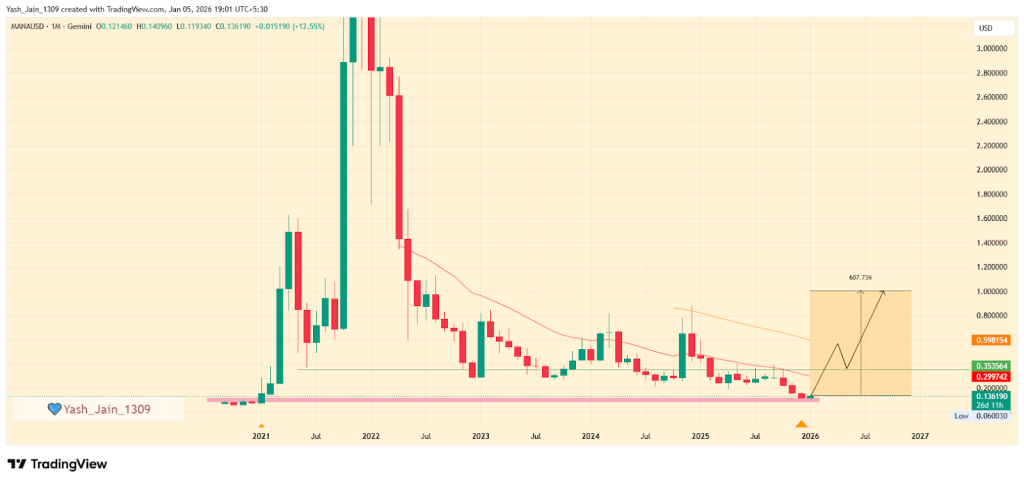
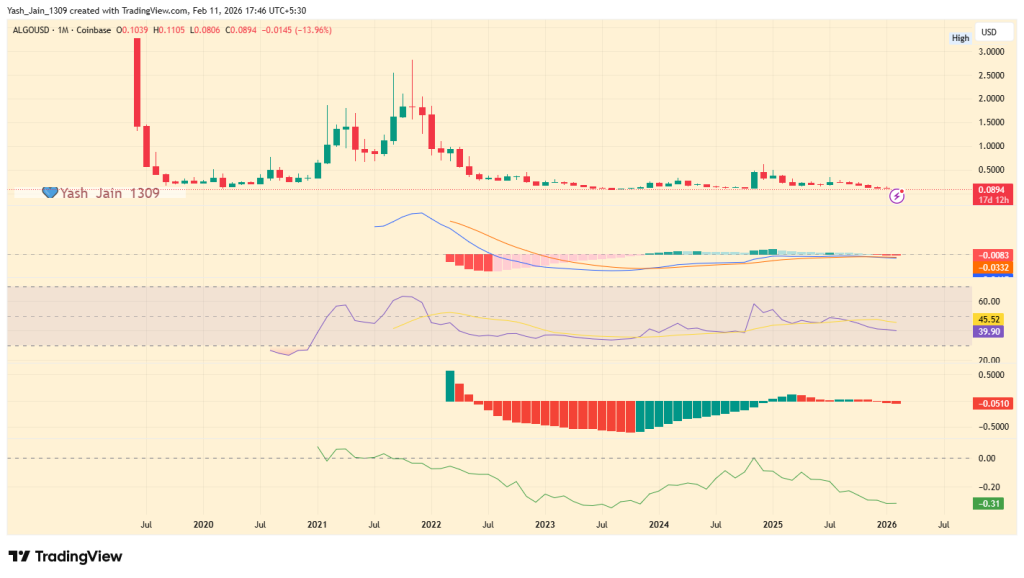
The Cardano price forecast for 2026 points to an important support level on its weekly chart, a range that has consistently acted as a strong pivot point for price trends, and is currently giving off signals of another potential rally. This support level is known for displaying remarkable resilience over time, suggesting that if Cardano price USD can maintain its position above this threshold once again, it could pave the way for significant price movements in 2026.
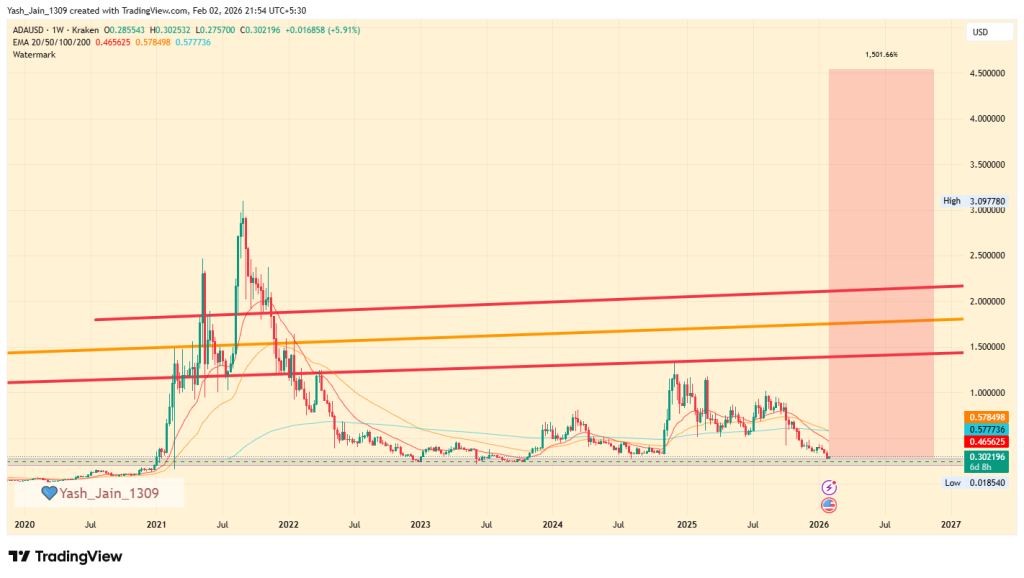
Looking back at Cardano’s historical performance on the weekly chart, it shows an extraordinary rally in 2020, when the asset posted staggering gains of nearly 4,000%. During that bullish phase, the Cardano price USD spent an extended period consolidating around the dynamic support trendline, which appears to be a strategic accumulation at discounts from smart money, contributing significantly to its eventual surge.
If the current market sentiment shifts positively, a resurgence in investor confidence could lead to a recovery. Not ambitiously, even modestly, past performance could give a tremendous surge. Last year’s performance was 4000%. If we assume 1/4 of that momentum, it would result in an increase of approximately 1000%, potentially elevating Cardano’s price to $4.50 by 2026.
Conversely, a more conservative approach suggests a realistic price target of around $1.40, indicating a potential increase of about 300%. This estimate remains feasible, especially since it is based on fundamental analyses and market trends that are not reliant on speculative triggers, such as the possible approval of exchange-traded funds (ETFs).
Additionally, many experts propose that these ETFs could significantly impact the market by boosting institutional investment and improving market stability. In a situation where ETF approvals occur and retail investor excitement rises, Cardano’s price could realistically range from $2.05 to $2.80.
Scenario
Potential Low
Average Price
Potential High
Without ETF Approval
$0.85
$1.10
$1.25
With ETF Approval + Retail Surge
$1.20
$1.65
$2.05
Bullish Breakout (with ETF & macro support)
$1.50
$2.05
$2.80
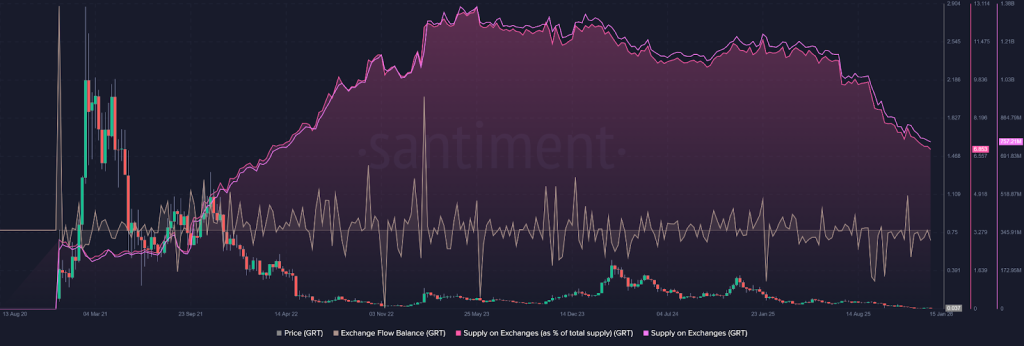
Cardano On-chain Analysis
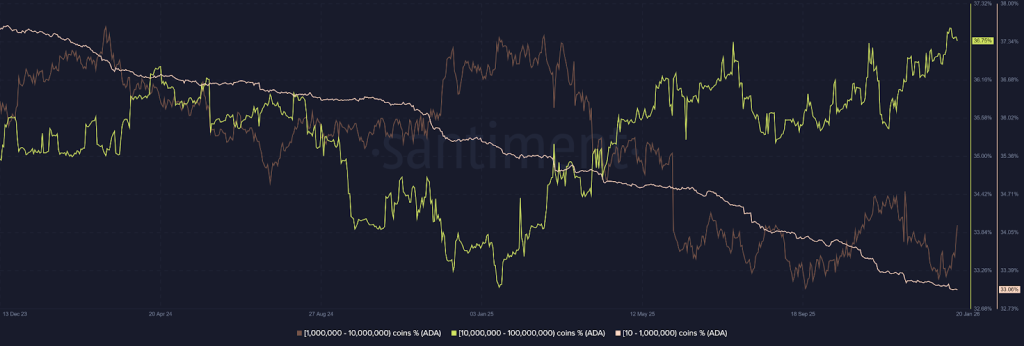
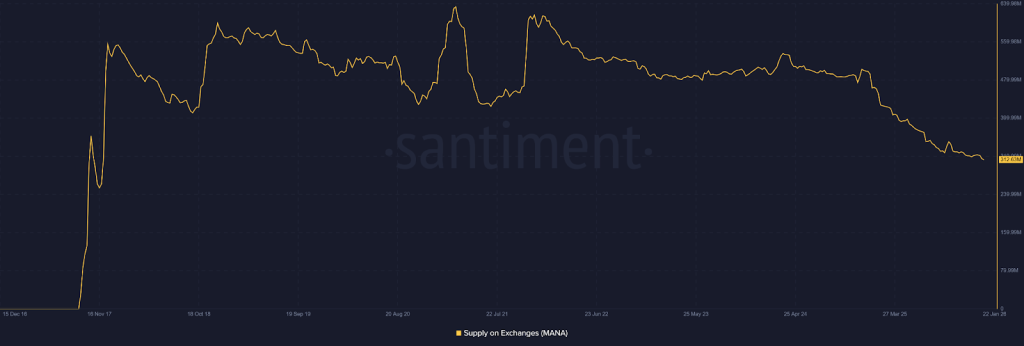
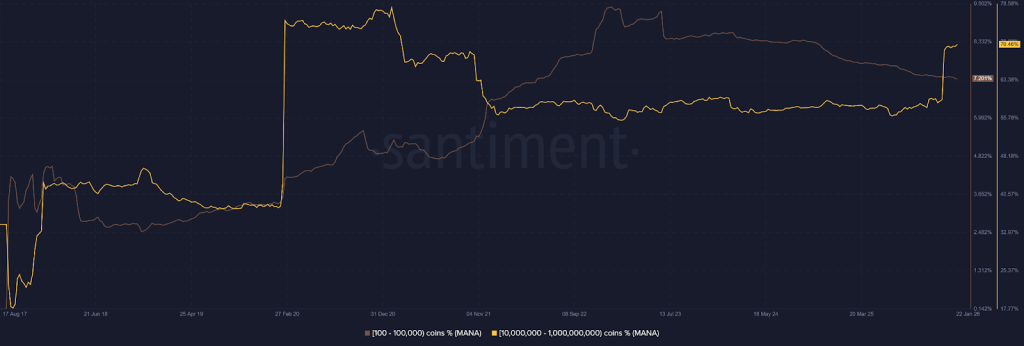
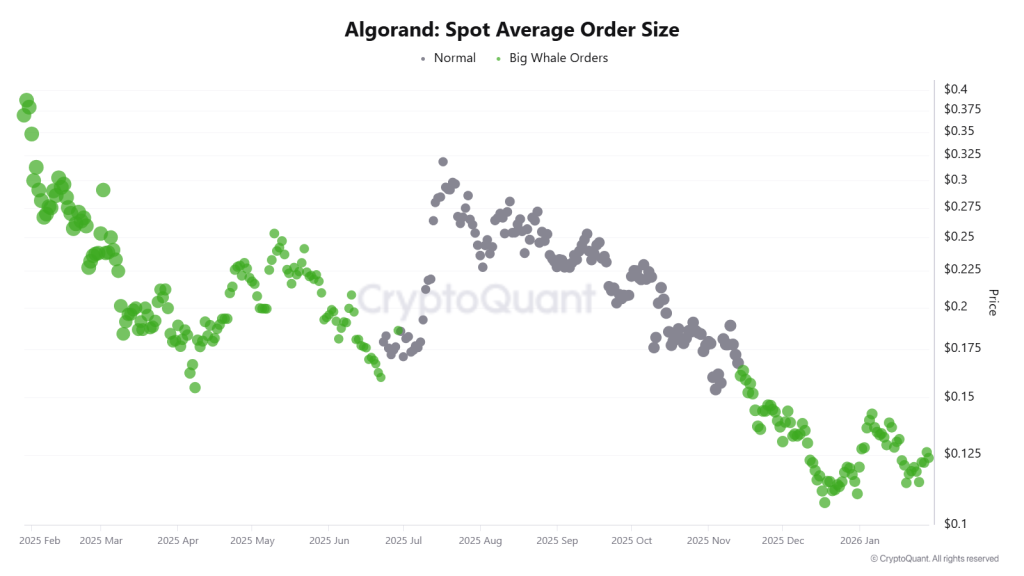
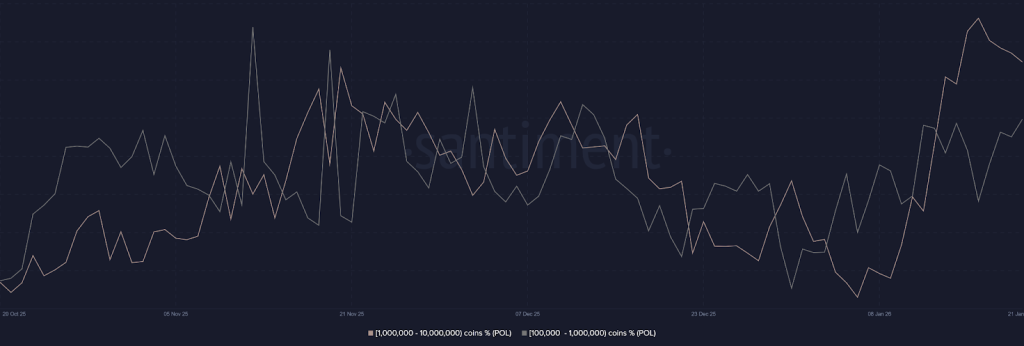
As per Cardano’s on-chain metrics, “Smart Money” accumulation phase is the best observation right now, because the divergence between retail and institutional holders is more vivid than ever.
As the number of addresses holding between 10 and 1 million ADA is declining, and the consistent surge in the 10 million to 100 million coin bracket confirms this, this represents a major supply consolidation. The observation shows that these mega-whales are strategically absorbing the “weak hands” during price dips, effectively building a rock-solid fundamental floor for the asset. Also, the fact that the 1M to 10M coin bracket is also growing confirms that professional high-net-worth investors seem to be positioning for a recovery, too.
Similarly, the surge to 4.57 million total holders despite a grueling 2025 proves that Cardano’s ecosystem is expanding its reach even in a “stress test” environment. This growth in the holder base suggests that the asset is not being abandoned; rather, it is being redistributed into a more stable, long-term foundation. When a holder count rises as prices fall, it signals that the market views current levels as a deep-value opportunity rather than a reason to exit.
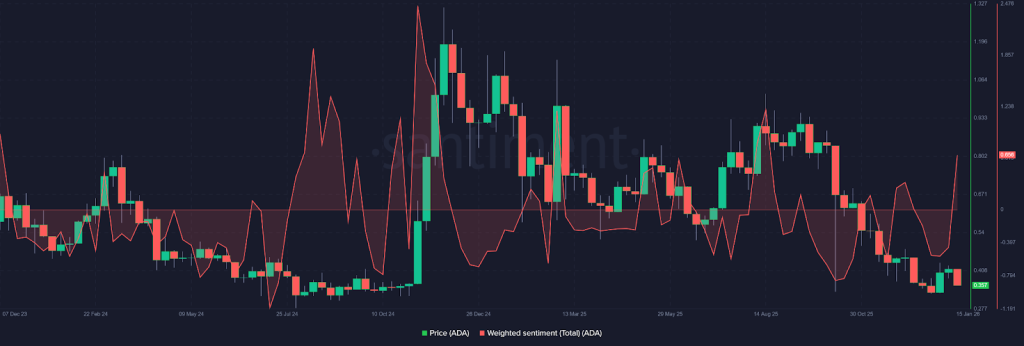
Additionally, the Weighted Sentiment flipping the 0 line to 0.656 is a crucial momentum trigger. Professionally, this “0-line flip” indicates that the aggregate social and market bias has shifted from fear to optimism.
Combined with the strategic whale accumulation, this sentiment pivot suggests that the “disbelief” phase is ending and that a bullish rally is likely once the remaining retail sell pressure is fully absorbed by the growing whale cohorts.
Cardano (ADA) Price Prediction 2026 – 2030
Price Prediction
Potential Low ($)
Average Price ($)
Potential High ($)
2026
2.75
3.00
3.25
2027
4.50
4.75
5.00
2028
5.25
5.50
5.75
2029
6.75
7.25
7.75
2030
9.00
9.75
10.25
This table, based on historical movements, shows ADA prices to reach $10.25 by 2030 based on compounding market cap each year. This table provides a framework for understanding the potential Cardano price movements. Yet, the actual price will depend on a combination of market dynamics, investor behavior, and external factors influencing the cryptocurrency landscape.
TRUMP memecoin cools near $5.66 as election hype fades, but 2026–2030 price predictions show potential surges toward $69.90 amid rising crypto and political momentum.
TRUMP token forecast signals major volatility ahead, with 2026 lows at $5 and highs up to $11.20 as memecoin trends, DeFi adoption, and political narratives drive demand.
OFFICIAL TRUMP (TRUMP), the political-themed memecoin linked to U.S. President Donald Trump, has become one of the most watched and volatile tokens in the market.
Its sharp rise in 2025 was driven by election hype, strong celebrity support, and massive social media attention. This pushed TRUMP into the spotlight as a cultural trend, not just another cryptocurrency.
So, let’s dive deep into our in-depth analysis of TRUMP Price Prediction 2026–2030, to find out what’s coming for the investors.
Was TRUMP regarded as a negligible asset in 2025? Not at all; the late 2025 announcement of a game launching on the App Store significantly shifted perceptions. Now, with the highly anticipated “Trump billionaire game” set to debut on the Apple Store on February 17th, 2026, the outlook for recovery in 2026 is strong, even after a challenging market in 2025. An increase from $4.00 clearly indicates potential, and once the $8.50 resistance is surpassed, we are poised for a rally towards $12.00.
Trump Price Prediction 2026
In 2025, the TRUMP token did not appear to be a dead asset, particularly with the announcement of the “Trump Billionaire Game,” which added a utility aspect beyond its initial memecoin status. The launch is scheduled for May 5th, 2026, on the Apple Store.
However, the outlook for 2026 is complicated by the 2025 market performance, where bulls struggled significantly against robust bearish sentiment. This dynamic reflects the speculative and often volatile nature of TRUMP’s price movement throughout 2025.
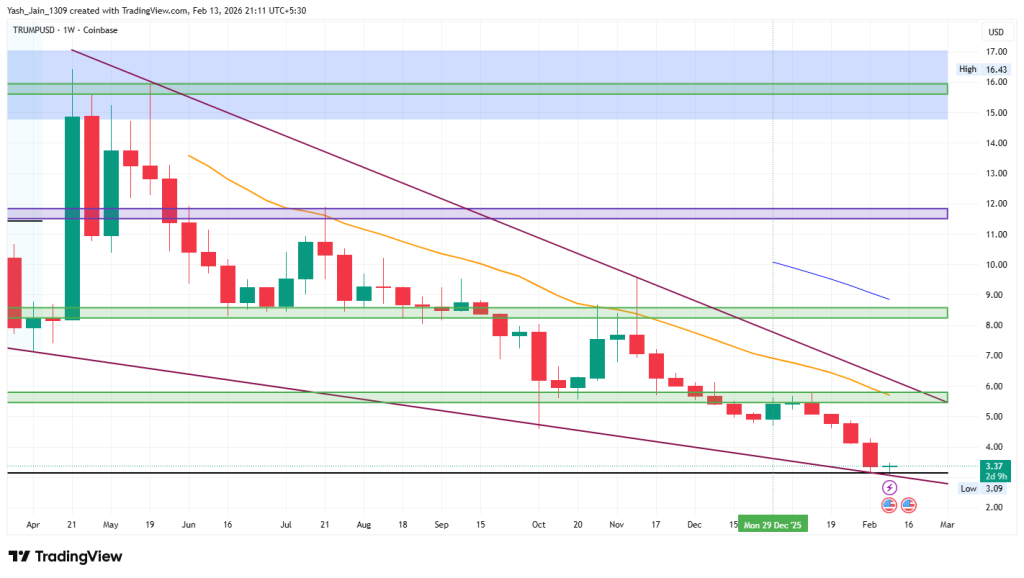
As we look forward to the possibilities that 2026 may bring, particularly with Donald Trump’s ongoing influence in the political arena, the potential for adoption is indeed compelling. On the price front, the weekly chart showcases an intriguing setup; we’ve recently seen a demand coming back around $3.00-$4.00 range in February. The price pattern indicates a falling wedge, reflecting a tightly compressed trading range, much like a coiled spring ready to unleash its energy.
Given this technical formation, a rebound appears likely. If bullish momentum emerges in rest of Q1 2026, it will be crucial to monitor the $5.50 resistance level. A decisive breakout above this level could signal a significant rally, potentially advancing toward $8.50 as the uptrend unfolds and could extend to $16 if demand remains stable.
Year
Potential Low ($)
Potential Average ($)
Potential High ($)
2026
$3
$18
$26
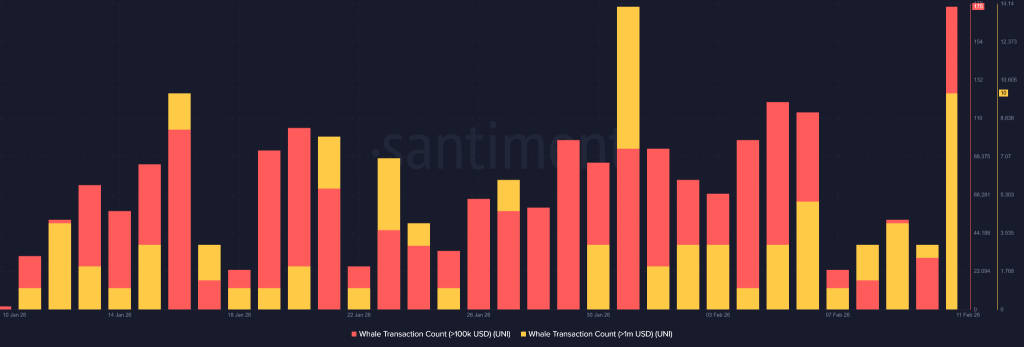
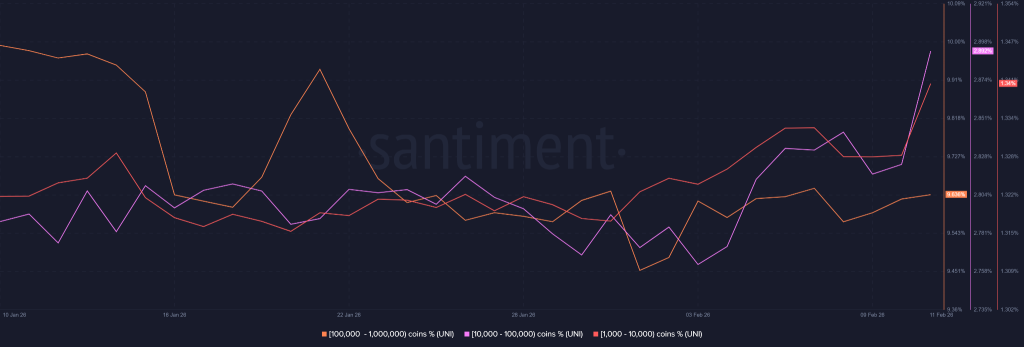
Trump Coin On-Chain Analysis
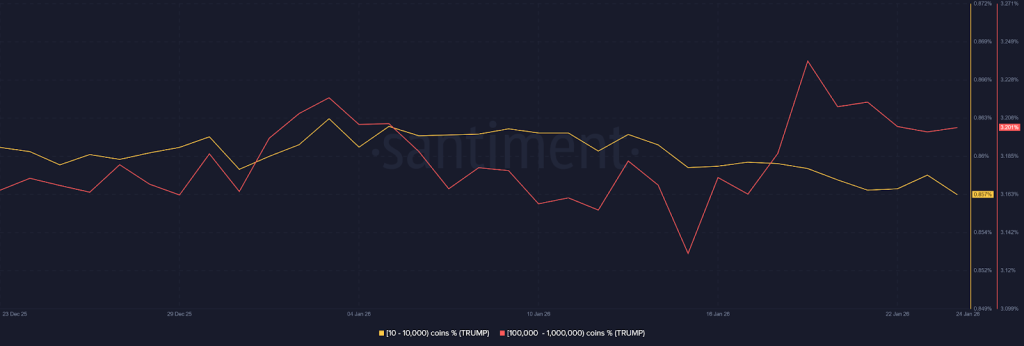
On-chain analysis of the OFFICIAL TRUMP (TRUMP) token in January 2026 reveals a significant bullish divergence characterized by institutional-grade absorption. Over the last 30 days, a clear redistribution of supply has occurred, which means that retail addresses holding between 10 and 10,000 coins have been consistently offloading their positions, while high-conviction “whale” addresses especially those holding between 100,000 and 1,000,000 TRUMP coins, have moved into an accumulation phase.
This “smart money” behavior suggests that larger entities are leveraging short-term retail panic and distribution as liquidity to build substantial long-term positions. This is laying the structural groundwork for a powerful upward trend as market sentiment stabilizes.
TRUMP Price Prediction 2026 – 2030
Year
Potential Low ($)
Potential Average ($)
Potential High ($)
2026
$5.00
$7.10
$11.20
2027
$6.05
$12.65
$18.90
2028
$8.20
$18.20
$27.50
2029
$12.40
$28.10
$44.80
2030
$18.10
$45.10
$69.90
TRUMP Price Prediction 2026
By 2026, the value of a single OFFICIALTRUMP coin price could reach a maximum of $42.00, with a potential low of $14.00. With this, the average price could land at around the $28.00 mark.
TRUMP Price Prediction 2027
Looking forward to 2027, the TRUMP coin Price may range between $21.00 and $42.00, and a potential average value of around $63.00.
TRUMP Price Prediction 2028
The Trump price could achieve the $94.25 milestone by the year 2028. However, the viral memecoin could record a low of $31.50 and an average price of $62.00 if the crypto market turns bearish.
TRUMP Price Prediction 2029
During 2029, the TRUMP crypto could reach a maximum trading value of $141.50 with a potential low of around $88. Evaluating the market sentiments, the average price of this altcoin could settle at around $94.50.
TRUMP Price Prediction 2030
The TRUMP memecoin crypto prediction for the year 2030 could range between $70.75 to $212.25. Considering the buying and selling pressure, the average price could be around $141.50 for that year.
What Does The Market Say?
Firm Name
2025
2026
2030
Mudrex
$60
$100
$600
Icobench
$100
$150
$500
Binance
$13.93
$14.63
$17.78
CoinPedia’s TRUMP Price Prediction
According to CoinPedia’s analysis, TRUMP could recover from its 2025 decline if strong social buzz returns. As per our price outlook, renewed interest in political-themed tokens may help TRUMP climb toward a possible $11.58.
However, if the market turns cautious, the token may drop back toward $5.0 before finding stable support.
Year
Potential Low ($)
Potential Average ($)
Potential High ($)
2026
$5.0
$7.18
$11.58
Never Miss a Beat in the Crypto World!
Stay ahead with breaking news, expert analysis, and real-time updates on the latest trends in Bitcoin, altcoins, DeFi, NFTs, and more.
FAQs
What is the TRUMP token and why is it gaining popularity?
The TRUMP token is a political-themed memecoin that surged due to election buzz, celebrity attention, and strong community hype.
What is the TRUMP price prediction for 2026?
Analysts expect TRUMP to trade between $5.00 and $11.20 in 2026, depending on market liquidity, sentiment, and political momentum.
Can the TRUMP token reach $20 by 2028?
Yes, if market demand rises, TRUMP could test the $20 zone by 2028 as memecoins mature and investor interest strengthens.
What could drive TRUMP’s price higher by 2030?
Community activity, strong market cycles, and sustained interest in political tokens may push TRUMP toward higher long-term levels.
Price predictions for 2026 range from $680 to $1160.
By 2030, BCH could reach highs of $3410, driven by increased adoption and transaction activity.
With Bitcoin smashing through the $100K barrier, all eyes are now on Bitcoin Cash (BCH) as traders wonder—will BCH price follow with a banana move of its own? Beyond hype, Bitcoin Cash is proving its value in the real world. Ranked 4th on Crypwerk’s global adoption list, BCH is gaining traction for its speed, low fees, and merchant-friendly design.
If you’re searching for answers to “Will Bitcoin Cash go up further?” — you’re not alone. In this Bitcoin Cash price prediction 2026–2030, we dive into the technicals and adoption trends shaping the next big BCH Price Prediction.
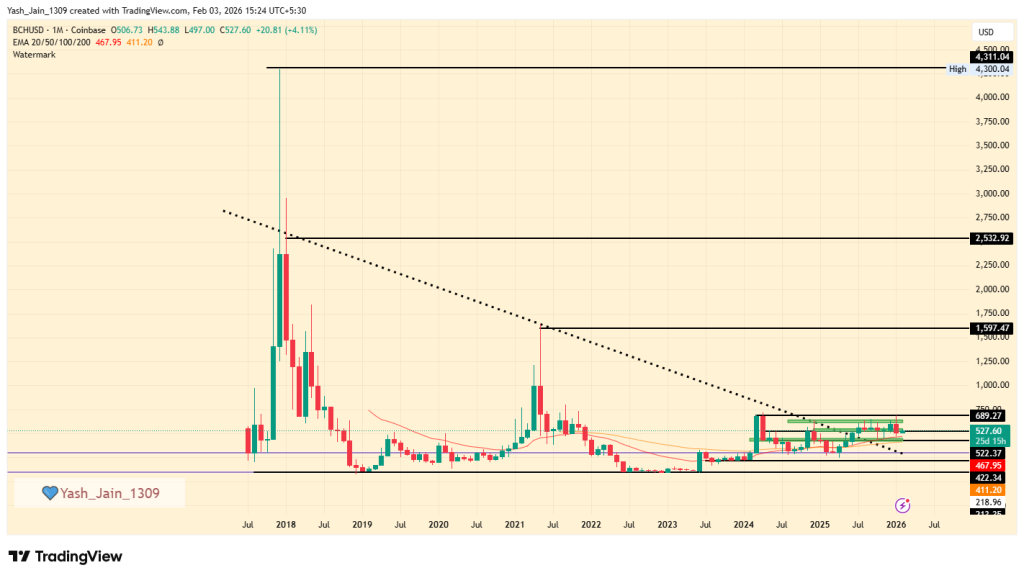
Q1 2026 could initiate a rally based on the success of the multi-year descending triangle pattern. On a 1-M timeframe, BCH/USD is in a consolidation between $425 and $689. But, sustaining above $689 would signal a trend shift. However, dropping below $450 risks a quick decline, with $300 as a critical support level.
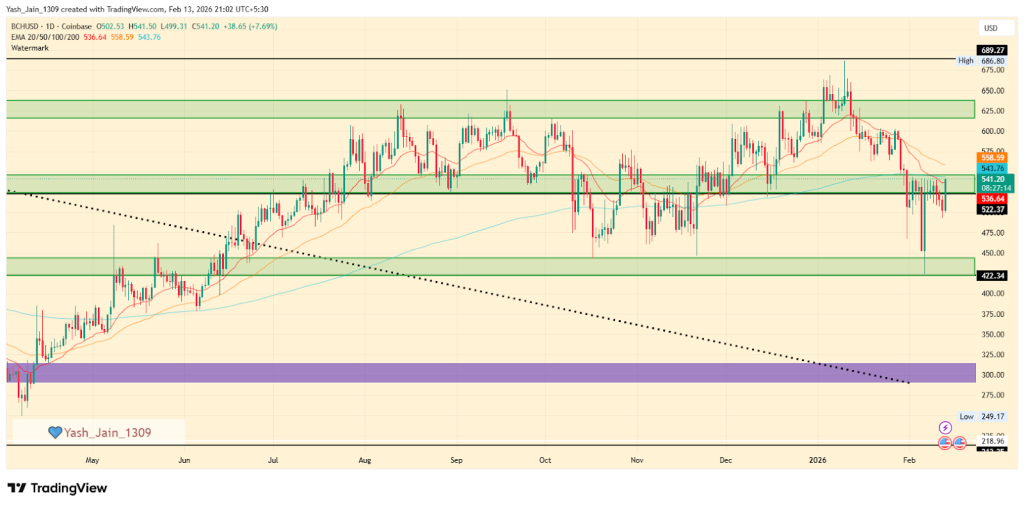
BCH Price Prediction February 2026
In January, the price of Bitcoin Cash (BCH) briefly reached $689 but was rejected, leading to a retest of the $422 support area in February, where demand seems to be holding. If BCH manages to flip $560, it could retest $686 by the February wind-up, but if more bearish forces build, it could be a dead-cat bounce before a final collapse takes down $422 support.
BCH Price Prediction 2026 (Q1)
Q1 2026 is set to be the most attractive period for the rally to truly kick off, because H2 2025 onwards it has broken out of a multi-year descending triangle pattern on the monthly chart, and ever since then it has mostly consolidated in a range of $425-$689. The range is quite big on a shorter timeframe, but on a longer timeframe, like monthly, it’s an ordinary consolidation whose movements are not as big as they sound compared to its historical price action.
In Q1 2026, it continues to consolidate in its range and has hit $689 once. And now, if it sustains above it in the coming months, that will signify a “Change of Character (ChoCh)” on the monthly chart, marking a significant long-term trend shift and unlocking potential for higher targets ahead.
Also, under the worst-case scenario, if the BCH price drops below critical support at $450, we could see a swift decline. The $300 level is expected to serve as a strong line of defense against further declines; however, breaking this level would completely delay the current long-term bullish sentiment
Year
Potential Low
Potential Average
Potential High
2026 (conservative)
$300
$605
$1200
Bitcoin Cash Price Targets 2026 – 2030
Year
Potential Low ($)
Potential Average ($)
Potential High ($)
2026
300
689
1,160
2027
680
925
1,160
2028
795
1,135
1,475
2029
1,025
1,480
1,955
2030
1,350
2,010
2,675
This table, based on historical movements, shows BCH price to reach $2675 by 2030 based on compounding market cap each year. This table provides a framework for understanding the potential BCH price movements. Yet, the actual price will depend on a combination of market dynamics, investor behavior, and external factors influencing the cryptocurrency landscape.
BCH Price Prediction 2026
In 2026, Bitcoin Cash price could project a low price of $300, an average price of $689, and a high of $1,160.
Bitcoin Cash Price Prediction 2027
As per the Bitcoin Cash Price Prediction 2027, BCH may see a potential low price of $795. Meanwhile, the average price is predicted to be around $1,135. The potential high for BCH price in 2027 is estimated to reach $1,475.
BCH Price Analysis 2028
Looking ahead to the Bitcoin Cash Price Prediction 2028, BCH is expected to have a low price of $1,025. With an average price of $1,480, the BCH price could make a high of $1,955.
Bitcoin Cash Price Prediction 2029
Finally, by 2029, Bitcoin Cash Price Prediction anticipates a low price of $1,350, an average price of $2,010, and a high of $2,675.
Bitcoin Cash Price Forecast 2030
For the year 2030, Bitcoin Cash Price Prediction forecasts a low price of $1809, an average price of $2705, and a high of $3410.
Never Miss a Beat in the Crypto World!
Stay ahead with breaking news, expert analysis, and real-time updates on the latest trends in Bitcoin, altcoins, DeFi, NFTs, and more.
FAQs
What is BCH price prediction for 2026?
BCH price prediction for 2026 ranges from $680 to $1,160, depending on whether it confirms a long-term bullish trend shift.
How much will Bitcoin Cash be worth in 2030?
Bitcoin Cash could trade between $1,350 and $2,675 by 2030 if adoption rises and market conditions remain favorable.
What is Bitcoin Cash price prediction for 2040?
By 2040, Bitcoin Cash could see significantly higher valuations if global payments adoption expands, though forecasts remain speculative.
Can Bitcoin Cash grow beyond its current use case?
Yes, BCH could grow through wider merchant adoption, faster payments, and improved on-chain utility in real-world transactions.
Is Bitcoin Cash a good long-term investment?
BCH has long-term potential due to low fees, fast transactions, and growing merchant adoption, but price depends on broader crypto market trends.
Can Bitcoin Cash reach its all-time high again?
Revisiting previous highs is possible if BCH sees sustained adoption and a confirmed long-term trend reversal, though it’s not guaranteed.
The Bitcoin price hasn’t bottomed. Not even close, if you’re looking at the data without rose-colored glasses.
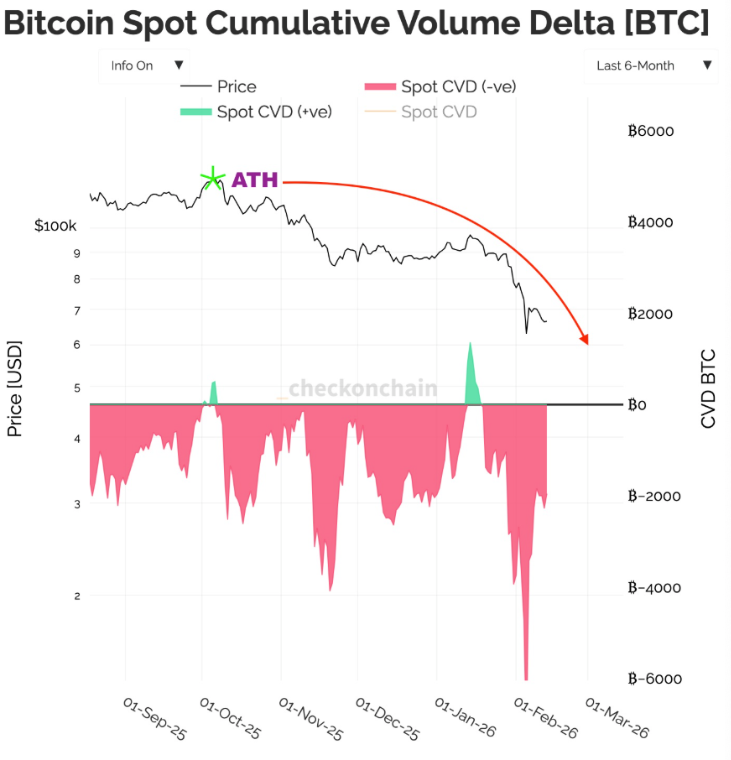
Sure, there’s been dip-buying and day traders earned some money. But here’s the uncomfortable part, almost all of it is coming from one aggressive player. In January alone, Strategy scooped up 40,150 BTC, accounting for 97.5% of all active DAT buying volume. Strip that out, and the buy-side looks eerily thin.
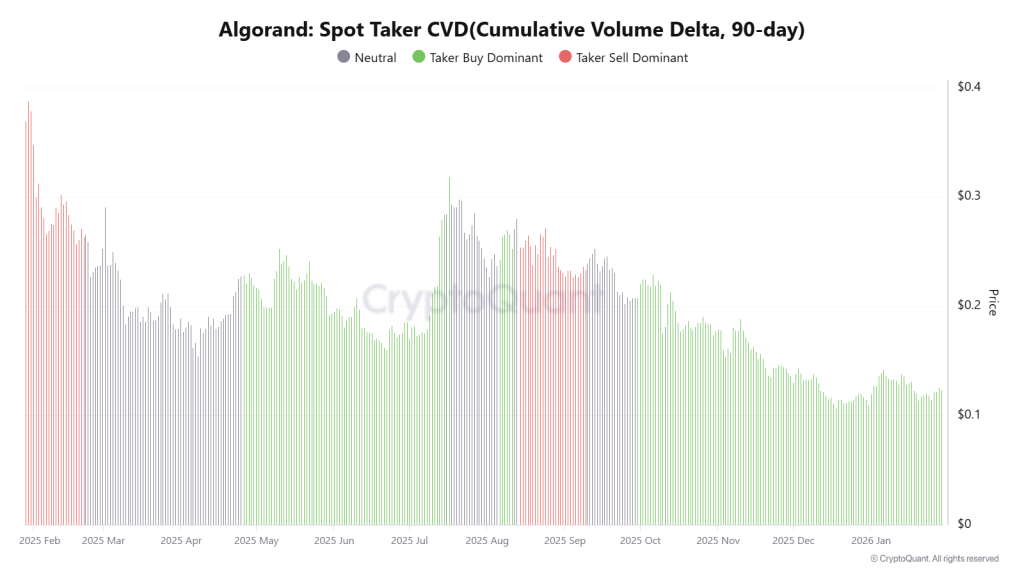
Meanwhile, the Spot CVD is flashing massive red bars. Translation? Outside of that single large accumulator, buyers are largely missing in action, shows shortterm momentum. Because, that’s not exactly the kind of healthy hand-off you want to see at a durable bottom for a longterm rally.
Bitcoin Price and Thin Demand
When the Bitcoin price is leaning on one dominant buyer, it’s usually not a sign of strength, per an analyst Sunny Mom. Markets bottom when broad demand steps in and not when one entity carries the most of the load.
The BTC/USD pair reflects that imbalance. The selling pressure is visible, and the cumulative volume delta shows a market still distributing coins rather than absorbing them smoothly.
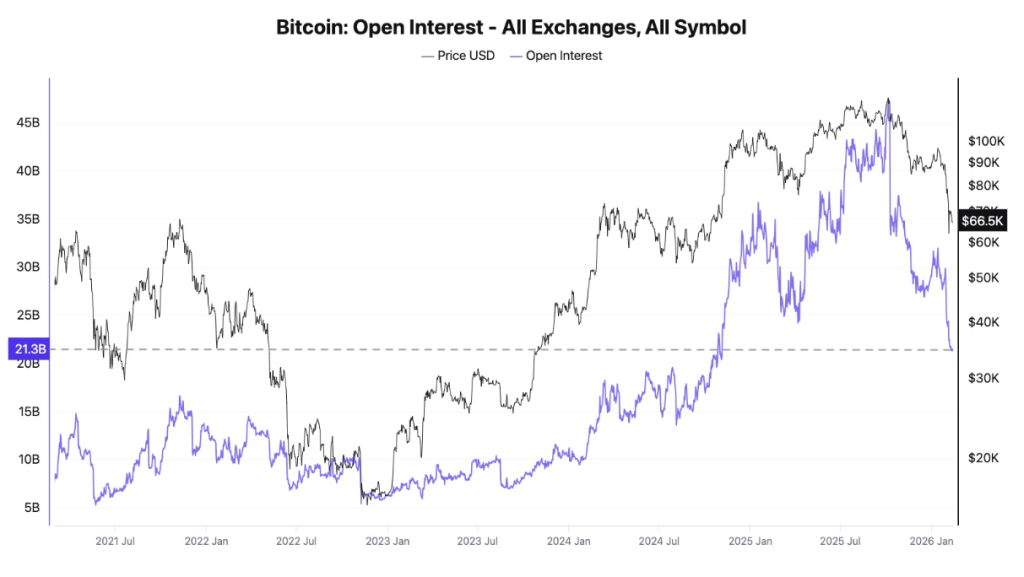
And that’s just the first warning. Because CryptoQuant insights shows that Open Interest also hits yearly lows
The data showed that futures Open Interest has dropped to $21.3B, this is a yearly low. Leveraged speculators have largely exited. On the surface, that sounds cleansing. But here’s the kicker: it also means there’s barely any momentum left in the system.
Reduced leverage, Reduced fuel. When open interest collapses like this, it signals apathy. The Bitcoin price chart isn’t showing eager dip buyers piling in. It’s showing a market that’s stepped back.
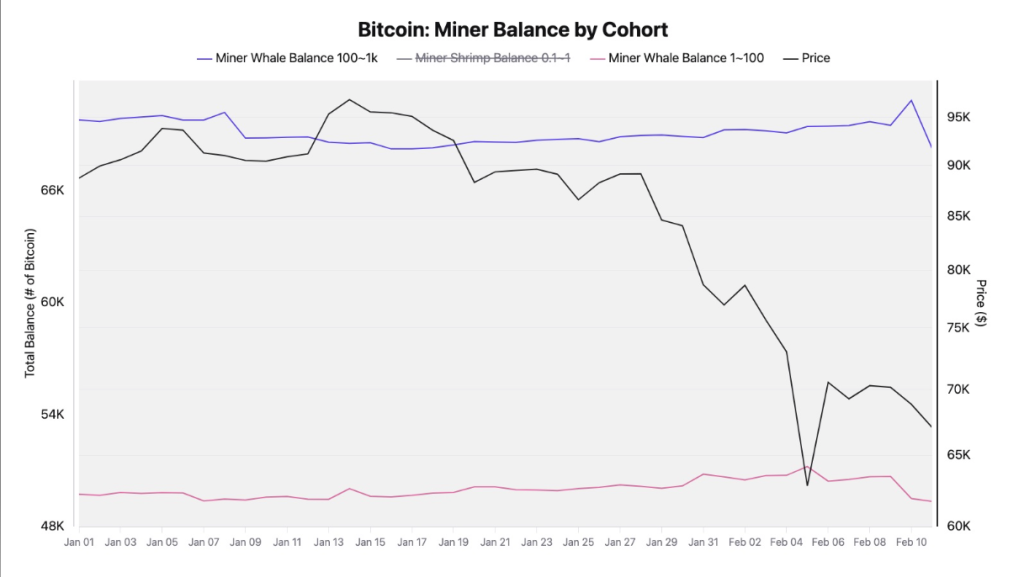
Miners and MVRV Flash Caution
Now layer in miner behavior. Analyst sheds light on this also where it says that after February 9th, large-scale miners began trimming positions, increasing circulating supply. More coins hitting the market while demand is weak? Which is not ideal at all for bulls market start.
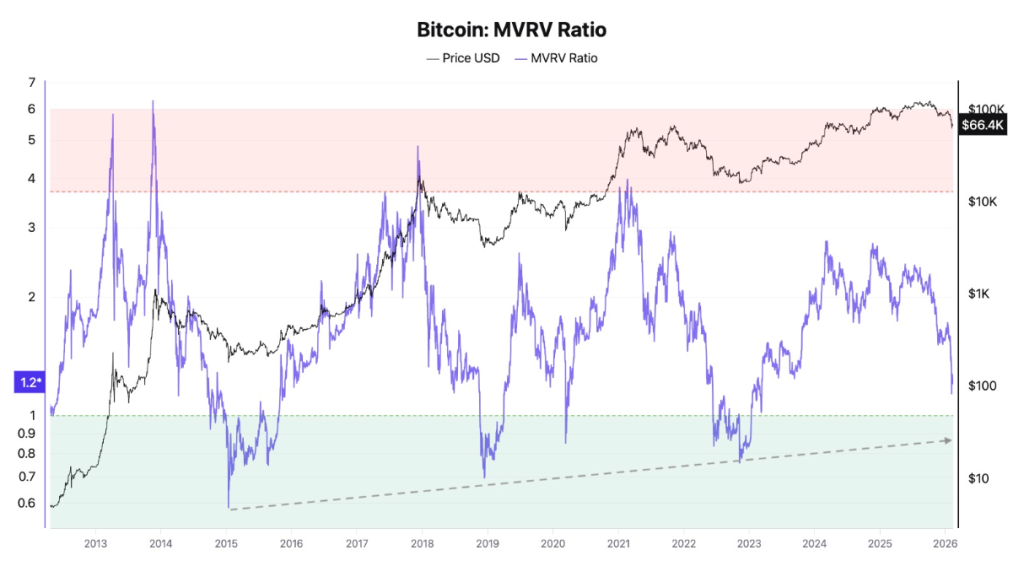
Then there’s the MVRV ratio, currently sitting at 1.2. Historically, macro bottoms tend to form between 0.7 and 0.8. Do the math, and that suggests potential downside of roughly 30–40% from here.
That’s not a forecast carved in stone. As markets mature, bottoms can form at higher levels than in prior cycles. But based on historical context, we’re not in classic capitulation territory just yet.
If patterns repeat, the $48K–$58K zone looks like a plausible “fair value” bottom for this bearish phase. Until spot CVD flips meaningfully positive and demand broadens beyond a single aggressive buyer, calling a confirmed bottom feels premature.
For now, the Bitcoin price remains in a correction that doesn’t look finished.
The cryptocurrency market is flashing bright green today ahead of Valentine’s Day on Friday, February 13th, as a wave of bullish sentiment sweeps through the digital asset ecosystem. Total market capitalization has surged as investors react to favorable macroeconomic data and a massive squeeze of short positions.
Here is a breakdown of why the crypto market is rallying today:
US CPI Data Comes in Cooler Than Expected
The primary catalyst for today’s rally is the latest Consumer Price Index (CPI) report from the US Bureau of Labor Statistics (BLS). Annual inflation in the US declined to 2.4% in January, down from 2.7% in December.
Crucially, this figure came in below the market expectation of 2.5%. This “cool” inflation print has fueled hopes that the Federal Reserve may lean toward more dovish monetary policies or potential rate cuts later this year.
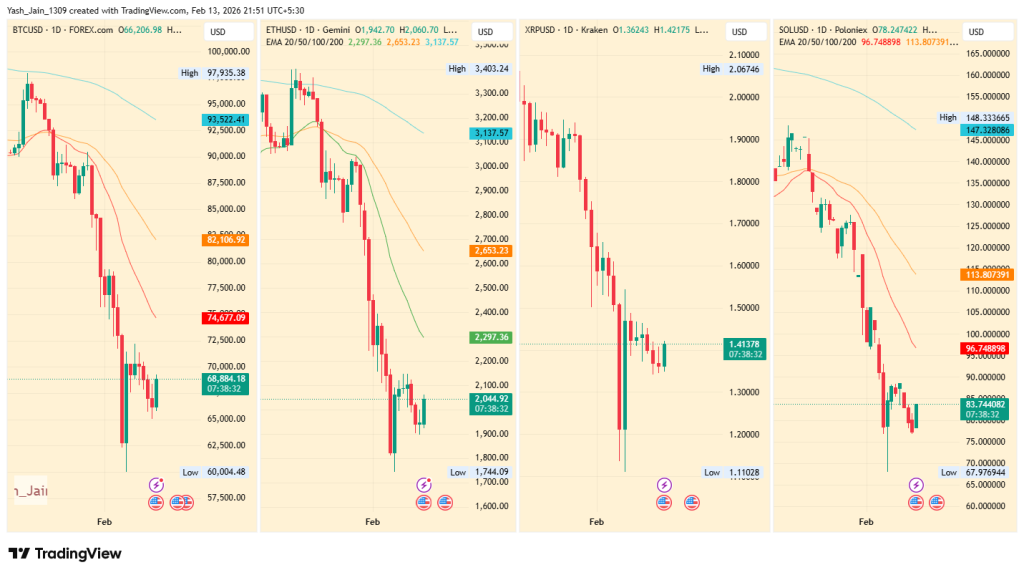
Bitcoin Leads the Charge, Altcoins Follow
In response to the CPI news, Bitcoin (BTC) surged by 4% today, breaking through key resistance levels and stabilizing the broader market. This upward momentum immediately spilled over into the altcoin sector:
Ethereum (ETH) outperformed the leader with a 6% jump.
Solana (SOL) remains a top performer, rising 6.50%.
XRP showed strong recovery, posting a 5% gain.
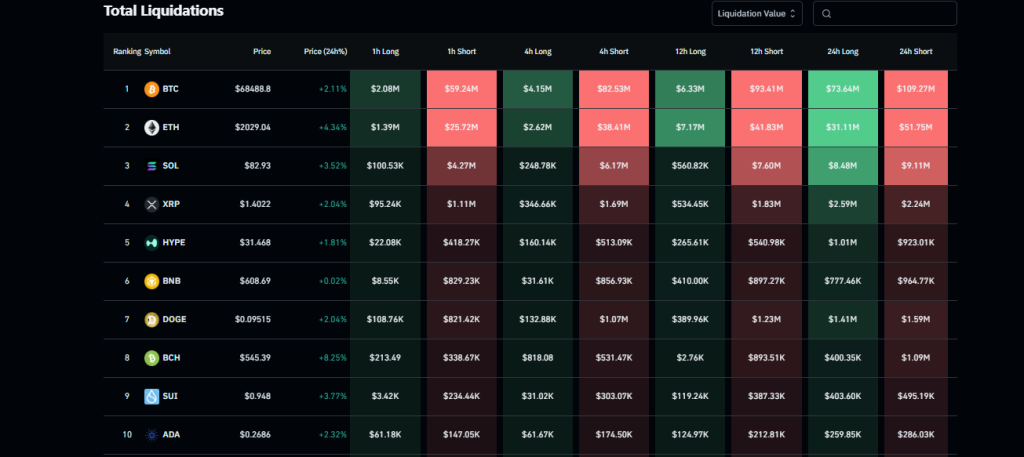
Short Sellers Get “Rekt”: $365 Million in Liquidations
The rapid price spike caught many bearish traders off guard. According to data from Coinglass, the total 24-hour liquidations across the crypto market reached a staggering $365.81 million.
The rally was largely fueled by a “short squeeze,” as traders betting on a price drop were forced to buy back their positions. Of the total liquidations, $202.30 million were short positions.
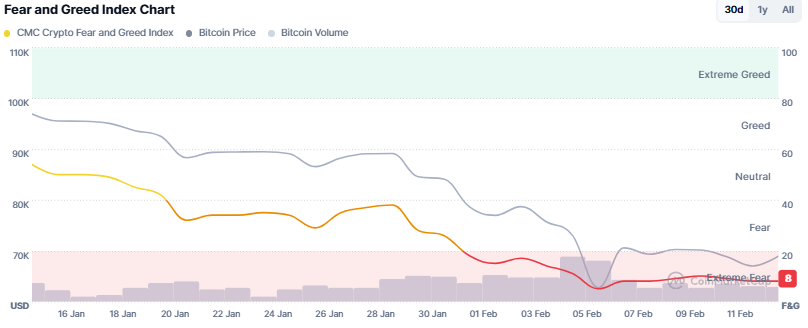
Market Sentiment Hasn’t Shifted to “Greed” Yet
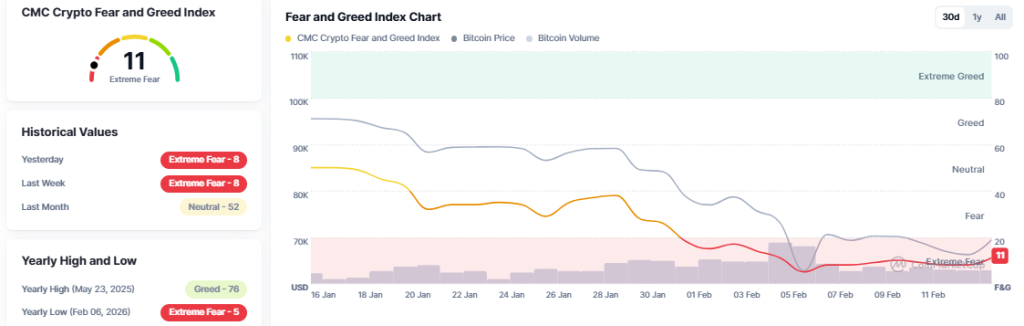
With the inflation bogeyman appearing to recede and institutional inflows continuing to steady the ship, the Crypto Fear & Greed Index could take a breath of relief sooner. However, for now, it’s still at 8 into the deeper fear zone, but rising demand in the short term could show a bounce towards the neutral area, because the “Greed” territory is far from reach until a long-term confirmation is received. Heavy liquidations by short sellers have cleared the path for further upside today, as there is now less immediate sell pressure from over-leveraged bears.
What’s Next?
As we head into the weekend, analysts are watching to see if Bitcoin can flip its current local high into a permanent support floor. If the macro environment remains stable and the “cooling inflation” narrative persists, the crypto market may be looking at a sustained bullish trend for the remainder of February.
The Dash price could reach a maximum of $1200 in 2026.
Dash price with a potential surge, may reach a high of $3206.16 by 2030.
Dash, short for digital cash, was created with a clear vision of becoming a fast, secure, and practical payment-focused cryptocurrency. Built to support decentralized applications and everyday transactions, Dash has spent much of its history oscillating between periods of explosive growth and prolonged consolidation.
Its journey reflects the broader evolution of the crypto market, where early hype-driven rallies were followed by deep corrections, long accumulation phases, and renewed attempts at recovery.
Over the years, Dash has demonstrated resilience by repeatedly attracting demand during extended downtrends, signaling a persistent belief in its utility as a privacy-oriented payment network.
Market cycles, macro shocks, and shifting investor sentiment have all shaped its price behavior, turning Dash into a classic example of a high-volatility asset with long-term structural patterns. By the end of twenty twenty five, Dash found itself at a critical juncture, having built a solid base after years of decline, setting the stage for renewed optimism around its future potential.
Now, investors are intrigued whether DASH can generate 1000% gains in 2026? To know in depth, read this article on DASH price prediction 2026 to 2030.
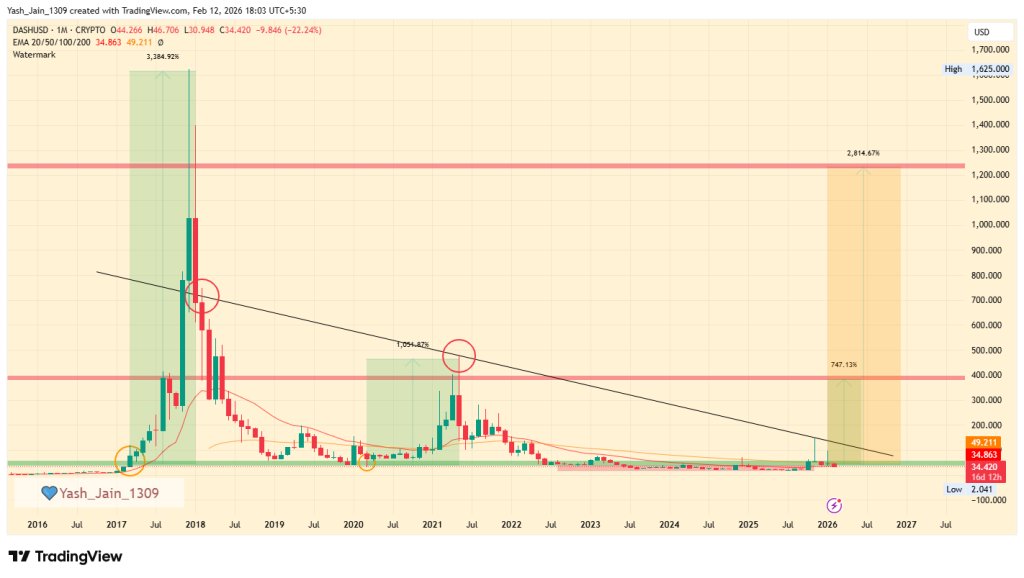
DASH/USD has consolidated after climbing from $22 to $149 in the fourth quarter of 2025. Recent bullish sentiment surrounding privacy coins, fueled by increasing investor confidence and institutional interest, positions DASH for a potential breakout in 2026. Currently, it is receiving strong support around $50. A rise above $125 could target $400, with the possibility of reaching $1,200 by the end of 2026, marking significant gains.
DASH Price Prediction 2026
The DASH/USD trading range has significantly tightened after making a remarkable ascent from October’s low of $22 to a resistance peak of $149, where it faced a setback in Q4 2025. However, the recent positive reaction of XMR in early January indicates a strong return of bullish sentiment in the privacy coins sector resonating in other privacy coins like DASH, too.
Now, DASH crypto’s bullish setup strongly suggests a powerful odds of resurgence, as investor confidence in privacy-oriented cryptocurrencies like ZEC and Monero continues to grow. This is largely driven by increased institutional involvement in Bitcoin and DeFi, along with rising concerns over data exposure and financial surveillance in an increasingly regulated digital landscape, which is boosting the overall privacy sector.
Given DASH’s status as a popular privacy asset, a significant reaction is imminent, when a right catalyst is met. Also, The multiyear setup to breakout for good in 2026 appears highly promising.
Despite the current price of DASH/USD remaining below its historical peak, recent trends indicate a renewed investor interest in privacy assets. As of January 2026, the DASH price has demonstrated a bullish response, particularly from the $50 threshold. Should it successfully surpass the $125 level in the first quarter, the next ambitious target may be set at $400, representing a substantial 750% increase.
If this target is attained, the Q4 2026 rally could extend further towards $1200, yielding an impressive gain exceeding 2800% from its current market valuation.
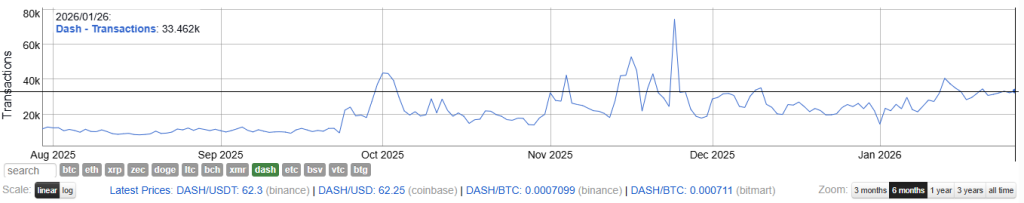
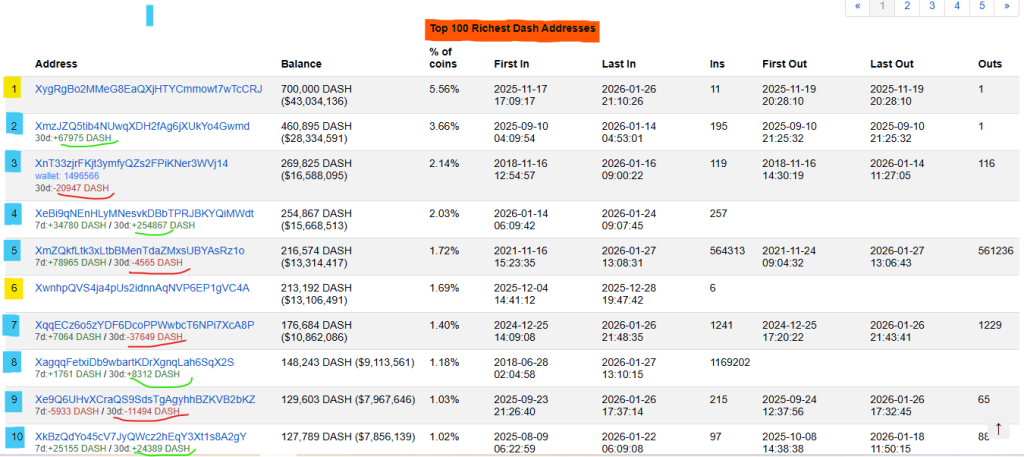
DASH On-Chain Analysis
Dash is also flashing bullish signal as network activity surges to impressive new heights this January. With daily transactions hitting 33,462 and unique active addresses climbing to 32,734, the ecosystem is buzzing with organic demand. This rising utility suggests a robust foundation for long-term price appreciation and adoption.
The “smart money” is aggressively positioning, as top whales absorbed a staggering $21.53 million in DASH this month alone.
Meanwhile, a 7.42% spike in hashrate and rising mining difficulty underscore a secure, rapidly growing network. With massive institutional accumulation vastly outpacing mild selling pressure, DASH is primed for a powerful breakout.
DASH Long-Term Price Prediction 2027-2030
Year
Potential Low ($)
Potential Average ($)
Potential High ($)
2027
917.89
1435.78
1653.67
2028
1326.83
1653.67
1980.51
2029
1490.24
1980.51
2470.77
2030
1735.36
2470.77
3206.16
DASH Price Prediction 2027
As the adoption constantly increases, the projected price of this altcoin may vary between $917.89 and $1653.67, with an average of $1435.78.
DASH Token Price Projection 2028
With the next Bitcoin Halving scheduled this year, the Dash price may fluctuate between $1326.83 and $1980.51, with an average of $1653.67.
DASH Crypto Price Prediction 2029
Anticipating the start of a new crypto bull cycle, this altcoin could range between $1490.24 to $2470.77, with an average price of $1980.51.
DASH Price Prediction 2030
By 2030, the price of Dash crypto token may range between $1735.36 to $3206.16. Considering the high and low, it could settle the year with an average trading price of $2470.77.
Never Miss a Beat in the Crypto World!
Stay ahead with breaking news, expert analysis, and real-time updates on the latest trends in Bitcoin, altcoins, DeFi, NFTs, and more.
FAQs
What is Dash and how does it work?
Dash is a fast, secure cryptocurrency designed for everyday payments, supporting decentralized applications and privacy-focused transactions.
What is the Dash price prediction for 2026?
Dash could rise from $50 to $400 in 2026, with a potential high of $1200 if bullish momentum continues in privacy-focused crypto.
What is the Dash price prediction for 2027?
Dash may range between $917 and $1653 in 2027 as adoption grows and market conditions favor privacy-oriented cryptocurrencies.
What is the Dash price prediction for 2028?
Dash could trade between $1326 and $1980 in 2028, influenced by Bitcoin halving events and increasing investor interest in privacy coins.
What is the Dash price prediction for 2030?
Dash could range from $1735 to $3206 by 2030, reflecting long-term growth, adoption, and continued demand for privacy-focused crypto assets.
Is Dash a good investment for privacy-focused crypto?
Dash remains a strong choice for privacy payments, offering fast transactions and long-term growth potential for investors seeking secure digital cash.
The live price of the Zcash token is $ 232.68510528
Zcash (ZEC) may surge to $840 in 2026 amid growing privacy tech adoption.
ZEC price could hit $7,060 by 2030 if zero-knowledge upgrades succeed.
In 2025, the cryptocurrency landscape witnessed a tectonic shift as “Privacy Narrative 2.0” took center stage, propelling Zcash (ZEC) from a multi-year slumber into a staggering 1,500%+ rally. While much of the market focused on institutional ETFs for Bitcoin and Ethereum, ZEC quietly outperformed the majors, surging from sub-$40 lows in september to a multi-year peak near $744 by late November 2025. This resurgence was fueled by a unique convergence of institutional interest, high-profile endorsements, and a global pivot toward zero-knowledge (zk-SNARK) technology as a necessity for financial security.
As 2026 is ongoing, the excitement has turned into a high-stakes question: Was the 2025 “Privacy Summer” just a speculative spike, or the first leg of a massive structural repricing? With Zcash currently consolidating around the $510 mark, investors are closely watching to see if the upcoming protocol upgrades, the potential conversion of the Grayscale Zcash Trust into a spot ETF, and the growth of shielded DeFi (Ztarknet) can trigger a repeat performance.
Let’s dive deep into our comprehensive Zcash price prediction for 2026–2030 to determine if ZEC is preparing for its next parabolic run or a long-term period of base-building.
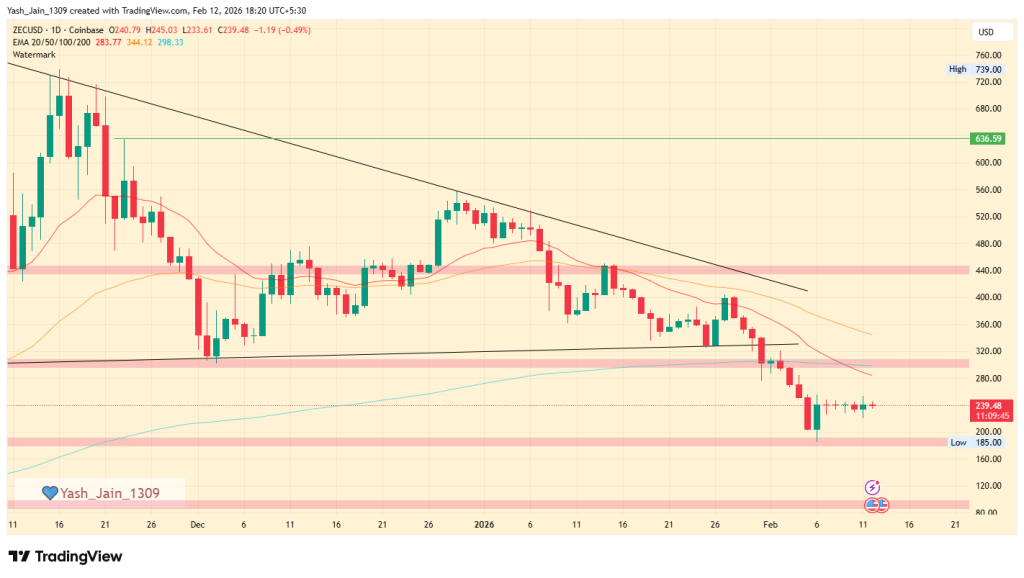
In 2025, it surged to an ATH but fell sharply in late Q4 2025. In Q1 2026, it continued where Q4 2025 left off, breaking $300 support. By early February 2026, it briefly dipped below $200 before recovering to $240. A further drop below $200 could see it reach $90-$100 support.
ZEC Price Targets For February 2026
January was a declining month for ZEC/USD, as it slipped below $300. In February, it briefly dropped below $200 but stabilized around that level. This demonstrated that bulls were defending this price point more strongly, and by mid-month, it recovered to $240.
For the remaining days of February, ZEC/USD needs to rebound to $300, which could be the target for the month. However, if it fails to achieve this, a consolidation around $200 may continue.
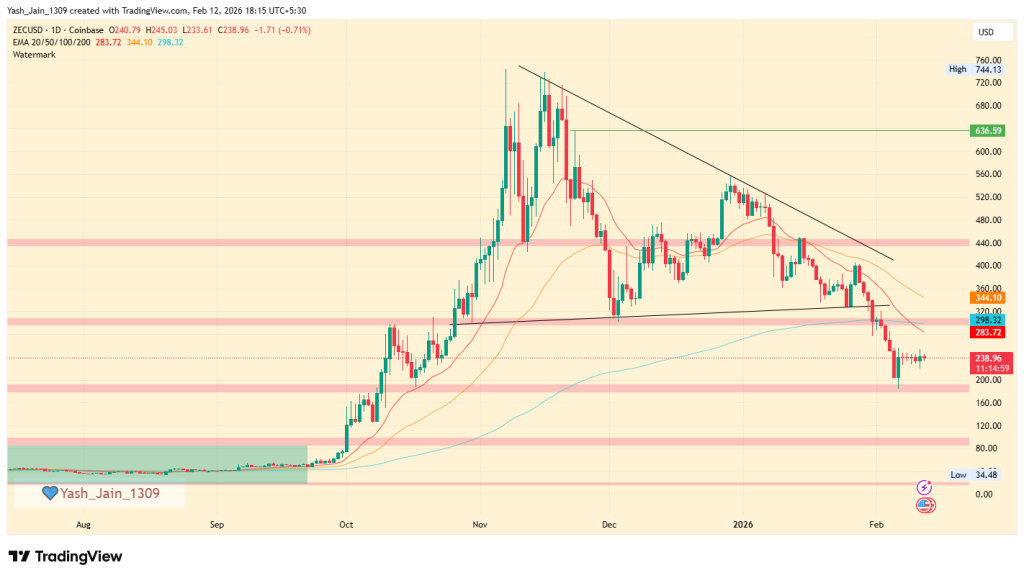
ZEC Price Prediction 2026
Amid ongoing discussions surrounding financial surveillance, Central Bank Digital Currencies (CBDCs), and the delicate balance between personal freedom and regulatory measures, Zcash (ZEC) has re-emerged as a potential safeguard against regulatory concerns. Throughout 2025, Zcash crypto experienced a notable resurgence as interest in zero-knowledge infrastructure grew globally.
Even in the fourth quarter of 2025, ZEC/USD remained a particularly compelling asset, reflecting both its performance and the demand from investors.
But ZEC fell into bearish grips, and after a big fight between bulls and bears, the bears won in the short term, allowing $300 support to break. In early February 2026, it briefly fell under $200 before recovering to $240 by mid-February.
The breakdown appears bearish, and the fall could extend if it breaks $200 again; it could also fall to the $90-$100 support range, where a reversal may occur.
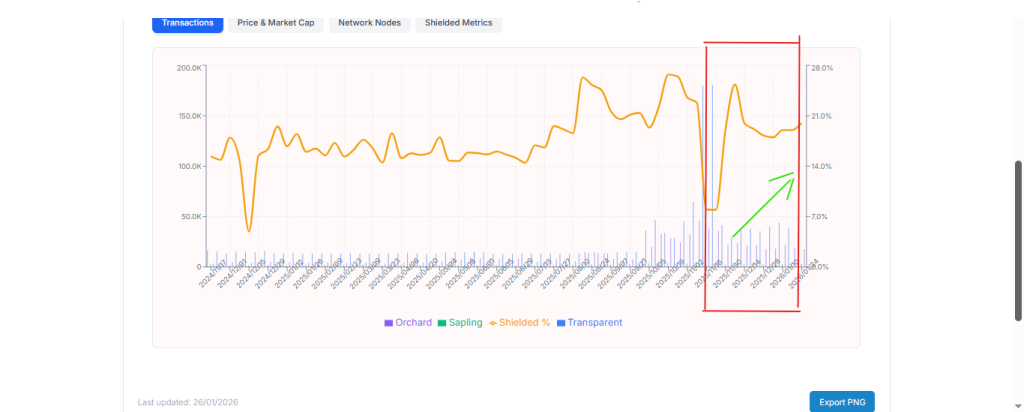
ZEC On-Chain Analysis
ZEC is seeing an increase in shielded transactions despite a decline in its token price, indicating that price is not limiting its utility. Privacy is becoming increasingly crucial for traders and investors considering adopting ZEC. In November, shielded transactions made up about 7.9% of total transactions, peaking at 25.3% in early December.
Even during a token sell-off, shielded transactions decreased only to 18%, while transparent transactions dropped significantly. Currently, shielded transactions are rising again to 20%, showing a growing interest in this feature. ZEC offers privacy transactions via two methods: Sapling and Orchard, with Orchard preferred.
ZEC Price Prediction 2026 – 2030
Year
Potential Low ($)
Potential Average ($)
Potential High ($)
2026
$380
$571
$840
2027
$697
$1394
$2092
2028
$1046
$2000
$3138
2029
$1569
$3108
$4707
2030
$2353
$4700
$7060
ZEC Price Prediction 2027
In 2027, new upgrades like better decentralization and zk-rollup support could push ZEC higher. Most estimates place the price between $697 and $2092, with an average of $1394.
ZEC Price Prediction 2028
The year 2028 may mark a broader wave of adoption for zero-knowledge identity systems globally. As regulatory systems mature, ZEC could benefit as a pioneer in zk-based privacy infrastructure. The projected range of $1046 to $3138, and an average of $2000.
ZEC Price Prediction 2029
The 2029 market cycle could align with Zcash establishing itself as a core infrastructure asset within the privacy space. As per the analysis, we expect ZEC to rally toward $1569–$4707
ZEC Price Prediction 2030
By 2030, if Zcash becomes fast, scalable, and ready for large-scale use, it could hit new highs. The price could reach up to $7060 by the end of the year.
Never Miss a Beat in the Crypto World!
Stay ahead with breaking news, expert analysis, and real-time updates on the latest trends in Bitcoin, altcoins, DeFi, NFTs, and more.
FAQs
What is Zcash (ZEC) and how does it work?
Zcash is a privacy-focused cryptocurrency using zk-SNARK technology to keep transactions private while still secure on the blockchain.
What is the ZEC price prediction for 2026?
ZEC could trade between $380 and $840 in 2026, depending on zero-knowledge upgrades, adoption growth, and overall market conditions.
What factors influence ZEC’s price growth?
ZEC’s price depends on privacy demand, zk-upgrades, regulatory trends, institutional interest, and adoption of shielded transactions.
How much will Zcash be worth in 2030?
If adoption accelerates and scalability improves, Zcash could reach up to $7,060 by 2030, driven by privacy infrastructure demand.
Is Zcash a good investment?
Zcash can be a good investment for those seeking privacy-focused crypto, but consider market volatility and technology adoption before investing.
Does ZEC have a future?
Yes, ZEC has a strong future potential as global interest in privacy tech and zk-proof systems grows in finance and blockchain.
TRX price could surge to $0.60 in 2026, with long-term growth reaching $3.55 by 2030 amid strong network adoption and bullish trends.
Tron (TRX) evolves as a global payment layer, dominating stablecoins and poised for major gains from 2026 to 2030.
Since its inception in 2017, TRON (TRX) has evolved from a bold vision of a decentralized internet into the indispensable “global settlement layer” of the digital economy. While many blockchains compete for niche developer interest, TRON has spent the last few years cementing its status as the world’s most active payment highway by dominating the stablecoin sector with the majority share of on-chain USDT activity.
The year 2024-2025 was a period of unprecedented scaling for the network. Bolstered by the “SunPump” memecoin frenzy and a milestone of over 12.5 billion lifetime transactions, TRX emerged as a top-tier deflationary asset. Its record daily transaction counts and a strategic reverse merger bringing TRON’s influence into traditional financial markets are one positive factor that has helped the network prove it can handle institutional-grade volume with near-zero fees.
However, as we have entered 2026, a new set of questions has gripped the market. can TRON’s utility-driven momentum outpace the rising competition from Layer-2 solutions? Is the current consolidation a “buy the dip” opportunity before a move toward the elusive $1.00 mark?
In this Coinpedia deep dive, we leverage technical analysis and on-chain metrics to forecast the TRX price trajectory from 2026 to 2030.
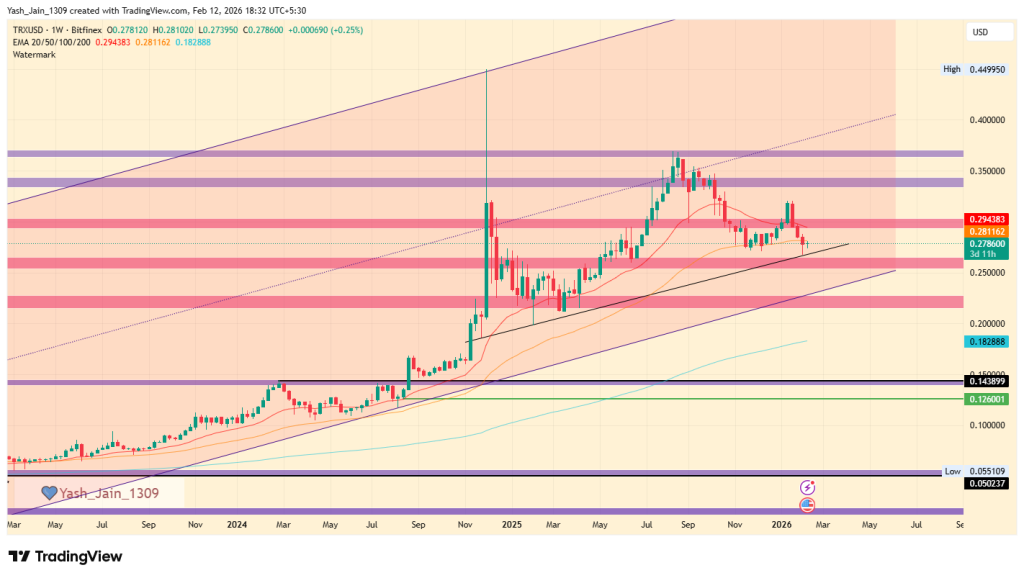
TRX/USD closed 2025 at $0.2850, with 2026 projections of $0.5500 to $0.6000. After reaching $0.32 in January, it declined in February and seeks stability. A bearish target of $0.23 may be a key footing its looking for that can trigger a solid reversal.
TRX Price Prediction February 2026
On the daily chart, January 2026 shows an upward trend until it reached $0.32 on January 18, where it faced rejection and began correcting. In February, it may drop to $0.2520 or rise back to $0.3200.
TRX Price Prediction 2026
TRX/USD closed 2025 at approximately $0.2850, and projections for 2026 indicate a potential rise of 90% to 100%, reaching between $0.5500 and $0.6000.
January 2026 started positively, with TRX/USD gaining to hit $0.32. However, it experienced a decline in February and appears to be returning to the lower end of the ascending channel pattern, which was last observed in Q3 2024. Since then, it reached an all-time high (ATH) of $0.44 but is now seeking a stable footing to attract strong demand again.
Currently, a bearish target of $0.23 seems likely in the coming weeks. This could trigger a reversal, similar to the previous instance when it took only a few months to reach the upper boundary of the ascending channel.
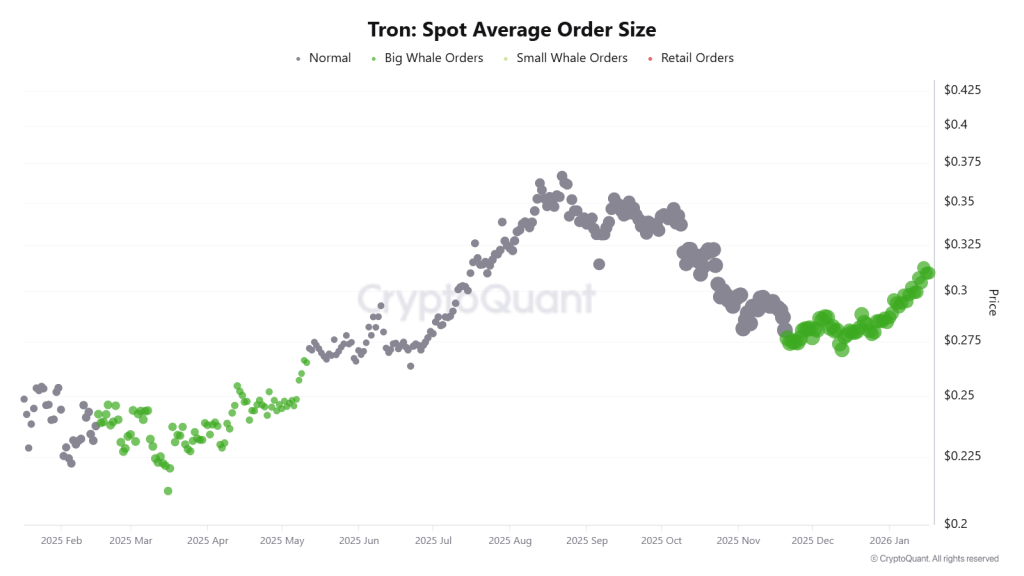
TRX On-chain Analysis
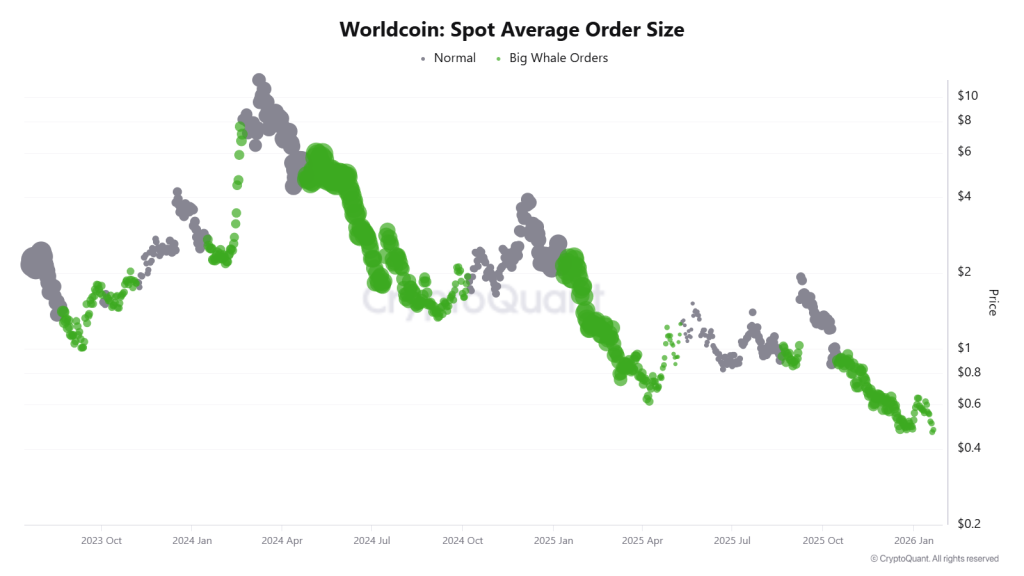
On-chain metrics reinforce the bullish momentum; Tron’s Spot Average Order Size shows a massive surge in Big Whale Orders (large green dots) throughout November 2025 to mid-January 2026. This heavy accumulation by high-conviction players supports the bounce off the 50-week EMA recently seen in TRX price action as well.
Also, the total number of unique active addresses is in uptrend, too, which confirms the blockchain’s utilization.
TRX Long-Term Price Prediction 2026-2030
Year
Potential Low ($)
Potential Average ($)
Potential High ($)
2026
0.55
0.85
1.10
2027
0.77
1.13
1.49
2028
0.94
1.50
2.07
2029
1.35
2.01
2.68
2030
1.82
2.69
3.55
TRX Price Prediction 2026
By 2026, the TRX coin price is expected to hit a high of $1.10, surpassing the next crucial psychological level of $1.00. In case of an economic slowdown, the TRX price is expected to make a low of $0.55, with an average of $0.85.
TRON Coin Price Projection 2027
With a potential recovery in 2027, the TRX price is expected to continue the bull run and retest the high of $1.49. On the flip side, the TRX crypto can bottom out at $0.77, with an average of $1.13.
TRON Crypto Price Forecast 2028
With continued bullish momentum in 2028, the TRX price can form a range between $0.94 and $2.07, with an average price of $1.50.
TRON Token Price Action 2029
The TRX price is expected to surpass the psychological barrier of $2.50. Creating a new swing high at $0.2.68, the TRX crypto might form a low at $1.35, with an average of $2.01.
TRON (TRX) Price Prediction 2030
TRX coin price is expected to create a new all-time high of $3.55 in 2030. With a potential low of $1.82, the crypto will have an average price of $2.69.
Tron Price Prediction 2031, 2032, 2033, 2040, 2050
Year
Potential Low ($)
Potential Average ($)
Potential High ($)
2031
2.08
3.34
4.61
2032
2.73
4.41
6.09
2033
3.52
5.67
7.83
2040
14.08
20.87
27.67
2050
84.66
127.87
171.09
Never Miss a Beat in the Crypto World!
Stay ahead with breaking news, expert analysis, and real-time updates on the latest trends in Bitcoin, altcoins, DeFi, NFTs, and more.
FAQs
What is the TRX price prediction for 2026?
TRX is expected to trade between $0.55 and $1.10 in 2026, supported by strong adoption, technical trends, and bullish market momentum.
What is the TRX price prediction for 2027?
In 2027, TRX could range from $0.77 to $1.49, with an average around $1.13, continuing its steady upward trend.
What is the TRX price prediction for 2028?
TRX may reach $0.94–$2.07 in 2028, with an average price of $1.50, driven by growing network usage and stablecoin dominance.
What is the TRX price prediction for 2030?
By 2030, TRX could hit a high of $3.55, with a potential low of $1.82, reflecting long-term growth in payments and blockchain adoption.
Is TRX a good investment for the future?
TRX shows strong long-term potential, with projected growth through 2030, backed by real-world use in payments, stablecoins, and global adoption.
The live price of the Stellar crypto is $ 0.15786448
XLM price could reach a maximum of $2.00 in 2026.
This altcoin could surpass the $6 mark with a high of $6.19 by 2030
Stellar, once recognized merely as a rapid payment network, has now set its sights on ambitious goals. Through strategic partnerships and an impressive roadmap, it is diligently establishing the groundwork for global finance. Anticipating steady growth in cross-border payments, XLM proudly stands as one of the leading asset in its category.
The XLM has raised the question, given its rising fundamentals, “Will XLM price make a strong comeback in 2026?” If yes, then “Can XLM reach $2 in 2026?” This Stellar (XLM) price prediction addresses all such queries and provides price targets for 2026 and the years to follow, up to 2030.
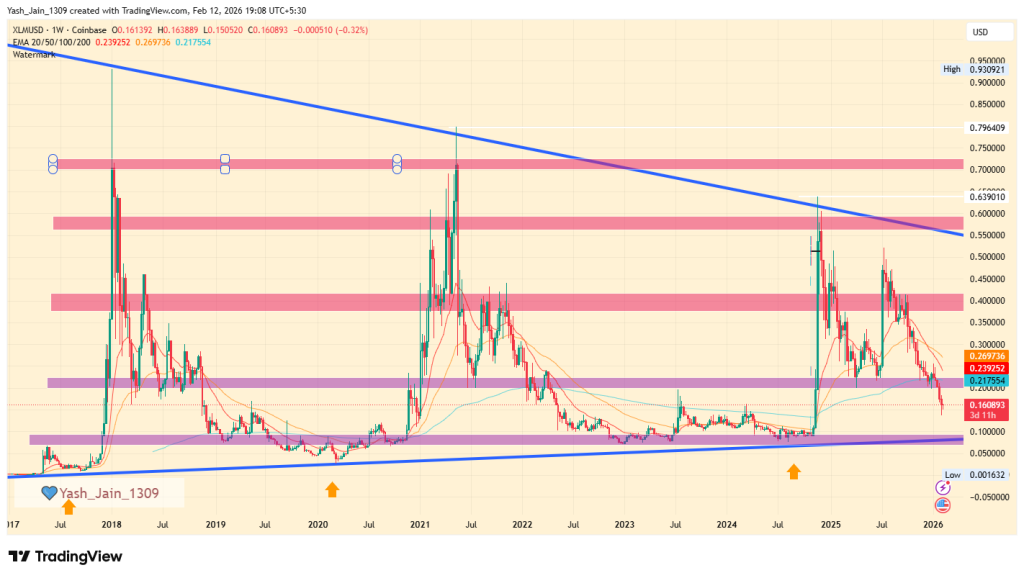
XLM price has fallen below $0.20 and is anticipated to decline further. However, it may experience a strong rebound at $0.10, with the potential to reach $0.57 by mid-2026, representing a 150% gain. If XLM/USD surpasses the $0.57 mark, it could reach a new all-time high of approximately $2.00, which would be an 800% increase.
Stellar Price Prediction 2026
XLM has dropped below $0.20 by the end of January, continuing from where December left off, but it is all happening inside an established 9-year-old symmetrical triangle pattern that is tightening its price movements each year, and 2025 played a decent role in compressing the coil tighter. For now, the bleeding trend suggests a potential decline towards $0.10, aligning with the lower boundary of this triangle.
However, there is a strong possibility for a rebound from this lower edge. By the first half of 2026, projections indicate that XLM/USD could surge to $0.57, which will represent a minimum gain of around 150% as it tests the upper boundary of the symmetrical triangle.
If this scenario unfolds, we could see a remarkable year-end with a new all-time high (ATH) around $2.00, reflecting an impressive 800% growth from current levels. This is likely, as a breakthrough beyond $0.57 would signal a significant breakout from the pattern, with $1.00 as the initial target on the path to that $2.00 milestone.
XLM Long-Term Price Prediction 2027-2030
Year
Potential Low ($)
Average Price ($)
Potential High ($)
2027
2.15
2.26
2.90
2028
2.76
3.56
4.36
2029
3.49
4.67
4.85
2030
4.01
5.60
6.19
XLM Price Prediction 2027
The Stellar price may continue its bullish run in 2027, potentially reaching a high of $2.90. On the other hand, the low could be around $2.15, with an average price of $2.26.
XLM Stellar Price Prediction 2028
The XLM Stellar price may trade within the range of $2.76 and $4.36 during the year 2028, with an average price of $3.56.
XLM Coin Price Analysis 2029
This altcoin may surpass $4.50 and reach a high of $4.85 in 2029. Conversely, if the bears dominate the market, it could hit a low of $3.49, with an average price of $4.67.
Stellar Price Prediction 2030
By 2030, the XLM price may achieve a new all-time high of $6.19. However, it could hit a low of $4.01, with an average price of $5.60.
Never Miss a Beat in the Crypto World!
Stay ahead with breaking news, expert analysis, and real-time updates on the latest trends in Bitcoin, altcoins, DeFi, NFTs, and more.
FAQs
What is Stellar (XLM) price prediction for 2026?
XLM could reach $0.57 by mid-2026, with a potential all-time high of $2.00, reflecting strong bullish momentum.
What Is XLM Price Prediction For 2027?
XLM may continue its bullish run in 2027, potentially reaching a high of $2.90, with average levels around $2.26.
How high will XLM go in 2030?
By 2030, XLM could hit a new all-time high of $6.19, depending on adoption, demand, and market conditions.
How much will XLM be worth in 10 years?
XLM could be worth $6 or more in 10 years if growth trends and cross-border adoption continue.
Is Stellar (XLM) a good investment in 2026?
XLM shows strong bullish patterns and growth potential, but investors should consider market volatility before buying.
How does XLM compare to other altcoins?
XLM stands out for fast, low-cost payments and long-term growth potential, supported by reliable technical and adoption trends.
Can XLM recover from its 2025 lows?
Yes, historical trends and technical setups suggest XLM could rebound from $0.20, potentially reaching $2 in 2026.
With innovation in cross-chain derivatives and rising on-chain activity, MYX could reach $30 by 2026 and up to $50 by 2030 if similar momentum continues.
MYX surged over 20,000% from June lows to September highs, making it one of the year’s best performers.
MYX Finance is positioning itself as a next-generation decentralized perpetual futures exchange, targeting traders who want on-chain transparency without sacrificing leverage and execution speed.
As centralized exchanges face increasing regulatory pressure, perpetual DEXs like MYX are attracting users looking for non-custodial alternatives.
While the overall cryptocurrency market is under pressure, MYX Finance’s native token (MYX) is moving in the opposite direction. The token jumped around 15% in the last 24 hours, trading near $3.5, even as Bitcoin, Ethereum, and most altcoins slipped lower.
At a time when overall market sentiment remains weak, MYX’s strong price action has turned heads. Making investors curious about the token growth, wondering what the future will be for these tokens.
With that in mind, let’s take a closer look at our MYX Finance (MYX) price outlook for 2026 to 2030.
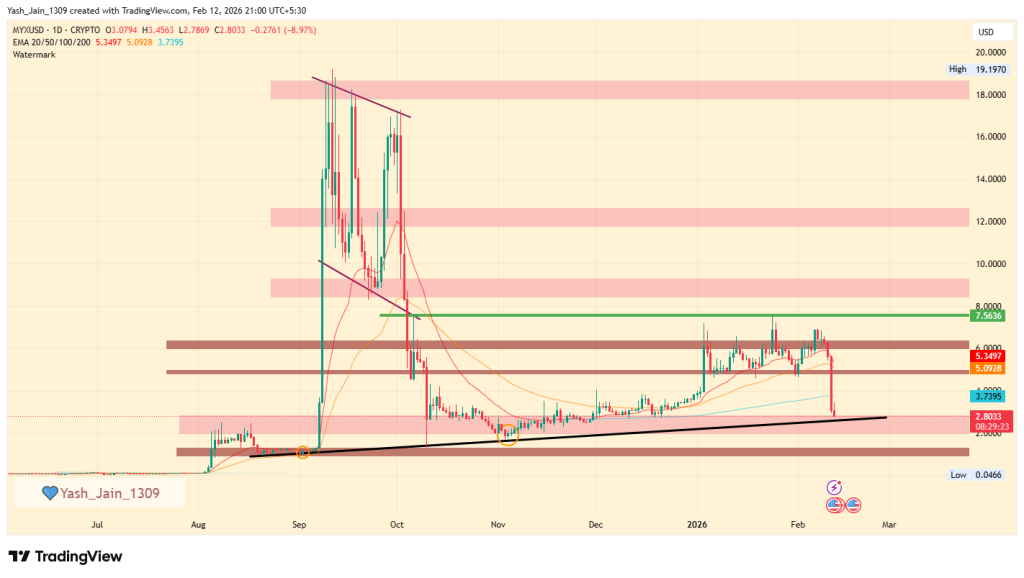
MYX price showed strong bullish momentum, surging to $7.56 in January but faced resistance. A retreat to around $3.00 highlights a possibility for demand to rise again and enable a rebound. Key resistance is at $7.56; surpassing it may lead to $9.0 by late February 2026. If not, a retest of $3.00 could result in a slower recovery throughout the year.
What is MYX Finance?
MYX Finance is known as a decentralized futures exchange designed to make derivatives trading more accessible, efficient, and user-friendly to the people who want’s to trade.
Unlike other traditional platforms, MYX incorporates a uniquely brought Chain-Abstracted Wallet that allows traders to move seamlessly across blockchains without manual bridging.
Its simplicity has an innovative two-layer account model that ensures users maintain custody of funds while enabling gasless transactions through a relayer network.
The another highlights that makes MYX more attractive is that this exchange supports leverage of up to 50x with zero slippage, powered by its matching pool mechanism. This enhances efficiency and reduces trading risks.
MYX Finance (MYX) Price Prediction 2026
The consolidation in Q4 2025, followed by a remarkable surge to $7.56 in January, underscores the strong bullish momentum we observed in MYX. Although the last week of January encountered some resistance, it appears poised to approach the ascending trendline support. The $5.00 support level has already been breached, and a retreat to the trendline around $3.00 could set up a robust rebound in the weeks ahead.
Typically, markets do not crash or recover in just one direction; such patterns usually arise only in the presence of strong manipulation. Given MYX crypto’s previous history of pump-and-dump schemes, still investor must remain vigilant for another incident like that could threaten its long-term credibility. Nevertheless, a healthy recovery from this juncture seems highly probable and is anticipated to progress steadily from this support.
The most critical resistance level is currently at $7.56. If this level is surpassed and maintained, we could witness prices soar to $9.0 before the end of February 2026, with a realistic chance of revisiting the ATH by the end of the quarter. Conversely, if the market experiences a downturn, February may bring a retest of the trendline at around $3.00, leading to a longer recovery throughout the year.
Fundamental Growth and Ecosystem Strength Stay Unaffected
With the October crash, many are thinking MYX is done for, but it’s the exact opposite because the price action might not be supporting now due to macro factors, but fundamentals have never been better.
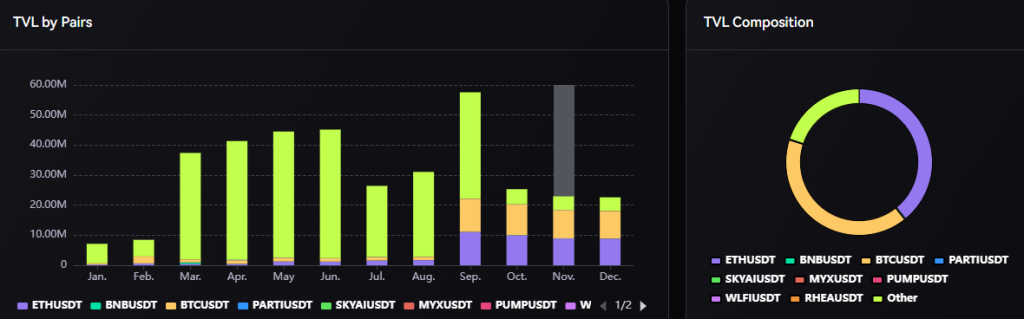
As MYX Finance’s explosive growth is firmly rooted in robust on-chain fundamentals, moving beyond mere speculation. The platform has demonstrated consistent and significant expansion in user activity, evidenced by its surging monthly trading volume. This volume more than doubled during the year, climbing from $51 billion in January 2025 to $128.43 billion by late December.
Also, Earnings have more than doubled in the same period, jumping from $18 million to $57.45 million.
Apart from this, the TVL has taken a strong hit to a previous explosive growth to nearly $58 million by September, but by December, it has crashed down to $22.60 million.
If this momentum continues, MYX Finance could shed more TVL. However, if its adoption increases with MYX showing any price catalyst, its TVL could regain its lost levels once again in 2026.
MYX Finance Price Prediction 2026 – 2030
Year
Minimum Price
Average Price
Maximum Price
2026
$10.50
$18.00
$30.00
2027
$12.00
$24.50
$37.00
2028
$15.50
$29.00
$42.00
2029
$19.00
$35.00
$46.00
2030
$21.00
$38.00
$50.00
What Does The Market Say?
Year
2026
2027
2030
CoinCodex
$9.50
$14.99
$40.87
Pricepredictions
$6.3
$11.8
$28.09
DigitalCoinPrice
$7.41
$18.71
$37.75
Never Miss a Beat in the Crypto World!
Stay ahead with breaking news, expert analysis, and real-time updates on the latest trends in Bitcoin, altcoins, DeFi, NFTs, and more.
FAQs
What is MYX Finance and how does it work?
MYX Finance is a decentralized perpetual futures exchange offering up to 50x leverage, gasless trades, and non-custodial accounts across blockchains.
Is MYX Finance a good long-term investment?
MYX’s long-term potential depends on trader adoption, platform reliability, and growth of decentralized derivatives markets through 2026–2030.
What is the MYX price prediction for 2026?
For 2026, MYX is projected to trade between $2.8 and $10.44, depending on user growth, market conditions, and protocol performance.
Can MYX reach $40 or higher by 2030?
If MYX becomes a major on-chain derivatives platform with strong liquidity and revenue, long-term forecasts suggest prices near $40–$48 by 2030.
Predictions suggest PUMP could reach $0.01 in Q1 2026.
Long-term forecast sees PUMP reaching $0.22 by 2030 in a moderate scenario.
PUMP.fun (PUMP), a utility coin launch platform for launching Solana-based memecoins with its viral “no-code” model that makes token creation easy for everyday users.
By making token launches easy and viral, it has disrupted how traditional Web2 social platforms work. At the same time, lower costs and fewer technical barriers have attracted many first-time users who were earlier unable to experiment on-chain.
As memecoin launches continue to rise, investors are now asking whether PUMP.fun can move beyond hype and become a lasting part of the crypto ecosystem.
With that in mind, let’s take a closer look at our PUMP. fun (PUMP) price outlook for 2026 to 2030.
In 2025, the PUMP price peaked at $0.0089 but then fell sharply. By Q1 2026, it recovered from $0.001750 to $0.003310 before dropping back to $0.001750 again. A falling wedge pattern suggests a potential rally to $0.00500 by Q2 2026 is possible only if $0.003310 is taken down.
PUMP Price Prediction 2026
In 2025, the price movement was fantastic, falling short by only 15% of its goal of $0.0100 from its last ATH of $0.0089 set in mid-September 2025. After failing to move past $0.0089, it fell sharply. Many were scared by the fall from investors to enthusiasts, but by the end of 2025, what recovered hope was the formation of a falling wedge pattern, characterized by converging upper and lower boundaries that had notably narrowed.
Recently, the price of PUMP in 2026 Q1 has recovered from $0.001750 to $0.003310, mostly in January, but in February has declined back to $0.001750, in the demand area. The price action has formed a falling wedge, and it is much closer to the upper border of this pattern.
Now, in Q1’s remaining days, getting to $0.003310 is flipped; by Q2 2026, we could see a rally to the $0.00500 mark.
Pump. fun (PUMP) On-Chain & Supply Dynamics Analysis
Amidst market fluctuations, Pump.fun is actively reinvesting a substantial portion of its platform revenue to repurchase PUMP tokens each day. To date, this commitment has led to the buyback of an impressive $254.93 million worth of PUMP tokens, resulting in a meaningful reduction of 19.98% in the total circulating supply.
Despite recent market volatility, its dedication to daily buybacks has remained in the 95-106% range compared to the previous day’s purchases. This consistent reduction in available supply lays a solid foundation for potential price appreciation.
As market sentiment begins to shift positively, we anticipate that the decreased supply will significantly enhance the forthcoming wave of FOMO, which may propel the PUMP price to new heights.
PUMP.fun Price Prediction 2026 – 2030
Year
Potential Low ($)
Potential Average ($)
Potential High ($)
2026
$0.0019
$0.0036
$0.0053
2027
$0.0026
$0.0050
$0.0091
2028
$0.0039
$0.0075
$0.0142
2029
$0.0056
$0.0134
$0.0259
2030
$0.0088
$0.0260
$0.0430
PUMP.fun Price Prediction 2026
The PUMP market outlook suggests a steady climb toward an average of $0.0190 as platform adoption expands. Traders eyeing a PUMP breakout could see highs hitting $0.0230 if bullish momentum sustains throughout the year.
PUMP.fun Price Prediction 2027
According to the latest PUMP growth forecast, the token is expected to find a strong floor at $0.0250. Aggressive PUMP accumulation could propel the valuation to a high of $0.0440 as the Solana DeFi ecosystem matures.
PUMP.fun Price Prediction 2028
The PUMP value projection for 2028 highlights a significant rally, with an average trading price of $0.0680. Market analysts anticipate a PUMP surge toward $0.0810, driven by increased utility and token buyback mechanisms.
PUMP.fun Price Prediction 2029
A conservative PUMP target estimation places the low at $0.0650, while the average price aims for the $0.0950 milestone. The PUMP trajectory looks increasingly parabolic, with potential high-end targets reaching $0.1300 during peak market cycles.
PUMP.fun Price Prediction 2030
The long-term PUMP future trajectory indicates a massive leap, potentially reaching a psychological high of $0.2200. With an average PUMP price of $0.1500, the token is positioned to become a dominant asset in the meme-coin launchpad sector.
What Does The Market Say?
Year
2026
2027
2030
CoinCodex
$0.0061
$0.0037
$0.0072
pricepredictions
$0.0075
$0.0109
$0.0236
Suncrypto
$0.0035
$0.0065
$0.0350
CoinPedia’s PUMP.fun Price Prediction
After careful analysis, Coinpedia believes PUMP.fun’s long-term value depends more on steady creator activity than short-term hype. If the platform grows from a viral trend into a well-structured launch ecosystem, the token could perform better than expected.
If memecoin interest continues to rise, the PUMP token could climb above $0.0430 by 2030.
Year
Potential Low ($)
Potential Average ($)
Potential High ($)
2026
$0.0019
$0.0036
$0.0053
Never Miss a Beat in the Crypto World!
Stay ahead with breaking news, expert analysis, and real-time updates on the latest trends in Bitcoin, altcoins, DeFi, NFTs, and more.
FAQs
What is PUMP.fun and how does it work?
PUMP.fun is a no-code Solana platform that lets anyone launch memecoins easily, making token creation fast, low-cost, and accessible to first-time users.
What is the PUMP price prediction for 2026?
PUMP is projected to trade between $0.012 and $0.023 in 2026, with an average near $0.019 if buybacks and adoption remain strong.
Can PUMP.fun reach $0.04 or higher by 2030?
It’s possible if PUMP.fun becomes a lasting memecoin infrastructure platform with steady demand, strong revenues, and sustained retail adoption.
Is PUMP.fun (PUMP) a memecoin or a utility token?
PUMP is a utility token tied to the PUMP.fun platform, benefiting from user activity, token launches, and buyback mechanisms rather than pure meme hype.
Is PUMP.fun a good long-term investment?
PUMP.fun may suit high-risk, long-term investors who believe in creator-driven crypto platforms, but price depends on real usage, not short-term hype.
Price prediction for 2026 targets $0.85, with potential highs of $3.50.
The Pi coin price forecast for 2030 highlights a price target as high as of $22.00
Pi Network’s vision of mobile-based crypto mining attracted millions worldwide, making it a standout community-driven project. However, its lack of exchange listings, limited liquidity, and minimal real-world integration now challenge its sustainability.
As the broader crypto landscape shifts toward utility-based projects and DeFi innovation, Pi Coin struggles to maintain relevance. As a reason, the PI price faced a seamless fall. While social and Google search curiosity still remains high, especially with growing searches like “1 Pi to INR” and “1 Pi to PKR,” the absence of strong fundamentals keeps Pi price recovery uncertain.
This is leaving investors questioning whether this once-hyped token can ever reclaim its lost glory. As a result, the current period aligns perfectly with the current year’s calendar to change soon, making people intrigued towards the PI price prediction for 2026-2030.
Pi’s price fell to $0.1297, signaling a lack of momentum and making it less appealing than memecoins. The outlook for 2026 is grim, but if PI team comes up with a new strategy that could help. While the bear market has hurt all altcoins, there’s cautious optimism for recovery if the broader market improves.
PI Price Prediction 2026: Potential Scenarios for a Reversal
Pi’s price was firmly within its current consolidation range of $0.19-$0.28, but Pi’s price in January failed to trade within this range and marked a new low of $0.1297.
This means momentum is not returning in PI’s price, and it has become more of a dead asset for now, as investors consider it worse than memecoins.
The PI price prediction for 2026 indicates a rough outlook, but things would have been better if it had stayed in that range. Since it has already breached the lower end, the recovery chances have slimmed further. However, if it comes with a new plan to revive its ecosystem, this strong possibility could turn around the dying momentum it’s seeing.
Despite the challenges faced in December 2025 and since then, when the bear market suppressed momentum across the entire crypto sector, we’ve observed that no altcoin has managed to stage the anticipated rally. This was largely due to a lack of liquidity, with new investors still cautious, leaving many feeling apprehensive about the power of the bears.
However, the outlook for 2026 is optimistic for the sector, and if it flourishes, maybe PI could get a few drops of liquidity, too. Confidence is lower due to Q1 2026, but if the broader market improves, the odds of a substantial rally may increase.
Pi Coin Price Targets 2026 – 2030
Year
Potential Low ($)
Potential Average ($)
Potential High ($)
2026
$0.85
$2.25
$3.50
2027
$1.25
$3.25
$5.25
2028
$2.00
$5.50
$8.50
2029
$3.50
$8.50
$13.75
2030
$5.50
$13.75
$22.00
Pi Crypto Price Forecast 2026
The Pi crypto prediction for the year 2026 could range between $0.85 to $3.50. Considering the buying and selling pressure, the average price could be around $2.25 for that year.
Pi Coin Price Prediction 2027
During 2027, the Pi network value could reach a maximum trading value of $5.25 with a potential low of $1.25. Evaluating the market sentiments, the average price of this altcoin could settle at around $3.25.
Pi Token Price Projection 2028
By 2028, the value of a single Pi coin price could reach a maximum of $8.50 with a potential low of $2.00. With this, the average price could land at around the $5.50 mark.
Pi Network Price Analysis 2029
Looking forward to 2029, the Pi coin Price may range between $3.50 and $13.75, and a potential average value of around $8.50.
Pi Network Price Prediction 2030
As per our Pi Coin Price Prediction 2030, the Pi coin value in 2030 could reach a high of $22.00. However, the viral altcoin could record a low of $5.50 and an average price of $13.75, if the crypto market turns bearish.
Market Analysis
Firm Name
2025
2026
2030
CoinCodex
$ 2.08
$ 1.48
$ 2.63
priceprediction.net
$1.08
$1.61
$6.74
DigitalCoinPrice
$107.98
$125.57
$265.95
*The aforementioned targets are the average targets set by the respective firms.
Conclusion
The Pi Network’s recent developments—from major token accumulation and Banxa integration to Binance listing rumors—are clear indicators that Pi is no longer just a test project. As market conditions turn favorable and institutional interest grows, Pi Coin is entering a new phase of maturity.
Never Miss a Beat in the Crypto World!
Stay ahead with breaking news, expert analysis, and real-time updates on the latest trends in Bitcoin, altcoins, DeFi, NFTs, and more.
FAQs
Will Pi Network price recover in 2026?
Pi may recover in 2026 if liquidity improves, exchange listings expand, and overall crypto market sentiment turns bullish.
What is the Pi price prediction for 2026?
Pi price prediction for 2026 suggests a range between $0.85 and $3.50, depending on adoption progress and market momentum.
Can Pi Coin reach $1 again?
Yes, Pi can reach $1 if buying demand strengthens and the token breaks out of its long-term consolidation range.
What is the Pi Network price prediction for 2030?
Pi Network price prediction for 2030 targets a potential high near $22.00 if ecosystem growth and real-world utility improve.
Is Pi Coin a good long-term investment?
Pi carries high risk due to limited utility and listings, but long-term upside depends on successful integration and network adoption.
The live price of the Near Protocol token is $ 0.98073309.
Price predictions for 2026 range from $3.70 to $11.80.
NEAR price may reach a high of $71.78 by 2030.
As altcoin momentum intensifies, Near Protocol (NEAR) is rapidly emerging as a standout contender in the crypto space. Fueled by strong fundamentals and recent bullish market trends, NEAR’s rise has caught the attention of both retail and institutional investors.
With NEAR now bridging to Solana and TON via Chain Signatures, the future looks promising. Wondering where it’s headed next? Dive into our in-depth NEAR Price Prediction 2026 – 2030 to uncover the possibilities.
In early 2026, NEAR protocol fell below $1.0 but is now above the demand zone, signaling a potential investment opportunity as demand is expected to rise.
NEAR Price Prediction 2026
In early 2026, the NEAR protocol price slipped below $1.0 mark. Now in Q1 2026, it trades near the late Q4 2023 support area.
This demand zone that previously sparked a rally in late 2023. This zone marks a key moment for price action to retest this demand area after two years.
With demand for NEAR/USD projected to surge from this point forward, the rest of the first quarter of 2026 presents a well-defined strategic entry opportunity for investors.
NEAR On-Chain Analysis
NEAR has officially entered a high-conviction Taker Buy Dominant Phase as of January 2026. The 90-day Spot Taker CVD flipping from neutral to green confirms that aggressive market buyers are now absorbing liquidity faster than sellers, signaling a major return of organic demand.
This bullish on-chain shift, bolstered by Grayscale’s recent spot ETF filing and a supply-tightening inflation cut, highlights growing institutional confidence. NEAR is currently building the structural momentum necessary to challenge key recovery targets near $2.00-$2.10.
Near Protocol Price Prediction 2026 – 2030
Year
Potential Low ($)
Potential Average ($)
Potential High ($)
2026
3.70
7.75
11.80
2027
5.32
11.80
18.28
2028
7.91
18.28
28.65
2029
12.06
28.65
45.24
2030
18.70
45.24
71.78
NEAR Crypto Price Prediction 2026
According to our analysts, Near Protocol’s price projection, the price could range between $3.70 and $11.80, with an average trading price of around $7.75.
Near Protocol (NEAR) Price Prediction 2027
Looking forward to 2027, NEAR’s price could range between $5.32 and $18.28, and an average forecast price of $11.80.
Near Protocol Crypto Price Prediction 2028
In 2028, the price of a single Near Protocol token could range between $7.91 and $28.65, with an average price of $18.28.
NEAR Price Prediction 2029
By the end of 2029, NEAR’s price could range between $12.06 as its low and $45.24 as its high, with an average trading price of $28.65.
Near Protocol Price Prediction 2030
In 2030, Near Protocol price may touch its lowest price at $18.70, hitting a high of $71.78 and an average price of $45.24.
What Does The Market Say?
Firm Name
2025
2026
2030
Wallet Investor
$3.19
$4.40
$22.30
priceprediction.net
$3.98
$5.92
$28.62
DigitalCoinPrice
$5.95
$6.93
$14.80
*The targets mentioned above are the average targets set by the respective firms.
Never Miss a Beat in the Crypto World!
Stay ahead with breaking news, expert analysis, and real-time updates on the latest trends in Bitcoin, altcoins, DeFi, NFTs, and more.
FAQs
What Is Near Protocol?
The protocol promotes the network of computers running a platform for developers to create and launch dApps.
How much is 1 Near Protocol Coin worth?
At the time of writing, the price of 1 NEAR was $ 0.98073309.
What is the NEAR price prediction for 2026?
NEAR price forecasts for 2026 suggest a range between $3.70 and $11.80, depending on adoption growth and market momentum.
What is the NEAR Protocol price prediction for 2030?
NEAR Protocol price prediction for 2030 points to a potential high near $71.78 if long-term adoption and ecosystem growth continue.
Is NEAR Protocol a good long-term investment?
NEAR offers long-term potential due to its scalable design, developer adoption, and cross-chain expansion, but price volatility remains.
What factors influence NEAR price the most?
NEAR price is driven by ecosystem growth, network activity, market liquidity, investor sentiment, and overall crypto market trends.
The Ethereum price keeps falling, despite supply on Binance keeps shrinking. Normally, declining exchange reserves are bullish and many immediately speculate for a rally. Coins leave exchanges, sell pressure drops, price rises. That’s the textbook theory.
But markets don’t care about textbooks, it works in a more twisted way and ordinary textbook theories don’t always work and ETH not going up is clear evidence of this.
Right now, the Ethereum price sits near $1908 with fading momentum, moving averages weakening after a bearish crossover on both long-term and shortterm spans, and downside pressure refusing to let up. So what’s overpowering the shrinking exchange supply narrative?
Shrinking Binance Reserves Explained
Binance’s ETH exchange reserve is trending downward again. That means ETH is being withdrawn. Under normal spot-driven conditions, that’s constructive theoretically.
As, less ETH on exchange typically means fewer coins readily available for sale.
Well, here’s the catch: spot dynamics don’t dominate short-term price action anymore. Infact, Derivatives do as they have strong leverage support from exchanges that covers up spot activity in short term.
And that is what changes everything. Since, exchange reserve data reflects spot supply. But the Ethereum price chart is currently reacting more to futures positioning than to on-chain withdrawals.
If open interest is elevated, funding rates has turned negative, and traders are leaning heavily short, aggressive derivatives selling can drag Ethereum/USD lower. That’s why even if spot supply is shrinking. In that scenario, futures pressure simply overwhelms spot optimism. And that appears to be what’s happening.
Withdrawals Don’t Always Mean Holding
But, still knowing what futures activities are capable of, then let’s be real. This clearly implies that withdrawals aren’t automatically bullish accumulation anymore and theories like these are not certain indicators anymore.
Also, withdrawals also implies that ETH can leave Binance for DeFi collateral use, staking, Layer-2 activity, OTC transactions, or even transfers to other exchanges. A decline in Binance reserves doesn’t guarantee coins are locked away long term. That’s a very practical and logical thing to assume at this point about exchange reserve metrics. As Global sell pressure can still persist elsewhere.
So, shrinking supply on one exchange doesn’t necessarily mean shrinking supply everywhere.
Weak Demand and Macro Drag
Here’s another inconvenient truth, as a reduced exchange supply isn’t enough without demand presence.
In the crypto sector this demand comes from stablecoins inflows. If these are weak, then risk appetite is low, or broader market sentiment is negative, as a result ETH price won’t respond positively. In this mix, if we add macro correlation into the mix then it complicates the outlook even more bleak.
Like, if broader crypto is soft or risk markets are under pressure, then reserve signals can be completely overridden.
There’s also the possibility that large players are playing both sides: withdrawing spot ETH while opening short positions in derivatives. Strategic hedging Or positioning for lower levels.
So What’s Next For Ethereum price?
If derivatives pressure continues and liquidity gets cleared to the downside, Ethereum price prediction models increasingly point toward a deeper support retest, potentially in the $1,700 region. That doesn’t invalidate long-term structure but it does suggest pain could come first.
For now, the Ethereum price remains under pressure despite falling Binance reserves, proving once again that in this market, supply signals alone don’t move charts but positioning does.
Today, the MYX price didn’t just dip; it showed a brutal long squeeze that triggered around 50% collapse, wiping out overheated positioning in a short amount of time and sending liquidation data flashing red across derivatives dashboards.
According to Coinglass, total liquidations rekt over the past 24 hours reached $615.96K. Longs took the real hit $527.13K flushed, while shorts accounted for just $88.83K. That imbalance tells a clear story of a token dump. This wasn’t a balanced deleveraging; it seemed like a strategic one-sided unwind to extract most of the profits.
Liquidations Tell the Story in MYX Price
When long liquidations outweigh shorts nearly five to one, it usually means traders were leaning too hard in one direction.
The onchain data confirms that they truly were leaning too much on the bullish side. Per Santiment’s data, the MYX price had previously pushed the MVRV Z-Score to 4.731, which seemed to be in a danger zone, as this metric had been rising and hadn’t risen much beyond 4.731 which showed that was the limit of previous bullish rise.
That reading suggests market value had detached sharply from holders’ cost basis. In simpler terms, there were too many paper profits and markets covered that gap by this dump. As there was too much heat.
As a reason, the Z-score collapsed to 2.309 alongside a 50% price drawdown and surging volume. That’s not random volatility, in fact, the data points out that’s a violent shift from speculative euphoria to something closer to fair value. Massive unrealized gains got flushed out. Weak hands exited under pressure. Supply changed hands.
Well, here’s the kicker: that kind of washout can either mark the end for crypto or the reset before a base forms. Based on what the MYX price chart displays, it seems it is more interested in developing a base around $2.50-$3.00, aligning with an ascending trendline that’s been present for months.
MVRV Reset in Motion
A drop from 4.731 to 2.309 doesn’t scream bullish continuation, but it doesn’t scream structural death either. Historically, extreme Z-scores leave little room for sustainability. Pullbacks are common.
Now the market sits in a more neutral-bullish range, at least statistically speaking.
And that spike in volume during the drawdown? Classic capitulation behavior. It often accompanies panic-driven exits. But let’s be real, it also signals the market has aggressively repriced risk.
$3 Support Under Pressure
Technically, the MYX price chart shows the collapse reaching an ascending trendline support near $2.50-$3.0. That level matters. So far, it’s holding at CMP at $2.65, when writing.
But, If $3.0 breaks decisively, downside toward $1.0 becomes a realistic extension of the bearish outlook. No sugarcoating that. However, if consolidation builds around current levels and demand gradually returns, the foundation for recovery could form.
The MYX price prediction now hinges on whether this support becomes accumulation or surrender.
Utility Concerns Emerge
And then there’s the uncomfortable detail. Lower daily exchange activity appears to have played a role too in a recent dump. Because, MYX’s utility is driven by trading activity on its platform. Recent dashboard data shows declining open interest across key pairs like BTC/USDT and ETH/USDT.
Less activity. Less utility demand. Investors noticed and they basically dumped.
So while the long squeeze triggered the collapse, slowing exchange momentum may have lit the fuse. Whether that trend stabilizes could determine what happens next for MYX price.
Price predictions for 2026 range from up to $4.18.
Long-term forecasts suggest potential highs of $35.60 by 2030.
WLD price was almost $12 ATH but went crashing to $0.50 in the last remaining days of 2025. This has raised concerns among investors and traders about WLD’s future, and as a result, the Worldcoin price prediction 2026 has become a topic of significant discussion, with many being intrigued about its prospects in the coming year.
Its prolonged period of downtrend has left many wondering if the project’s initial buzz was fading. But, behind the scenes, Worldcoin is still quietly building its platform. Now, experts view Q1 2026 as a potential turning point where renewed momentum could be observed.
So many are now asking a crucial question: is this the start of a new chapter for Worldcoin? Will the project’s focus on decentralized identity and its connection to the AI sector be enough to fuel a powerful comeback and reclaim its spot in the market spotlight?
Let’s delve into the anticipated Worldcoin price predictions 2026 to 2030 and the years to come.
Entering 2026, in a bleeding state, wasn’t so sympathetic, as investors didn’t buy back at discounts; as a result, January and even February fell, slipping to $0.27 in February.
However, if the critical support at $0.31 fails to hold, the price may undergo further sideways stagnation or a retest of its floor near $0.24.
Worldcoin Price Prediction 2026
As 2026 dawned, the market found itself in a precarious position, struggling to regain its footing. Investor sentiment remained lackluster, with many refraining from seizing opportunities even as prices dipped to massive discounts. Consequently, the downward trend persisted into January and even February, with the price plummeting to a low of $0.27 by mid-February.
The situation remains precarious; should the crucial support level at $0.31 fail to withstand selling pressure, the price may not only linger in a phase of stagnation but could also reattempt a dip towards its critical floor around $0.24.
WLD On-Chain Analysis
The WLD Spot Average Order Size chart reveals persistent green clusters into January 2026, indicating sustained “Big Whale” participation. This heavy institutional accumulation suggests that smart money is aggressively building positions, viewing the current price range as a high-conviction entry point.
Similarly, development activity on Worldcoin is surging to new local highs in January 2026, showcasing intense builder commitment. This spike in innovation, combined with whale interest, creates a powerful fundamental divergence that historically precedes a massive price reversal.
WLD Price Forecast 2026 – 2030
Year
Potential Low ($)
Average Price ($)
Potential High ($)
2026
2.50
6.00
9.50
2027
7.00
11.25
15.70
2028
10.75
15.95
21.15
2029
15.65
21.60
27.50
2030
19.75
27.75
35.60
This table, based on historical movements, shows Worldcoin price to reach $35.60 by 2030 based on compounding market cap each year. This table provides a framework for understanding the potential Worldcoin price movements. Yet, the actual price will depend on a combination of market dynamics, investor behavior, and external factors influencing the cryptocurrency landscape.
Worldcoin Price Forecast 2026
Worldcoin’s price for 2026 is projected to range between $2.50 and $9.50, with an average price of approximately $6.00.
WLD Price Prediction 2027
Worldcoin’s price for 2027 is expected to fluctuate between $7.00 and $15.70, with an average price of around $11.25.
Worldcoin Price Forecast 2028
Worldcoin’s price for 2028 is anticipated to be between $10.75 and $21.15, with an average price of about $15.95.
WLD Token Ai Price Forecast 2029
Worldcoin’s price for 2029 is projected to vary from $15.60 to $27.50, with an average price of roughly $21.60.
Worldcoin AI Token Price Prediction 2030
Worldcoin’s price for 2030 is expected to fluctuate between $19.75 to $35.60, with an average price of approximately $27.75.
Market Analysis
Firm Name
2026
2030
Swapspace
$1.30
$2.07
coincodex
$2.40
$4.30
DigitalCoinPrice
$3.02
$4.06
*The targets mentioned above are the average targets set by the respective firms.
Never Miss a Beat in the Crypto World!
Stay ahead with breaking news, expert analysis, and real-time updates on the latest trends in Bitcoin, altcoins, DeFi, NFTs, and more.
FAQs
What is Worldcoin?
Worldcoin is a cryptocurrency project aiming to distribute digital assets to a global audience through a unique identity-verification system.
What is the current price of 1 Worldcoin?
At the time of writing, the price of one WLD token was $ 0.00349731.
What is the Worldcoin price prediction for 2026?
WLD price forecasts for 2026 suggest a potential range between $2.50 and $9.50, depending on market recovery and technical breakouts.
What is the Worldcoin price prediction for 2030?
Long-term models suggest WLD could trade from about $19.75 to $35.60 by 2030 under bullish conditions.
What is the Worldcoin price prediction for 2040?
While speculative, extended growth forecasts envision potential for WLD beyond 2040 based on adoption and tech use cases.
Is Worldcoin a good long-term investment?
Worldcoin offers long-term potential due to its focus on decentralized identity and AI, but it remains volatile and requires risk awareness.
What factors influence WLD price the most?
WLD price is driven by AI narrative strength, user adoption, token supply dynamics, market sentiment, and overall crypto market trends.
The live price of the MANA crypto token is $ 0.10038550.
Price predictions for 2026 range from $0.247 – $0.40.
By 2030, the MANA price could surge toward $4.90 due to growing trader activity.
Decentraland (MANA) is one of the earliest and most recognizable names in the metaverse sector. Built on Ethereum, Decentraland allows users to own virtual land, create experiences, and participate in a digital space using its native token, MANA.
While the overall metaverse narrative has cooled since its 2021 peak, Decentraland continues to maintain an active ecosystem focused on virtual events, social experiences, and creator-led development.
If you’re curious about Decentraland’s future and wondering whether MANA is a good investment, this MANA price prediction 2026–2030 will walk you through its potential growth and long-term outlook.
MANA cryptocurrency has experienced a 98% decline since the FTX crash in 2021. However, it is showing remarkable resilience. The critical support level established in early 2021 is essential. If MANA can rise and close above $0.35 in the first quarter of 2026, it could set the stage for an impressive 1,000% increase, making a $1.00 target price for the year not just possible, but highly attainable.
Decentraland (MANA) Price Prediction 2026
MANA crypto’s multi-year performance chart reflects a dramatic 98% decline since the FTX crash in 2021, leading many enthusiasts and investors to speculate about the project’s potential end.
This sharp price depreciation has instilled fear among investors, who have witnessed continuous negative price action for years. However, it is essential to consider the historical support level that has been in place since early 2021, which warrants attention despite the recent stagnation in price movement.
Although the project has experienced considerable setbacks over the past half-decade, there still remain arguments for a potential revival. The primary argument is the avoidance of delisting from several exchanges, indicating that MANA/USD continues to pursue efforts aimed at market recovery and still retains decent liquidity in a project with an over $250 million market cap.
Thus, the current retest of this support level is particularly noteworthy. A reversal at this juncture could result in substantial upward momentum. Conversely, if this support range is breached, it would likely reinforce perceptions of MANA crypto as a failing venture.
That said, it is crucial to closely monitor the $0.35 level. Should MANA successfully breach this level and maintain above it with a weekly close, this would signify a significant “Change of Character” for the price dynamic. Under such circumstances, a conservative target of $1.00 for the year may be warranted.
Price Prediction
Potential Low ($)
Average Price ($)
Potential High ($)
2026
0.95
1.45
1.95
MANA On-chain Analysis
MANA’s exchange reserves have plummeted from 606M to 312M tokens, a massive 48% supply drain signaling aggressive accumulation. This consistent liquidity exit creates a powerful supply-crunch, drastically reducing sell-side pressure and preparing the asset for a significant parabolic breakout as market demand grows.
Furthermore, a bullish transfer of wealth is underway. While retail holders dump their positions, institutional whales holding 10M–1B tokens are absorbing the supply. This shift from weak to strong hands confirms deep conviction among major players, providing a solid floor for MANA’s future growth.
Decentraland MANA Price Prediction 2026 – 2030
Price Prediction Years
Potential Low ($)
Average Price ($)
Potential High ($)
Decentraland (MANA) Price Forecast 2026
0.95
1.45
1.95
MANA Token Price Forecast 2027
1.55
2.15
2.85
Decentraland Price Analysis 2028
2.45
3.05
3.65
Decentraland Price Prediction 2029
3.55
3.95
4.35
MANA Price Prediction 2030
4.15
4.65
5.15
Decentraland (MANA) Price Forecast 2026
According to forecast prices and technical analysis, Decentraland’s price is projected to reach a minimum of $0.95 in 2026. The maximum price could hit $1.95, with an average trading price of around $1.45.
MANA Token Price Forecast 2027
Looking forward to 2027, MANA’s price is expected to reach a low of $1.55, with a high of $2.85 and an average forecast price of $2.15.
Decentraland Price Analysis 2028
In 2028, the price of a single Decentraland is anticipated to reach a minimum of $2.45, with a maximum of $3.65 and an average price of $3.05.
Decentraland Price Prediction 2029
By 2029, Decentraland’s price is predicted to reach a minimum of $3.55, with the potential to hit a maximum of $4.35 and an average of $3.95.
Decentraland (MANA) Price Prediction 2029
In 2030, the MANA coin price is predicted to touch its lowest price at $4.15, hitting a high of $5.15 and an average price of $4.65.
What Does The Market Say?
Year
2026
2027
2030
CoinCodex
$0.26
$0.39
$0.67
Tokenmetrics
$0.78
$1.41
$2.11
DigitalCoinPrice
$0.33
$0.61
$3.32
Never Miss a Beat in the Crypto World!
Stay ahead with breaking news, expert analysis, and real-time updates on the latest trends in Bitcoin, altcoins, DeFi, NFTs, and more.
FAQs
What is Decentraland (MANA) and how does it work?
Decentraland is a virtual world on Ethereum where users buy land, create experiences, and trade using the MANA token.
What is the predicted price of MANA in 2026?
MANA could trade between $0.247 and $0.40 in 2026, with potential upside if it maintains key support and adoption grows.
What is Decentraland’s price prediction for 2030?
By 2030, MANA could reach a high of $4.92, a low of $4.15, and an average price of $4.65, reflecting adoption and growing metaverse use.
How high could MANA price go in 2040?
Over the long term, MANA may see substantial growth if adoption and virtual land demand expand, potentially reaching a high of $12–$15 by 2040.
What drives the price of MANA?
MANA’s price is influenced by virtual land demand, user growth, creator tools, and on-chain activity in Decentraland.
Can Decentraland compete with other metaverse projects?
Yes, if Decentraland expands events, gaming, and creator tools, it could attract more users and remain a top metaverse platform.
Price predictions suggest that ALGO has the potential to hit $0.65 to $1.35 by the end of 2026.
Long-term forecasts indicate potential highs of $5.65 by 2030.
Algorand’s strong push for scalability, security, and decentralization is paying off. With the launch of AlgoKit 3.0 in Q1 2025 and growing developer interest, ALGO adoption has improved and is now on the rise. The rising adoption is beneficial for an asset, as it is directly proportional to a token’s price.
But the big question for intrigued market participants still remains: Can ALGO Price hit $1 this cycle? Read our in-depth Algorand Price Prediction 2025 and long-term outlook through 2030 to find out.
Algorand (ALGO) has been trading sideways since 2022, a stark contrast to its 2021 growth. If demand increases, it could target $0.60 or $0.80 by mid-2026. But, a weekly close at $0.80 may lead to further gains, potentially reaching $2.0 or even $3.0, yielding over 2200% returns.
Algorand February Price Prediction 2026
In January, it lost the $0.1125 support level and fell to $0.0806 by February. Despite a multi-year demand area, the impact has been muted, and February appears likely to trade within this range for an extended period. Based on its price action, if $0.1050 is breached, it could aim for $0.1300 by the end of February. However, if the decline continues, it might slide back to $0.0806 or even lower.
ALGO Price Analysis 2026
Looking ahead through 2026, the secondary indicator chart suggests a cautious recovery rather than an immediate vertical moonshot. Technical indicators like the RSI are hovering in neutral territory (35−45), indicating that while the “extreme fear” has subsided, the momentum is not yet in a full-blown bull regime.
Most analyst models and indicator trends project ALGO to fluctuate between $0.12 and $0.19 for the first half of the year as it tests overhead resistance. If the network’s push into real-world asset tokenization gains traction, a successful breakout above the 200-day SMA could open the door for a year-end target near $0.25 – $0.30.
However, failure to hold the $0.10 support would likely result in further consolidation near the $0.08 all-time low.
AVAX Onchain Outlook
The on-chain outlook for Algorand (ALGO) is flashing bullish signals that suggest a transition from retail-led speculation to institutional-grade accumulation. A notable increase in average order sizes indicates that “whale” investors are actively participating, effectively absorbing supply during consolidation phases to reduce downside risk.
Simultaneously, the 90-day Cumulative Volume Delta (CVD) has entered a “Taker Buy Dominant” phase, which historically correlates with upward price movement as aggressive buyers consistently outpace sellers in the open market. These metrics, paired with a “cooling” spot and futures volume bubble map, suggest the market is moving through a healthy period of stabilization and building the necessary liquidity for a potential breakout.
Algorand Price Targets 2026 – 2030
Year
Potential Low ($)
Potential Average ($)
Potential High ($)
2026
0.65
1.0
1.35
2027
0.90
1.50
2.00
2028
1.40
2.10
2.90
2029
1.75
2.95
4.15
2030
2.50
4.05
5.65
Algorand (ALGO) Price Forecast 2026
Moving forward to 2026, the ALGO price may record a maximum price of $1.35. With a potential low of $0.65, the average price could settle at around $1.0.
ALGO Coin Price Projection 2027
Looking ahead to 2027, the Algorand crypto token may range between $0.90 and $2.0. With this, the average trading price could settle at around $1.50 for the year.
Algorand Crypto Price Action 2028
In 2028, the ALGO coin with a potential surge could reach a high of $2.90, a low of $1.40, and an average of $2.10.
ALGO Token Price Analysis 2029
Moving into 2029, the Algorand coin could range between $1.75 and $4.15. Considering the buying and selling pressure, the average price could settle at around $2.95.
ALGO Price Prediction 2030
By 2030, the value of a single Algorand token could reach a high of $5.65, a low of $2.50, and an average of $4.05.
Market Analysis
Firm Name
2025
2026
2030
Currencyanalytics
$0.67
$0.97
$4.06
Priceprediction.net
$0.18
$0.258
$1.10
DigitalCoinPrice
$0.82
$1.28
$2.60
Never Miss a Beat in the Crypto World!
Stay ahead with breaking news, expert analysis, and real-time updates on the latest trends in Bitcoin, altcoins, DeFi, NFTs, and more.
FAQs
What is the Algorand price prediction for 2026?
Algorand’s price in 2026 is forecasted between about $0.65 and $1.35, with an average near $1 if momentum and adoption improve.
What is the ALGO price prediction for 2027?
In 2027, ALGO may range from $0.90 to $2.00, with an average price around $1.50, depending on market demand and adoption.
How much will Algorand (ALGO) be worth in 2030?
By 2030, ALGO could reach a high of $5.65, a low of $2.50, and an average price of $4.05, reflecting growing adoption.
How much will Algorand be worth in 10 years?
Over the next 10 years, ALGO could reach $5.65 at its peak, driven by network growth, adoption, and real-world asset tokenization.
What factors influence Algorand’s price growth?
Network adoption, scalability, institutional participation, and real-world asset tokenization are key factors driving ALGO’s price potential.
The live price of the Polygon coin is $ 0.21819891.
POL price predictions for 2026 suggest potential highs of $0.7548.
Long-term forecasts indicate POL could reach $4.94 by 2030.
Polygon (POL) has a mind-blowing Layer-2 scaling solution project for Ethereum, which is primarily designed to address slow speeds and the network’s high transaction fees.
As a result, Polygon is seen as a revolutionary framework for developers and users, as it attracts by offering a more efficient Ethereum experience, which is the reason contributing to POL’s price value, too.
Through, POL, which is its native token (formerly MATIC), is utilized for transaction fees and network governance, in the framework of interconnected Ethereum-compatible blockchain networks.
Its use case makes it an attractive altcoin, and even its token POL price is attracting attention. The coin is expected to show a surge in the coming sessions, but it would require a technical eye to understand.
Therefore, if you are curious about whether the POL price can rebound to $1. Will Polygon go up? And is Polygon a good investment? We bring our Polygon Price Prediction for 2025 – 2030 to explore the POL price prediction.
In 2025 and 2026, prices fell, reaching $0.0850 within a narrowing wedge. A breakout above this level could lead to $0.19, $0.30, and $0.42. Without improving sentiment, declines in the POL price may continue.
Polygon Price Prediction 2026
In 2025, we saw notably pessimistic price action, a trend that continued into 2026, with prices following the same downward trajectory.
The price has been moving within a narrowing falling wedge, and by February, it reached $0.0850, which coincides with the lower edge of the channel. This level is crucial for the POL/USD pair because if demand returns, the narrowing range could be broken, potentially allowing a retest of $0.19. A decisive breach above this level would signal a breakout from the falling wedge pattern, opening the way for higher price levels, such as $0.30 and $0.42.
However, if sentiment does not improve as expected, the falling wedge may continue to narrow until it encounters demand. Given the current market drawdown, the likelihood of the POL price continuing to decline remains high.
Year
Potential Low ($)
Potential Average ($)
Potential High ($)
Polygon Price Action 2026 (conservative)
$0.10
$0.26
$0.53
POL On-Chain Analysis
The on-chain landscape for POL is flashing a major recovery signal as the 30-day moving average of Daily Active Addresses (DAA) shows a clear and sustained upward trend in early 2026.
This metric serves as the vital heartbeat of the ecosystem, indicating that organic utility and user engagement are returning to the network at a steady, reliable pace. Unlike temporary spikes that often signal speculative noise, a rising 30-day average suggests a strengthening network effect and a growing demand for blockspace.
For investors, this return of on-chain activity is a fundamental precursor to price appreciation, as it confirms that the ecosystem is not only retaining its base but actively expanding its reach.
Complementing this surge in network activity is a powerful development in supply distribution, specifically within the “whale” and institutional cohorts. Addresses holding between 100,000 and 10 million POL have seen significant growth, signaling a phase of high-conviction accumulation by “smart money.”
This specific bracket often represents mid-to-large-scale investors who lead market cycles by absorbing supply during consolidation phases. This strategic positioning by larger entities reduces sell-side pressure and creates a robust fundamental floor for the asset.
When rising active addresses align with such aggressive whale accumulation, it speaks a definitively bullish language for the POL trajectory, suggesting that the most influential market participants are preparing for a major expansion in value.
Polygon Price Prediction 2026 – 2030
Year
Potential Low ($)
Potential Average ($)
Potential High ($)
Polygon Price Action 2026
$0.18870
$0.47179
$0.75488
POL Price Prediction 2027
$0.30194
$0.75488
$1.20782
Polygon Crypto Price Forecast 2028
$0.48311
$1.20782
$1.93252
POL Coin Price Projection 2029
$0.77297
$1.93252
$3.09205
Polygon Price Prediction 2030
$1.23676
$3.09205
$4.94729
This table, based on historical movements, shows POL price to reach $4.94 by 2030 based on compounding market cap each year. This table provides a framework for understanding the potential POL price movements. Yet, the actual price will depend on a combination of market dynamics, investor behavior, and external factors influencing the cryptocurrency landscape.
Polygon Price Action 2026
Anticipating further expansion, MATIC’s potential high for 2026 is projected to be $0.75488, while the potential low is estimated at $0.18870, resulting in an average price of $0.47179.
POL Price Prediction 2027
MATIC crypto can make a potential high of $1.20782 in 2027, with a potential low of $0.30194, leading to an average price of $0.75488.
Polygon Crypto Price Forecast 2028
As the POL price progresses, the potential high price for 2028 is projected to be $1.93252, with a potential low of $0.48311, resulting in an average price of $1.20782.
MATIC Coin Price Projection 2029
Polygon coin price potential high for 2029 could be $3.09205, while a potential low of $0.77297, with an average price of $1.93252.
Polygon Price Prediction 2030
With an established position in the market, POL’s potential high for 2030 is projected to be $4.94729. On the flip side, a potential low of $1.23676 will result in an average price of $3.09205.
Market Analysis
Firm Name
2025
2026
2030
CoinCodex
$ 0.71
$ 0.50
$ 0.90
Binance
$0.24
$0.26
$0.31
Flitpay
$6.25
$4
$10.4
Never Miss a Beat in the Crypto World!
Stay ahead with breaking news, expert analysis, and real-time updates on the latest trends in Bitcoin, altcoins, DeFi, NFTs, and more.
FAQs
Is Polygon (POL) a good long-term investment?
Polygon is considered a strong long-term project due to its Ethereum scaling role, active development, and growing ecosystem, but it still carries market risk.
What is the Polygon price prediction for 2026?
For 2026, POL price forecasts suggest a potential range between $0.10 and $0.75, depending on market recovery and technical breakout patterns.
Can Polygon reach $5 by 2030?
Some long-term projections indicate POL could approach $4–$5 by 2030 if adoption accelerates and the crypto market enters a sustained growth cycle.
What factors affect Polygon (POL) price the most?
POL price is influenced by Ethereum demand, network usage, market liquidity, macroeconomic trends, and overall investor sentiment in crypto markets.
The live price of The Graph crypto is $ 0.02696719.
Price predictions for 2026 range from $0.05 to $1.75.
In 2030, GRT may hit a high of $3.55, reflecting long-term growth.
AI may be taking center stage in today’s tech revolution, but behind every smart application lies the challenge of accessing and organizing reliable data. That’s where The Graph (GRT) steps in—an innovative indexing protocol transforming how blockchain data is queried.
As interest in The Graph surges, especially after its major 2025 upgrades and the launch of substreams-powered subgraphs, the question on everyone’s mind is: Can GRT price reach $1? In this article, we break down its technical potential, rising developer adoption, and market sentiment in our detailed The Graph Price Prediction 2026–2030.
In 2026, it fell below historical lows, reaching a new all-time low (ATL) of $0.0228, shaking investor confidence. It now has the potential to drop further, possibly forming a new ATL of $0.0100. However, if demand increases, $0.0400 could be revisited.
Why On-Chain Hints Flourishing Network and Ecosystem Growth In “The Graph”?
The Graph Network, has recently improved its fundamental growth, yet this strength is sharply diverging from its prolonged bearish GRT price action.
The network, is majorly used by developers and data consumers who pay to query data, is flourishing, per onchain. yet, the GRT remains significantly suppressed, presenting a notable contrast that is at the heart of its current analysis.
As per the data onchain, the performance of The Graph Network can be directly assessed by the growing “volume of queries” and the “accrual of query fees”.
In this context, the data reveals that over the last six months, its query volume has impressively reached 11.6 billion, which displays a clear sign of robust developer adoption that has been particularly fast since the network’s migration to Arbitrum.
Similarly, the query fees generated by data consumers on Arbitrum have also reached an all-time high of $8.11 million in August.
This success is supported by a large community of over 167,000 delegators and 7,204 active curators, all contributing to the network’s health.
In addition, the growing ecosystem is also in the spotlight by recent integrations with major brands like Tron, pointing to a strengthening on a fundamental level.
GRT Price Prediction 2026
For 2026, breaking below its historical lows was not what many investors were expecting, as assets, in particular, tend to show bullish momentum at historical lows based on a horizontal level.
But by February, it’s already breached this zone and marked a new STL of $0.0228, which has shaken investors’ trust massively. As this crypto shows no signs of improvement in its price action, in the worst-case scenario, it could even fall beneath the current ATL and mark a new one around $0.0100.
GRT On-Chain Analysis
Since the catastrophic decline from $2.15 in 2021, the total number of holders has continued to increase despite the significant price drop. This indicates that, over time, while the price has faced substantial setbacks, the community of believers in the project has been steadily growing.
Analyzing the supply on exchanges provides insight into the 2021 downturn, which can be attributed to the FTX crash and a remarkable influx of assets onto exchanges. In late 2020, exchange supply was below 250 million; however, by May 2023, it surged to 1.36 billion. This influx of supply exerted downward pressure on GRT’s price.
In contrast, the latter half of 2023 onwards has seen a consistent decline in exchange supply. By January 2026, this figure had fallen to 757.21 million almost half of the peak supply recorded on exchanges. This trend aligns with the sustained growth in total holders of GRT, clearly indicating accumulation.
GRT Coin Price Prediction 2026-2030
Year
Potential Low ($)
Potential Average ($)
Potential High ($)
2026
1.05
1.20
1.75
2027
1.55
1.70
2.15
2028
2.15
2.20
2.65
2029
2.25
2.70
3.25
2030
3.15
3.20
3.55
The Graph Price Targets 2026
By 2026, with continued adoption and network improvements, GRT could trade between $1.05 and $1.75, with an average price of approximately $1.20.
GRT Coin Price Prediction 2027
In 2027, GRT might range between $1.55 and $2.15, averaging around $1.70 as the network potentially sees increased usage and partnerships.
The Graph Token Price Prediction 2028
For 2028, GRT could trade between $2.15 and $2.65, with an average price of approximately $2.20, assuming continued growth in the blockchain indexing sector.
GRT Crypto Price Projection 2029
By 2029, GRT might range between $2.25 and $3.25, with an average trading price of $2.70, as the project matures and potentially captures a larger market share.
The Graph Price Prediction 2030
By 2030, GRT could potentially reach a high of $3.55, with a low of $3.15 and an average price of approximately $3.20, reflecting a decade of development and adoption.
What Does The Market Say?
Firm Name
2026
2030
Changelly
$0.320
$1.89
priceprediction.net
$0.493
$2.26
DigitalCoinPrice
$0.27
$0.58
Never Miss a Beat in the Crypto World!
Stay ahead with breaking news, expert analysis, and real-time updates on the latest trends in Bitcoin, altcoins, DeFi, NFTs, and more.
FAQs
What is the price of 1 GRT Token?
At the time of writing, the price of 1 The Graph Token was $ 0.02696719
What is the price prediction for GRT in 2026?
GRT price in 2026 may range from $0.05 in weak demand to $1.75 in strong demand, with an average target near $1.20.
What could The Graph (GRT) be worth in 2030?
By 2030, GRT could trade between $3.15 and $3.55 if adoption continues and the protocol becomes a core data layer for Web3.
Is The Graph (GRT) a good long-term investment?
GRT has strong fundamentals, growing developer adoption, and real utility, making it a promising long-term project, though price volatility remains high.
Can GRT reach $1?
Yes, based on network growth and adoption, some projections suggest GRT could reach between $1.05 and $1.75 by 2026, though market conditions will ultimately determine its price path.
The Uniswap price chart just printed a sharp 15% intraday rise, and this time it’s not just retail noise. Infact, Whale transaction counts have spiked aggressively and the timing is hard to ignore. UNI recently tapped $2.35, a level closely aligned with late-2020 support zones. Now, heavy capital is stepping in post BlackRock news.
Is the rise from UNI’s lowest point in years a Coincidence? Maybe or Maybe not. let’s look closer for a much clearer perspective.
Why Whales Are Moving & Buying in Sync in Uniswap crypto
Over the past 24 hours, based on Santiment onchain data, 10 addresses have executed transactions exceeding $1 million. At the same time, more than 175 addresses moved over $100K each, both are classified as whale transactions. That’s not random liquidity shuffling, infact that’s concentrated involvement.
Meanwhile, whale cohorts holding between 1,000 and 1 million UNI have increased their balances. In plain terms, larger players aren’t just trading the bounce they’re mass accumulating.
On the Uniswap price chart, this activity coincides with price stabilizing near long-term structural support. And while broader market sentiment remains fragile, this sort of synchronized whale behavior tends to precede volatility one way or another.
Network Activity Rebound Supports Bullish View For Uniswap price
Now here’s where it gets interesting. Daily active addresses jumped to 1,853 from around 1,150 in prior days. That’s a material uptick in on-chain participation. Interest in Uniswap crypto isn’t just speculative but real users are interacting again and that’s the most positive thing happened.
At the same time, the 30-day MVRV ratio has improved. That metric essentially tracks whether recent buyers are underwater. With it recovering, traders from the past month are beginning to regain position strength. If momentum continues, short-term recovery pressure could build.
Still, let’s be real. A bounce doesn’t automatically mean a trend shift.
BlackRock Catalyst
So why the sudden spark in what was otherwise a bearish atmosphere?
Uniswap Labs and Securitize announced a partnership with BlackRock to enhance DeFi liquidity for institutional investors via the USD Institutional Digital Liquidity Fund (BUIDL). The collaboration enables on-chain trading of BUIDL shares through UniswapX, an auction-driven protocol.
That headline alone was enough to jolt the UNI/USD pair higher.
Institutional bridges tend to shift perception fast. And perception, especially in crypto, often drives short-term price action harder than fundamentals.
UNI/USD Key Deciding Resistance Looms
Now comes the harder part, as the intraday spike loved by all and bullish speculation already jumped. But, the worries has not over yet, as immediate resistance range sits between $5.50 and $7.00.
Clearing that band would suggest the Uniswap price is re-entering a broader bullish range. Failure to build above current momentum, however, could send UNUSD back into consolidation most likely under $4.00 again, until macro sentiment improves.
So, what’s next? For now, the Uniswap price analysis suggests that it is responding to whale accumulation, improving on-chain metrics, and an institutional headline. Whether this develops into a sustained move depends less on today’s spike and more on whether the broader market narrative decides to cooperate.
The LayerZero price doesn’t usually move quietly. This time, it detonated. A 38% intraday spike and over 75% in seven days. And suddenly, ZRO is the token everyone’s pretending they were watching all along.
What lit the match? Institutional gravity. An announcement confirming a Ark Invest CEO Cathie Wood’s advisory board addition hit the tape, reinforcing a clear narrative: finance is shifting on-chain, and LayerZero intends to be part of that infrastructure layer. Add to that a strategic investment from Tether tied to interoperability tech used by USDt0, and the story writes itself, as this shows credibility, capital, and long-term positioning.
But let’s be real. The market doesn’t move on vision alone. It moves on positioning.
LayerZero Price Surged WIth Institutional Boost
The news cycle delivered exactly what speculative markets crave for. Institutional attention, Reduced perceived project risk, Signals of long-term relevance and most importantly the fresh capital that’s looking for exposure.
That cocktail pushed the LayerZero price sharply higher and flipped sentiment fast. On the LayerZero price chart, the vertical structure is hard to ignore. ZRO/USD didn’t grind up. It sprinted.
And whenever a chart starts sprinting, traders start sweating.
Big Resistance Lies Ahead In ZRO/USD
Here’s the technical friction point. On the daily timeframe, ZRO/USD is facing resistance in the $2.45–$2.50 range. That’s the immediate ceiling. Price pushing beyond it won’t be easy, and the current hesitation suggests the rally may be running hot.
Now, the nearest round number support sits near $2.00, where possibly other major players are having eye at. If momentum cools and since overheated metrics suggest it might then that’s the level traders are quietly circling.
The broader LayerZero price prediction now hinges on one simple condition: a sustained daily close above $2.45–$2.50. Without that confirmation, upside targets near $2.90 and even $3.30 remain conditional, not promised.
Why A Dip is Likely, Because of Overheating OnChain Signals
And here’s the uncomfortable part. CryptoQuant metrics flag the asset as overheated. Futures retail activity over the past 24 hours has surged, suggesting too many late entrants are piling in at once. Historically, when retail crowds futures positioning, larger players tend to reassess risk.
Volume bubble maps across both futures and spot markets echo that heating pattern. Translation? The move may be extended in the short term.
Now, could the LayerZero crypto rally ignore these warning signs and continue higher? Absolutely. Markets love squeezing doubters. But confirmation matters.
So what’s next in LayerZero price?
If buyers defend $2.00 and build structure, the narrative holds. If price reclaims and closes firmly above the resistance band, momentum traders will chase toward higher targets.
Until then, the LayerZero price sits at a crossroads charged with institutional narrative fuel, but flashing technical exhaustion lights at the same time.

@IOHK_Charles says Cardano is working alongside Google, Linux, and Microsoft Research on Nightstream, a cutting-edge post-quantum cryptography project.