The WLFI price just ripped 25% higher intraday and no, it wasn’t random. A so-called “golden ticket” style invitation for an event at Mar-a-Lago flipped sentiment fast, and traders wasted no time piling in. Momentum didn’t just tick up. It exploded.
Futures Volume Goes Parabolic
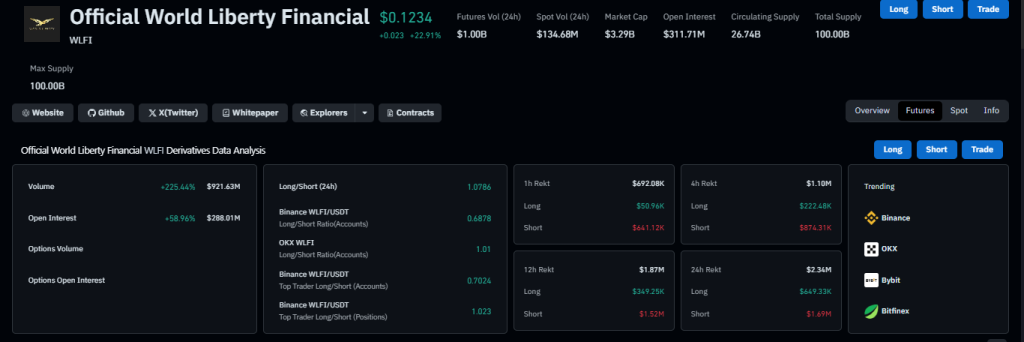
Futures activity spiked 225%, with volume reaching $921.63 million. Open interest surged 58% to $288 million. That’s not subtle positioning that’s aggressive exposure.
And when leverage floods in, liquidations follow. Over the past 24 hours, total liquidations hit $2.34 million. Shorts took the bigger hit at $1.69 million, while longs saw just $649.33K wiped out. That imbalance tells you exactly who got squeezed as the WLFI price squeezed higher.
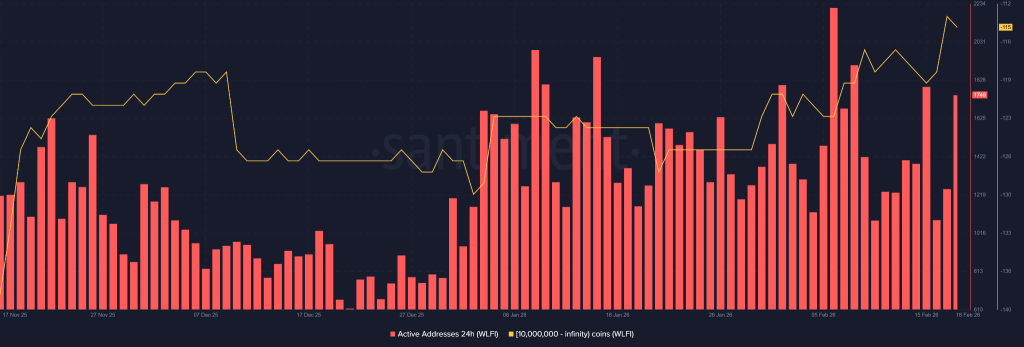
Well, here’s the kicker. On-chain data also showed a spike in daily active addresses. Most likely tied to the Mar-a-Lago event buzz, which features 38 speakers on the panel. Whether it delivers “market-shaping insights” or not, perception alone was enough to spark intraday demand.
Whales Accumulate, Exchanges Drain
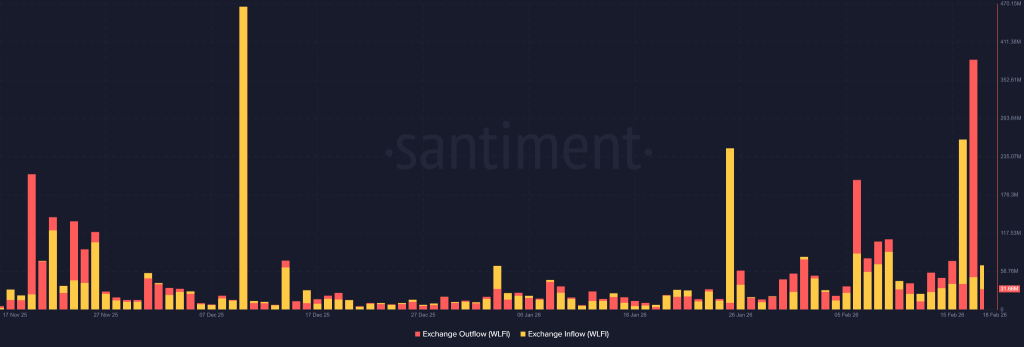
Behind the scenes, bigger players appear to be stepping in. The 10 million-to-infinity holder cohort has been trending upward, suggesting whale accumulation during this surge. At the same time, exchange outflows flipped inflows which is never a neutral signal. Tokens are moving off platforms, not onto them.
That shift matters. It suggests the 25% move may not be purely speculative froth. If supply keeps tightening on exchanges while demand spikes, the WLFI price chart could reflect that imbalance quickly. But let’s be real. Intraday hype doesn’t automatically equal sustainable trend.
Key Levels on WLFI Price Chart
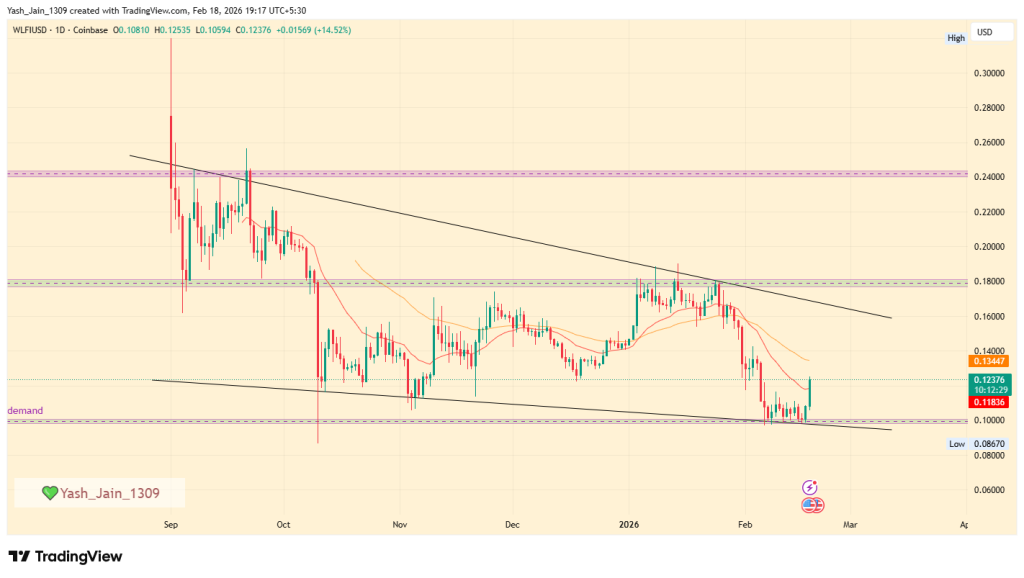
Technically, a wedge pattern is in play on the daily timeframe. The $0.100 zone has emerged as a key demand area, showing intraday support and reclaiming the 20-day EMA in the process.
If bullish momentum continues, clearing $0.140 becomes critical. That level dynamically aligns with the 50-day EMA band and could open the door toward $0.160 by month’s end.
So what’s next? Short term, the WLFI price prediction leans constructive as long as $0.100 holds. But zoom out, and the longer-term outlook still depends on broader demand expansion.
The event could be a catalyst or just a spark. Either way, for now, the WLFI price isn’t moving quietly.
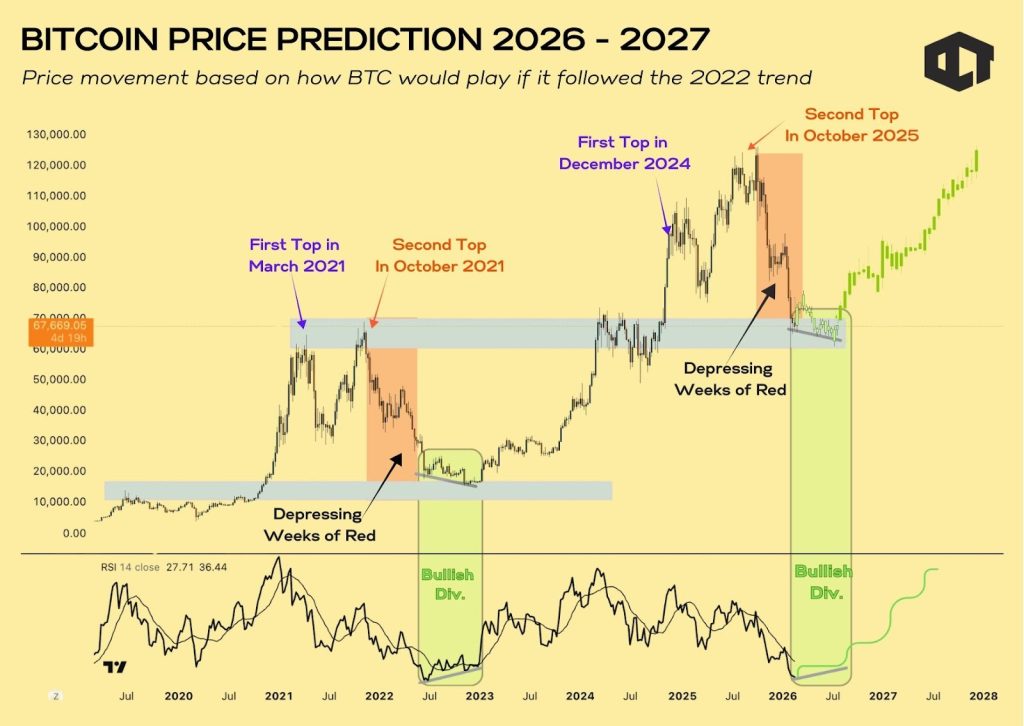
The Bitcoin price is hovering in a range of $60K to $70K and quietly sketching a structure that feels eerily familiar. If this is a bullish divergence phase like the one after the 2021 crash, then the current Bitcoin price prediction might frustrate impatient bulls more than outright bears ever did.
First Top Shock Repeats
Based on an analyst theory, March 2021 gave us the first major top. Because at this time, the momentum overheated. Retail was euphoric. RSI stretched thin. Then the sharp correction arrived.
Fast forward to December 2024, First time the 2021 Ath was flipped. This became the first top of this cycle, after 2021 crash.
Then second top came in October 2025 when 126K was reached. Now in 2026, the structure is uncomfortably similar.
Markets cool off after vertical expansion. That’s not drama, it’s mechanics and how BTC price action has been. The level it holds points to two main theories, first failure to hold $60K and market crashes more and second it repeats what it did afterwards 2022.
Therefore, if price avoids slipping under $60K while forming a bullish RSI divergence, it would resemble the 2022 reset phase that followed the 2021 crash. Not identical. But close enough to raise eyebrows.
Second Peak, Weaker Momentum
Lets have a look at follow up momentum after each primary bullish rallies. In march 2021 the primary rally marked first top and October 2021 showed a follow up momentum that delivered the second top. It looked strong. It felt bullish.
But momentum was already weaker than the first peak. Then came those slow, grinding weeks of red candles.
Now if we look at October 2025. Then its second top again and like previous history the next RSI divergence seems like an option.
Since, history doesn’t replay perfectly. Still, it tends to rhyme and this one feels almost scripted only if $60K isn’t lost.
The Boring Base Phase
Similar to 2022 exhaustion phase where momentum was range bound which is often called boring phase.
Now this phase in 2026 seems like a possibility. As weekly RSI is hovering near zones that previously marked exhaustion again.
But this is boring phase that tests investors patience and filters out weak hands. So it isnt this easy to look at fireworks in BTC price.
This is the part nobody enjoys. Compression. Sideways drift. Narrative fatigue. But structurally, this is where long-term cycles tend to rebuild.
Well, here’s the kicker. The previous peak-to-new-ATH cycle took roughly 30 months. From the 2021 top to the 2024 breakout, so the key player here was time, not hype ans neither was the catalyst.
If the same rhythm applies from the October 2025 second top, then that stretches meaningful expansion toward 2027–2028 and most of the 2026 could pass in compression.
Even the projected $120K to $130K zone wouldn’t arrive tomorrow. It would arrive late, if we look at history.
So, what’s next? If history’s cadence holds, the Bitcoin price may simply be grinding through its “base-building” chapter. No collapse. No instant moonshot. Just time doing what it has always done to Bitcoin/USD compress first, expand later.
And if this cycle truly isn’t different, then the real Bitcoin price analysis suggests breakout might be delayed, not denied.
Analysts predict PEPE could reach $0.0000539 by 2026.
Long-term forecasts suggest potential highs of $0.0002733 by 2030.
Pepe Coin (PEPE), the memecoin inspired by the iconic frog meme, has rapidly become a standout in the crypto world. Ranked just behind Dogecoin and Shiba Inu, PEPE’s explosive rise—boasting gains of over +130325085.96% from its all-time low—has captured investor attention globally.
As it maintains its position among top memecoins, many are now asking: Will PEPE price go parabolic by the end of 2025? In this article, explore CoinPedia’s in-depth PEPE coin price prediction for 2025, and discover long-term forecasts that look ahead to 2030.
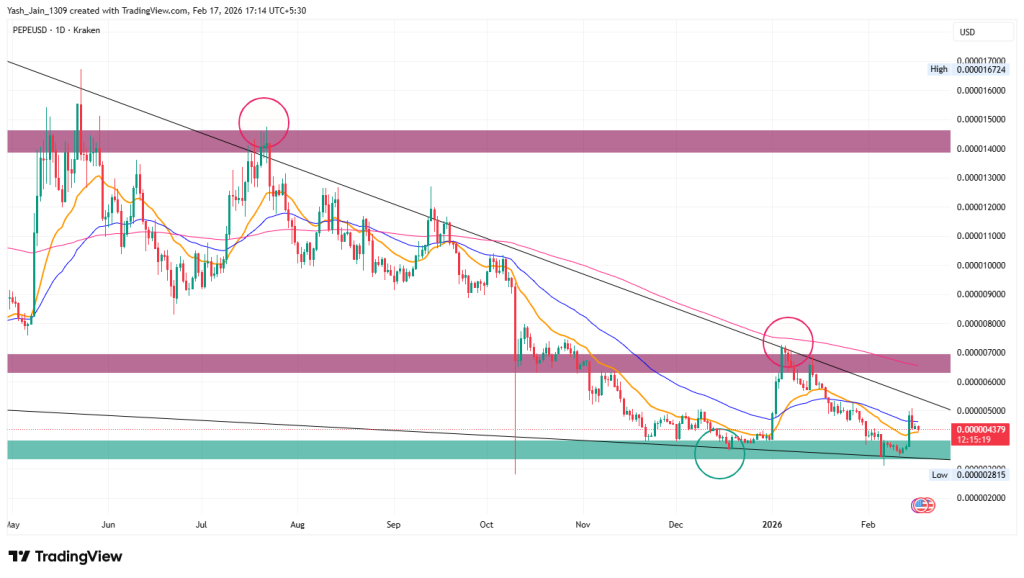
PEPE’s price has faced challenges due to low liquidity and cautious investor sentiment, a trend that has continued into Q1 2026. A price increase is possible in the remainder of Q1 2026 if new capital enters the market, especially given the recent tightening of the PEPE/USD trading range. However, if this influx of capital does not occur, a decline toward $0.00000120 could be likely.
PEPE Price Prediction 2026
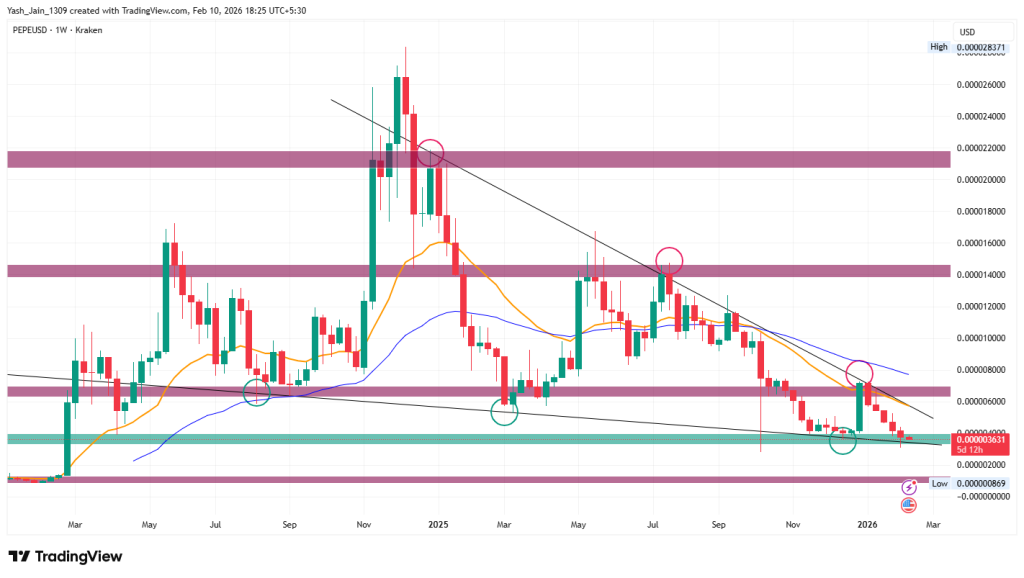
PEPE’s price has struggled in Q4 2025 due to low liquidity and cautious investor sentiment. This has continued in January 2026, and February is following that cautious investor, too.
The broader market is in an extreme fear phase, and prices are collapsing. However, if new capital flows in, a price rise is likely in the rest of Q1 2026, as this outlook is supported by a tightening trading range, which indicates a potential breakout more than ever. The PEPE price has faced challenges for several months, falling short of the expectations set by experts and investors alike, primarily due to an overarching risk-off sentiment within the memecoin space.
However, it’s essential to acknowledge that the current low market liquidity and cautious investor behavior have kept new capital on the sidelines amid a series of bearish trends.
Nevertheless, it is also a fact that entering the crypto market through memecoins remains one of the most accessible and easiest methods available. Therefore, should new liquidity begin to flow in, we can undoubtedly anticipate a bigger rise in PEPE’s price. Q1 2026 stands out as an ideal timeframe for this potential resurgence, and the compression of the falling wedge shows compression of the trading range that confirms the effectiveness and reliability of these trendlines that have been containing the price of PEPE since 2025, and the odds of a rally to pop out soon have greatly risen.
But, if it fails and collapses, then a decline toward $0.00000120 is expected, where we saw a rally sprouting back in early 2024.
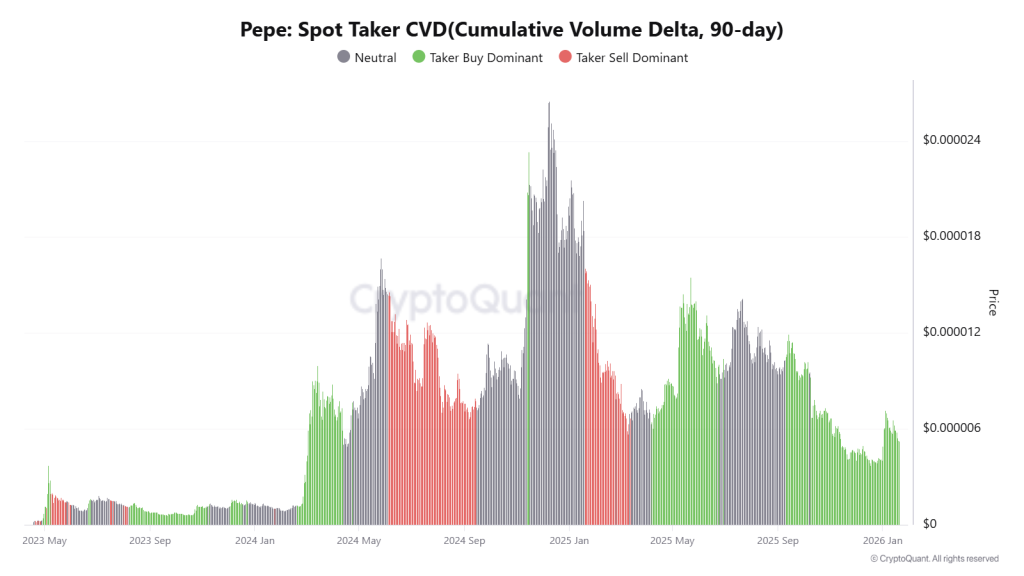
PEPE On-Chain Outlook
As per the metric “90-day Spot Taker CVD”, the cumulative difference between market buy and market sell volumes has turned positive and is increasing, indicating that high-conviction traders are aggressively market-buying PEPE rather than waiting for passive fills at lower prices.
This aggressive participation is a hallmark of a robust accumulation phase, in which market demand begins to outpace available liquidity, often serving as a precursor to a volatile price expansion.
Given that similar green clusters on the historical chart preceded significant rallies in mid-2024 and mid-2025, the current uptick suggests that “smart money” is positioning for a major move as the asset stabilizes near its current support levels in January 2026.
PEPE Price Prediction 2026 – 2030
Year
Potential Low ($)
Potential Average ($)
Potential High ($)
2026
0.0000179
0.0000359
0.0000539
2027
0.0000269
0.0000539
0.0000809
2028
0.0000404
0.0000809
0.0001214
2029
0.0000607
0.0001214
0.0001822
2030
0.0000910
0.0001822
0.0002733
This table, based on historical movements, shows PEPE price to reach $0.0002733 by 2030 based on compounding market cap each year. This table provides a framework for understanding the potential PEPE price movements. Yet, the actual price will depend on a combination of market dynamics, investor behavior, and external factors influencing the cryptocurrency landscape.
Pepecoin Price Forecast 2026
Our PEPE price prediction suggests that the price of PEPE in 2026 might range between $0.0000179 and $0.0000539, with the average price of the meme coin at $0.0000359.
Pepe Coin Price Prediction 2027
For 2027, we predict that the price of PEPE could range between $0.0000269 and $0.0000809, and the average price of the meme coin is expected to be around $0.000539.
Pepecoin Price Targets 2028
As per our Pepe Coin Price Prediction, in 2028, the price could range between $0.0000404 to $0.0001214, with the average price of the meme coin at $0.0000809.
Pepecoin Price Projection 2029
For 2029, the price of PEPE could range between $0.0000607 and $0.0001822, with the average price of the meme coin expected to be around $0.0001214.
Pepe Coin Price Prediction 2030
Based on our Pepecoin price forecast, the price of PEPE in 2030 might range between $0.0000910 to $0.0002733, with the average price of the meme coin predicted to be around $0.0001822.
PEPE Coin Market Analysis
Firm Name
2026
2030
Changelly
$0.0020
$0.015
CoinCodex
$ 0.000026
$ 0.000047
Binance
$0.000014
$0.000017
Never Miss a Beat in the Crypto World!
Stay ahead with breaking news, expert analysis, and real-time updates on the latest trends in Bitcoin, altcoins, DeFi, NFTs, and more.
FAQs
How much is Pepe coin worth?
The current price of Pepecoin is $ 0.00000440.
What factors could drive PEPE’s price growth in the coming years?
PEPE’s price depends on meme coin market sentiment, liquidity inflows, social media trends, and broader crypto cycles rather than fundamentals alone.
Is PEPE a high-risk investment compared to other cryptocurrencies?
Yes. As a meme coin, PEPE is highly volatile and sentiment-driven, making it riskier than utility-based cryptocurrencies with real-world use cases.
How does PEPE compare with Dogecoin and Shiba Inu?
PEPE competes mainly on community hype and trading momentum, while DOGE and SHIB benefit from longer histories and broader ecosystem support.
What is PEPE price prediction for 2026?
PEPE could trade between $0.0000179 and $0.0000539 in 2026, depending on meme coin demand, liquidity inflows, and overall crypto market momentum.
What is PEPE price prediction for 2027?
In 2027, PEPE may range from $0.0000269 to $0.0000809 if bullish sentiment and retail participation remain strong across meme coins.
What is PEPE price prediction for 2028?
PEPE’s price in 2028 could move between $0.0000404 and $0.0001214, driven by broader market cycles rather than project fundamentals.
What is PEPE price prediction for 2030?
By 2030, PEPE could reach up to $0.0002733 in optimistic scenarios, though prices will remain highly sensitive to market sentiment and risk appetite.
Price predictions for 2026 range from $0.80 to $4.15.
Long-term forecasts suggest ONDO could reach $9.30 by 2030.
ONDO Finance in the RWA sector is a hot topic, investors are closely eyeing its future potential. Especially as its native token ONDO continues to build credibility and momentum through high-profile developments.
Moreover, Ondo Finance is known to be a leading RWA provider on the Solana chain and it is witnessing growing institutional interest, ONDO has solidified itself as a major player in the Real World Asset (RWA) space.
With such attraction, the ONDO price prediction 2026 is what analysts and retail investors are intrigued about. But how far can it go from here? Let’s dive into the detailed ONDO price forecast from 2025 to 2030.
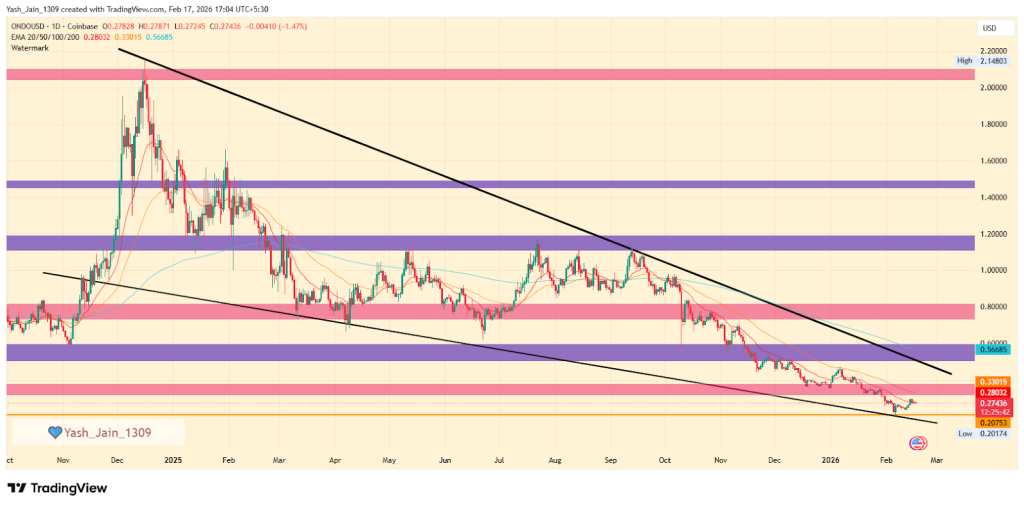
ONDO/USD has been declining since early 2025, reaching a support level around $0.20 in February 2026. A potential reversal may occur if it breaks the $0.60 resistance. Key targets for Q1 2026 are $0.80 and $1.20.
ONDO Price Prediction February 2026
On the daily chart, the ONDO price fall continued in January and February, and also began on a bearish note. But since mid-February, it has shown bullish momentum after retesting the lower boundary of the falling wedge pattern. Also, the falling wedge range is narrowing, and ONDO/USD is rising from a key support level. February could see a revisit to the $0.50-$0.60 range. If it breaks above this range too, then it may aim for $0.80, which could be a significant target. However, if it fails to do so, the price may continue to consolidate around the support level or potentially decline further.
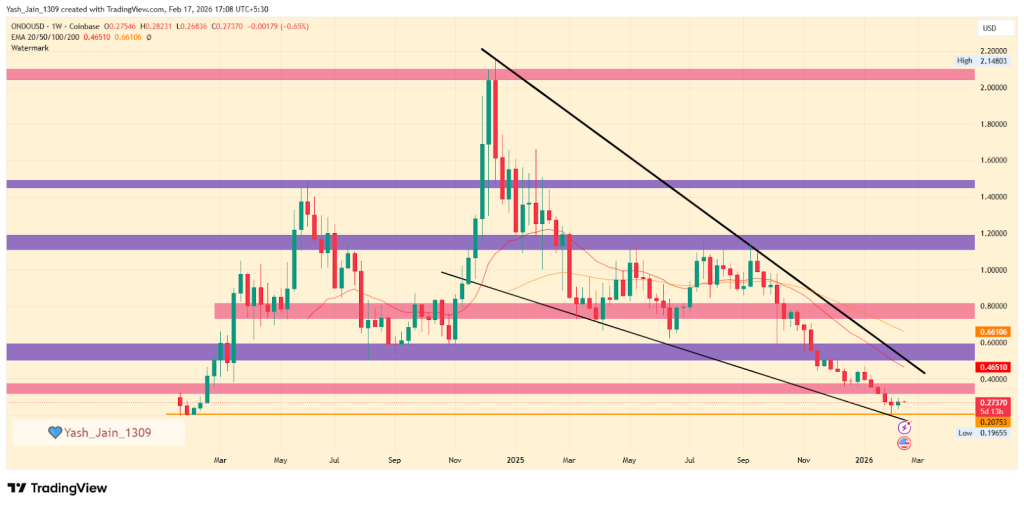
ONDO Price Prediction 2026
The weekly chart for ONDO/USD shows a declining trend since the start of 2025, following a high of $2.14. The descending trendline acted as a strong hurdle, characterized by lower highs and lower lows in price action, indicating reduced price volatility. The persistent bearish pressure on the weekly chart signals bear dominance.
The same price fall continued in Q1 2026, and January and early February have taken a severe hit, but it has reached February 2024, based on support around $0.20 in early February 2026, and some bullish reaction is also caught, which indicates that a reversal may be possible before Q1 completes in March 2026.
Looking ahead to the first quarter of 2026, the market may be ready for a rally, especially if it breaks through the $0.50-$0.60 resistance. The recent establishment of $0.20 as a support level, along with increased demand for ONDO, suggests that buyers may be willing to re-enter the market at this price.
If the market surpasses this hurdle, the next big targets for ONDO/USD would be $ 0.80 and $1.20 for Q1 2026.
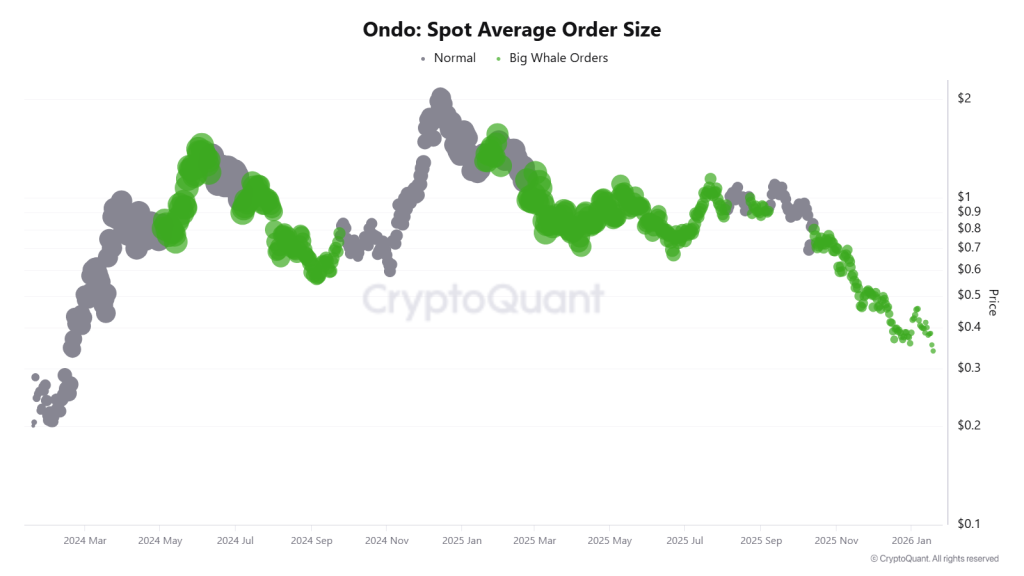
ONDO Price Analysis: Onchain Outlook
The on-chain data indicate that although the price is currently capped and has been consolidating for several months, the on-chain metrics have strengthened significantly despite the weak ONDO price action. Since January 2024, the number of confirmed transactions sent to a project’s contracts has increased. By December 2025, the project had surpassed 1.3 million transactions, making it the second-largest project for real-world asset (RWA) issuance after BitGo.
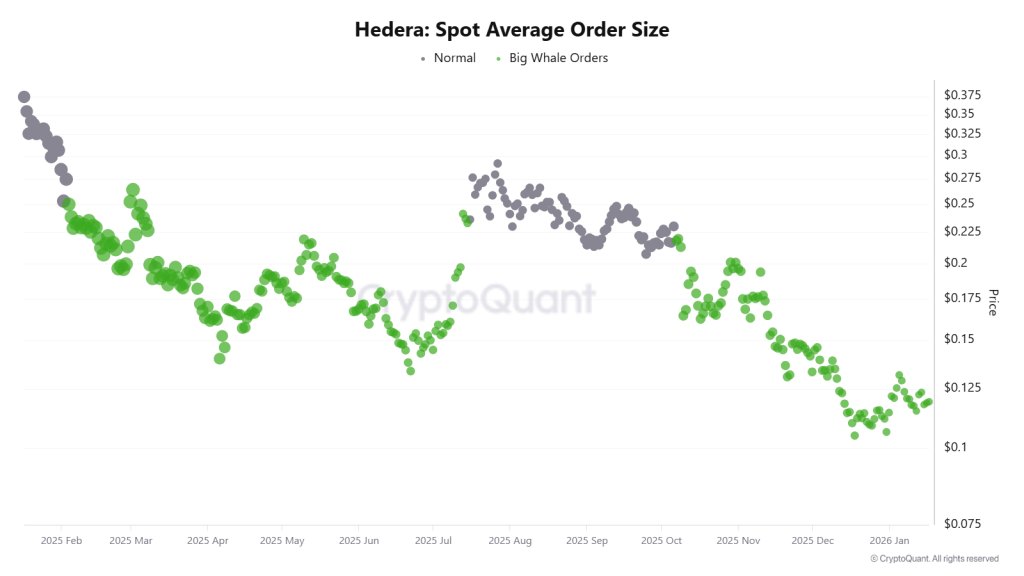
Additionally, the “Spot Average Order Size” maintains high levels (represented by green dots) while the price is declining; it is a classic signal of Whale Absorption. Therefore, this Consistent whale activity confirms institutional conviction in the RWA (Real World Asset) sector.
ONDO Cryptocurrency Price Target 2026 – 2030
Year
Potential Low ($)
Potential Average ($)
Potential High ($)
2026
1.65
2.75
4.15
2027
2.20
3.65
5.25
2028
2.95
4.30
6.90
2029
4.75
5.60
8.45
2030
5.35
7.45
9.30
Ondo Coin Future Forecast 2026
The price projection of ONDO crypto for 2026 could range between $0.20 to $2.15, with an average trading price of roughly $1.25.
Ondo Token Price Prediction 2027
This altcoin could hit a potential high of $5.25 in 2027, with a potential low of $2.10, and an average price of $3.65.
ONDO Price Prediction Next Bullrun 2028
By 2028, forecasts indicate a potential low of $2.95 and a high of $6.90. This could bring the average price to $4.30.
Ondo Price Forecast Long-term 2029
During 2029, the price of the Ondo token is anticipated to reach a minimum of $4.75, with a maximum of $8.45, and an average price of $5.60.
ONDO Coin Price Growth Potential 2030
ONDO coin price may reach a high of $9.30 in 2030. With a potential low of $5.35. With this, the average price could settle at around $7.45.
Market Analysis
Firm Name
2025
2026
2030
Changelly
$1.32
$1.87
$8.26
priceprediction.net
$1.34
$2.03
$8.43
DigitalCoinPrice
$2.01
$2.29
$5.01
Never Miss a Beat in the Crypto World!
Stay ahead with breaking news, expert analysis, and real-time updates on the latest trends in Bitcoin, altcoins, DeFi, NFTs, and more.
FAQs
How much is Ondo crypto worth today?
At the time of writing, the price of the Ondo token was $ 0.27589182.
What is the ONDO price prediction for 2026?
ONDO price in 2026 is projected to range between $1.65 and $4.15, with an average near $2.75 if RWA adoption continues to grow.
Is Ondo Finance a good long-term investment?
Ondo Finance shows long-term potential due to strong on-chain growth and its leading role in the real-world asset sector, though market risk remains.
What is the Ondo price prediction for 2030?
By 2030, ONDO price could reach up to $9.30, with sustained growth driven by institutional adoption and expansion of tokenized assets.
Price prediction for 2026 suggests a potential high of $55.
Long-term forecasts indicate LINK could reach $195 by 2030.
Chainlink has emerged as a game-changing decentralized oracle network, enabling smart contracts to connect seamlessly with real-world data, APIs, and traditional financial systems. As the crypto market evolves, Chainlink’s role continues to expand, especially with its Cross-Chain Interoperability Protocol (CCIP) gaining traction. Its native token, LINK, not only powers the ecosystem but has also caught the attention of investors and analysts. As a result, institutional interest surged, leading to the launch of the LINK ETF by Grayscale in early December 2025.
With LINK price showing signs of a potential breakout and strong on-chain fundamentals backing its rise, the big question remains: Can LINK coin price hit $50 in December 2025? Let’s dive into this detailed Chainlink price prediction 2026–2030 to find out.
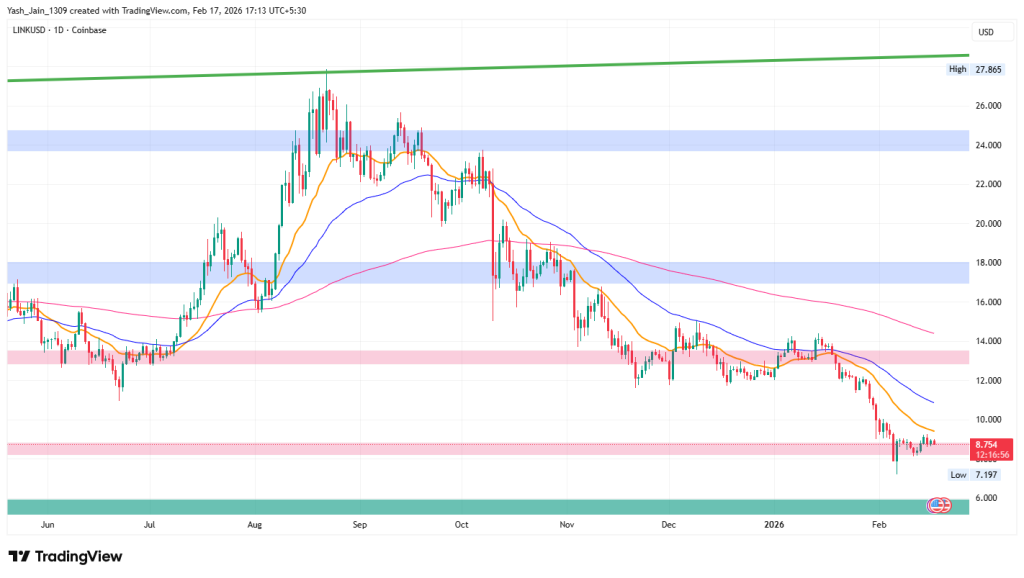
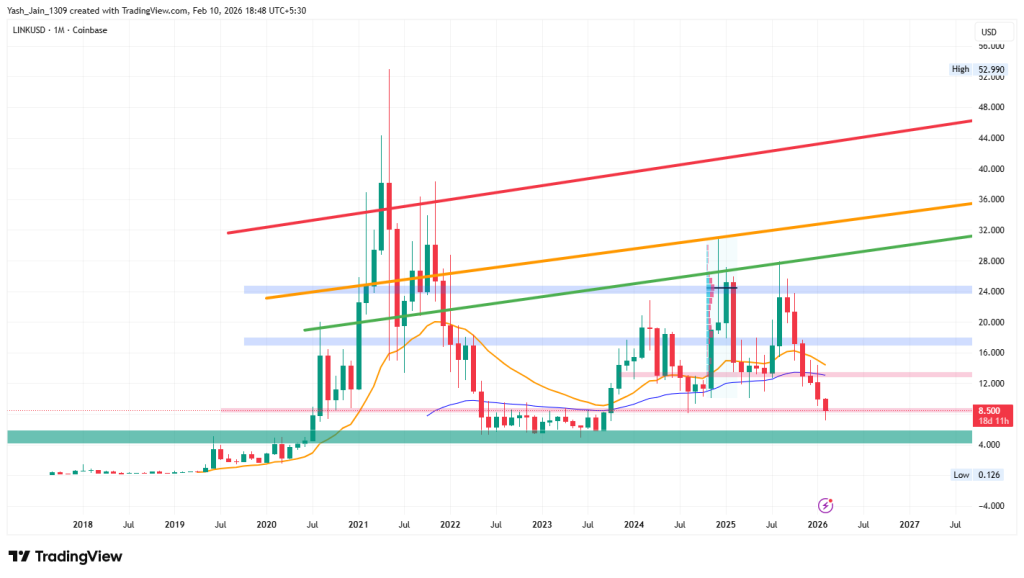
Chainlink (LINK) is currently around $8.50, and odds suggests a dip to crucial support between $4.15 and $6.05 is highly likely if bearish sentiment elevates more. In shortterm, from $8.50 bulls may try a fight to $12 or $15, but persistent bearish pressure might lead it back to the lower range.
Chainlink Price Targets February 2026
In January, the LINK price struggled to maintain the $13 level and dropped to $7 by early February. However, it has made a slight recovery and is attempting to stay above the $8.50 range. If it can establish this level as support, a rise back to $12 or $15 may be possible. Conversely, if it fails to hold above $8.50, the price could fall to the last line of defense, which is between $4.15 and $6.05.
Chainlink Price Prediction 2026
The weekly chart highlights an important price range for Chainlink (LINK) between $4.15 and $6.05. For many years, this range has provided crucial support, preventing the price from declining further.
In 2023, the price surged from this range, reaching a high of $31 by late 2024. However, bearish market conditions took over, leading to a consistent decline from 2025 onward. Early 2026 continued this downward trend, with the price now struggling around $8.50.
This support level is significant in the short term, as a reversal from this point could lead to a retest of the $12 or $15 levels. Historically, prices do not drop straight down without a challenge from bullish investors. However, if selling pressure remains strong and demand fails to meet expectations, the price may approach the $4.15 to $6.05 demand area again.
Looking ahead, the Chainlink price prediction for 2026 indicates the potential for a significant price surge similar to the explosive rally observed in 2020. Analysts suggest that if momentum and market sentiment align positively, the price could see a reversal, but it would take time to process that kind of price action.
Year
Potential Low ($)
Potential Average ($)
Potential High ($)
2026
35
50
55
Chainlink On-Chain Analysis
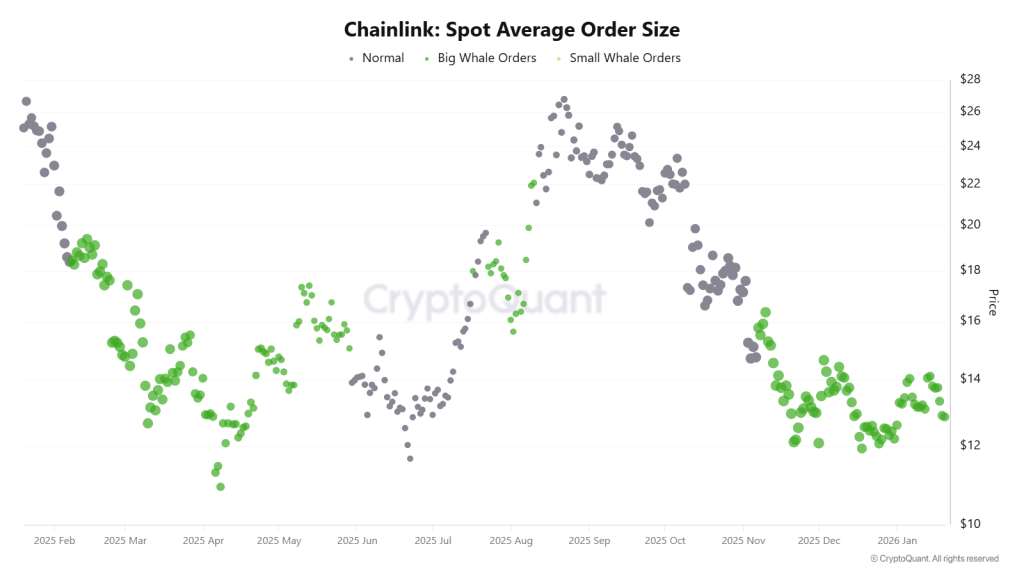
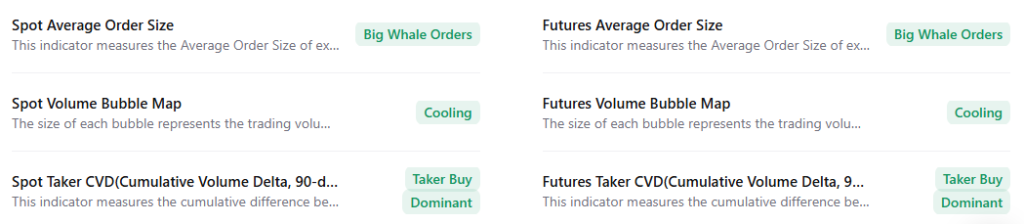
In the LINK on-chain metrics, both spot and futures markets are clearly exhibiting a Taker Buy-Dominant phase. It shows that buyers are actively executing at market prices without waiting for pullback opportunities. This is simply a strong sense of conviction rather than speculative strategies.
Additionally, the Average Order Size in both the spot and futures markets has escalated into the “Big Whale” category. This shift signals the involvement of institutional participants, who significantly influence LINK’s market structure, rather than retail trading flows.
Chainlink Price Targets 2026 – 2030
Year
Potential Low ($)
Potential Average ($)
Potential High ($)
2026
35
50
55
2027
48
64
80
2028
58
85
104
2029
70
108
141
2030
85
147
195
This table, based on historical movements, shows Chainlink price to reach $195 by 2030 based on compounding market cap each year. This table provides a framework for understanding the potential LINK price movements. Yet, the actual price will depend on a combination of market dynamics, investor behavior, and external factors influencing the cryptocurrency landscape.
LINK Crypto Price Forecast 2026
As per Chainlink’s Price forecast for 2026, the high price could be $55, the low may reach $35. This makes the average around $50.
LINK Price Prediction 2027
Moving to 2027, the LINK Price projects that it might hit a high price of $80 potentially. With a $48 low and an average of $64.
Chainlink Price Analysis 2028
Moving to 2028, the Chainlink Price Forecast predicts a high price of $104. On the flip side, the low may fall to $58, and the average is projected to be around $85.
LINK Coin Price Prediction 2029
As per Chainlink Price Forecast 2029, LINK’s high price is predicted to be $141, with a low of $70 and an average of $108.
Chainlink Price Prediction 2030
Finally, as per the Chainlink Price Forecast 2030, LINK’s price can reach a high price of $195. With a low of $85 and an average of $147.
Market Analysis
Firm Name
2026
2030
Changelly
$25.83
$140.70
coincodex
$6.44
$14.79
Binance
$18.43
$22.40
Mitrade
$32.22
$139.2
Investing Haven
$54.10
$80
Flitpay
$62.6
$110
*The aforementioned targets are the average targets set by the respective firms.
Never Miss a Beat in the Crypto World!
Stay ahead with breaking news, expert analysis, and real-time updates on the latest trends in Bitcoin, altcoins, DeFi, NFTs, and more.
FAQs
How much is Chainlink worth?
At the time of writing, the value of one LINK crypto token was $ 8.85819606.
What is the price prediction for Chainlink in 2026?
Chainlink price prediction for 2026 suggests LINK could trade between $35 and $55, with an average price near $50 under bullish conditions.
How much will 1 Chainlink be worth in 2030?
By 2030, 1 Chainlink could be worth between $85 and $195, depending on adoption, market cycles, and long-term crypto growth.
Where will Chainlink be in 5 years?
In five years, Chainlink is expected to be a core Web3 infrastructure, with broader adoption and a potential price range of $80–$140.
Is Chainlink a good long-term investment?
Chainlink is considered strong long term due to its real-world utility, oracle dominance, institutional adoption, and expanding cross-chain ecosystem.
What factors influence Chainlink price predictions?
LINK price is driven by oracle demand, CCIP adoption, staking growth, institutional interest, crypto market cycles, and global liquidity trends.
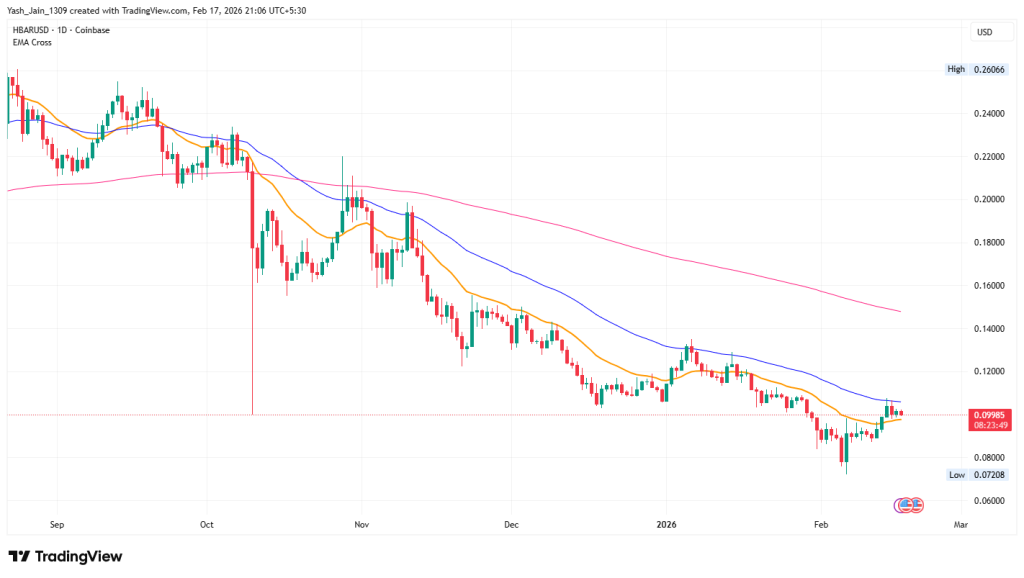
The HBAR price is trying to look resilient at $0.100, but the derivatives market isn’t buying the optimism. Beneath the surface, funding data and futures positioning suggest traders are still leaning bearish even after last week’s headline boost.
Funding Flips, Bears Take Control
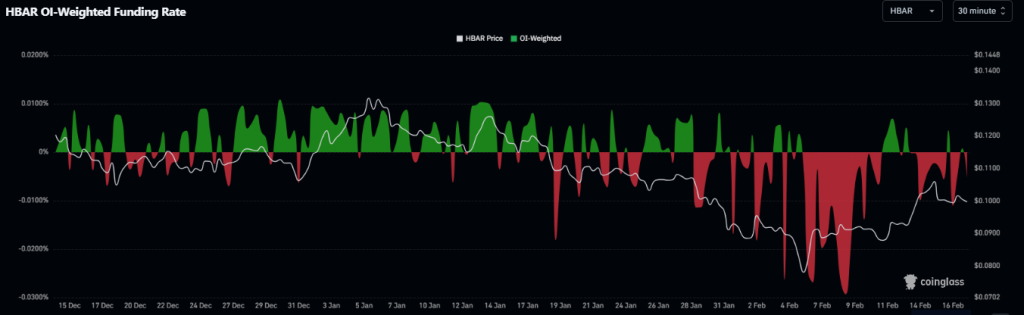
Let’s start with the mood check. According to Coinglass OI-weighted funding rate data, the metric still turned negative on Monday and stands at -0.0048% on Tuesday. That may look minor, but it tells a clear story that short sellers are paying longs. In other words, more traders are betting on downside than upside.
That shift matters. As negative funding rate often reflects sustained bearish positioning, and right now it suggests that confidence in a rebound is thin. The broader HBAR price chart mirrors this hesitation, with upside attempts struggling to gain traction beyond short-term bounces.
Meanwhile, futures open interest has slid to $108.82 million, continuing a steady decline. Falling OI typically signals waning participation. Traders are stepping back. Liquidity is thinning. And that’s rarely a sign of aggressive accumulation.
FedEx Boost, Short-Term Spark
Now here’s where it gets interesting. After the announcement that FedEx would join the Hedera Council, the HBAR price caught a short-term bid and pushed back toward the $0.100 level. That kind of corporate association tends to generate headlines and, briefly, demand.
But let’s be real: price reaction alone doesn’t erase broader sentiment.
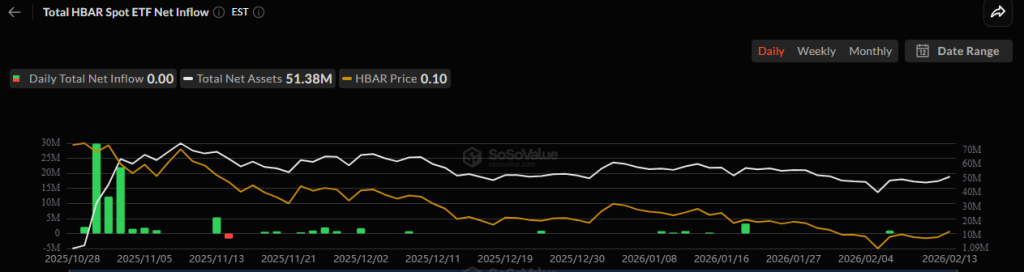
ETF flows aren’t providing much backup either. The last recorded inflows were close to $1 million on February 6. Since then? Nothing. In fact, most trading days since launch have seen zero inflows, with only a handful posting positive numbers. That’s hardly the kind of consistent institutional appetite that shifts a trend.
So while the FedEx development last week added a spark, it hasn’t translated into sustained capital rotation into HBAR/USD markets.
The $0.150 Survival Zone
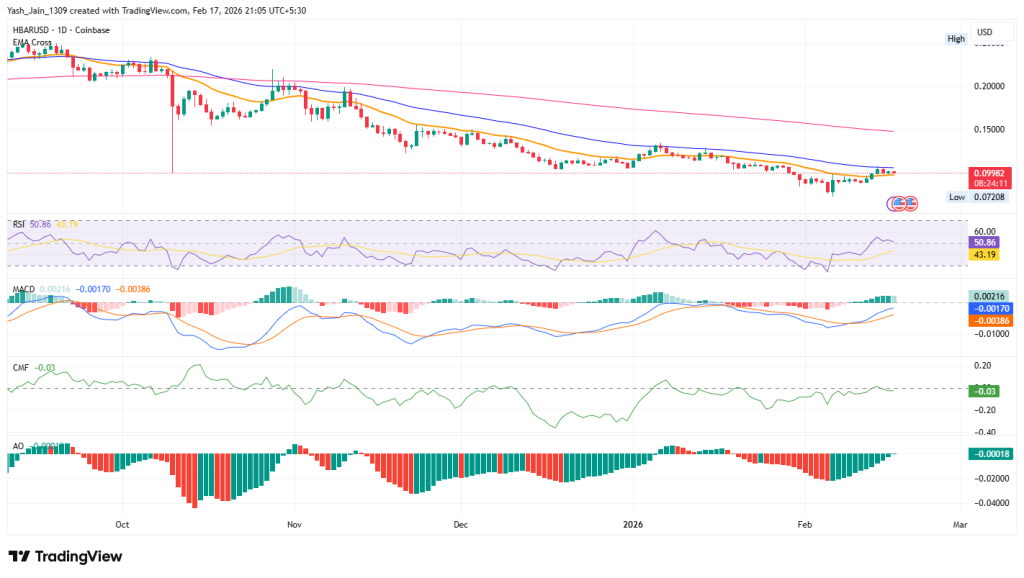
Technically, $0.150 is shaping up as the line in the sand. If HBAR price prediction manages to climb back toward that zone from CMP of $0.100, it could act as a short-term magnet. But indicators suggest the move may face exhaustion there. RSI currently sits at 52.07 neutral territory, but with room to stretch. A push toward $0.150 could drive it into overbought conditions.
At the same time, CMF at -0.02 shows tentative recovery, yet similar setups in July and October stalled between $0.14 and $0.18 before price rolled over again. That historical context weighs on any aggressive HBAR price prediction.
Interestingly, AO and MACD are showing growing bullish momentum, though both remain below the zero line. That suggests upside potential may continue at least until major resistance is tested.
So what’s next? If the HBAR price breaks and sustains above $0.150 in Q1 2026, the structure could shift. But if it remains suppressed beneath that ceiling, the probability of further lows stays firmly on the table.
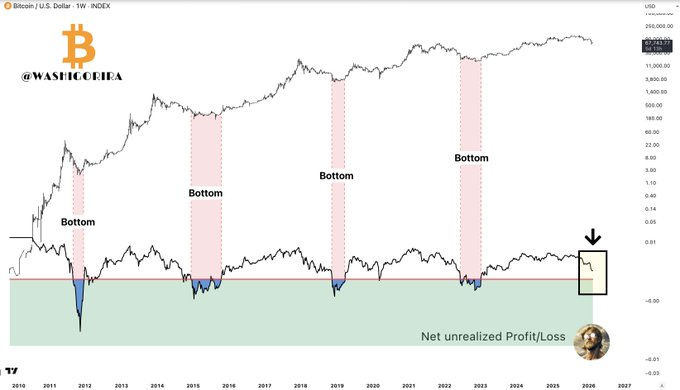
The Bitcoin price is once again caught in a tug-of-war between on-chain caution and aggressive corporate accumulation. NUPL data suggests most participants are not yet underwater, where its underwater conditions are evident in past true cycle bottoms. Yet fresh purchases from MSTR hit the tape loud today.
NUPL Says Capitulation Incomplete
Historically, its evident that when cycle lows form when the majority of holders are sitting at unrealized losses. That’s when fear peaks and forced selling exhausts itself. But according to current Net Unrealized Profit/Loss (NUPL) readings, the market hasn’t reached that pain threshold.
Compared to prior cycles, NUPL remains elevated. In practical terms, that implies the capitulation phase may not be finished. From a Bitcoin price chart perspective, this metric has often aligned with deep-value zones only after profitability collapses across the board. We’re not there yet, at least based on this dataset.
Well, sentiment may feel awful, but structurally, most holders haven’t experienced maximum stress, yet.
Saylor’s Strategy Buys the Dip
Meanwhile, corporate conviction continues. A fresh acquisition of 2,486 BTC worth approximately $168.4 million was made at around $67,710 per coin, by Michael Saylor’s Strategy. That brings total holdings to 717,131 BTC, acquired for roughly $54.52 billion at an average of $76,027 per coin.
Strategy has acquired 2,486 BTC for ~$168.4 million at ~$67,710 per bitcoin. As of 2/16/2026, we hodl 717,131 $BTC acquired for ~$54.52 billion at ~$76,027 per bitcoin. $MSTR$STRChttps://t.co/wvxRYZlQ3Y
That’s not exactly hesitation. From a Bitcoin price prediction standpoint, aggressive accumulation at lower levels signals long-term confidence from at least one major entity. However, it doesn’t automatically confirm a market-wide bottom, yet but institutional buying can coexist with extended drawdowns.
At the same time, the BTC/USD structure still reflects uncertainty rather than confirmed reversal.
Bitcoin Price to $50,000 in Play?
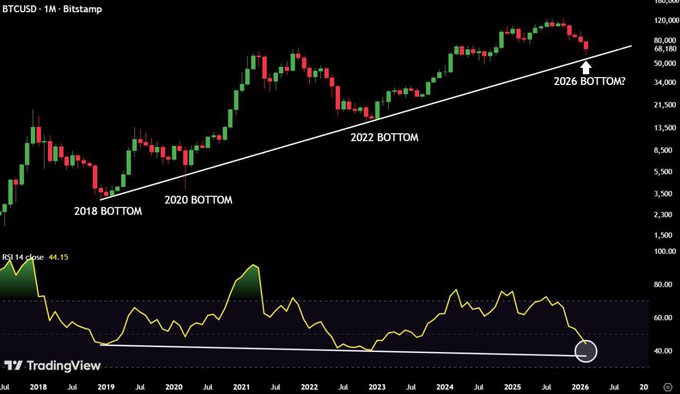
Adding fuel to the discussion, another widely circulated view points to the monthly RSI dropping below 40. Under this the four-year cycle, that interpretation opens the possibility of $50,000 as a potential 2026 bottom zone.
Still, monthly RSI weakness doesn’t guarantee a specific downside target, but it does suggest broader trend fatigue. Historically, such readings have accompanied prolonged corrective phases rather than quick rebounds.
So, where does that leave the Bitcoin price? On one side, NUPL argues true capitulation hasn’t arrived. On the other, large-scale buying continues near $67,000 while some analysts model $50,000 as a deeper support region. The Bitcoin price currently sits between structural accumulation and incomplete pain, a phase where conviction and caution coexist.
Analysts project Dogecoin could reach $0.75 to $1.25 by the end of 2026.
Long term projection highlights that by 2030 it could even reach the $3 mark.
Dogecoin, the original meme coin, has cemented its status as a crypto legend. Known for its viral appeal and a fiercely loyal community, it continues to capture headlines and investor interest. Following Donald Trump’s election win, speculation around a potential Dogecoin ETF fueled a surge in optimism.
Now, that speculation has become a reality. With the September 18 launch of the REX-Osprey DOGE ETF, trading under the ticker DOJE and carrying a 1.5% fee, the path has been cleared for institutional access. This groundbreaking debut makes it the first U.S.-listed spot ETF for Dogecoin and significantly raises the odds for similar approvals from major players like Bitwise and Grayscale before year-ends.As growing optimism and increasing adoption reshape the market, traders are asking: “Will Dogecoin go back up?” and “Can DOGE hit $1?” In this article, we dive into a detailed technical analysis and a long-term Dogecoin price prediction 2025 to 2030.
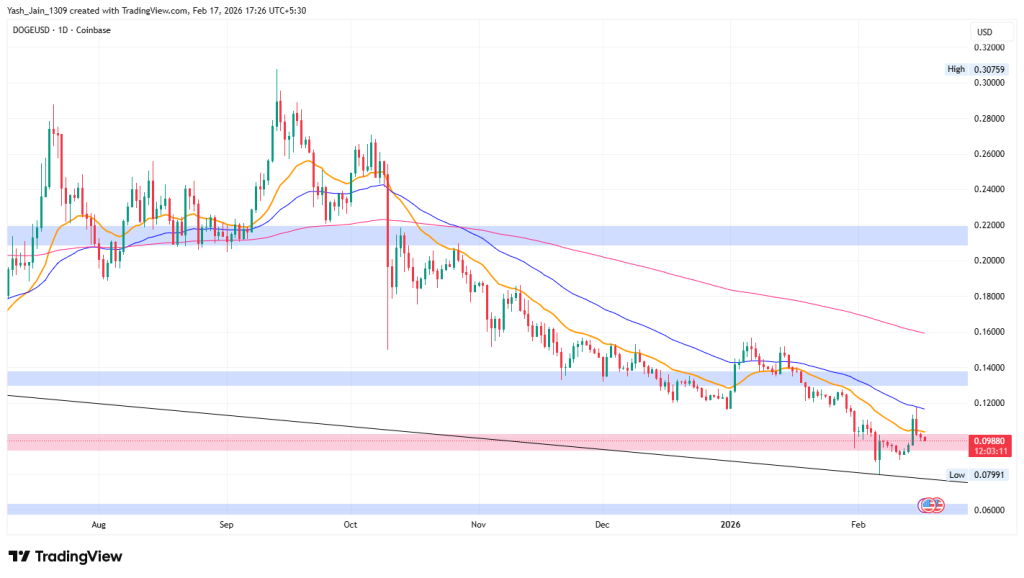
In January, the price declined, continuing from 2025’s decline. In February, it retested the downward trendline after breaching $0.10, but mid-feb inwards it briefly bounced.
Now, for a trend reversal, it needs to surpass key $0.1380; otherwise, falling below $0.0810 could lead to a drop to the $0.055-$0.060 range.
Dogecoin Price Prediction 2026
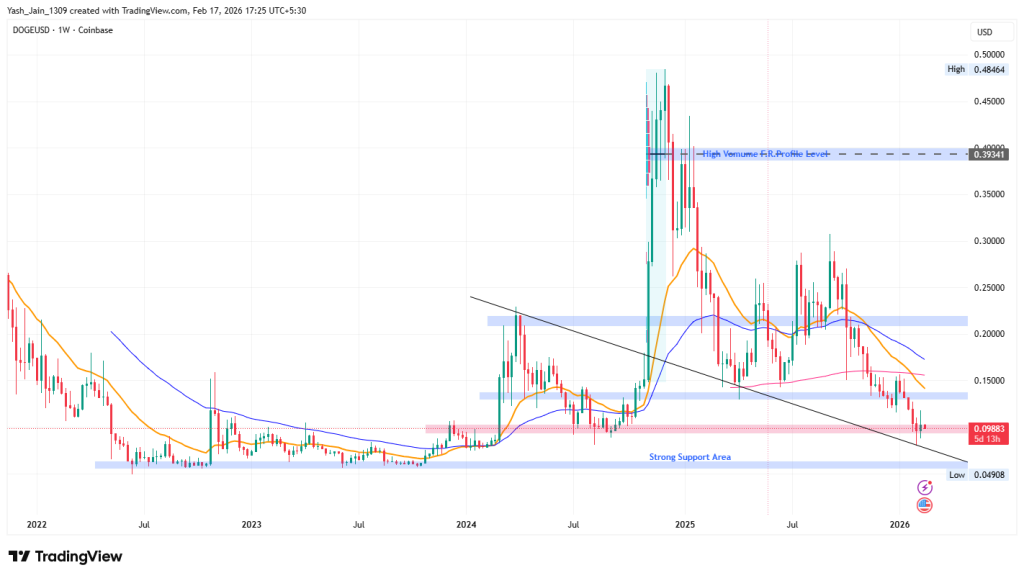
In January, the price consistently declined on the weekly chart, continuing where 2025 left off. Now, in February, it has retested the downward trendline after breaching the $0.10 support area. However, the dynamic support trendline has acted as a sturdy support that gave it a brief bounce to $0.1170 but still trades under $0.10 when short-term bullish momentum faded.
Since bullish demand is reacting at this level, the odds suggest that this long-term monthly decline could be flipped only if a certain level is knocked down to signal a change in trend, like $0.1380.
If it regains its footing above this area, then by the rest of Q1’s remaining days, a retest of $0.2000-0.2200 range could be possible.
But, at this point, if DOGE loses the 0.0810 point of contact of its support taken in February, which is knocked down, then it will end up retracing towards the support area of $0.055-$0.060, a range that previously contributed to a substantial rise in late 2023.
Year
Potential Low ($)
Potential Average ($)
Potential High ($)
2026 (conservative)
0.10
0.39
1.00
DOGE On-Chain Outlook
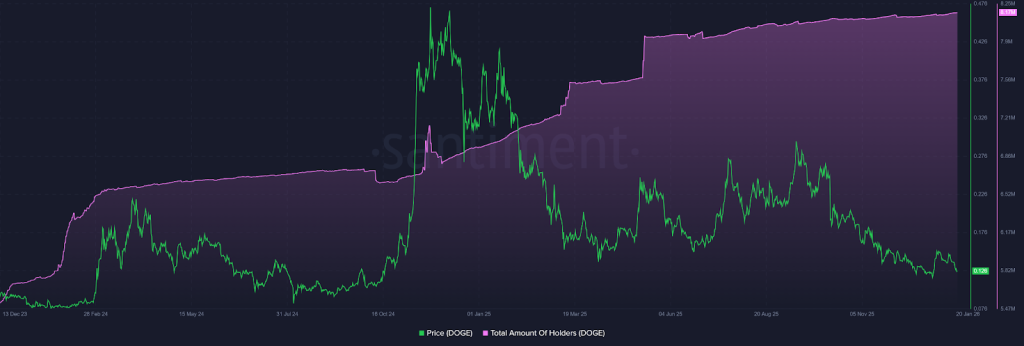
Despite the price facing challenges after peaking at $0.46 in late 2024 and then falling, 2025 is a very tough year for its investors. But the total number of holders has surged to an impressive 8.17 million, indicating strong investor accumulation.
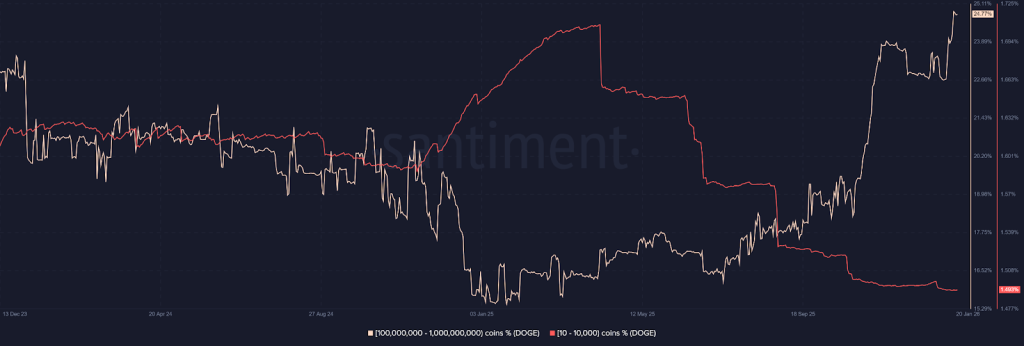
Similarly, large holders are showing strategic accumulation patterns that suggest bullish sentiment. While the number of retail holders holding between 10 and 10,000 coins has been declining, those holding between 100 million and 1 billion coins continue to increase, reinforcing a positive outlook for the asset.
Dogecoin Price Prediction 2026 – 2030
Year
Potential Low ($)
Potential Average ($)
Potential High ($)
2026
0.75
1.00
1.25
2027
1.15
1.35
1.50
2028
1.25
1.75
2.00
2029
1.50
2.15
2.65
2030
2.50
2.75
3.00
This table, based on historical movements, shows DOGE price to reach $3 by 2030 based on compounding market cap each year. This table provides a framework for understanding the potential DOGE price movements. Yet, the actual price will depend on a combination of market dynamics, investor behavior, and external factors influencing the cryptocurrency landscape.
Price predictions for 2026 range from $400 to $600.
Long term outlook suggests gradual growth potential to approach $1200 by 2030.
Aave (AAVE) is a decentralized finance protocol built on Ethereum that facilitates permissionless lending and borrowing through smart contracts. After witnessing a strong expansion in the previous market cycle, AAVE entered a prolonged correction phase, with price gradually retracing from its earlier highs. Throughout 2025, AAVE remained in a consolidation structure, reflecting a period of market digestion rather than trend continuation. While short-term momentum has cooled, the broader technical structure suggests that AAVE may be transitioning into a new accumulation phase.
As volatility contracts and price holds above long-term demand levels, attention is now shifting toward whether 2026 can trigger the next major price discovery cycle.
AVAX dropped to $9 after facing resistance at $15 in January. A recovery is possible, with high expectations for Q1 2026. Based on recovery odds, experts are targeting $20 with even potential to reach $28, and if it breaks that, $44 by mid-year. If $28 holds, consolidation may continue.
Avalanche (Avax) Price Prediction 2026
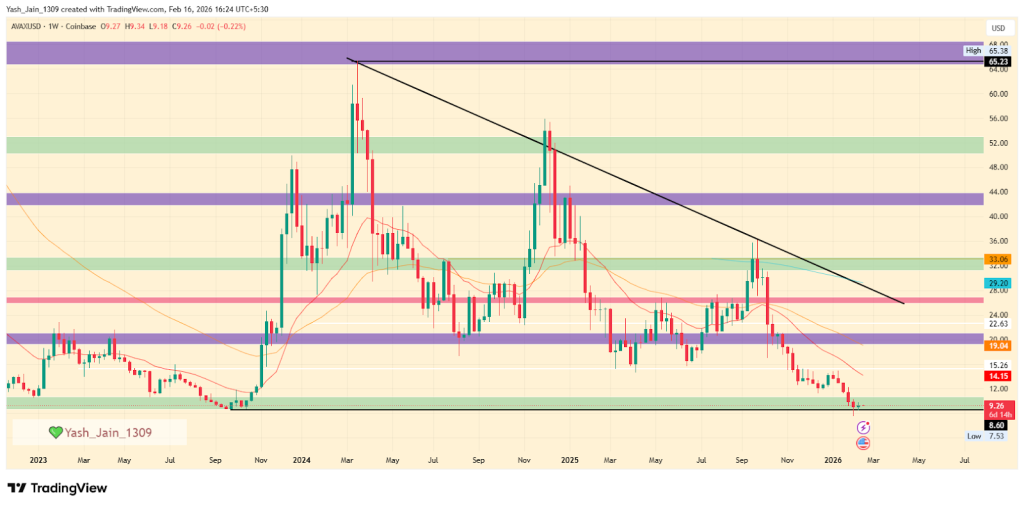
The price action of AVAX hasn’t been so great since its Q1 2024 high of $65; it has been in decline ever since. Most of 2024 and all of 2025 were in decline.
Even in 2026, this bearish momentum’s shadow didn’t lift; it worsened, with the broader market in turmoil. In January, the AVAX price faced rejection from $15 and slipped to $9 support zone after hitting a low of $7.53 in February. But things can change this time around. Since Q1 still has several days left, a recovery remains an option, as it has been testing a demand area of $9 that ignited the late 2024 rally. Sustained demand here could signal a reversal.
Now, expectations for its recovery, which are gaining momentum in Q1 2026, are significantly higher. Now, it appears AVAX may not have performed in the past two years, but it was all about establishing a base, and it seems it has done so. Now, an impressive rally ahead is a strong possibility.
For Q1, we expect $20 with potential to test the pattern’s upper border at $28. However, if it clears the upper border, we can expect AVAX to hit $44 by the end of the first half. But if $28 repels, then the first half could see consolidation stretching.
Year
Potential Low
Potential Average
Potential High
2026 (conservative)
$25
$33
$50
AVAX On-Chain Analysis
AVAX shows a highly bullish sentiment. Big Whale Orders in both spot and futures indicate strong institutional accumulation. With Taker Buy Dominance at 90 days, aggressive buyers are in control, while the Cooling volume bubble map suggests a healthy consolidation phase. Collectively, major metrics point to a bullish rally ahead.
Avalanche Price Prediction 2026 – 2030
Year
Potential Low ($)
Potential Average ($
Potential High ($)
2026
400
500
600
2027
550
690
820
2028
650
830
980
2029
740
950
1100
2030
820
1000
1200
AAVE Price Forecast 2026
Looking ahead to 2026, AVAX’s potential price is anticipated to rise even further, with a projected low of $20.00 and a high of $80.00. The average price for AVAX in 2026 will likely be $50.00.
AAVE Price Prediction 2027
In 2027, the analysis suggests a continued upward trend in AVAX’s value, with the price potentially ranging between $31.50 and $126.50. Based on the calculated figures, the average price is projected to be approximately $79.00 during this period.
AAVE Prediction 2028
By 2028, AVAX’s price could potentially experience further growth, falling within the range of $50.50 and $202.50. The average price during this period, calculated from the data, is expected to be around $126.50.
AAVE Price Prediction 2029
Moving forward to 2029, AVAX’s price is predicted to ascend between $81.00 and $324.00. The average price during this period is estimated at around $202.50 based on calculated figures.
AAVE Price Prediction 2030
By 2030, AVAX’s price is forecasted to soar between $129.50 and $518.50. Further, the average price during this period, calculated from the data, could stand at $324.00.
Based on the historic market sentiments and trend analysis of the largest cryptocurrency by market capitalization, here are the possible AAVE price targets for the longer time frames.
Year
Potential Low ($)
Potential Average ($)
Potential High ($)
2031
890
1100
1350
2032
920
1200
1500
2033
1100
1350
1780
2040
1600
2200
3000
2050
2600
3300
4500
AAVE Price Prediction: Market Outlook?
Year
2026
2027
2030
Changelly
$500
$750
$1100
DigitalCoinPrice
$480
$680
$1000
WalletInvestor
$520
$650
$1250
Never Miss a Beat in the Crypto World!
Stay ahead with breaking news, expert analysis, and real-time updates on the latest trends in Bitcoin, altcoins, DeFi, NFTs, and more.
FAQs
Is AAVE a good investment for 2026?
AAVE shows long-term growth potential if it breaks key resistance levels. However, price depends on market conditions and DeFi adoption.
What should investors watch before buying AAVE?
Watch support near $135–$150, resistance above $250, overall market trend, and activity within the Aave protocol.
What could drive Avalanche (AVAX) price growth in the coming years?
Key drivers include DeFi expansion, institutional adoption, subnet growth, and overall crypto market recovery cycles.
What is the AVAX price prediction for 2026?
The AVAX price prediction for 2026 suggests a potential range between $400 and $600 if market momentum and network growth remain strong.
What is the AVAX coin price prediction for 2030?
AVAX coin price prediction for 2030 points to a possible range of $820 to $1,200, assuming sustained adoption and favorable market conditions.
What is the Avalanche price prediction for 2040?
Avalanche price prediction for 2040 estimates a broad range between $1,600 and $3,000 if long-term blockchain adoption accelerates globally.
Hedera Price prediction highlights HBAR could reach $0.45-$1.05 in 2026.
The Long-term forecasts suggest HBAR could hit $2.20 by 2030, indicating stable growth potential.
Hedera has been making waves in the cryptocurrency space, with a fast and secure blockchain that offers a distinct approach to transaction processing compared to Ethereum and other smart contract chains. It’s permission-only, meaning the blockchain is managed by private companies. Limiting what types of decentralised applications are allowed is what makes Hedera stand out from the rest.
Having entered the top 20 digital assets by market cap in 2024, it is now eyeing a potential leap into the top 10 by the end of 2025. Hedera has also recently ramped up its development activities for its ecosystem. Its ecosystem is strengthening, despite its capped price action. With increasing real-world use cases, institutional interest, and strategic partnerships, many are closely tracking HBAR price chart 2025 to gauge how high the token can rise.
With major companies like Google, IBM, and Chainlink Labs backing the project, and discussions about SEC approved HBAR ETF would flood string liquidity. Many are intrigued that: Will the HBAR Price Reach $1? Let’s discuss this in our Hedera price prediction 2025 article.
HBAR fell back under $0.100 by early 2026, and it recently tested key dynamic support in February, indicating potential demand. For a bullish outlook, it needs to reclaim $0.120; otherwise, it may pull back to $0.0800. For the long run, holding $0.0800 is crucial to avoid testing $0.0453.
HBAR Price Prediction 2026: What’s Next for Hedera?
Previously, the HBAR price began a prolonged period of consolidation below $0.120, lasting nearly 2 years from 2023 to the third quarter of 2024. Then a rally in Q4 2024 pushed it to $0.4010. But the surprising part is that by the end of 2025, it is back below $0.120, and by the end of January 2026, it has even slipped below $0.100 in February. The question is whether it is an opportunity or something else.
Since the extended decline of 2026 has retested a key support that strongly aligns with the lower border of the pattern, and some reaction from this level confirms the presence of demand at this dynamic support. That makes the current price action an important play that could shape the next big move.
Also, it has an ETF, where odds are suggesting that once a catalyst arrives inflows could resume sooner or later, and the price of HBAR, which is currently experiencing lower demand, that could change. Also, this setup of falling wedge still looks intact with bears ruling for now, and it cannot be confirmed yet whether the recent support taken changes towards the bullish wind. So far, only on the micro level is it bullish, but the long-term chart still doesn’t care about micro momentum because the larger momentum is still dominated by bears, and this needs a big catalyst to break the range.
In the short term, either it will claim its position back above $0.1200 and aim for $0.1836, or it will take a pullback from $0.1200 back to $0.0800.
However, for the majority of this year, holding on to $0.0800 is key; if that’s compromised, it will be very hard to stop HBAR from testing $0.0453 support. Right now in Q1, the initial rally that fruited in late 2024 began from this zone, and if demand manifests, this could be a possible opportunity to accumulate, but caution still comes first.
HBAR On-Chain & ETF analysis
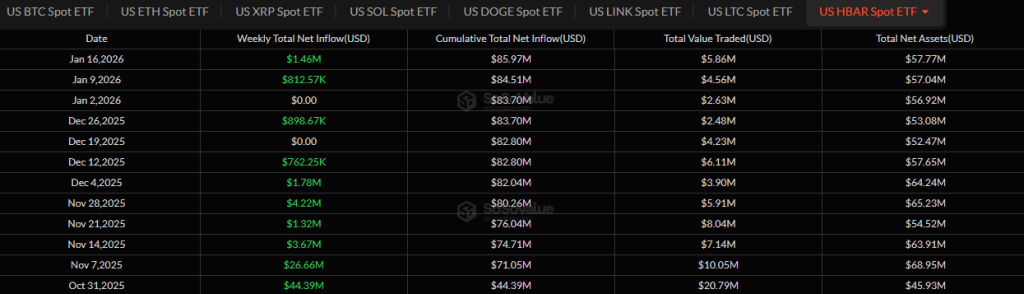
The HBAR ETF is gaining momentum once again, with $1.46 million in inflows this week. The last time we saw such significant inflows was in early December, when it reached $1.78 million. This suggests liquidity is flowing into HBAR, potentially signaling a price rise.
Also, large orders from whales have been increasing since mid-October, suggesting that they are purchasing HBAR on every price decline.
Year
Potential Low
Potential Average
Potential High
2026 (conservative)
$0.15
$0.40
$0.75
HBAR Price Prediction 2026 – 2030
Year
Potential Low
Potential Average
Potential High
2026
$0.45
$0.80
$1.05
2027
$0.60
$0.95
$1.20
2028
$0.65
$1.10
$1.40
2029
$0.70
$1.35
$1.60
2030
$0.95
$1.70
$2.20
HBAR Price Prediction 2026
Moving forward to 2026, forecast prices and technical analysis project that Hedera’s price is expected to reach a minimum of $0.45. The price could escalate to $1.05 on the higher end, with an average trading price hovering around $0.80.
HBAR Price Forecast 2027
Looking ahead to 2027, the optimism around Hedera will lead to steady growth. Hence, the HBAR price is forecasted to reach a low of $0.60, with a potential high touching $1.20 and an average forecast price of $0.95.
Hedera Price Forecast 2028
As we advance to 2028, with moderate gains, the HBAR predictions indicate that the price of a single HBAR could reach a minimum of $0.65, with the ceiling potentially rising to $1.40. Within the range, the average price will be $1.10.
HBAR Price Target 2029
By the time 2029 rolls around, it’s predicted that Hedera’s price will maintain its upward trajectory, reaching a minimum of $0.70, with the maximum price possibly reaching $1.60 and an average of $1.35, reflecting cautious optimism.
Hedera Price Prediction 2030
By the end of this decade, HBAR is predicted to touch its lowest price at $0.95, aiming for a high of $1.70 and an average price of $2.20. Hence, the prediction suggests stable long-term growth for Hedera’s market value.
Market Analysis
Firm
2026
2030
Changelly
$0.370
$1.74
priceprediction.net
$0.40
$1.99
DigitalCoinPrice
$0.50
$1.07
Coinpedia’s Hedera Price Prediction
By the end of 2025, the recovery run in HBAR prices is expected to continue with a gradual rise in momentum. Hence, by the end of 2025, Coinpedia’s HBAR price forecast expects a potential high of $0.80 with a solid support at $0.40, making an average of $0.60.
Year
Potential Low
Potential Average
Potential High
2025
$0.40
$0.60
$0.80
Never Miss a Beat in the Crypto World!
Stay ahead with breaking news, expert analysis, and real-time updates on the latest trends in Bitcoin, altcoins, DeFi, NFTs, and more.
FAQs
What is the HBAR price prediction for 2026?
HBAR price in 2026 is projected to trade between $0.45 and $1.05, with an average near $0.80 under favorable market conditions.
What is the Hedera price prediction for 2030?
By 2030, HBAR price could rise to around $2.20 if network growth, partnerships, and broader crypto adoption continue steadily.
Is Hedera a good long-term investment?
Hedera shows long-term potential due to enterprise adoption, real-world use cases, and strong governance, though price cycles still affect returns.
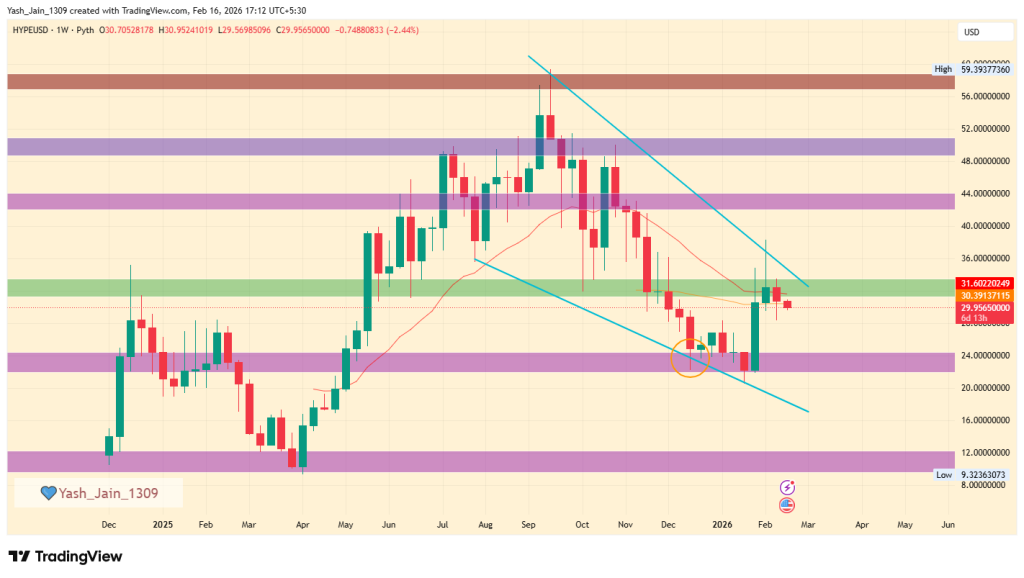
The live price of the Hyperliquid crypto is $ 30.29642335.
The 2025 HYPE price suggests it could hit $40-$105 in 2026.
Forecasts suggest that HYPE could reach a potential average price by 2030 of around $125, with highs up to $185.
The crypto market is buzzing with excitement over Hyperliquid and its native token, HYPE. As a decentralized, paperless alternative to platforms like Binance and Coinbase, Hyperliquid is quickly gaining traction, prompting investors to look closely at the HYPE price prediction for 2026 and beyond.
With its unique “HyperBFT” consensus mechanism, lightning-fast transactions, and zero KYC hurdles, Hyperliquid is rewriting the rules of perpetual trading. Beyond its consensus mechanism, Hyperliquid also allows users to trade crypto perpetual futures, including major assets like BTC, ETH, SOL, AVAX, and SUI, even without owning the underlying asset.
As the platform gains traction for its streamlined trading experience, many investors are now turning to analyze the HYPE token price outlook. But does its innovative model signal long-term growth for HYPE Token Price?
In this article, we dive deep into market sentiment and Hyperliquid price projections from 2026 to 2030.
Early January 2026 started on a rough page, but changed in a snap when it surged to $38, then quickly fell to $32.50. It seems now targeting $24, or possibly $18 by Q1 2026. But the key player is $28, which is lost; a drop to $18 is likely. Bearish trends suggest HBAR/USD could hit $10 this year, so caution is still essential.
Hyperliquid Price Prediction 2026
After closing 2025 around $24, January 2026 kicked off with a stunning rally in the final week, and the early week of February followed it, pushing towards $38 briefly. As soon as it saw a drop to $32.50 support, and after a couple of days of failed tries to sustain, it slipped, and now in Q1 it is aiming back to $24, or maybe the real target is $18 before Q1 2026 sums up.
This means that since it failed to hold $32.50, it has become resistance, which aligns well with dynamic resistance, especially the falling wedge pattern’s upper and lower borders, which are around $18, making it an ideal target for bears.
In the short term, the $28 is the most immediate support that can save the current trend from shifting back into the bear’s grasp in the blink of an eye, but if this is lost, then odds are at peak that it’s going to end up at $18 per the bearish setup it’s forming.
Probably, the bullish momentum has been compressed by the bears, and the crash could extend further in the long term, suggesting higher odds at this point that it will happen sooner or later. So, if that’s true, then HBAR/USD hitting the $10 zone at some point this year wouldn’t be a big surprise either, as institutions always want to accumulate dust cheaply. Caution is the key to finding the best opportunities.
HYPE On-Chain Outlook
The Dune analytics dashboard provided an quick on-chain overview of the utility metrics of the Hyperliquid token (HYPE), which appears to be improving significantly with each passing month.
HyperEVM total transaction fees have surpassed 235.57K and are at an ATH, and total trading volume has crossed $3.64 trillion and is at an ATH. Even its revenue has reached an ATH, crossing $993 million.
All the major metrics suggest that it is experiencing great adoption among peers, and its on-chain metrics are proof of that, suggesting that if the rally occurs, then 2026 might end on very good numbers.
Hyperliquid Coin Price Targets 2026 – 2030
Year
Potential Low ($)
Potential Average ($)
Potential High ($)
2026
25
50
90
2027
40
75
105
2028
55
95
130
2029
85
110
155
2030
105
125
185
HYPE Price Projection 2026
By 2026, the value of a single Hyperliquid token price could reach a maximum value of $90 with a potential low of $25. With this, the average price could land at around the $50 level.
Hyperliquid Coin Price Prediction 2027
During 2027, the HYPE could reach a maximum value of $105 with a potential low of $40. Considering this, the average price of this altcoin could settle at around $75.
HYPE Crypto Price Action 2028
The Hyperliquid price could achieve the $130 milestone by the year 2028. On the flip side, the altcoin could record a low of $55 and an average price of $95.
Hyperliquid Price Analysis 2029
The HYPE crypto prediction for the year 2029 could range between $85 to $155 and the average price could be around $110.
HYPE Price Prediction 2030
Looking forward to 2030, the Hyperliquid Price may range between $105 and $185, and a potential average value of around $125.
Market Analysis
Firm Name
2025
2026
2030
Binance
$37
$63
$164
DigitalCoinPrice
$76
$54
$97
*The aforementioned targets are the average targets set by the respective firms.
CoinPedia’s HYPE Price Projection
This Layer-1 project has taken the crypto market by storm within a short time frame. With a market cap of over $7 billion, this altcoin has successfully secured a position in the top 25. Moreover, with the mass adoption, this altcoin could claim a spot in the top 10 during the upcoming bull run.
If the bullish sentiment intensifies, the Hyperliquid price will reach a high of $41.39 this year. On the flip side, if the market experiences unfavorable events, this could result in this altcoin settling at a low of $14.65.
Year
Potential Low
Potential Average
Potential High
2025
$14.65
$28.02
$41.39
Never Miss a Beat in the Crypto World!
Stay ahead with breaking news, expert analysis, and real-time updates on the latest trends in Bitcoin, altcoins, DeFi, NFTs, and more.
FAQs
What is Hyperliquid (HYPE) and why is it gaining popularity?
Hyperliquid is a fast, decentralized trading platform with no KYC and low fees, making HYPE popular among traders seeking speed and independence.
What is the Hyperliquid (HYPE) price prediction for 2026?
HYPE price in 2026 is projected to range between $25 and $90, with an average near $60 if adoption and trading volumes keep rising.
What could HYPE be worth by 2030?
Long-term projections suggest HYPE might reach an average of $125 by 2030, with possible highs near $185 if platform usage keeps expanding.
Is Hyperliquid (HYPE) a good long-term investment?
HYPE may appeal to long-term investors due to strong platform growth, but like all crypto, it carries risk and requires careful research.
Bitcoin is currently trading at: $ 67,143.95175427
Predictions suggest BTC to hit $150K to $250K before 2026 ends.
Long-term forecasts estimate BTC prices could hit $900K by 2030.
After a historic 2025 that saw Bitcoin shatter records and flip the legendary $125,000 mark, the market has taken a sharp, cooling turn. The early weeks of 2026 have been defined by a “sell-the-news” reality check, leaving many to wonder if the bull run has finally run out of steam or if we are simply witnessing the ultimate “buy the dip” opportunity.
The landscape has shifted. With a pro-crypto administration in the White House and institutional giants like MicroStrategy and Metaplanet treating BTC as a foundational reserve asset, the rules of the game have changed. No longer just a speculative play for retail traders, Bitcoin is now a geopolitical chess piece and a corporate balance sheet staple.
But as the price tests crucial support levels, the big question remains: Is this a temporary correction before a march toward $200,000, or the start of a long-term reset?
In this deep dive, we break down the Bitcoin price prediction for 2026–2030, exploring the massive trends, regulatory shifts, and institutional moves driving this historic cycle. If you want to know where the floor is and how high the ceiling goes. read on for the full scoop.
Coinpedia’s BTC Price Prediction 2026
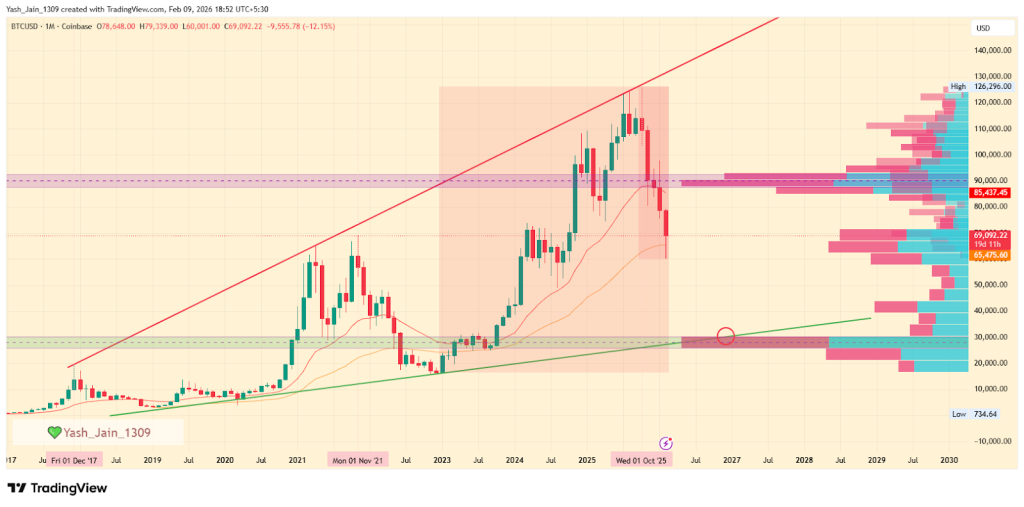
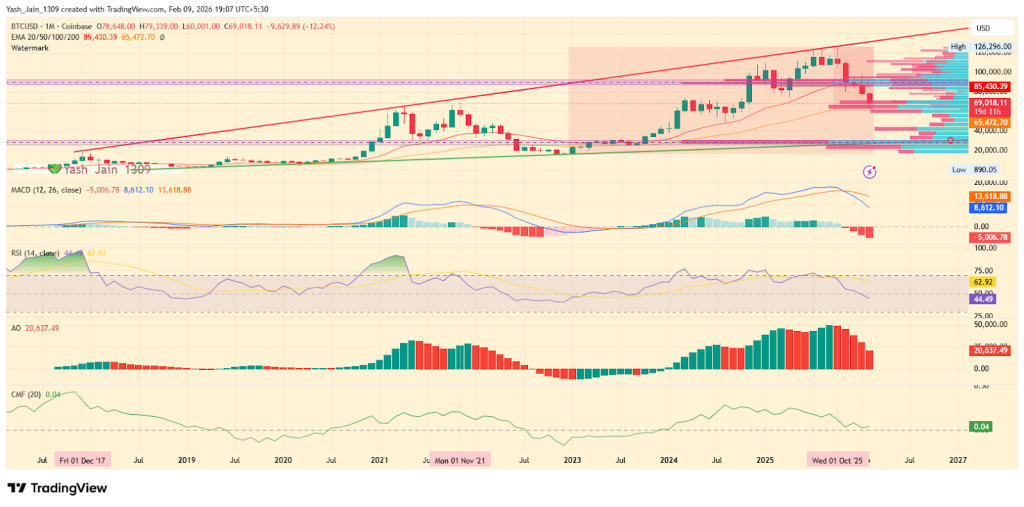
In early 2026, Bitcoin is in a correction phase after peaking at around $126,296 in October 2025. A potential bottom may occur around December 2026, with significant support expected between $25,900 and $30,350. Historical trends suggest this decline could reach 70%-76%, potentially bringing Bitcoin down to the lower border of the ascending broadening wedge’s support. This period may mark the end of the bear market, with 426 days in total, similar to historical correction periods, and pave the way for a rally in the next year.
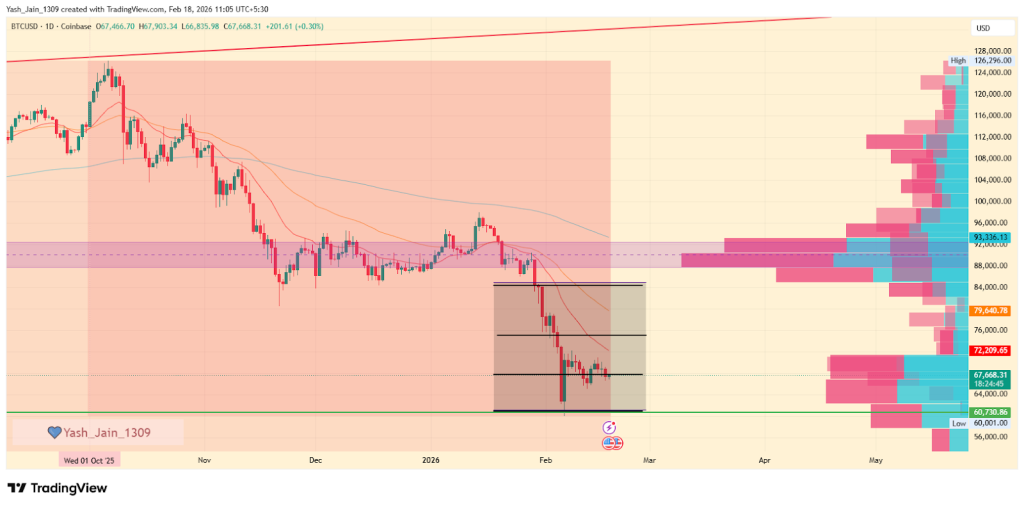
What is the Bitcoin price prediction for today?
The BTC price may range between $66,615.28 and $68,434.43 today.
As of mid-February 2026, the price of Bitcoin is currently hovering near $70,000, following a significant decline from its late January level of approximately $90,000. In the short term, the support level at $60,000 is critical in preventing Bitcoin from exploring lower price points.
Several key levels have been breached, leading traders to await a definitive indication of a short-term bottom before committing to larger investments. Overall, market sentiment appears shaky, trending more towards a bearish outlook. The Crypto Fear and Greed Index indicates a status in the Extreme Fear zone, and Bitcoin ETFs have not experienced sufficient inflows since September 2025.
Furthermore, the 50-day EMA is currently positioned below the 200-day EMA, signaling that the death cross has been in effect since mid-November. Also, a shorter-term death cross between the 20-day and 50-day EMA bands occurred in late January, further substantiating the prevailing bearish trend.
Consequently, traders are now focused on the $60,000-$65,000 range as the next pivotal support zone. Should this level be breached, it may lead to forced selling. The month of February has commenced with volatility, and this choppy market behavior may persist until there is a substantial return of buyers. If buyers re-enter the market in significant numbers, the primary target for February is projected to be $74,750, with a secondary target of $84,900 in the short term.
While the bearish market structure remains dominant, any potential shift towards a bullish trend will be contingent upon overcoming the $93,500 level of the 200-day EMA. Until such a breakthrough occurs, the overall market outlook will remain bearish.
Bitcoin Price Prediction 2026
The current price action in early 2026 confirms that Bitcoin price is following a well-defined historical rhythm within its long-term ascending wedge. After reaching a peak of approximately $126,296 in October 2025, the market has entered a significant correction phase.
This peak was not accidental; it represented a direct hit on the upper resistance boundary of the wedge pattern that has governed Bitcoin’s macro price action for years. Historically, these touches lead to extended periods of decline the first major crash from $21,000 lasted 427 days, while the second from $69,000 lasted 426 days. If this 14-month corrective cycle holds true, we are looking at a “target date” for a definitive bottom around December 2026.
The intensity of the sell-off in February 2026 was largely driven by a failure to reclaim the $87,800–$92,950 supply range. According to the anchored volume profile, this zone represented the highest momentum area of the previous bearish move, and once it flipped from support to resistance, the downward pressure has accelerated. Since markets don’t go straight, there will be attempts to rise, but the likelihood is high that they will occur in the future as fakeouts and result in further decline.
As we look toward the remainder of 2026, the charts suggest that the most significant high-momentum demand area sits much lower, specifically between $25,900 and $30,350.
This range represents a crucial “interest zone” where institutional buyers previously stepped in and where the lower support of the ascending wedge is likely to converge by year-end.
Statistically, Bitcoin’s major crashes have shown a trend of diminishing returns in terms of percentage drawdowns. The late 2017 onwards crash saw an 87.25% decline, and the 2022 crash reached 78.65%. Following this trajectory of “dampening volatility,” the current third crash is projected to result in a 70%-76% approx decline. From the $126,000 ATH, a 76% correction would push the price toward that critical $30,000 region.
Consequently, the prediction for December 2026 is a final test of the wedge’s lower border within this demand zone, marking the end of the current bear cycle and setting the stage for the next period of accumulation and next big rally could occur in 2027 onwards.
BTC Price Indicator Analysis 2026
Similarly, the technical indicators shows that Bitcoin price has already entered a danger zone we haven’t seen in years. On a deeper look at the monthly RSI, BTC has a legendary track record of never hitting “oversold” levels; it usually bottoms out right around the 40 mark. Right now, we’re sitting at 44.49 and sliding fast. This isn’t just a dip it’s the classic signal that the bearish momentum is finally taking over and heading for that historical floor.
The indicators under the hood are screaming the same thing. The MACD has already locked in a bearish cross, and the gap between the lines is widening. In past crashes, the selling hasn’t stopped until those lines flattened out near the zero mark. We aren’t even close to that “exhaustion” point yet, meaning there is plenty of room for this to bleed out further.
Even the “smart money” indicator (CMF) is still showing positive inflows for now, but that’s actually the scary part. Once that green line snaps below zero and heads toward -0.20, that’s when the real panic hits. We aren’t at the end of the crash; we’re in the middle of it. Don’t mistake this for exhaustion, as the collapse toward the pattern’s lower border would soon intensify.
Month
Potential Low
Potential Average
Potential High
2026
$30,000-$45,000
$90,000 – $101,000
$115,000 – $118,000
Bitcoin Price On-chain Outlook
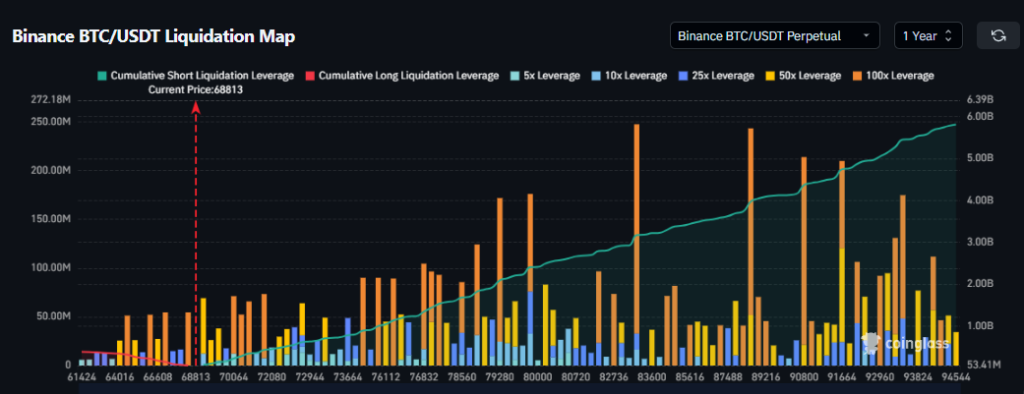
Liquidation data shows roughly $5.81 billion on the short side, compared with just over $380 million on the long side. That imbalance matters because it’s completely dominated by bears and bulls, with no room for survival. It suggests traders are leaning into weakness rather than preparing for a sustained rebound.
In other words, the futures market isn’t buying the bounce. It’s betting against it.
And if BTC price drifts lower again, that heavy short positioning could amplify volatility rather than cushion it. This is why any BTC price prediction right now carries asymmetric risk.
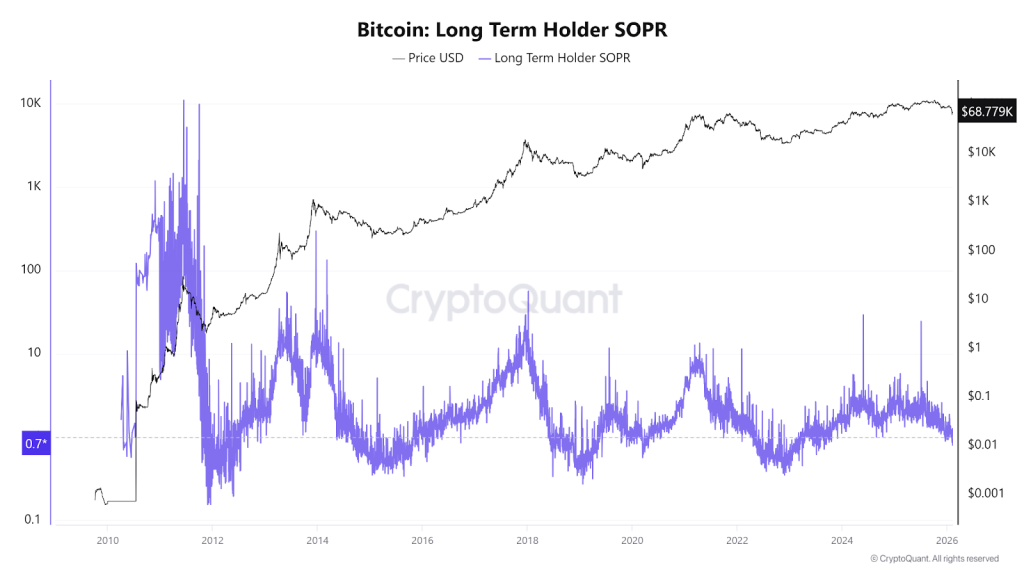
Moreover, the BTC long-term holder SOPR chart shows a current value of 0.7, which is below 1, indicating that more long-term investors are selling at a loss. And it’s seen when more holders keep selling at a loss, this metric has a history of hitting the 0.2-0.3 mark, which has truly seen a fresh demand. For now, the long-term trend is more bearish.
Recent Events Affecting Bitcoin’s Price
The transition from late 2025 into early 2026 saw Bitcoin flip from a booming success story into a struggling “bear market.” After hitting its peak in October, the excitement cooled off fast as the fundamental pillars holding up the price began to crumble at the same time.
By December, the “cheap money” era felt officially over. The Federal Reserve confirmed that high interest rates weren’t going anywhere, and the nomination of Kevin Warsh to replace Jerome Powell signaled a shift toward even tighter financial discipline. This left investors spooked, fearing a future without the safety net of central bank support.
The situation worsened in January when big institutional players started pulling their money out of spot ETFs to lock in profits. At the same time, rising tensions between the U.S. and Iran proved that Bitcoin isn’t yet seen as a “safe haven” but investors ditched crypto for actual gold to avoid the risk.
Finally, a “double blow” of bad news drained what was left of the market’s momentum. Crucial crypto legislation, the CLARITY Act, got stuck in the Senate, leaving the industry in legal limbo. Meanwhile, new fears about quantum computing threats to blockchain security started to circulate. Together, these events broke the market’s confidence, pushing the price toward the lower end of its long-term trend.
Bitcoin Crypto Price Prediction 2026 – 2030
Year
Potential Low ($)
Potential Average ($)
Potential High ($)
BTC Price Forecast 2026
150K
200K
230K
BTC Price Prediction 2027
170K
250K
330K
Bitcoin Predictions 2028
200K
350K
450K
BTC Price 2029
275K
500K
640K
Bitcoin Price Prediction 2030
380K
750K
900K
BTC Price Forecast 2026
The BTC price range in 2026 is expected to be between $150K and $230K.
BTC Price Prediction 2027
Subsequently, the Bitcoin price range can be between $170K to $330K during the year 2027.
Bitcoin Predictions 2028
With the next Bitcoin halving, the price will see another bullish spark in 2028. Specifically, as per our Bitcoin Price Prediction, the potential BTC price range in 2028 is $200K to $450K.
BTC Price 2029
Thereafter, the BTC price for the year 2029 could range between $275K and $640K.
Bitcoin Price Prediction 2030
Finally, in 2030, the price of Bitcoin is predicted to maintain a positive trend. Indeed, the BTC price is expected to reach a new all-time high, ranging between $380K and $900K.
Based on the historic market sentiments and trend analysis of the largest cryptocurrency by market capitalization, here are the possible Bitcoin price targets for the longer time frames.
Year
Potential Low ($)
Potential Average ($)
Potential High ($)
2031
$540,830.43
$901,383.47
$1,261,936.86
2032
$757,162.60
$1,261,936.86
$1,766,711.60
2033
$1,059,945.80
$1,766,711.60
$2,473,477.75
2040
$5,799,454.28
$9,665,757.13
$13,532,059.98
2050
$161,978,188.65
$269,963,647.74
$377,949,106.84
Bitcoin Prediction: Analysts and Influencers’ BTC Price Target
“Jack Dorsey, former Twitter CEO (now X), predicts Bitcoin could exceed $1 million by 2030 due to its ecosystem growth and increasing adoption.”
Cathie Wood, CEO of Ark Invest, projects Bitcoin to reach $1.5 million by 2030, driven by institutional adoption and its position as digital gold.”
“Wall Street broker Bernstein believes 2026 will mark the start of a tokenization “supercycle,” maintaining its $150,000 Bitcoin price target for this year and $200,000 for the 2027 cycle peak.”
“Brad Garlinghouse, the Ripple CEO, predicts Bitcoin will hit $180,000 in 2026, due to favorable market and regulatory conditions.”
Never Miss a Beat in the Crypto World!
Stay ahead with breaking news, expert analysis, and real-time updates on the latest trends in Bitcoin, altcoins, DeFi, NFTs, and more.
FAQs
What are the biggest risks to Bitcoin’s price in 2026?
Major risks include global recessions, tighter crypto regulations, declining liquidity, or a sustained breakdown below key support levels.
How much will BTC be worth in 2030?
Bitcoin price forecasts for 2030 range from $380K to $900K, driven by scarcity, long-term adoption, and expanding institutional participation.
What will be the price of Bitcoin in 2050?
While uncertain, many long-term projections suggest Bitcoin could exceed $1 million by 2050 if it becomes a global store of value.
Is Bitcoin still a good hedge against inflation in the long term?
Bitcoin’s fixed supply makes it attractive as an inflation hedge, especially during currency debasement and long-term economic uncertainty.
The live price of the Cardano token is $ 0.28065516.
Price prediction suggests potential to reach $2.75 to $3.25 by year-end 2026.
Long-term forecasts indicate ADA could hit $10.25 by 2030.
The Cardano price prediction 2026 is generating significant buzz in the crypto market, as the last quarter is soon to close in few days, boosting interest for the next altcoin. The 2025 for ADA/USD began with numerous fundamental updates strengthening its future, including the transformative Plomin Hard Fork, but 2026 seems even more constructive.
Now, Questions abound: “Will Cardano spearhead the altcoin movement?” and “What heights can ADA reach by 2050?” Explore this Cardano price prediction 2026 and beyond, filled with expert insights and ambitious forecasts.
Coinpedia’s Cardano Price Prediction
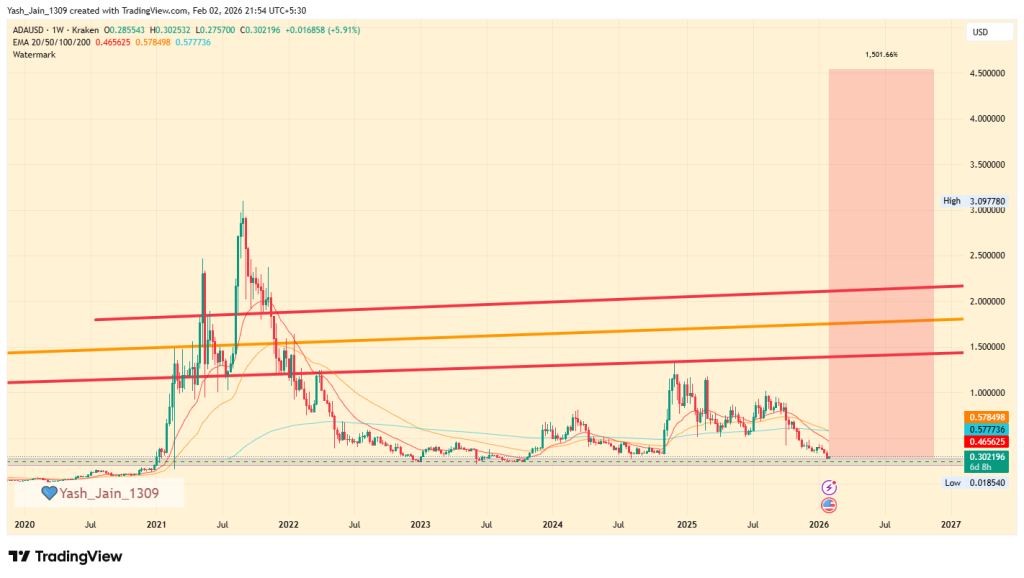
The Cardano price outlook for 2026 is promising, driven by its extraordinary 4,000% surge in 2020 and currently holding strong at a significant support level. With a positive shift in market sentiment, even a moderate increase could lead to a remarkable 1,000% rise, positioning Cardano around $4.50.
A more conservative target of $1.40 indicates a solid 300% gain based on existing trends. Analysts are broadly optimistic that upcoming ETF approvals will boost institutional adoption and market stability, with price projections ranging from $2.05 to $2.80.
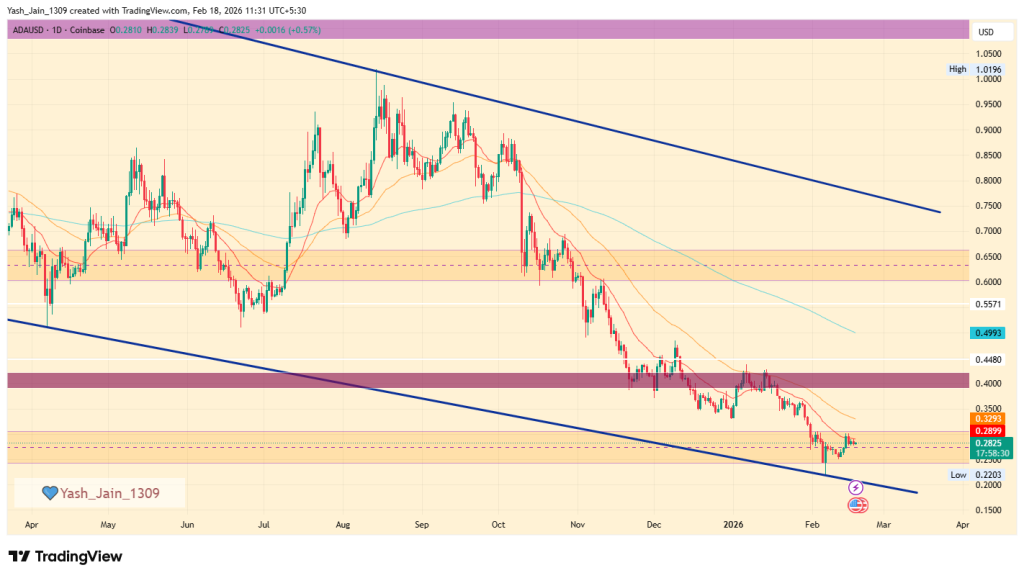
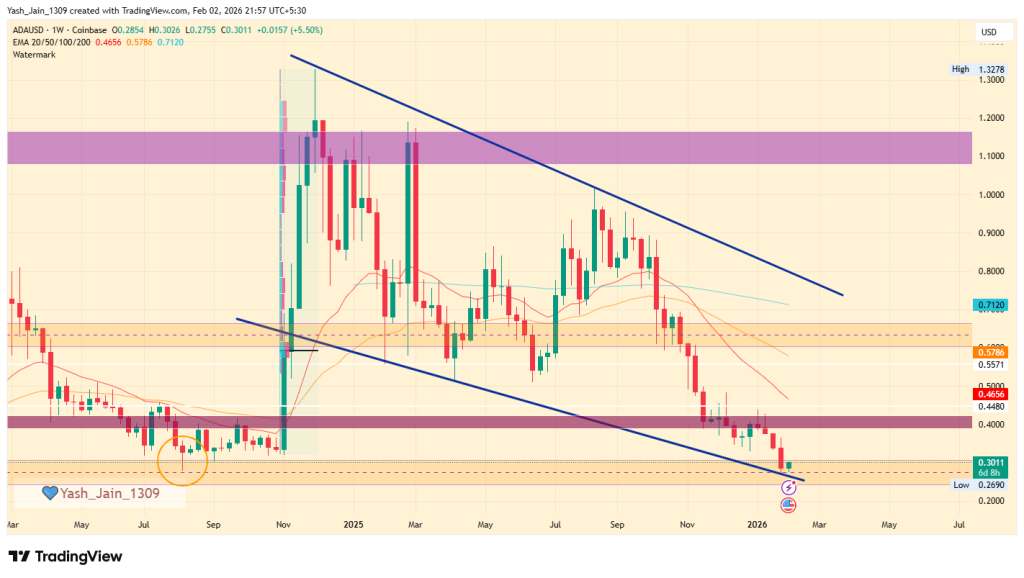
The ADA price is currently experiencing a significant monthly sell-off. However, early February has revealed a crucial demand zone where new buying interest seems to be responding in the short term, but if the broader market improves, then more demand is likely to emerge, setting the stage for a potential bullish rally. Additionally, the lower boundary of the falling wedge is providing solid support, indicating that a price spike could be imminent at some point. Therefore, it is anticipated that ADA could potentially reach $0.40 this month. On the other hand, if BTC collapses again, ADA might drop to $0.20 or even lower.
Cardano AI Price Prediction For February 2026
Source
Low Price
Average Price
High Price
Gemini
$0.85 – $0.95
$1.00 – $1.20
$1.30 – $1.50+
BlackBox
$0.65
$1.00
$1.50
ChatGPT
$0.75
$0.95
$1.25
ADA Price Prediction 2026
The Cardano price forecast for 2026 points to an important support level on its weekly chart, a range that has consistently acted as a strong pivot point for price trends, and is currently giving off signals of another potential rally. This support level is known for displaying remarkable resilience over time, suggesting that if Cardano price USD can maintain its position above this threshold once again, it could pave the way for significant price movements in 2026.
Looking back at Cardano’s historical performance on the weekly chart, it shows an extraordinary rally in 2020, when the asset posted staggering gains of nearly 4,000%. During that bullish phase, the Cardano price USD spent an extended period consolidating around the dynamic support trendline, which appears to be a strategic accumulation at discounts from smart money, contributing significantly to its eventual surge.
If the current market sentiment shifts positively, a resurgence in investor confidence could lead to a recovery. Not ambitiously, even modestly, past performance could give a tremendous surge. Last year’s performance was 4000%. If we assume 1/4 of that momentum, it would result in an increase of approximately 1000%, potentially elevating Cardano’s price to $4.50 by 2026.
Conversely, a more conservative approach suggests a realistic price target of around $1.40, indicating a potential increase of about 300%. This estimate remains feasible, especially since it is based on fundamental analyses and market trends that are not reliant on speculative triggers, such as the possible approval of exchange-traded funds (ETFs).
Additionally, many experts propose that these ETFs could significantly impact the market by boosting institutional investment and improving market stability. In a situation where ETF approvals occur and retail investor excitement rises, Cardano’s price could realistically range from $2.05 to $2.80.
Scenario
Potential Low
Average Price
Potential High
Without ETF Approval
$0.85
$1.10
$1.25
With ETF Approval + Retail Surge
$1.20
$1.65
$2.05
Bullish Breakout (with ETF & macro support)
$1.50
$2.05
$2.80
Cardano On-chain Analysis
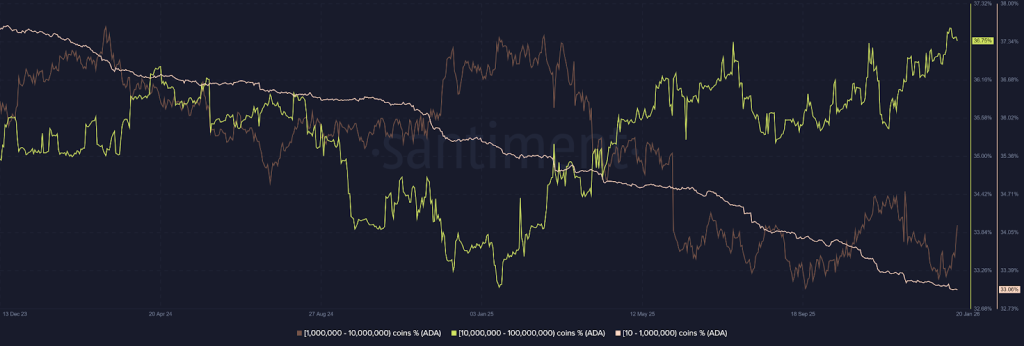
As per Cardano’s on-chain metrics, “Smart Money” accumulation phase is the best observation right now, because the divergence between retail and institutional holders is more vivid than ever.
As the number of addresses holding between 10 and 1 million ADA is declining, and the consistent surge in the 10 million to 100 million coin bracket confirms this, this represents a major supply consolidation. The observation shows that these mega-whales are strategically absorbing the “weak hands” during price dips, effectively building a rock-solid fundamental floor for the asset. Also, the fact that the 1M to 10M coin bracket is also growing confirms that professional high-net-worth investors seem to be positioning for a recovery, too.
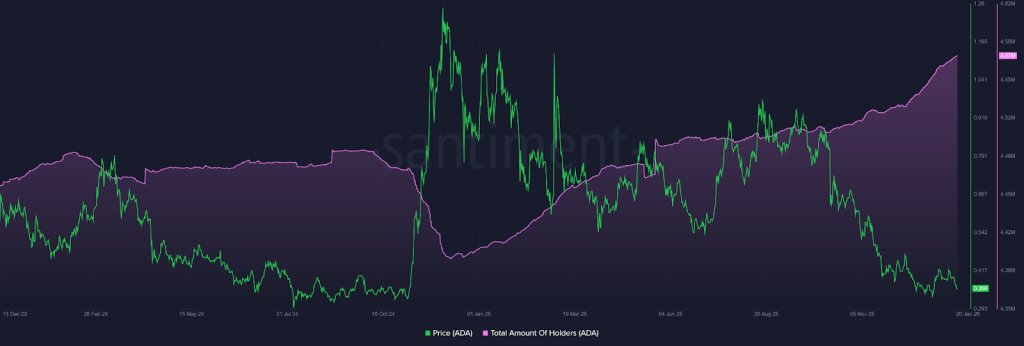
Similarly, the surge to 4.57 million total holders despite a grueling 2025 proves that Cardano’s ecosystem is expanding its reach even in a “stress test” environment. This growth in the holder base suggests that the asset is not being abandoned; rather, it is being redistributed into a more stable, long-term foundation. When a holder count rises as prices fall, it signals that the market views current levels as a deep-value opportunity rather than a reason to exit.
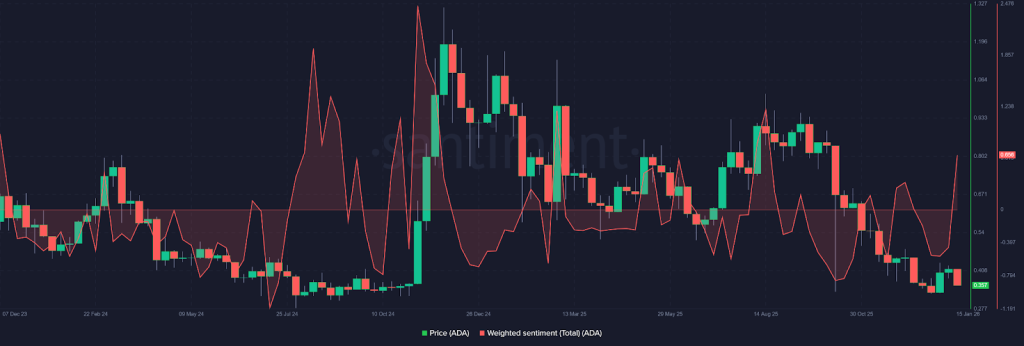
Additionally, the Weighted Sentiment flipping the 0 line to 0.656 is a crucial momentum trigger. Professionally, this “0-line flip” indicates that the aggregate social and market bias has shifted from fear to optimism.
Combined with the strategic whale accumulation, this sentiment pivot suggests that the “disbelief” phase is ending and that a bullish rally is likely once the remaining retail sell pressure is fully absorbed by the growing whale cohorts.
Cardano (ADA) Price Prediction 2026 – 2030
Price Prediction
Potential Low ($)
Average Price ($)
Potential High ($)
2026
2.75
3.00
3.25
2027
4.50
4.75
5.00
2028
5.25
5.50
5.75
2029
6.75
7.25
7.75
2030
9.00
9.75
10.25
This table, based on historical movements, shows ADA prices to reach $10.25 by 2030 based on compounding market cap each year. This table provides a framework for understanding the potential Cardano price movements. Yet, the actual price will depend on a combination of market dynamics, investor behavior, and external factors influencing the cryptocurrency landscape.