Reading view

Is Litecoin’s (LTC) Price Rally Over—Or Is a Surprise Breakout Coming?

SEC Canary Litecoin ETF

The post Is Litecoin’s (LTC) Price Rally Over—Or Is a Surprise Breakout Coming? appeared first on Coinpedia Fintech News

Litecoin isn’t the market favorite it once was. Since the beginning of the year, the price has dropped more than 36%, sliding to around $45 before showing signs of life during the recent market bounce. Even with that recovery, LTC price remains stuck below $55, a level that now acts as a ceiling rather than support. The broader signals still lean cautious, and momentum hasn’t fully shifted in favor of the bulls. 

That said, the chart structure suggests this compression could resolve higher. If buyers manage to push past $55 with strength, a move toward $70–$75 could quickly come into play.

Drop in Open Interest Hints Long Liquidations

Litecoin’s open interest tells a clear story of fading conviction. Over the past few months, both price and open interest have trended lower, signaling long liquidation rather than aggressive new short positioning. In simple terms, traders are stepping away instead of building fresh bets. The steady decline in OI suggests deleveraging and reduced speculative participation, which often accompanies weak momentum phases.

litecoin price

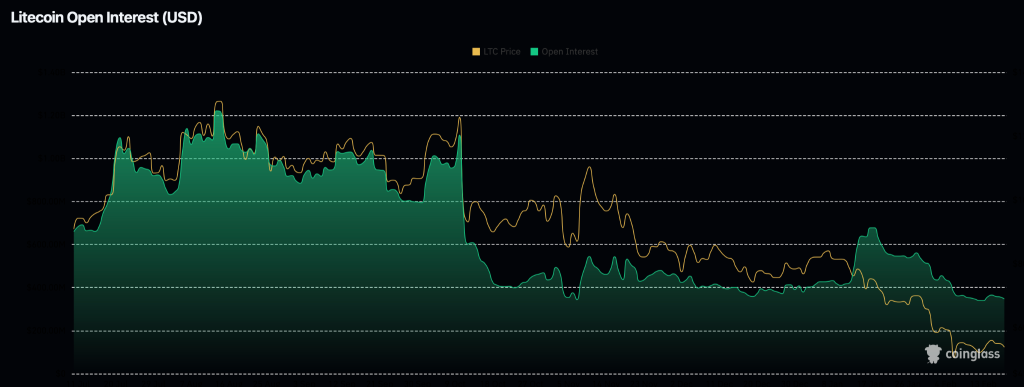
Interestingly, previous spikes in open interest were followed by sharp price swings, but the current environment shows contraction instead of expansion. This drop in participation reflects caution across derivatives markets. It explains why LTC struggles to sustain recoveries; without rising open interest, breakout attempts lack the fuel needed for a sustained move higher.

What’s Next for the LTC Price Rally?

On the 4-hour chart, Litecoin is forming a tightening structure just beneath the $55–$56 resistance zone. Price continues to print higher lows along the rising trendline near $49–$50, suggesting buyers are gradually stepping in. However, the horizontal resistance around $55 remains firm, creating a developing ascending triangle setup.

ltc price

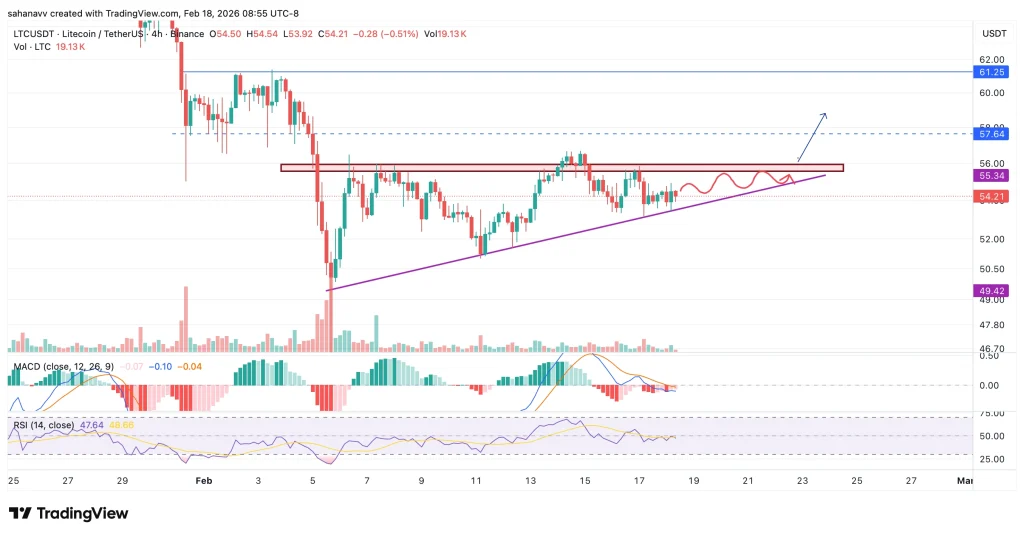
Momentum indicators reflect indecision. The MACD is flattening near the zero line, showing weakening bearish pressure but no strong bullish expansion yet. Meanwhile, RSI hovers around the mid-40s to 50 region, signaling neutral momentum without clear dominance. If bulls manage a clean breakout above $56 with volume, LTC could target $61–$62 next. On the downside, a breakdown below $49 would invalidate the structure and expose $45 support.

The Bottom Line

The Litecoin price is sitting at a make-or-break level. The structure still favors a potential upside breakout, but momentum hasn’t fully confirmed it yet. As long as the price continues to defend the rising trendline near $49–$50, bulls retain a short-term edge. A decisive move above $56 could quickly shift sentiment and open the path toward $61 and possibly $65 if follow-through builds.

However, failure to hold the trendline would weaken the setup significantly. A breakdown below $49 would likely trigger renewed selling pressure, dragging LTC back toward $45. For now, patience is key—the next breakout or breakdown should define Litecoin’s direction for the coming sessions.

Chainlink Back in Pre-Breakout Accumulation Zone—Will LINK Price Stay Below $10?

“Infinitely Better” LINK Could Beat XRP Over the Next 10 Years, Says Lark Davis

The post Chainlink Back in Pre-Breakout Accumulation Zone—Will LINK Price Stay Below $10? appeared first on Coinpedia Fintech News

Chainlink price is once again trading at a critical turning point. After losing most of its gains, it slipped back into a price zone that previously acted as a prolonged accumulation base before the 2023 breakout. That shift alone changes the short-term narrative from expansion to compression.

Momentum has cooled, bullish continuation attempts have stalled, and traders are now watching whether this is a temporary reset or the early stages of a broader range-bound phase. The key question isn’t just whether LINK can bounce, but whether it can reclaim higher structure and rebuild strength above major resistance. Until that happens, the bias tilts toward consolidation rather than immediate breakout continuation.

LINK Re-Enters Macro Accumulation Zone as Momentum Weakens

On the weekly chart, LINK has slipped back into the same $6–$10 accumulation range that formed after the May 2022 breakdown. Back then, price entered the range after a sharp rejection, RSI dropped below 50, and volatility contracted for months before a base was established. The current setup looks similar. Momentum has faded again, RSI is hovering in the weak zone, and upside attempts are getting rejected near dynamic resistance.

link price

The Gaussian Channel shows trend exhaustion rather than expansion, reinforcing the shift from trending to ranging conditions. $8 is immediate support for the LINK price rally, followed by the range floor near $6. A breakdown below $6 could open $4.50–$5. On the upside, LINK must reclaim $10 on a weekly close to target $12 and potentially $15. Until then, consolidation remains the dominant bias.

What’s Next for the Chainlink (LINK) Price Rally?

Chainlink is at a structural crossroads. While the current setup resembles the 2022–23 accumulation phase, one key difference could prevent a prolonged range: a strong market-wide expansion led by Bitcoin. If BTC breaks into sustained price discovery and liquidity flows back into large-cap altcoins, LINK could invalidate the slow-accumulation thesis much faster. A decisive reclaim of $10 with expanding volume would signal early strength and open the path toward $12–$15. However, without a broader risk-on catalyst, LINK is more likely to remain range-bound, building energy before its next major move.

Top Reasons the Crypto Market May Be Headed for a ‘Reset’—Is a 2022-Style Bottom Forming?

Exclusive! Coinpedia’s 2025 Crypto Report Reveals Market Prices, ETF Growth, Hacks & Funding

The post Top Reasons the Crypto Market May Be Headed for a ‘Reset’—Is a 2022-Style Bottom Forming? appeared first on Coinpedia Fintech News

Ever since the Bitcoin price slipped below the psychological $100,000 mark, sentiment across the crypto market has steadily deteriorated. The breakdown under $90,000 intensified the shift, pushing market mood from neutral into clear fear territory. Traders are now leaning increasingly bearish on Bitcoin and the broader market, with many beginning to speculate that a deeper reset could be underway. 

As volatility rises and confidence weakens, comparisons to the 2022 bottom are starting to resurface. Here are the key reasons why the crypto market may be heading toward a similar reset phase.

Capital Flowing Out of the Markets

Although the BTC prices have dropped nearly 50% from their ATH above $126K,  many fail to mark this rally as a bear market. Moreover, the market participants believe that a strong recovery could be initiated in a short while. However, the Glassnode data suggests that the crypto markets are yet again replicating the 2022-like pattern. 

btc price

The above chart shows the sustained outflow is once again being seen in the crypto market, which is strongly reminiscent of the 2022 bear market. Since the start of the month, the BTC price has dropped,  and the 30-day inflow has dropped as outflows have reached the previous bear market bottom levels. Meanwhile, the stablecoin inflows have also reduced at the same time. 

Altcoin Sell-Pressure Just Hit a 5-Year Extreme

This chart shows the 1-year cumulative buy/sell volume difference for altcoins, excluding Bitcoin and Ethereum, alongside BTC’s price. The orange area represents net buying versus selling pressure on centralized exchanges. When it trends downward, it signals sustained net selling in altcoins.

btc price

Recently, the metric has plunged sharply into deeply negative territory, marking one of the most aggressive sell-offs in years. This suggests heavy distribution or even capitulation across the altcoin market. Interestingly, similar extreme readings in the past have aligned with broader market bottoms or late-stage corrections. The sharp drop implies risk-off behavior, liquidity withdrawal, and growing fear, conditions often seen during major market reset phases.

When Will the Crypto Markets Undergo a ‘Reset’? 

This chart highlights Bitcoin’s long-term price cycles against the 200-week moving average (green line), a key structural support level across every major bear market. The shaded red zones mark the 2011, 2014, 2018, 2022, and a potential 2026 bear phase.

btc price
Source:X

Historically, Bitcoin has consistently retraced toward or slightly below the 200-week MA during deep corrections before establishing a macro bottom. Each touch of this level has marked high-probability accumulation zones for long-term traders. The current structure suggests price is once again approaching this critical support region. If the 200-week MA holds, it could form the base for the next expansion phase. 

A decisive breakdown, however, would signal a deeper structural shift, which may ‘reset’ the crypto market and begin with a recovery phase. 

Cardano Bounces, But Bearish Structure Remains—Can the Bulls Push ADA Price to $0.5

Cardano (ADA) Reclaims a Key Resistance—Is a Major Rally About to Begin

The post Cardano Bounces, But Bearish Structure Remains—Can the Bulls Push ADA Price to $0.5 appeared first on Coinpedia Fintech News

Following the latest rebound in Bitcoin and Ethereum, Cardano’s price has also staged a modest recovery. ADA opened the session near $0.281 and continues to trade slightly above that level, around $0.282, after retreating from an intraday high of $0.2858. However, trading volume has continued to decline even as price action holds above local support at $0.275. 

While this suggests underlying demand is attempting to build, repeated failures to reclaim the $0.30 resistance level could keep the broader bearish structure intact, raising concerns about the strength of the current bounce.

Cardano (ADA) Price Analysis For This Week

In the short term, the ADA price is trading within an average range where the volume is decreasing, and the volatility is compressing. The squeeze in the Bollinger bands validates this claim, which also points towards a major move incoming. With this, the price has entered a decisive phase where an upcoming move may either rise by more than 8% to reach $0.3 or undergo an 8% pullback to reach $0.25. 

ada price

Cardano price continues to consolidate within a tight range near the midline of its rising parallel channel, reflecting market indecision. The RSI has hovered around the neutral 50 level for several sessions, keeping price action compressed within an accumulation zone. Meanwhile, the bands are beginning to squeeze, a setup that typically precedes expansion. A decisive move, backed by volume, could either drive ADA toward the $0.30 resistance or drag it back toward the $0.25 support region

Even if bulls manage a breakout above $0.30, the higher-timeframe structure still leans bearish, with lower highs intact. Notably, long-term volatility bands are also compressing, signaling the potential for a larger directional move ahead. A sustained push toward $0.36 would be required to invalidate the broader bearish bias and shift sentiment decisively in favor of the bulls. Until then, the risk of a deeper corrective move continues to shadow the ongoing recovery attempt of the Cardano (ADA) price rally. 

Will the ADA Price Reach $0.5 in February?

In the past few days, the traders seem to have shifted their focus to Cardano as the platform’s social activity has surged to a large extent. The recent data from LunarCrush suggests that the creators, engagements, mentions and posts have risen significantly compared to the previous week or month. 

The top trending discussion around Cardano is the integration of USDCx, a stablecoin, by the end of the month. Followed by the launch of the futures contract for Cardano by CME Group and the ongoing development regarding the Rosetta Java v2.0.0 upgrade. These suggest the market participants are optimistic over the ADA price rally, which may have a positive impact in the coming days. 

Ethereum Reclaims $2,000 as Bitcoin Breaks Above $68K—What’s Next for BTC and ETH Prices?

Harvard Dumps Bitcoin for Ethereum

The post Ethereum Reclaims $2,000 as Bitcoin Breaks Above $68K—What’s Next for BTC and ETH Prices? appeared first on Coinpedia Fintech News

In recent weeks, the crypto market has reportedly been consolidating or experiencing a small recovery during Asian trading hours, which is then liquidated with the start of the US trading session. Currently, the top two tokens, Bitcoin and Ethereum, surged beyond their respective resistance at $68,000 and $2,000. While the rally remains stuck within a consolidation, a deeper correction or a strong breakout may only prevent the bears from restricting the prices from securing the threshold at $70,000 for BTC & $2,500 for ETH. 

Bitcoin Price Analysis for Today: Will Bulls Validate the Current Rebound?

Following a strong recovery from the lows below $60,000, the top crypto seems to have gone into a hibernating mode. The BTC price is maintaining a horizontal consolidation, trading within a pre-determined resistance and support at $71,321 and $65,522 for more than a week. At the same time, the volume has been consistently plunging, hinting towards a lowered participation of the traders. In such conditions, it would be interesting to watch how long the BTC price will sustain above $68,000. 

bitcoin price

The short-term price action indicates the price is stuck within a decisive symmetrical triangle and triggered a rebound from the support. Despite this rebound, the 50-day MA continues to act as an immediate resistance, while the MACD shows a drop in the selling pressure. Considering the chart patterns, it appears that the BTC price may remain consolidated below $68,000 and may hit an intraday low around $67,300. These upswings and pullbacks may continue until the price reaches the apex of the triangle, which may further initiate a strong price action. 

Ethereum Price Analysis for Today: Can ETH Hold Above $2000?

Ethereum price has been failing to rise above the $2,150 resistance since its breakdown in the first few days of the month. Therefore, these levels have now become a local threshold to break, which may even attract a substantial buying volume. For now, the rise above $2000 appears to be short-lived, as the buying pressure has remained within an average range. 

ethereum price

The ETH price is closely following the BTC price rally, as the second-largest token is also stuck within a decisive symmetrical triangle. The volatility is shrinking as the Bollinger bands have begun to squeeze in the short term. On the other hand, the stochastic RSI has entered the upper threshold, and the levels are heading for a bearish crossover that may push the prices lower. The chart patterns suggest the consolidation may continue, and the ETH price may close the day’s trade below $2000 but above the local support at $1914. 

Crypto Market Update Today: Bitcoin, Ethereum, XRP, Latest News and Price Data

5 Key Reasons Why the Crypto Market Is Up Today?

The post Crypto Market Update Today: Bitcoin, Ethereum, XRP, Latest News and Price Data appeared first on Coinpedia Fintech News

In the past 24 hours, no major change has been seen in the crypto markets, except for the Bitcoin price, which experienced a minor pullback. The token maintained a tight consolidation until the start of the US trading session and plunged by over $1500 in minutes. With this, the price closed the day’s trade at around $67,500, dropping from the highs around $69,200. The trading volume around BTC has been consistent, around $35 billion, hinting towards an average participation of the traders. 

Interestingly, the other top cryptos within the top 10 remain stuck within a tight range. Ethereum consolidates below the local resistance at $2000 while XRP sustains at $1.45, Solana is close to $85, BNB is above $615, and Dogecoin is above $0.1. The crypto market capitalisation surged briefly above $2.3 trillion, but the volume dropped marginally from $98 billion to $84 billion. In the times when the crypto market sentiments have improved a bit, the Santiment data tells a different story. 

crypto market

The chart above shows that traders’ sentiment has become extremely negative. The market participants seem to have been extremely disappointed, angry, and fearful, as keywords such as ‘Angry’, ‘Frustrated’, or ‘offended’ have reached their highest levels since Trump was first elected. These extreme negative sentiments often signal an opportunity for those positioned as contrarians.

Bitcoin-Led Selling, Liquidations and Weak Institutional Demand

Bitcoin price fell 0.78%, contributing over 80% of the total market’s decline. The drop triggered $67.01 million in forced liquidations over 24 hours, with long positions making up 74% of the total. This suggests the market is following Bitcoin’s lead, and hence a sustained break below the $65,000 spot bid zone may trigger another wave of liquidations. 

On the other hand, the spot Bitcoin ETFs have seen four consecutive weeks of outflows, with over $133 million leaving last week alone. The on-chain data suggests the current accumulation is notably weaker than during the November 2025 bounce. This suggests the institutional buying has cooled a bit, and hence, a reversal in weekly ETF net flows from negative to positive may signal renewed institutional confidence. 

Near-Term Outlook: Here’s What to Watch Out for This Week

The immediate outlook hinges on Bitcoin’s ability to defend the $65,000 to $67,000 range. Key resistance sits at the 7-day simple moving average near $70,000. The next major macro catalyst is the release of U.S. PCE inflation data on February 28. Holding the support is pretty crucial to prevent a deeper correction, and a rise above $70,000 would help neutralize the short-term bearish structure. 

Overall, the current dip is driven by Bitcoin’s weakness, amplified by liquidations and tempered by institutional inflows. The crypto market is looking for a base as the sentiment is stuck in extreme fear. Therefore, now the question arises for the week whether spot demand can absorb selling pressure at the $65,000 support or if fatigue sets in for a retest of lower levels.

Bitcoin Price Prediction: Will BTC Drop to $65K Before a Short Squeeze Toward $75K?

Bitcoin Price Analysis Could BTC Surge Above $100K Next Week

The post Bitcoin Price Prediction: Will BTC Drop to $65K Before a Short Squeeze Toward $75K? appeared first on Coinpedia Fintech News

Bitcoin price is once again stuck below the psychological $70,000 level, and the price action is starting to feel compressed.

After multiple attempts to reclaim the $69,500–$70,000 zone, BTC continues to face rejection. The repeated failures have increased short-term selling pressure, while leverage builds on both sides of the market. Open interest remains elevated, and funding has begun to shift, a sign that traders are positioning aggressively for the next move.

When leverage expands during tight consolidation, volatility usually follows. The real question now is simple: Will BTC price sweep liquidity below $65,000 first or break higher and squeeze shorts toward $75,000?

Bitcoin Liquidation Map Shows Heavy Liquidity at $65K and $72K–$75K

The Bitcoin exchange liquidation map reveals two major liquidity clusters: a dense long liquidation zone near $65,000–$64,000, and a growing short liquidation pocket between $72,000 and $75,000. Currently trading around $67,000–$68,000, BTC is sitting between these two liquidity pools, effectively trapped in what traders call a “liquidity sandwich.”

bitcoin price
Source: X

Markets tend to move toward the nearest and largest liquidity cluster first. In this case, the heavier and closer pool sits below the current price. That increases the probability of a move toward $65K to trigger long liquidations before any sustained rebound. However, once that liquidity is absorbed, the path toward the upside cluster opens, especially if short positions begin to stack above $70K. This setup favors volatility expansion in both directions.

Bitcoin Price Chart: Key Levels to Watch

On the short-term price chart, Bitcoin has already lost the 0.382 Fibonacci level near $67,200, indicating weakening momentum. The next technical level sits at 0.5 retracement: $65,700 and 0.618 retracement: $64,300. These align closely with the liquidation cluster below, reinforcing the idea that a sweep toward the $65K zone is technically and structurally reasonable.

bitcoin price

So far, BTC continues to print lower highs on the intraday timeframe. That keeps the short-term structure tilted bearish unless the price reclaims $70,000 with conviction.

In simple terms:

  • Below $70K, sellers remain active
  • Below $67K, downside liquidity becomes vulnerable
  • Below $65K, cascade risk increases

Bullish Scenario: Liquidity Sweep Followed by a Short Squeeze Toward $75K

In the bullish case, Bitcoin first drops toward $65,000, triggering long liquidations and absorbing downside liquidity. If buyers step in aggressively at that level and funding resets, BTC could rebound sharply. A reclaim of $70,000 would likely trap late shorts and open the door toward the $72K–$75K short liquidation cluster.

A squeeze through $72K could accelerate momentum quickly, potentially pushing BTC toward $75,000 before facing fresh resistance. This scenario depends on strong spot buying near $65K, stabilizing open interest and short build-up above $70K.

Bearish Scenario: Breakdown Below $65K Extends the Correction

If $65,000 fails to hold, the setup changes materially. A decisive break below $64,000 (0.618 Fib) could trigger a deeper liquidation cascade. In that case, Bitcoin may extend toward the $62,000–$60,000 support region.

For this bearish continuation to unfold, selling pressure must remain persistent, and open interest would need to decline further without meaningful absorption. That would invalidate the short-squeeze thesis, at least temporarily.

Final Outlook: Bitcoin at a Liquidity Decision Point

Bitcoin is not trending cleanly right now; it is compressing between major liquidity zones. The market is building leverage on both sides, and that usually precedes sharp moves. The liquidation map suggests $65K is the nearest magnet. What happens there will likely determine whether the BTC price rallies toward $75K or slides into a deeper correction.

For now, $70,000 remains the immediate barrier, and $65,000 is the level that could trigger the next wave of volatility.

Solana (SOL) Price Consolidates Near $85 — Here’s Why a Break Above $90 Could Trigger a Bigger Move

Solana Price Could Slide to $50 if $75 Support Breaks—Here’s the Bullish and Bearish Scenario

The post Solana (SOL) Price Consolidates Near $85 — Here’s Why a Break Above $90 Could Trigger a Bigger Move appeared first on Coinpedia Fintech News

The crypto market is witnessing one of its weakest stretches since 2018, with Bitcoin price marking its fifth consecutive monthly loss. The persistent decline in Solana price has shaken trader confidence and kept bulls from opening fresh positions. Meanwhile, the derivatives market has seen a sharp reset, as funding rates turn negative and open interest drops alongside prices. Against this backdrop, Solana continues to struggle below the key $90 level, which has emerged as a short-term ceiling. The question now is whether SOL can gather enough momentum to break above $90 this week—or face another rejection.

Shorts Piling Up Around $95

The 1-week SOL liquidation heatmap shows where leverage is heavily stacked and where sharp price reactions are most likely. A dense liquidity cluster of more than $10 billion sits around $90–$92, which explains why Solana has repeatedly stalled near this zone. If SOL pushes into this range again, it could trigger short liquidations, often resulting in a fast spike toward $95–$100 before cooling off.

SOL price

With prices currently ranging between $84 and $88, SOL remains in a liquidity-driven phase, where moves are likely to accelerate once these key zones are tested. These are reportedly said to be late shorts which have been trapped. Therefore, if the Bitcoin price displays some strength, then the Market Makers are believed to wipe out these short positions, paving the way for a breakout beyond $100. 

Solana’s Bearish Doji Suggests Momentum May Be Fading

The weekly price action of Solana appears to be more concerning, suggesting the price is at the foothill of a deeper correction. After a strong competition between the bulls and the bears, the price has begun to test the lower ranges. A confirmation of a bearish reversal, which seems to be more likely, is expected to drag the SOL price back below $80. 

SOL price

After losing nearly 70% of its previous gains, SOL has now dropped into a crucial support zone that once acted as a major resistance barrier. This level previously capped upside attempts, making the current retest structurally significant.

The weekly OBV continues to trend sharply lower, reinforcing the broader bearish momentum and suggesting that buying pressure remains weak. Adding to the caution, the current weekly candle opened below the prior week’s close, which had formed a Doji Star, a pattern often associated with trend exhaustion and potential continuation to the downside.

A similar structure previously triggered a sharp decline from above $250 to nearly $125, followed by months of sideways consolidation. If history repeats and this pattern plays out again, Solana (SOL) price could face another deep pullback, with the next major support zone emerging around $50 or potentially even lower.

SUI Price Analysis: Why $10 Could Be the Next Explosive Target

Why SUI Price is Up Today? 

The post SUI Price Analysis: Why $10 Could Be the Next Explosive Target appeared first on Coinpedia Fintech News

After weeks of steady selling pressure, the SUI price is now standing at a crucial point. The token recently slipped below the key $1 support level, extending a clear pattern of lower highs and lower lows. Sellers have controlled the structure for some time, and the latest breakdown pushed SUI back into the price range it traded in before the 2025 breakout. Now, price is sitting inside a familiar demand zone that previously sparked strong upside momentum.

In the meantime, the descending resistance remains firmly in place, and there are no confirmed signs of a trend reversal yet. So the big question is simple: can this support zone trigger a rebound, or is SUI preparing for another leg lower?

SUI faced a sharp rejection in the early days of the year, which quickly evolved into a deeper correction, wiping out nearly 55% of its previous gains. Although bulls stepped in to slow the decline, they failed to reclaim and hold above the crucial $1 level, keeping the broader structure under pressure. At present, price continues to trade below key resistance, suggesting sellers still hold the upper hand. However, similar demand zones in the past have triggered strong rebounds. The question now is whether bulls can regain momentum or if another leg lower is still ahead.

sui price

SUI is not “just consolidating”—it’s compressing after a completed impulse, which is exactly where asymmetric trades form. The weekly structure shows two full expansion cycles (+505% and +1050%), each preceded by a falling wedge and a higher low on the macro trendline. The current price action is repeating that same playbook.

What matters now is where risk is defined. The $0.90–$0.95 zone is the line bulls must defend. Price is compressing into the apex of the wedge while volatility is contracting, a classic pre-expansion condition. This is not weakness; it’s energy storage.

If the SUI price reclaims $1.30–$1.36 on a weekly close, it confirms Wave 3 initiation. That opens measured targets at $2.22 → $3.53 → $4.90, with an extended cycle projection toward $6.5–$13 if momentum mirrors prior waves. Failure only occurs on a weekly close below $0.85; until then, downside is defined, and upside is exponential.

FAQs

What is causing SUI’s recent price drop?

SUI fell below $1 due to sustained selling pressure, lower highs, and failed attempts by bulls to reclaim key resistance levels.

Can SUI rebound from its current demand zone?

A rebound is possible if buyers reclaim $1.30–$1.36 on a weekly close, confirming a potential bullish Wave 3 cycle.

What are the potential targets if SUI turns bullish?

Measured upside targets start at $2.22, followed by $3.53 and $4.90, with extended projections toward $6.5–$13.

When would SUI confirm a bearish failure?

SUI would confirm downside failure only on a weekly close below $0.85, which defines risk for bulls and sellers’ control.

Bitcoin Price Prediction: Is the BTC Bottom Finally In—or Is More Pain Ahead?

Why Is Bitcoin Crashing Today Analysts Say Synthetic BTC Supply Is the Real Problem

The post Bitcoin Price Prediction: Is the BTC Bottom Finally In—or Is More Pain Ahead? appeared first on Coinpedia Fintech News

Bitcoin price has entered a make-or-break phase. After months of sustained strength and a rally to fresh highs above $126K, BTC is now retracing toward a major long-term support zone—one that previously defined cycle bottoms in 2018, 2020, and 2022. As price cools, signs of distribution are emerging: profit-taking has increased, whale wallets are moving coins to exchanges, and higher-timeframe momentum is beginning to fade.

With volatility compressing and sentiment turning cautious, the market is approaching a critical turning point. The BTC price behavior around $65,000 and $68,000 is pretty important that may set the tone for the next price action. 

What’s next for the Bitcoin (BTC) price? Has the crypto reached the bottom, or is there more pain ahead?

Bitcoin Approaches Long-Term Ascending Support

Bitcoin’s chart is now highlighting a crucial consolidation period after having been on a bullish tear that saw it hit brand new highs above $126K. The price is starting to pull back & tighten up towards a historically significant support zone that’s roughly between $68K and $70K, a spot that’s been the place where the cycle bottoms have been marked previously. 

Things are getting a bit more serious as we see a retracement going on at the moment, & this is happening alongside the higher time frame momentum starting to fade out—which suggests the rally is losing steam rather than suddenly turning on a dime. 

btc price

The volume & on-chain indicators are also showing us that the large holders are taking profits & getting a bit cautious at the same time. Still, though, structurally speaking, BTC is still holding above its long-term support lines, keeping the broader trend picture looking pretty good. However, a decisive reaction at this zone will be super important—because if it holds up, it could be a real kick in the pants for the price to go even higher—whereas a breakdown here may actually trigger a deeper pullback before the trend actually starts to continue back upwards.

SOPR Signals Profit Compression and Holder Stress

On-chain data is reinforcing the idea that the market is entering a stress phase. The Spent Output Profit Ratio (SOPR), particularly when analyzed across long-term and short-term holders, is trending lower toward the neutral 1.0 zone. SOPR near 1 indicates coins are being spent close to their cost basis. In simple terms, profitability is compressing.

btc price

Historically, deep corrections often see SOPR reset toward this level before a new upward expansion begins. It reflects:

  • Reduced profit-taking
  • Diminished speculative excess
  • Holder reset conditions

However, sustained movement below 1 would indicate widespread capitulation, where coins are being sold at a loss. At present, SOPR is compressing but not yet signaling full capitulation. That leaves Bitcoin in a transitional phase rather than a confirmed bottom.

Whale Inflow Ratio Raises Volatility Risk

Another important metric is the whale inflow ratio on Binance. Recent data shows elevated whale inflows to exchanges while price declines. This typically suggests that large holders are transferring BTC to trading platforms, increasing the potential for sell-side liquidity.

btc price

Whale inflow spikes often occur during:

  • Distribution phases
  • Volatility expansions
  • Pre-capitulation events

Such spikes can precede local breakdowns, but they also appear during final flushes before reversals. The key is whether inflows remain persistently elevated or normalize as support holds. Right now, whale behavior is adding uncertainty rather than confirming a direction.

What’s Next for the Bitcoin Price Rally?

Currently, the Bitcoin price has not confirmed a bottom, nor has it confirmed a breakdown either. It is just compressing. The profitability is tightening, and momentum is cooling, but large players are pretty active. The upcoming breakout may have a deep impact on the rally, as if the price stabalises above $70,000, it could form another macro higher low and keep the broader bull structure intact. 

Besides, a decisive breakdown below the range may drag the SOPR below 1. Besides, the whale inflow may remain elevated, which may raise the possibility of visiting the lower support range between $55,000 and $60,000. Here is when the crypto market reset may occur, initiating a strong recovery phase for the Bitcoin price rally. 

❌