Uniswap Price Prediction 2026, 2027 – 2030: Will Uniswap Reach $50?
The post Uniswap Price Prediction 2026, 2027 – 2030: Will Uniswap Reach $50? appeared first on Coinpedia Fintech News
Story Highlights
- The live price of the UniSwap crypto token is $ 3.86373902.
- Price predictions for 2026 range from $5.00 to $10.00.
- Long term forecasts suggest UNI price may hit $30.00 by the end of 2030.
Founded in 2018 by Hayden Adams, Uniswap has transcended its origins as a simple Ethereum-based Automated Market Maker (AMM) to become the undisputed backbone of the decentralized finance (DeFi) economy. By mid-2026, the protocol has achieved a staggering $4.0 trillion in all-time volume, supported by 119 million swappers and $2.6 billion in Total Value Locked (TVL).
Uniswap Labs continues to dominate the landscape by offering a seamless, no-fee trading experience backed by deep, on-chain liquidity. Beyond simple swaps, its sophisticated Liquidity Pools allow users to earn yield by powering the very markets they trade in. As Uniswap integrates deeply with the on-chain economy into a single platform, the central question for investors remains:
Will UNI reach $70? How high can UNI go in five years? Let’s take a look at Uniswap price prediction 2026 -2032 to provide answers to these queries.
Uniswap Price Today
| Cryptocurrency | Uniswap |
| Token | UNI |
| Price | $3.8637
|
| Market Cap | $ 2,448,565,639.75 |
| 24h Volume | $ 254,027,439.8054 |
| Circulating Supply | 633,729,562.7465 |
| Total Supply | 898,364,420.0366 |
| All-Time High | $ 44.9741 on 03 May 2021 |
| All-Time Low | $ 0.4190 on 17 September 2020 |
Table of contents
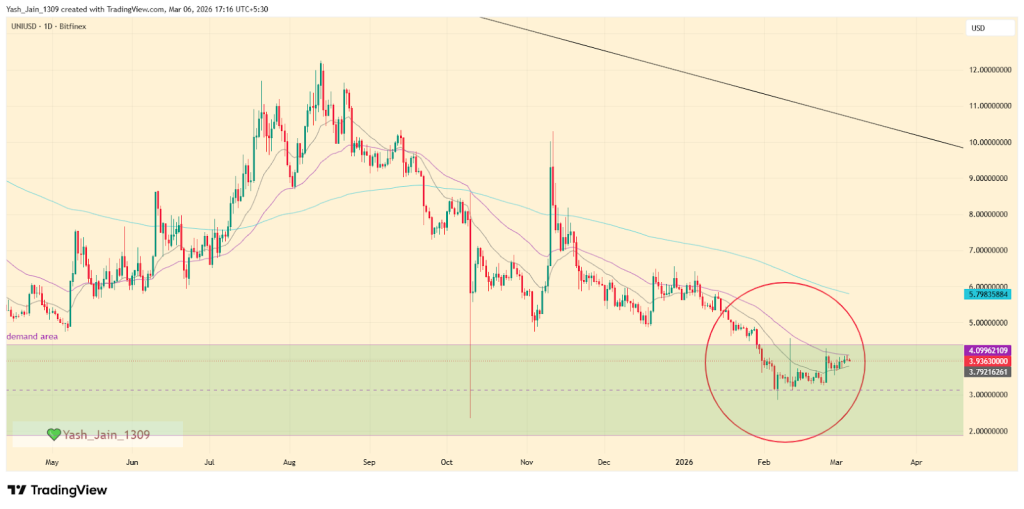
Uniswap Price Prediction March 2026
On the daily timeframe, Uniswap (UNI) experienced a significant downturn throughout the first quarter of 2026. The breakdown below the $5.00 support base in January accelerated the decline, eventually leading the price to a multi-year floor near $3.00 price level by early February.
However, the remainder of February saw a sustained bullish reaction, characterized by steady absorption within the historical demand zone. This price action suggests a shift from distribution to accumulation as the market begins to value UNI/USD within the mid-range of its primary support box.
Now, heading into March, the technical outlook hinges on the interaction with the 50-day EMA. Therefore, if UNI price successfully flips the 50-day EMA and breaches the upper border of the current consolidation box, a recovery toward the $6.00 liquidity pocket is highly probable before the month concludes.
Conversely, if selling pressure intensifies, the $3.00 level remains the line in the sand. A failure to hold this psychological floor would likely result in a capitulation event, sending UNI price toward the $2.00 mark to seek deeper liquidity.
Recent News / Opinions
On March 3, 2026, Judge Failla of the Southern District of New York dismissed the Risley class action against Uniswap Labs and Hayden Adams with prejudice. This ruling effectively clears the protocol of all federal and state claims, providing a massive regulatory green light for the DEX’s operations.
Uniswap recently announced a strategic collaboration with Securitize to integrate BlackRock’s USD Institutional Digital Liquidity Fund (BUIDL) into the UniswapX ecosystem. Launched on February 11, this integration allows institutional-grade assets to be traded directly on-chain, bridging the gap between TradFi and decentralized liquidity.
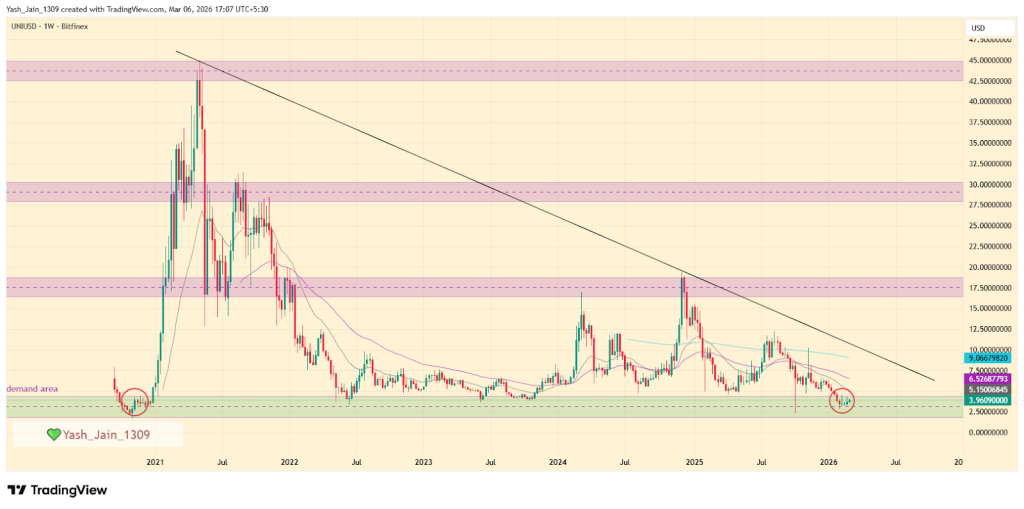
UNI Price Prediction 2026
As of Q1 2026, Uniswap (UNI) is currently consolidating within a highly-crucial demand zone ranging from $1.80 to $4.50. This specific price floor carries immense historical weight, as it served as the original launchpad for the 2021 bull run that saw UNI skyrocket to its $44.50 all-time high.
For the first time in five years, the price has returned to this foundational level, effectively completing a full market cycle. This re-entry into the “genesis demand zone” suggests a significant long-term accumulation phase is underway, as long-term holders seek to front-run a potential structural shift in DeFi liquidity.
While the market awaits a catalyst as explosive as the 2021 rally, the current price action is also defined by a massive descending triangle pattern. This structure indicates that while selling pressure is exhausting at the multi-year floor, the price remains capped by a descending resistance line.
Throughout 2026, a steady recovery setup appears more likely than a vertical spike. Technical targets for the year point toward a possible retest of the $10.00 level, which aligns perfectly with the pattern’s upper border. A confirmed weekly breakout above this resistance could signal the end of the long-term bear cycle and the beginning of a sustained move toward mid-range targets.
UNI Crypto Price Prediction 2026 – 2030
| Year | Potential Low ($) | Potential Average ($) | Potential High ($) |
| 2027 | 7.00 | 10.00 | 13.50 |
| 2028 | 8.50 | 11.50 | 18.00 |
| 2029 | 10.00 | 15.50 | 22.00 |
| 2030 | 12.00 | 19.00 | 32.00 |
Uniswap Price Prediction 2027
The UNI price range can be between $7.00 to $13.50 during the year 2027.
Uniswap Price Forecast 2028
The UNI Network price for 2028 is anticipated to lie within the range of $8.50 to $18.00.
Uniswap Coin Price Prediction 2029
In 2030, the price of UNI is expected to systain trend and remain positive. It may trade between $10.00 and $22.00.
Uniswap (UNI) Price Prediction 2030
Finally, in 2030, the price of UNI is predicted to maintain a steady and positive. It may trade between $12.00 and $32.00.
UNI Price Prediction 2031, 2032, 2033, 2040, 2050
Based on the historic market sentiments and trend analysis of the largest cryptocurrency by market capitalization, here are the possible UNI price targets for the longer time frames.
| Year | Potential Low ($) | Potential Average ($) | Potential High ($) |
| 2031 | 19.00 | 29.00 | 39.00 |
| 2032 | 26.50 | 35.00 | 41.00 |
| 2033 | 35.00 | 37.00 | 44.00 |
| 2040 | 42.00 | 52.00 | 57.00 |
| 2050 | 55.00 | 62.00 | 70.00 |
UNI Price Prediction: Market Analysis?
| Year | 2026 | 2027 | 2030 |
| Changelly | $13.25 | $15.80 | $20.10 |
| CoinCodex | $10.90 | $14.85 | $19.45 |
| Binance | $12.40 | $15.10 | $20.85 |
CoinPedia’s UNI Price Prediction
Uniswap (UNI) is consolidating in a key demand zone of $1.80 to $4.50, marking a return to its foundational level from the 2021 bull run. A descending triangle pattern suggests potential for a steady recovery throughout 2026, with targets around $10.00. A breakout above this resistance may signal the end of the bear cycle.
Never Miss a Beat in the Crypto World!
Stay ahead with breaking news, expert analysis, and real-time updates on the latest trends in Bitcoin, altcoins, DeFi, NFTs, and more.
FAQs
Uniswap is a leading decentralized exchange protocol, allowing users to trade tokens directly on Ethereum and Layer-2 networks without intermediaries.
UNI could trade between $5.00 and $10.00 in 2026 if demand for DeFi grows and the token breaks key resistance levels.
Analysts estimate UNI could trade between $7.00 and $13.50 in 2027 if DeFi activity expands and the broader crypto market remains bullish.
Forecasts suggest UNI could reach $12.00 to $32.00 by 2030 if adoption increases and Uniswap continues leading decentralized exchange trading.
UNI offers long-term potential as a key DeFi token, supported by Layer-2 adoption, stable protocol activity, and growing Ethereum ecosystem usage.