Reading view

Sui Crypto (SUI) Price Prediction 2026, 2027-2030: Is This the Best Time to Buy SUI?

Sui (SUI) Price Prediction

The post Sui Crypto (SUI) Price Prediction 2026, 2027-2030: Is This the Best Time to Buy SUI? appeared first on Coinpedia Fintech News

Story Highlights

  • The live price of SUI crypto is  $ 0.91186943.
  • SUI shows strong bullish momentum in early 2026, backed by rising TVL, ecosystem growth, and renewed investor confidence.
  • If key resistance breaks, SUI could target $3–$5 in 2026, with long-term potential extending toward $15–$18 by 2030.

As a next-generation Layer 1 blockchain, Sui is redefining the architecture of the decentralized web by introducing an object-centric model where assets, data, and permissions are natively ownable and programmable. Built to handle the demands of modern commerce, the Sui Stack provides a modular toolkit that allows developers to scale on resilient infrastructure while delivering high-performance experiences without typical blockchain trade-offs.

From powering institutional capital markets and DeFi to even revolutionizing the gaming sector, the network has already secured a significant foothold with a Total Value Locked (TVL) of $583 million, per the official website. 

By prioritizing verifiable security and composable scaling, Sui ensures that value created within its ecosystem is shared rather than extracted. In this comprehensive SUI price prediction 2026–2030, we analyze how this business-ready infrastructure and growing industry adoption will impact SUI’s token and market valuation in the years to come.

Sui Price Today

Cryptocurrency Sui
Token SUI
Price $0.9119 down -3.83%
Market Cap$ 3,556,276,817.54
24h Volume$ 457,956,126.9241
Circulating Supply3,899,984,688.4154
Total Supply10,000,000,000.00
All-Time High$ 5.3519 on 06 January 2025
All-Time Low$ 0.3643 on 19 October 2023

Coinpedia’s SUI Price Prediction 2026

SUI/USD is in a corrective phase after peaking at $5.36 in late 2024. It’s currently testing $0.80 support, with a risk of dropping to the key $0.50 level. Stabilization at $0.50 could signal a reversal. Key resistance levels to watch are $1.05, $1.60, and $2.00, while a breakout above $3.50 would confirm a trend reversal. Until then, it’s a “buy the dip” phase for long-term investors.

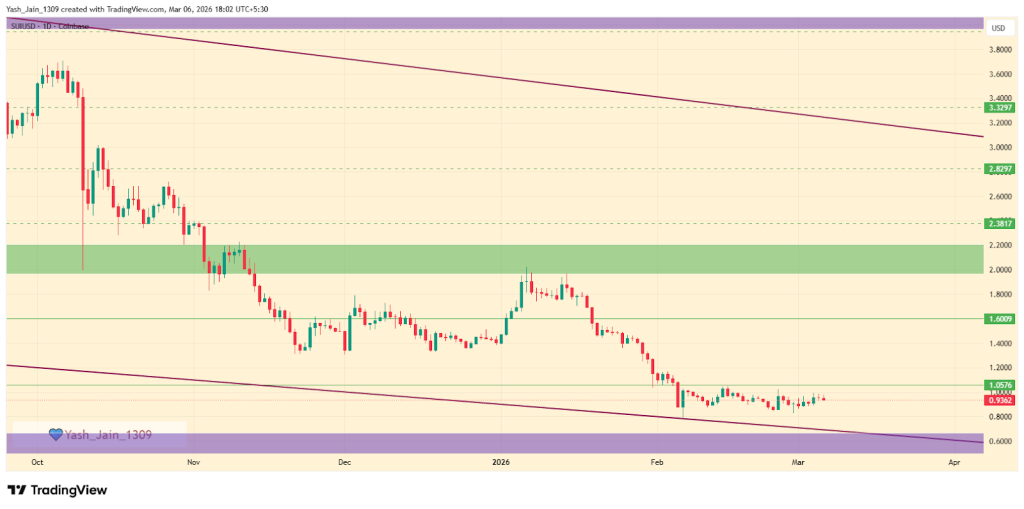
Sui (SUI) Price Prediction March 2026

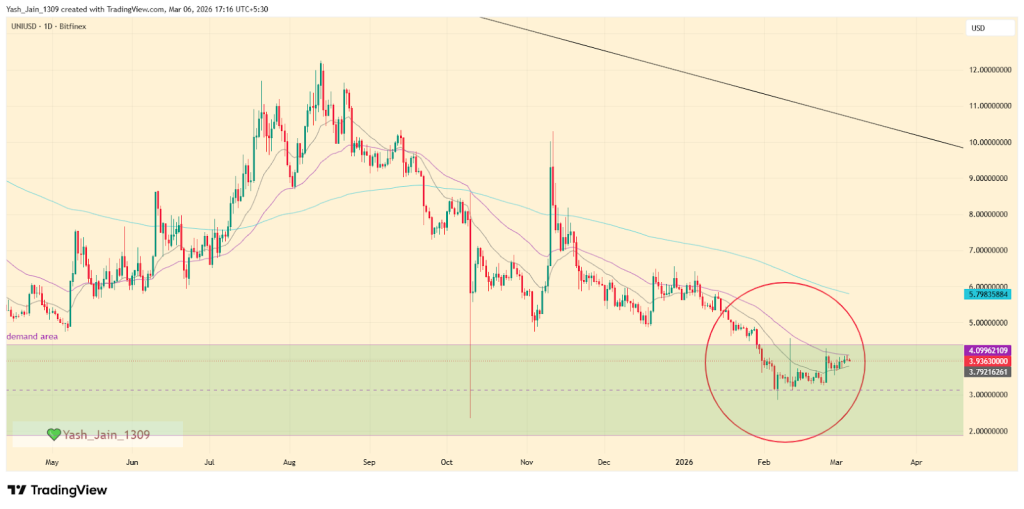
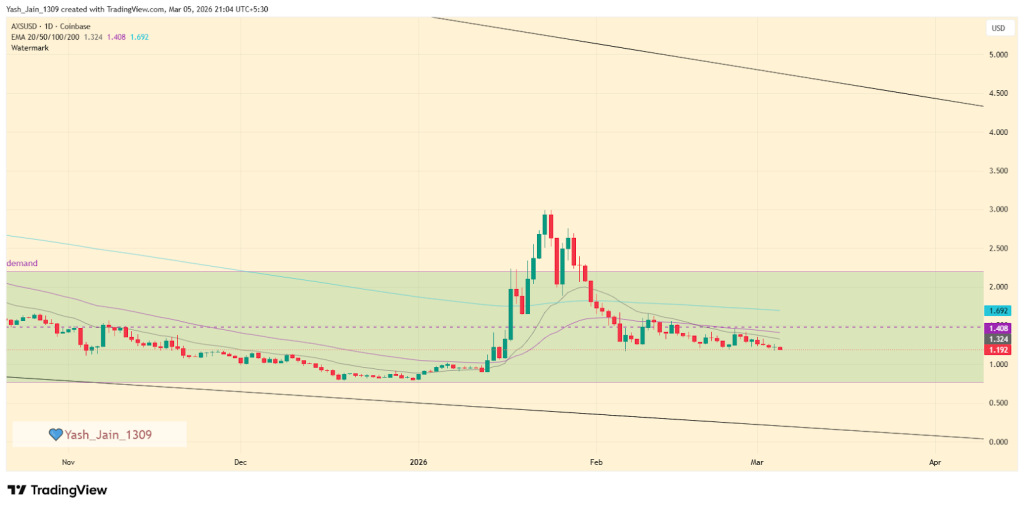
On the daily timeframe, SUI price entered 2026 with an initial retest of the $2.00 psychological level, but aggressive selling pressure forced a deep correction. This decline culminated in a macro low of $0.80 in early February. Since then, the price has been grinding sideways, carving out a tight consolidation range just beneath the $1.00 mark.

As we move through March, SUI/USD sits at a critical technical crossroads. If SUI token price manages to generate enough momentum to clear the $1.05 resistance, it would confirm a local bottom. This could trigger a rapid relief rally toward the $1.60 liquidity pocket, with an outside chance of re-testing the $2.00 supply zone before the end of the month.

Conversely, if the $0.80 support floor fails to hold, the downtrend is likely to extend into the next major interest zone. In this capitulation scenario, SUI could seek out deeper support within the $0.50–$0.60 range.

SUI Price Prediction March 2026

Sui (SUI) Crypto Price Prediction 2026

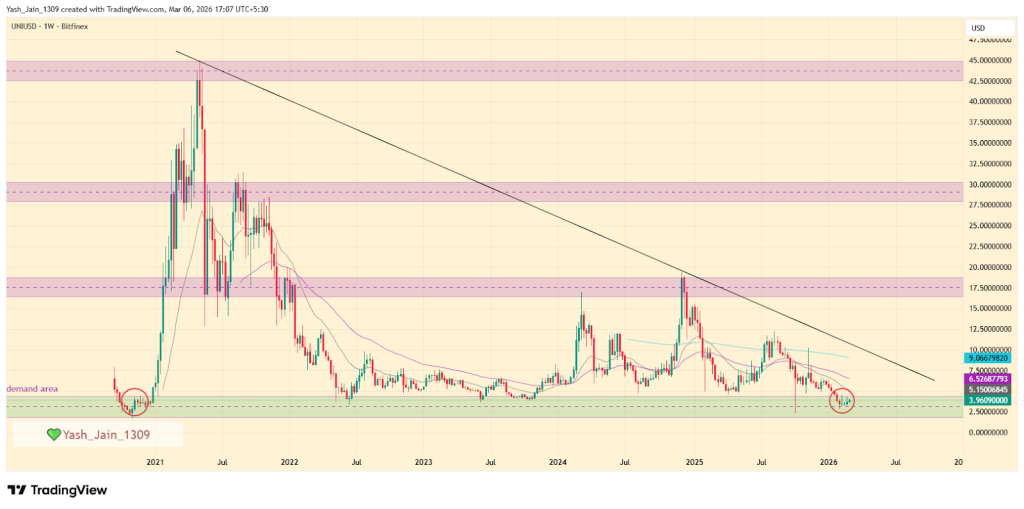
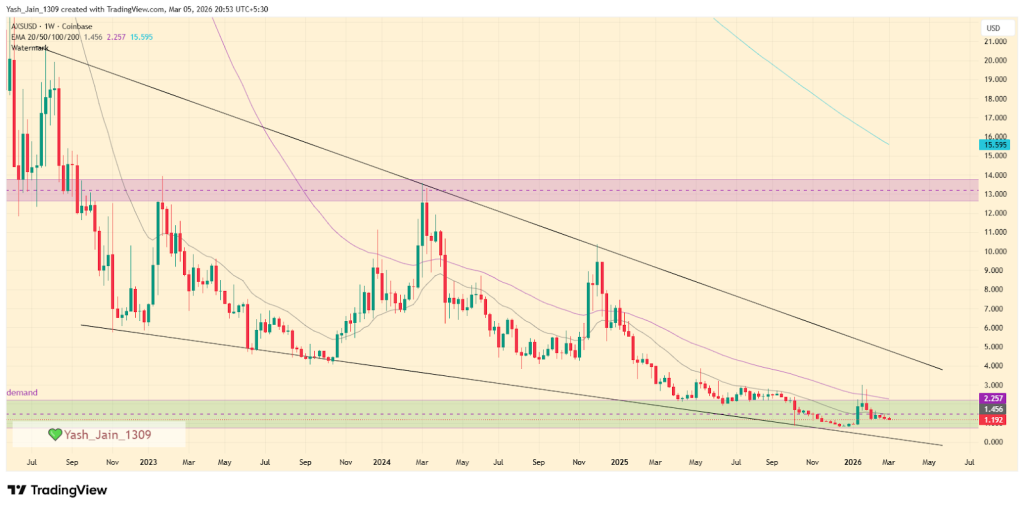
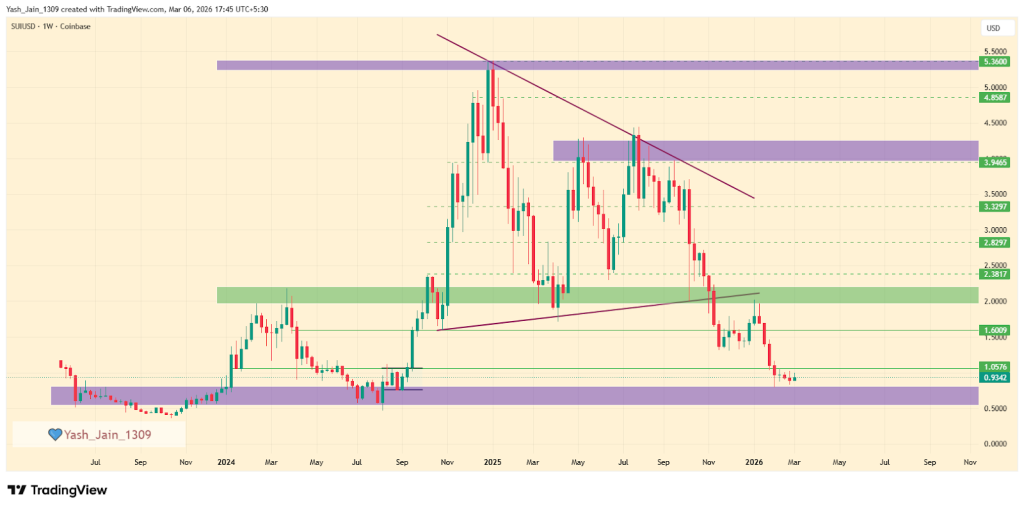
The weekly price action for SUI/USD reveals a market in a major corrective phase after its late-2024 peak, currently in Q1 2026, searching for a definitive long-term bottom. 

What we witnessed is that after the 2024’s explosive rally that topped out near $5.36, the asset entered a persistent downtrend, characterized by a series of “lower highs” capped by a prominent descending resistance line. This primary trendline has remained unbroken throughout 2025, consistently forcing the price toward deeper support levels as the initial hype cycle cooled.

Currently, the SUI price is testing $0.80 support after losing $1.05 support in Q1 2026. The odds suggest a chance of reaching the $0.50 support zone if it fails to hold $0.80, because the $0.50 area is of immense technical importance, as it represents the original “genesis” accumulation level from early 2024. 

The price has dipped a lot, and now it’s showing signs of stabilization as sellers are about to reach exhaustion once it hits $0.50. Real consolidation could begin, and a true reversal to fruit has better odds. This area serves as the “line in the sand” for bulls; maintaining this floor is essential to prevent a complete technical breakdown and to begin building a new base for the next market cycle.

Looking ahead, the chart identifies several key resistance levels that SUI must reclaim to shift its bearish structure. The immediate hurdle lies at the $1.05, $1.60, and $2.00 horizontal zones. A successful bounce from the current demand floor would likely target these levels first. 

However, a true trend reversal will only be confirmed if SUI breaks and closes above the long-term descending trendline, currently near $3.50. Until that breakout occurs, the asset remains in a “buy the dip” accumulation phase for long-term investors.

SUI Price Prediction 2026

SUI Crypto Price Prediction 2026 – 2030

YearPotential Low ($)Potential Average ($)Potential High ($)
2027$4$6$8
2028$8$10$12
2029$10$13$16
2030$12$15$18

Sui (SUI) Price Prediction 2027

Subsequently, the SUI price range can be between $4 to $8 during the year 2027. 

SUI Prediction 2028

Beyond the previous ATH,SUI bullish momentum may gain pace and will see another bullish spark in 2028. Specifically, as per our SUI Price Prediction, the potential SUI price range in 2028 is $8 to $12. 

SUI Price Forecast 2029

Thereafter, the SUI price for the year 2029 could range between $10 and $16

Sui (SUI) Price Prediction 2030

Finally, in 2030, the price of SUI is predicted to maintain a steady and positive. It can trade between $12 and $18.

SUI Price Prediction 2031, 2032, 2033, 2040, 2050

Based on the historic market sentiments and trend analysis of the largest cryptocurrency by market capitalization, here are the possible SUI price targets for the longer time frames.

YearPotential Low ($)Potential Average ($)Potential High ($)
2031$8$10$15
2032$10$13$18
2033$12$15$22
2040$20$32$40
2050$30$70$150+
Never Miss a Beat in the Crypto World!

Stay ahead with breaking news, expert analysis, and real-time updates on the latest trends in Bitcoin, altcoins, DeFi, NFTs, and more.

FAQs

What is the Sui Crypto (SUI) price prediction for 2026?

SUI could trade between $0.50 and $5 in 2026. If it breaks key resistance near $3.50, momentum may push the token toward the $3–$5 range.

How high can Sui Crypto go by 2030?

If adoption continues and the ecosystem expands, SUI could reach $12–$18 by 2030, driven by DeFi growth and network demand.

What is the Sui price prediction for 2040?

Long-term projections suggest SUI may trade between $20 and $40 by 2040, assuming strong blockchain adoption and sustained ecosystem growth.

What is the Sui Coin price prediction for 2050?

By 2050, SUI could potentially reach $30–$150+ if the network becomes widely used across finance, gaming, and Web3 infrastructure.

Where to buy Sui Crypto (SUI)?

You can buy SUI on major crypto exchanges like Binance, Coinbase, KuCoin, and OKX. Simply create an account, deposit funds, and trade for SUI.

Can SUI reach its all-time high again?

Yes, if SUI breaks above key resistance near $3 and market conditions stay favorable, a retest of its $5.35 ATH is possible.

Is SUI a good long-term investment?

SUI shows long-term potential due to its scalable Layer-1 design, growing DeFi adoption, and increasing developer and institutional interest.

What factors are driving SUI’s price growth?

Key drivers include rising TVL above $1B, strong on-chain activity, ecosystem expansion, and SUI’s reputation as a fast, scalable network.

Is XRP Price Preparing for $4 Breakout as 44M Tokens Leave Binance?

XRP Price Prediction Could Nasdaq Listing and Bullish Sentiment Push XRP to $9

The post Is XRP Price Preparing for $4 Breakout as 44M Tokens Leave Binance? appeared first on Coinpedia Fintech News

The XRP price is once again flirting with a familiar setup shrinking exchange supply and a technical pattern that’s starting to look suspiciously explosive.

Over the past few weeks, whale activity on major exchanges has quietly shifted. According to exchange flow data tracking XRP across 15 major trading platforms, one particular venue stood out: Binance. And not for the usual reasons. Because twice, large holders pulled tens of millions of tokens off the exchange.

Whales Pull Millions Off Binance in XRP

Tracking whale behavior can often reveal what the biggest market participants are doing before the broader crowd catches on. In this case, the data shows a sharp spike in negative NetFlow for XRP.

Negative flows mean tokens are leaving exchanges. On February 27, roughly 44 million XRP was withdrawn from whale wallets on Binance. That’s one of the largest outflow events visible in the dataset, per analyst Amr Taha.

But here’s where it gets interesting. Earlier that same month on February 6 another sizeable movement occurred. Around 30 million XRP left the exchange from whale-controlled wallets.

Two massive withdrawals. One month. Same exchange. That kind of pattern rarely goes unnoticed by traders who obsess over liquidity.

Why Exchange Outflows Matter

In simple terms, exchange flows can hint at market intentions. When large holders move assets into exchanges, it often suggests preparation to sell. That’s why positive NetFlow spikes can be interpreted as bearish signals.

But when the opposite happens, tokens leaving exchanges, the logic flips.

As less supply sits on trading platforms, fewer coins are immediately available for sale. If demand remains steady, the XRP price could face upward pressure.

Think of it as a liquidity squeeze. Less supply on the shelves. Same buyers walking into the store. Eventually, prices adjust.

Is XRP Price Preparing for $4 Breakout as 44M Tokens Leave Binance?

XRP Price Chart Shows Repeating Pattern

Meanwhile, the XRP price chart itself is telling its own story. On the XRP/USD three-day chart, price action has been forming a long-standing ascending channel that stretches back to late 2024. Inside that structure, the asset has been following a recurring fractal pattern.

Explosive rally. Slow descending consolidation. Then pressure builds again. Right now, XRP appears to be repeating that exact sequence.

After a sharp upward move earlier in 2025, the asset is now compressing inside a descending wedge an area often associated with accumulation.

At roughly $1.4494, XRP is sitting near the lower boundary of that wedge while simultaneously resting on a multi-month structural support zone. That combination tends to attract attention from technical traders.

Is XRP Price Preparing for $4 Breakout as 44M Tokens Leave Binance?

XRP Price Prediction Points Higher

If the current fractal plays out as previous cycles have, the next move could be aggressive.

A breakout above the wedge’s upper trendline would open the door toward the top of the broader ascending channel. In that scenario, the projected target sits around $4.0685. That would represent a potential 180% rally from current levels.

Of course, crypto markets rarely move in straight lines. But between whale withdrawals and tightening price structure, the stage is clearly being set. And if the pattern holds, the XRP price analysis suggests it may not stay quiet for long.

Bitcoin Price at Critical Turning Point as IFP Golden Cross Signals Possible Rally

AI Models Favor Bitcoin Over Fiat in New Study

The post Bitcoin Price at Critical Turning Point as IFP Golden Cross Signals Possible Rally appeared first on Coinpedia Fintech News

The Bitcoin price might be standing at one of those uncomfortable moments markets love, where bullish signals scream “rally,” but the chart quietly whispers, “careful.”

A technical signal known as the Inter-exchange Flow Pulse (IFP) indicator has just flashed a golden cross for $BTC. Historically, that crossover has marked the beginning of major rallies. According to the indicator’s interpretation, by analyst, the long correction that dragged on for nearly a year could finally be over.

Sounds exciting. Maybe even convincing. But charts rarely move in straight lines, and the market right now seems to be sitting on a knife’s edge.

IFP Golden Cross Signals Rally Start

Let’s start with the optimistic side of the story. The Inter-exchange Flow Pulse indicator recently printed a golden cross. In simple terms, that crossover has previously aligned with the start of powerful upward trends in the market.

The signal suggests the prolonged consolidation phase might have served as a long period of reaccumulation. Instead of immediately blasting higher earlier in the cycle, the asset experienced a weaker rally followed by an extended cooling-off phase.

Now, according to the indicator, momentum could be shifting again. In previous cycles, similar golden crosses on the IFP indicator marked the early stages of significant rallies. That’s why some observers are framing the current signal as the point where the “real rally” begins.

Bitcoin Price at Critical Turning Point as IFP Golden Cross Signals Possible Rally

Bitcoin Price Testing Critical Chart Level

Now here’s where the story gets interesting and a little less comfortable.

The Bitcoin price chart is reportedly testing what some analysts call the most important line on the chart. Historically, this level has acted as a decisive turning point for the market.

The pattern is fairly straightforward. When price bounced off this level in past cycles, it eventually pushed toward new all-time highs. But when the level failed to hold, the market slid into deeper bear phases.

So the same line is back in play again. Same setup. Same tension. Different cycle. Which direction it breaks could determine the next major trend.

Bitcoin Price at Critical Turning Point as IFP Golden Cross Signals Possible Rally

Market Waits For Direction

So what does the Bitcoin price prediction crowd do with that? Well, this is where things get messy. One signal says the rally is just getting started. Another says the market is testing a structural level that historically decides between explosive growth and painful declines.

In other words, the chart isn’t giving answers yet. It’s asking a question. Traders watching Bitcoin/USD know this kind of setup well: long consolidation, conflicting signals, and a market hovering right at a critical support or resistance zone.

Break upward, and the narrative quickly shifts toward momentum and new highs. Lose the level, and suddenly the tone across the market changes entirely. For now, the market is simply waiting to see which direction the Bitcoin price chooses next.

Uniswap Price Prediction 2026, 2027 – 2030: Will Uniswap Reach $50?

Uniswap Price Prediction

The post Uniswap Price Prediction 2026, 2027 – 2030: Will Uniswap Reach $50? appeared first on Coinpedia Fintech News

Story Highlights

  • The live price of the UniSwap crypto token is  $ 3.86373902.
  • Price predictions for 2026 range from $5.00 to $10.00.
  • Long term forecasts suggest UNI price may hit $30.00 by the end of 2030.

Founded in 2018 by Hayden Adams, Uniswap has transcended its origins as a simple Ethereum-based Automated Market Maker (AMM) to become the undisputed backbone of the decentralized finance (DeFi) economy. By mid-2026, the protocol has achieved a staggering $4.0 trillion in all-time volume, supported by 119 million swappers and $2.6 billion in Total Value Locked (TVL).

Uniswap Labs continues to dominate the landscape by offering a seamless, no-fee trading experience backed by deep, on-chain liquidity. Beyond simple swaps, its sophisticated Liquidity Pools allow users to earn yield by powering the very markets they trade in. As Uniswap integrates deeply with the on-chain economy into a single platform, the central question for investors remains: 

Will UNI reach $70? How high can UNI go in five years? Let’s take a look at Uniswap price prediction 2026 -2032 to provide answers to these queries.

Uniswap Price Today

Cryptocurrency Uniswap
Token UNI
Price $3.8637 down -4.45%
Market Cap$ 2,448,565,639.75
24h Volume$ 254,027,439.8054
Circulating Supply633,729,562.7465
Total Supply898,364,420.0366
All-Time High$ 44.9741 on 03 May 2021
All-Time Low$ 0.4190 on 17 September 2020

Uniswap Price Prediction March 2026

On the daily timeframe, Uniswap (UNI) experienced a significant downturn throughout the first quarter of 2026. The breakdown below the $5.00 support base in January accelerated the decline, eventually leading the price to a multi-year floor near $3.00 price level by early February. 

However, the remainder of February saw a sustained bullish reaction, characterized by steady absorption within the historical demand zone. This price action suggests a shift from distribution to accumulation as the market begins to value UNI/USD within the mid-range of its primary support box.

Now, heading into March, the technical outlook hinges on the interaction with the 50-day EMA. Therefore, if UNI price successfully flips the 50-day EMA and breaches the upper border of the current consolidation box, a recovery toward the $6.00 liquidity pocket is highly probable before the month concludes.

Conversely, if selling pressure intensifies, the $3.00 level remains the line in the sand. A failure to hold this psychological floor would likely result in a capitulation event, sending UNI price toward the $2.00 mark to seek deeper liquidity.

Uniswap Price Prediction March 2026

Recent News / Opinions

On March 3, 2026, Judge Failla of the Southern District of New York dismissed the Risley class action against Uniswap Labs and Hayden Adams with prejudice. This ruling effectively clears the protocol of all federal and state claims, providing a massive regulatory green light for the DEX’s operations.

Uniswap recently announced a strategic collaboration with Securitize to integrate BlackRock’s USD Institutional Digital Liquidity Fund (BUIDL) into the UniswapX ecosystem. Launched on February 11, this integration allows institutional-grade assets to be traded directly on-chain, bridging the gap between TradFi and decentralized liquidity.

UNI Price Prediction 2026

As of Q1 2026, Uniswap (UNI) is currently consolidating within a highly-crucial demand zone ranging from $1.80 to $4.50. This specific price floor carries immense historical weight, as it served as the original launchpad for the 2021 bull run that saw UNI skyrocket to its $44.50 all-time high. 

For the first time in five years, the price has returned to this foundational level, effectively completing a full market cycle. This re-entry into the “genesis demand zone” suggests a significant long-term accumulation phase is underway, as long-term holders seek to front-run a potential structural shift in DeFi liquidity.

While the market awaits a catalyst as explosive as the 2021 rally, the current price action is also defined by a massive descending triangle pattern. This structure indicates that while selling pressure is exhausting at the multi-year floor, the price remains capped by a descending resistance line. 

Throughout 2026, a steady recovery setup appears more likely than a vertical spike. Technical targets for the year point toward a possible retest of the $10.00 level, which aligns perfectly with the pattern’s upper border. A confirmed weekly breakout above this resistance could signal the end of the long-term bear cycle and the beginning of a sustained move toward mid-range targets.

Uniswap Price Prediction 2026

UNI Crypto Price Prediction 2026 – 2030

YearPotential Low ($)Potential Average ($)Potential High ($)
20277.0010.0013.50
20288.5011.5018.00
202910.0015.5022.00
203012.0019.0032.00

Uniswap Price Prediction 2027

 The UNI price range can be between $7.00 to $13.50 during the year 2027. 

Uniswap Price Forecast 2028

The UNI Network price for 2028 is anticipated to lie within the range of $8.50 to $18.00.

Uniswap Coin Price Prediction 2029

In 2030, the price of UNI is expected to systain trend and remain positive. It may trade between $10.00 and $22.00.

Uniswap (UNI) Price Prediction 2030

Finally, in 2030, the price of UNI is predicted to maintain a steady and positive. It may trade between $12.00 and $32.00.

UNI Price Prediction 2031, 2032, 2033, 2040, 2050

Based on the historic market sentiments and trend analysis of the largest cryptocurrency by market capitalization, here are the possible UNI price targets for the longer time frames.

YearPotential Low ($)Potential Average ($)Potential High ($)
203119.0029.0039.00
203226.5035.0041.00
203335.0037.0044.00
204042.0052.0057.00
205055.0062.0070.00

UNI Price Prediction: Market Analysis?

Year202620272030
Changelly$13.25$15.80$20.10
CoinCodex$10.90$14.85$19.45
Binance$12.40$15.10$20.85

CoinPedia’s UNI Price Prediction

Uniswap (UNI) is consolidating in a key demand zone of $1.80 to $4.50, marking a return to its foundational level from the 2021 bull run. A descending triangle pattern suggests potential for a steady recovery throughout 2026, with targets around $10.00. A breakout above this resistance may signal the end of the bear cycle.

Never Miss a Beat in the Crypto World!

Stay ahead with breaking news, expert analysis, and real-time updates on the latest trends in Bitcoin, altcoins, DeFi, NFTs, and more.

FAQs

What is Uniswap (UNI) and how does it work?

Uniswap is a leading decentralized exchange protocol, allowing users to trade tokens directly on Ethereum and Layer-2 networks without intermediaries.

What is Uniswap’s price prediction for 2026?

UNI could trade between $5.00 and $10.00 in 2026 if demand for DeFi grows and the token breaks key resistance levels.

What is the price prediction for Uniswap in 2027

Analysts estimate UNI could trade between $7.00 and $13.50 in 2027 if DeFi activity expands and the broader crypto market remains bullish.

How much will $1 UNI be worth in 2030?

Forecasts suggest UNI could reach $12.00 to $32.00 by 2030 if adoption increases and Uniswap continues leading decentralized exchange trading.

Can Uniswap (UNI) be a long-term investment?

UNI offers long-term potential as a key DeFi token, supported by Layer-2 adoption, stable protocol activity, and growing Ethereum ecosystem usage.

Axie Infinity (AXS) Price Prediction 2026, 2027-2030: Technical Analysis and Future Price Targets

Axie Infinity Price Prediction

The post Axie Infinity (AXS) Price Prediction 2026, 2027-2030: Technical Analysis and Future Price Targets appeared first on Coinpedia Fintech News

Story Highlights

  • The live price of Axie Infinity crypto is  $ 1.21411549.
  • AXS price could trade as high as $2.20 in 2026.
  • Axie Infinity with a potential surge could hit $12.00 by 2032.

As we move into 2026, Axie Infinity (AXS) is no longer just a “play-to-earn” game infact it has evolved into a sophisticated, multi-layered gaming nation. Under the leadership of Sky Mavis, the ecosystem has undergone its most aggressive economic transformation since the 2021 peak, pivoting toward long-term sustainability and “risk-to-earn” mechanics.

The introduction of Bonded AXS (bAXS) in early 2026 and the total cessation of SLP emissions in Origins have effectively dismantled the “farm-and-dump” cycles of the past, replacing them with a reputation-based economy that rewards genuine players over automated bots. With the Ronin Network transitioning into a full-scale Ethereum Layer 2 and the highly anticipated Atia’s Legacy MMO on the horizon, the project is taking “bigger swings” to recapture its crown. 

In this Axie Infinity (AXS) Price Prediction 2026–2032 guide, we analyze whether these structural reforms can decouple AXS from speculative noise and drive a new era of value accrual for the original titan of GameFi.

Axie Infinity Price Today

Cryptocurrency Axie Infinity
Token AXS
Price $1.2141 up 0.74%
Market Cap$ 205,650,949.48
24h Volume$ 33,264,190.0804
Circulating Supply169,383,349.7382
Total Supply270,000,000.00
All-Time High$ 165.3691 on 06 November 2021
All-Time Low$ 0.1234 on 06 November 2020

Coinpedia’s Axie Infinity (AXS) Price Prediction 2026

AXS/USD is at a critical point after a decline, with support around $0.80 and resistance near $2.30. Currently forming a falling wedge pattern, AXS may break out towards $4.00 in 2026. However, if market conditions worsen, it could dip to $0.25, offering a strong buying opportunity.

Axie Infinity (AXS) Price Prediction March 2026

On the daily timeframe, AXS price is currently oscillating within a horizontal consolidation box. This range directly overlaps with the critical demand zone identified on the weekly chart, suggesting a period of high-stakes accumulation. 

After spent the most of January and February within these boundaries, AXS/USD market odds suggest that March will likely continue this sideways trend as the asset builds necessary liquidity for its next move.

Moreover, a daily candle flip above $1.40 would signal a shift in momentum, opening the door for Axie Infinity price to target the $1.70 and $2.20 resistance levels, respectively.

Conversely, if the psychological $1.00 floor is lost, we should anticipate a retest of the $0.80 macro support before the end of March.

Axie Infinity (AXS) Price Prediction March 2026

Axie Infinity (AXS) Price Prediction 2026

The long-term weekly chart for AXS/USD reveals a persistent declining trend that has finally reached a critical inflection point in early 2026. After hitting record lows near the $0.80 support level, the asset attempted a significant relief rally in Q1. However, this momentum was halted by the 50-week EMA band, which acted as a dynamic ceiling, forcing the price back into the primary demand zone. 

Currently, the corridor between $0.80 and $2.30 is solidifying as a major accumulation area, suggesting that internal ecosystem developments are beginning to provide a fundamental floor for the price action.

Technically, AXS price is navigating a massive falling wedge pattern, a structure typically associated with bullish reversals upon completion. The lower boundary of this wedge provides a “double confirmation” for the current accumulation phase. Throughout the remainder of 2026, we anticipate the Axie Infinity price will continue to build a base within this pattern. A successful breakout could see the price targeting the upper resistance border near $4.00. 

Conversely, if broader market stress persists, a final liquidity sweep toward the lower border at $0.25 remains a possibility, offering a deep-value entry point for long-term believers.

Axie Infinity (AXS) Price Prediction 2026

Axie Infinity (AXS) Price Prediction 2027 – 2032

YearMinimum Price ($)Maximum Price ($)Average Price ($)
20270.804.502.60
20281.205.903.50
20291.807.104.80
20302.208.905.50
20312.509.806.90
20323.0012.007.50

Axie Infinity (AXS) Price Prediction 2027

In 2027, AXS is expected to find a stable market floor at $0.80 as the Ronin ecosystem matures further. Increased adoption of “risk-to-earn” mechanics could drive the token to a maximum of $4.50, maintaining an annual average of $2.60.

Axie Infinity Price Prediction 2028

By 2028, scalability improvements are projected to push the minimum price to $1.20 during periods of market consolidation. Sustained gaming demand may ignite a rally toward a peak of $5.90, with the price likely hovering around a $3.50 average.

Axie Infinity Price Targets 2029

Entering 2029, the token is forecasted to show strong resilience with a decentralized bedrock established at $1.80. Market analysts anticipate a climb to visionary heights of $7.10, centering on a robust yearly average trading price of $4.80.

Axie Infinity Coin Price Prediction 2030

As Axie Infinity potentially becomes a linchpin of the crypto economy in 2030, the minimum price is expected to rise to $2.20. Growth in institutional gaming interest could propel AXS to a $8.90 zenith, with a projected average of $5.50.

AXS Price Prediction 2031

The 2031 outlook suggests a meticulous consolidation phase where AXS trades at a minimum of $2.50 even during bearish cycles. Optimistic projections set an impressive high of $9.80, with price stability expected to settle near the $6.90 mark.

Axie Infinity (AXS) Price Prediction 2032

Rounding out the decade, 2032 targets represent a significant milestone with a projected peak performance of $12.00. While volatility remains a factor, the asset is expected to average $7.50, supported by a long-term accumulation floor of $3.00.

Never Miss a Beat in the Crypto World!

Stay ahead with breaking news, expert analysis, and real-time updates on the latest trends in Bitcoin, altcoins, DeFi, NFTs, and more.

FAQs

What is the Axie Infinity (AXS) price prediction for 2026?

AXS could trade between $0.25 and $4.00 in 2026. A breakout from its falling wedge pattern may push prices higher if market sentiment and ecosystem growth improve.

How much will Avax be worth in 2030?

Market forecasts suggest AXS could trade between about $2.20 and $8.90 by 2030 if the Ronin network grows and GameFi adoption continues expanding.

What is the Axie Infinity (AXS) price prediction for 2040?

By 2040, AXS could potentially trade between $15 and $35 if blockchain gaming becomes mainstream and Axie Infinity maintains strong ecosystem growth.

What is the Axie Infinity price prediction for 2050?

Some long-term projections estimate AXS could range between $25 and $60 by 2050 if GameFi adoption accelerates and the ecosystem remains competitive.

How high can AXS price go in the future?

Long-term projections suggest AXS could reach around $12 by 2032 if GameFi adoption grows and the Ronin ecosystem continues expanding.

Chainlink Price Gains Attention After Visa e-HKD Pilot and LINK Chart Signals Possible Breakout

Chainlink Price Targets $53 Could LINK Be the Next Blue Chip to Rally

The post Chainlink Price Gains Attention After Visa e-HKD Pilot and LINK Chart Signals Possible Breakout appeared first on Coinpedia Fintech News

The Chainlink price is suddenly back in the spotlight and not just because of a chart bounce. This time, the story comes straight from the intersection of crypto infrastructure and traditional finance.

A recent update revealed that a cross-border settlement pilot under Hong Kong’s e-HKD program has been completed. And yes, it involved some heavyweight names: Visa, ANZ, ChinaAMC, and Fidelity International. The connective tissue tying it all together? Chainlink crypto’s oracle network.

On paper, the initiative focused on enabling atomic and compliant transfers of tokenized funds. In simpler terms: programmable money moving across borders with reduced counterparty risk and near-real-time settlement. Visa’s interim report and Chainlink’s platform documentation detail how the infrastructure handled regulated asset transfers within the program.

That’s not just another blockchain experiment. It’s a test run of how financial institutions might actually move money in the tokenized future.

Traditional Finance Quietly Tests Chainlink

Let’s be honest crypto has promised to “revolutionize finance” for years. Most of the time, that claim lives somewhere between marketing hype and speculative optimism.

But occasionally, real infrastructure work appears.

Chainlink Price Gains Attention After Visa e-HKD Pilot and LINK Chart Signals Possible Breakout

This pilot under Hong Kong’s e-HKD program shows how programmable money might operate in the Asia-Pacific region. By linking financial institutions through Chainlink’s oracle network, the system demonstrated near-instant settlement for tokenized funds while reducing settlement risk.

In traditional finance, settlement delays can create exposure between parties. Programmable transactions remove that uncertainty by executing transfers atomically meaning they either complete entirely or not at all.

And here’s the most highlighting detail: it’s not just a theory anymore.Institutions are testing it.

Chainlink Price Chart Shows Recovery

While the institutional narrative unfolds, the Chainlink price chart is quietly showing signs of life.

A weekly chart shared online highlights how LINK recently bounced from a critical $9–$10 support zone after previous declines. That range appears to have acted as a foundation for a potential recovery.

Now the asset is trading inside a parallel range structure. If momentum continues upward, the first technical target sits around $15. Push beyond that, and the upper boundary of the range appears closer to $26.

Chainlink Price Gains Attention After Visa e-HKD Pilot and LINK Chart Signals Possible Breakout

Of course, markets rarely move in straight lines. Resistance zones tend to attract sellers, especially after sharp recoveries.

Still, for traders watching LINK/USD, the support rebound has become the key talking point behind the latest Chainlink price prediction circulating across the market.

Utility Narrative Meets Market Momentum

So what’s really happening here? Well, here’s the interesting part. Institutional experimentation with programmable money is happening at the same time the market structure for LINK is attempting a recovery.

Correlation doesn’t equal causation, obviously. But the combination tends to attract attention.

If price holds above the $9–$10 base and momentum continues building inside the range, the next move on the chart could determine whether the current rebound becomes a trend.

For now, both narratives first the infrastructure progress and second the technical setup are converging around the same topic: the direction of the Chainlink price.

Bitcoin Price Debate Ignites as Bull Trap Warning Clashes With On-Chain Data

AI Models Favor Bitcoin Over Fiat in New Study

The post Bitcoin Price Debate Ignites as Bull Trap Warning Clashes With On-Chain Data appeared first on Coinpedia Fintech News

The Bitcoin price is once again sitting in the middle of a classic crypto argument: bull trap or genuine recovery? One viral chart circulating on X claims the current rally perfectly mirrors the 2022 pattern and warns that BTC could crash to $45,000 within 12 days after a supposed bull trap near $73K.

That’s a dramatic call. But not everyone’s buying it. Because when you dig into the on-chain data, the story suddenly looks… a lot less catastrophic.

Bitcoin Price Bull Trap Or Reset?

Let’s start with derivatives markets. According to CryptoQuant data, more than 30,000 BTC flowed out of derivatives exchanges as price approached $72,900 in early March 2026.

That’s not small change. Large derivatives outflows often indicate short covering, that means traders closing bearish positions rather than doubling down on them. In other words, some of the selling pressure that previously dragged the Bitcoin price chart lower may already be fading.

And that matters. A lot. Because, if major players considered the $65K–$68K zone a local bottom, then the current move higher might be less about hype and more about repositioning.

Bitcoin Price Debate Ignites as Bull Trap Warning Clashes With On-Chain Data

Quiet Accumulation Behind The Scenes

Then there’s spot market behavior. On February 18, roughly 8,000 BTC left spot exchanges right at price lows.

Not sold. Withdrawn. That pattern is often described as “stealth accumulation.” Institutions and large holders buy during weakness and move coins to cold storage rather than leaving them on exchanges where they could be dumped.

For anyone obsessing over a Bitcoin price prediction, that kind of behavior usually signals confidence rather than panic.

Bitcoin Price Debate Ignites as Bull Trap Warning Clashes With On-Chain Data

Meanwhile, long-term holders, the so-called diamond hands haven’t flinched.

Wallets holding coins for more than five years remain almost completely unchanged despite the volatility. Even the 6-month to 12-month holder group is expanding, suggesting some investors who bought last year’s volatility have simply transitioned into longer-term holders.

Not exactly the behavior you’d expect before a massive collapse.

Bitcoin Price Debate Ignites as Bull Trap Warning Clashes With On-Chain Data

Structural Support Around $70K

Now here’s the part traders keep watching. Mining economics. According to Marathon Digital filings, the average mining cost in Q4 2025 sat around $70,027 per BTC. With Bitcoin/USD hovering near $73,000, the margin above that break-even point is only about $3,000.

That level effectively becomes a structural floor.

Historically, if price drops below mining costs, miners can capitulate and sell reserves. But there’s a twist this cycle. Some miners are pivoting toward AI data centers, which may reduce the urgency to liquidate holdings during downturns.

So, what’s next? Well, Sentiment has already shifted from extreme fear to optimism, yet on-chain indicators still show accumulation rather than distribution.

The Bitcoin price might not be heading straight to the moon. But the data doesn’t scream imminent collapse either.

For now, the $70,000 line remains the battlefield. And the next move on the Bitcoin price chart will likely decide which side of the debate wins.

❌