Reading view

Bitcoin Price Holds Key Levels as Strategy Buys $1.28B BTC and Century-Old Pattern Resurfaces

Michael Saylor’s Strategy Adds 2,486 Bitcoin

The post Bitcoin Price Holds Key Levels as Strategy Buys $1.28B BTC and Century-Old Pattern Resurfaces appeared first on Coinpedia Fintech News

The Bitcoin price just received another reminder that some players in the market aren’t interested in short-term noise. They’re still buying as aggressively as ever.

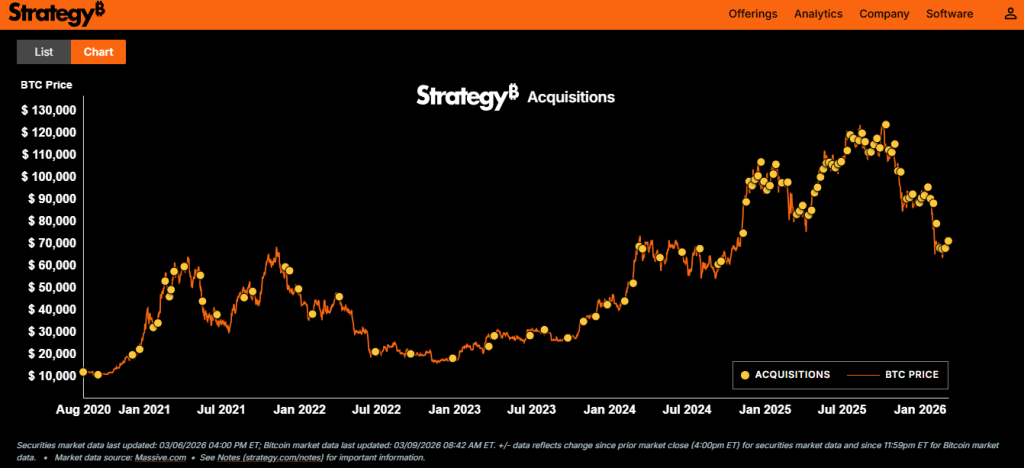
This time the spotlight lands on Strategy at most crucial phase, which confirmed it purchased 17,994 BTC worth roughly $1.28 billion at an average price of $70,946 per coin.

The purchase pushes the company’s total holdings to 738,731 BTC, acquired for about $56.04 billion at an average cost of $75,862 per bitcoin as of March 8, 2026.

For a company that’s been stacking coins for years, the strategy still remains the same: buy and hold.

Strategy Doubles Down on Bitcoin

Bitcoin Price Holds Key Levels as Strategy Buys $1.28B BTC and Century-Old Pattern Resurfaces

Corporate accumulation isn’t exactly new territory for Strategy. But this latest purchase is still notable for one reason: timing.

The company scooped up the additional BTC with the market hovering around the $70K range, reinforcing a pattern where institutional buyers appear comfortable accumulating near this level.

Now, when large entities repeatedly absorb supply at similar prices, traders tend to watch closely. It’s the kind of behavior that often shapes long-term market structure rather than short-term speculation.

And yes, it inevitably feeds into the never-ending Bitcoin price prediction debate.

Because when billions flow into an asset during consolidation, people start wondering what comes next.

Strategy has acquired 17,994 BTC for ~$1.28 billion at ~$70,946 per bitcoin. As of 3/8/2026, we hodl 738,731 $BTC acquired for ~$56.04 billion at ~$75,862 per bitcoin. $MSTR $STRC https://t.co/wB1k3Nt1xa

— Michael Saylor (@saylor) March 9, 2026

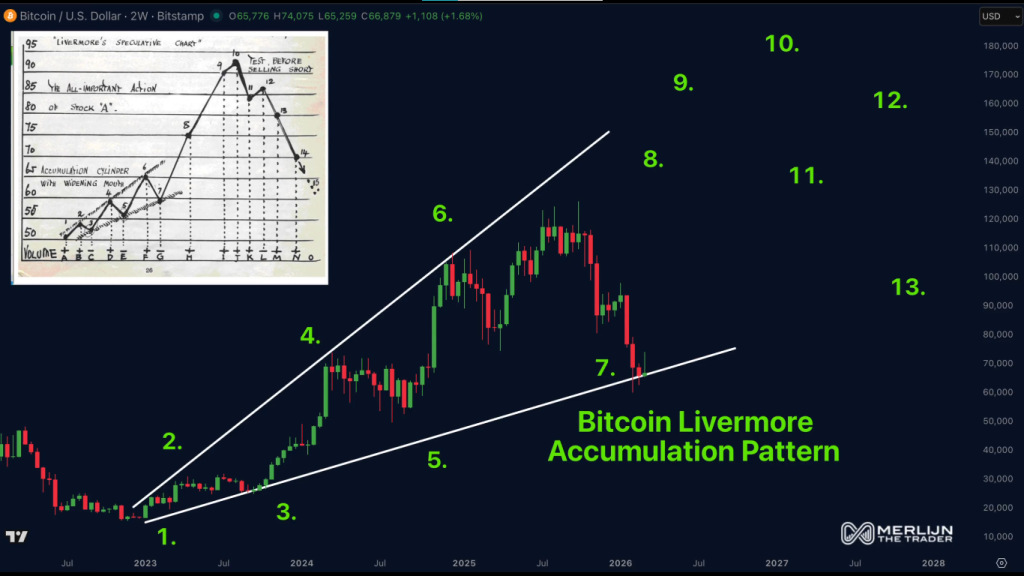
Bitcoin Price Chart Echoes Old Pattern

Now here’s where things get a little more interesting. Some market watchers believe the Bitcoin price chart is following a surprisingly old roadmap, one originally described nearly a century ago.

The structure reportedly mirrors a trading pattern identified in the 1920s by Jesse Livermore, one of the most famous traders of early financial markets and seems like big shorts are aware.

According to the interpretation circulating in trading circles, the market appears to be following the same sequence step by step.

And the key levels are straightforward. Above $70K, the next leg of the move is considered confirmed. Below $60K, the market may simply extend its accumulation phase.

Bitcoin Price Holds Key Levels as Strategy Buys $1.28B BTC and Century-Old Pattern Resurfaces

$70K Level Holds Market Attention

So where does that leave the market right now? Right in the middle of the tension zone.

The Bitcoin/USD range between $60,000 and $70,000 has effectively become the battleground determining whether the current cycle accelerates or stretches sideways a little longer.

Institutional buyers accumulating near the upper band certainly add fuel to the bullish argument. On the other hand, markets rarely move in straight lines, especially when sentiment swings between fear and optimism.

Still, the broader narrative remains hard to ignore. A company sitting on more than 738,000 BTC just added another $1.28 billion worth of coins.

And if the historical pattern continues to play out, the next move in the Bitcoin price could depend on whether the market firmly holds that critical $70K threshold.

PI Network Price Jumps 15% as Volume Rises But $0.28 Holds the Real Answer

Pi Network Gains Attention Today With New Update

The post PI Network Price Jumps 15% as Volume Rises But $0.28 Holds the Real Answer appeared first on Coinpedia Fintech News

The PI Network price is suddenly back on traders’ radar this weekend. Not because it exploded into a massive rally but because something subtler is happening beneath the surface: volume is quietly heating up.

And in crypto markets, rising volume during a price recovery tends to get people paying attention. According to data from CryptoQuant’s spot volume bubble map, trading activity has started climbing alongside the recent PI/USD move. Now, before anyone starts screaming “breakout,” there’s a catch. The indicator still labels the current volume environment as neutral.

Oddly enough, that’s not bad news. Neutral volume during a rising price trend often hints that accumulation might still be underway rather than a full-blown speculative frenzy.

PI Network Price Volume Trend

Take a closer look at the volume map and the pattern becomes clearer. The bubbles tracking spot activity have been gradually expanding, signaling a rise in trading interest. But they’re not glowing red-hot or light orange yet. In other words, momentum hasn’t strengthened yet and to reach peak speculation territory it needs some more efforts to do it.

For long-term watchers of the PI Network price chart, that distinction matters. If volume remains controlled while price edges upward, it can suggest investors are slowly building positions rather than chasing a short-term pump.

Still, crypto has a long history of teasing traders before pulling the rug.

PI Network Price Jumps 15% as Volume Rises But $0.28 Holds the Real Answer

The $0.28 Fakeout Warning

History provides a useful cautionary tale here. Back in Q4 2025, the asset surged from roughly $0.19–$0.20 but ran into a stubborn ceiling at $0.28. That level ultimately triggered a loss of strength, turning the rally into what traders later labeled a classic fakeout.

Fast forward to Q1 2026, and the story looks slightly different. This time, the asset found support much lower, in the $0.13–$0.14 zone. From there, it managed to reclaim $0.20, a move that technically signaled a shift in short-term trend.

But the real test hasn’t arrived yet. If price once again stalls beneath $0.28, the market could start asking uncomfortable questions about whether history is repeating itself.

Network Updates Fuel Investor Interest

So why the renewed attention now? Two recent developments inside the ecosystem appear to be driving the interest.

First came the announcement that Protocol v19.9 migration has been successfully completed, with the next upgrade, v20.2, targeted for completion before Pi Day 2026. Node operators were advised to ensure their systems are updated ahead of the next phase.

Then things got even more interesting. A separate update revealed a proof-of-concept project exploring a new Pi Node utility for decentralized AI training and computing tasks. The project reportedly uses spare computing power from over 421,000 Pi Nodes to process AI-related workloads.

The initiative was conducted in collaboration with OpenMind, a robotics startup backed by Pi Network Ventures. The experiment showed that Pi Nodes could handle AI workloads and return useful results quickly, an early step toward integrating the network into distributed AI infrastructure.

PI Network Price Eyes Breakout

So where does that leave things?

Simple. The PI Network price prediction debate now circles around a single technical hurdle.

If the PI Network price climbs decisively above $0.28, the probability of the current rally being another fakeout drops significantly. Rising volume on CryptoQuant’s chart could then signal accelerating momentum.

PI Network Price Jumps 15% as Volume Rises But $0.28 Holds the Real Answer

And if that momentum continues building, some traders believe the next long-term target could eventually stretch toward $1. But first things first. The market still has one stubborn ceiling to deal with.

Ethereum Price Builds Quiet Strength as RWAs Hit $20.4B and L2 Ecosystem Expands

FG Nexus Sells Additional Ethereum as Losses Hit $82M

The post Ethereum Price Builds Quiet Strength as RWAs Hit $20.4B and L2 Ecosystem Expands appeared first on Coinpedia Fintech News

The Ethereum price may look sluggish on the surface, but under the hood the network’s fundamentals are doing something far less boring which quietly expanding. And in crypto, quiet expansion tends to get loud eventually.

Since January 2025, the value of tokenized RWAs on blockchain has climbed to $20.4 billion, according to the latest data. That growth isn’t happening in isolation either. It’s unfolding alongside a rapidly expanding Layer 2 ecosystem and a massive stablecoin footprint across the Ethereum network.

So while traders argue over candles on the Ethereum price chart, the infrastructure beneath the market keeps getting bigger.

Ethereum Ecosystem Growth Tells Story

Let’s start with the raw numbers. The Ethereum ecosystem now hosts 146 live Layer 2 networks. That’s not a typo, 146 separate scaling environments designed to handle transactions and applications without clogging Ethereum’s base layer.

And despite the brutal token corrections many of those L2 projects have faced recently, the capital sitting inside them hasn’t exactly vanished.

Ethereum Price Builds Quiet Strength as RWAs Hit $20.4B and L2 Ecosystem Expands

The total value locked across Ethereum’s L2 networks currently sits at $38.2 billion. Sure, that’s down from the $58 billion peak recorded in mid-December 2025, but it’s still a massive figure considering the broader market turbulence.

In other words, the infrastructure didn’t disappear just because prices dropped.

Stablecoins Dominate Ethereum Network Liquidity

Now here’s another piece of the puzzle. When combining Ethereum’s mainnet and its L2 networks, stablecoins account for over 60% of the market share, representing roughly $179 billion.

That’s a staggering amount of liquidity circulating inside one ecosystem. Why does it matter? Because stablecoins function as the financial plumbing of crypto. They power trading, lending, payments, and DeFi. When the majority of that liquidity sits inside Ethereum’s orbit, it tells you where most of the financial activity still lives.

Ethereum Price Builds Quiet Strength as RWAs Hit $20.4B and L2 Ecosystem Expands

Ethereum Price Signals Possible Accumulation

Meanwhile, another metric is quietly flashing on analysts’ dashboards: declining ETH exchange reserves. Put simply, fewer ETH tokens are sitting on centralized exchanges.

Historically, that kind of movement suggests accumulation. Investors pull assets off exchanges when they’re planning to hold rather than sell. Not exactly the behavior you see during panic exits. 

Ethereum Price Builds Quiet Strength as RWAs Hit $20.4B and L2 Ecosystem Expands

Ethereum Price Outlook Sparks Bullish Sentiment

Now here’s where things get interesting. Some market watchers believe the current setup could be quietly building pressure. One particularly blunt sentiment floating around crypto circles sums it up pretty clearly: many investors may not fully grasp how bullish the broader chart structure appears.

Ethereum Price Builds Quiet Strength as RWAs Hit $20.4B and L2 Ecosystem Expands

The argument goes like this. Sentiment across the market remains crushed. Massive capital reportedly sits on the sidelines waiting for regulatory clarity. Meanwhile, institutions, governments, and banks are increasingly experimenting with blockchain-based financial infrastructure.

If that alignment plays out, the Ethereum price prediction suggests that it could eventually reflect the scale of the ecosystem being built around it. And when that happens, the ripple effects across the altcoin market could be hard to ignore.

Worldcoin Price Prediction 2026, 2027 – 2030: Will WLD Price Reach $10?

price prediction Worldcoin

The post Worldcoin Price Prediction 2026, 2027 – 2030: Will WLD Price Reach $10? appeared first on Coinpedia Fintech News

Story Highlights

  • The live price of the WLD token is  $ 0.36768364
  • Price predictions for 2026 range from up to $4.18.
  • Long-term forecasts suggest potential highs of $35.60 by 2030.

WLD price was almost $12 ATH but went crashing to $0.50 in the last remaining days of 2025. This has raised concerns among investors and traders about WLD’s future, and as a result, the Worldcoin price prediction 2026 has become a topic of significant discussion, with many being intrigued about its prospects in the coming year.

Its prolonged period of downtrend has left many wondering if the project’s initial buzz was fading. But, behind the scenes, Worldcoin is still quietly building its platform. Now, experts view Q1 2026 as a potential turning point where renewed momentum could be observed.

So many are now asking a crucial question: is this the start of a new chapter for Worldcoin? Will the project’s focus on decentralized identity and its connection to the AI sector be enough to fuel a powerful comeback and reclaim its spot in the market spotlight?

Let’s delve into the anticipated Worldcoin price predictions 2026 to 2030 and the years to come.

Worldcoin Price Today

Cryptocurrency Worldcoin
Token WLD
Price $0.3677 down -3.83%
Market Cap$ 1,064,067,579.47
24h Volume$ 89,702,292.6615
Circulating Supply2,893,975,824.9380
Total Supply10,000,000,000.00
All-Time High$ 11.8171 on 10 March 2024
All-Time Low$ 0.3140 on 06 February 2026

CoinPedia’s WLD Price Prediction 2026

In early 2026, the price dropped to $0.27, prompting efforts to stabilize the market. However, investor sentiment continues to be cautious. The immediate short-term support level is at $0.31; a drop below this level could result in further declines. If the prices increase, we could see a bounce back to $0.60 and potentially $0.95 in March. For a long-term recovery, it is essential to break through the resistance at $1.50.

Worldcoin Price Prediction 2026

Following a false breakout to $2.12 in September 2025, the bearish trend continued into the first quarter of 2026, with prices dropping as low as $0.27. However, since mid-February, there have been efforts to sustain the price and prevent further declines. 

Given the significant drop already experienced, broader market conditions have notably affected liquidity within the cryptocurrency sector. As a result, traders and investors have remained on the sidelines, waiting for clearer market signals to emerge.

In March, the market would find itself in a precarious situation, as odds suggest it could struggle to stabilize. Investor sentiment remained lukewarm, with many hesitant to take advantage of opportunities despite substantial price discounts.

Currently, the immediate critical support level is at $0.31. If this level is breached, lower prices may be possible. On the other hand, if the price rises, March could see a bounce towards $0.60 and $0.95 in the short term. For long-term recovery, the price needs to breach the $1.50 resistance zone.

Worldcoin Price Prediction 2026

WLD On-Chain Analysis

The WLD Spot Average Order Size chart reveals persistent green clusters into January 2026, indicating sustained “Big Whale” participation. This heavy institutional accumulation suggests that smart money is aggressively building positions, viewing the current price range as a high-conviction entry point.

Worldcoin Spot Avg Order Size

Similarly, development activity on Worldcoin is surging to new local highs in January 2026, showcasing intense builder commitment. This spike in innovation, combined with whale interest, creates a powerful fundamental divergence that historically precedes a massive price reversal.

Worldcoin On Chain Activity

WLD Price Forecast 2026 – 2030

YearPotential Low ($)Average Price ($)Potential High ($)
20262.506.009.50
20277.0011.2515.70
202810.7515.9521.15
202915.6521.6027.50
203019.7527.7535.60

This table, based on historical movements, shows Worldcoin price to reach $35.60 by 2030 based on compounding market cap each year. This table provides a framework for understanding the potential Worldcoin price movements. Yet, the actual price will depend on a combination of market dynamics, investor behavior, and external factors influencing the cryptocurrency landscape.

Worldcoin Price Forecast 2026

Worldcoin’s price for 2026 is projected to range between $2.50 and $9.50, with an average price of approximately $6.00.

WLD Price Prediction 2027

Worldcoin’s price for 2027 is expected to fluctuate between $7.00 and $15.70, with an average price of around $11.25.

Worldcoin Price Forecast 2028

Worldcoin’s price for 2028 is anticipated to be between $10.75 and $21.15, with an average price of about $15.95.

WLD Token Ai Price Forecast 2029

Worldcoin’s price for 2029 is projected to vary from $15.60 to $27.50, with an average price of roughly $21.60.

Worldcoin AI Token Price Prediction 2030

Worldcoin’s price for 2030 is expected to fluctuate between $19.75 to $35.60, with an average price of approximately $27.75.

Market Analysis

Firm Name20262030
Swapspace$1.30$2.07
coincodex$2.40$4.30
DigitalCoinPrice$3.02$4.06

*The targets mentioned above are the average targets set by the respective firms.

Never Miss a Beat in the Crypto World!

Stay ahead with breaking news, expert analysis, and real-time updates on the latest trends in Bitcoin, altcoins, DeFi, NFTs, and more.

FAQs

What is Worldcoin?

Worldcoin is a cryptocurrency project aiming to distribute digital assets to a global audience through a unique identity-verification system.

What is the current price of 1 Worldcoin?

At the time of writing, the price of one WLD token was  $ 0.00349731.

What is the Worldcoin price prediction for 2026?

WLD price forecasts for 2026 suggest a potential range between $2.50 and $9.50, depending on market recovery and technical breakouts.

What is the Worldcoin price prediction for 2030?

Long-term models suggest WLD could trade from about $19.75 to $35.60 by 2030 under bullish conditions.

What is the Worldcoin price prediction for 2040?

While speculative, extended growth forecasts envision potential for WLD beyond 2040 based on adoption and tech use cases.

Is Worldcoin a good long-term investment?

Worldcoin offers long-term potential due to its focus on decentralized identity and AI, but it remains volatile and requires risk awareness.

What factors influence WLD price the most?

WLD price is driven by AI narrative strength, user adoption, token supply dynamics, market sentiment, and overall crypto market trends.

Hyperliquid Price Prediction 2026, 2027 – 2030: Will HYPE Price Hit A New ATH?

Hyperliquid Price Prediction

The post Hyperliquid Price Prediction 2026, 2027 – 2030: Will HYPE Price Hit A New ATH? appeared first on Coinpedia Fintech News

Story Highlights

  • The live price of the Hyperliquid crypto is  $ 30.46060504.
  • The 2025 HYPE price suggests it could hit $40-$105 in 2026.
  • Forecasts suggest that HYPE could reach a potential average price by 2030 of around $125, with highs up to $185.

The crypto market is buzzing with excitement over Hyperliquid and its native token, HYPE. As a decentralized, paperless alternative to platforms like Binance and Coinbase, Hyperliquid is quickly gaining traction, prompting investors to look closely at the HYPE price prediction for 2026 and beyond

With its unique “HyperBFT” consensus mechanism, lightning-fast transactions, and zero KYC hurdles, Hyperliquid is rewriting the rules of perpetual trading. Beyond its consensus mechanism, Hyperliquid also allows users to trade crypto perpetual futures, including major assets like BTC, ETH, SOL, AVAX, and SUI, even without owning the underlying asset. 

As the platform gains traction for its streamlined trading experience, many investors are now turning to analyze the HYPE token price outlook. But does its innovative model signal long-term growth for HYPE Token Price? 

In this article, we dive deep into market sentiment and Hyperliquid price projections from 2026 to 2030.

Hyperliquid Price Today

Cryptocurrency Hyperliquid
Token HYPE
Price $30.4606 down -0.89%
Market Cap$ 7,849,802,143.62
24h Volume$ 150,377,641.1546
Circulating Supply257,703,421.6587
Total Supply957,378,936.6227
All-Time High$ 59.3926 on 18 September 2025
All-Time Low$ 3.2003 on 29 November 2024

Coinpedia’s HYPE Price Prediction 2026

In 2026, HYPE retested support at $21 and rose to $38 but now faces resistance at the upper wedge boundary around $32. If it breaks $32, it could reach $44 or $50; otherwise, it may fall below $21 to $18.

HYPE Price Prediction March 2026

In February, HYPE’s price fell from its $38 peak and is now 30% lower at $26. But late February saw a faint demand again, which pushed the price back up to retest the 20-day and 50-day EMA bands. If it crosses, in March, a retest of $32 could be possible, or even a breach, with targets at $44. But, if $32 repels, then it could hit $21.

HYPE price prediction March 2026

Hyperliquid Price Prediction 2026

In 2026, the HYPE price underwent a significant retest of dynamic support at $21, which coincided with the lower boundary of a falling wedge pattern. This retest led to a price rise to $38 by early February. However, the upper boundary of the falling wedge then served as dynamic resistance, preventing any further upward movement.

Currently, HYPE is consolidating within a narrowing wedge, with the trading range narrowing each month. At present in March, it is fluctuating around the 20-day and 50-day EMA bands.

In the short term, the price has tested the upper boundary of the falling wedge again, approximately at $32. If it successfully breaks through and maintains above this level, it may initiate a rally towards $44 or $50. Conversely, if it is rejected at $32, the price could decline below $21, potentially reaching as low as $18.

Hyperliquid Price Prediction 2026
YearPotential LowPotential AveragePotential High
2026 (conservative)$15$35$80

HYPE On-Chain Outlook

The Dune analytics dashboard provided an quick on-chain overview of the utility metrics of the Hyperliquid token (HYPE), which appears to be improving significantly with each passing month.

HyperEVM total transaction fees have surpassed 235.57K and are at an ATH, and total trading volume has crossed $3.64 trillion and is at an ATH. Even its revenue has reached an ATH, crossing $993 million.

HYPE On-chain outlook

All the major metrics suggest that it is experiencing great adoption among peers, and its on-chain metrics are proof of that, suggesting that if the rally occurs, then 2026 might end on very good numbers.

Hyperliquid Coin Price Targets 2026 – 2030

YearPotential Low ($)Potential Average ($)Potential High ($)
2026255090
20274075105
20285595130
202985110155
2030105125185

HYPE Price Projection 2026

By 2026, the value of a single Hyperliquid token price could reach a maximum value of $90 with a potential low of $25. With this, the average price could land at around the $50 level.

Hyperliquid Coin Price Prediction 2027

During 2027, the HYPE could reach a maximum value of $105 with a potential low of $40. Considering this, the average price of this altcoin could settle at around $75.

HYPE Crypto Price Action 2028

The Hyperliquid price could achieve the $130 milestone by the year 2028. On the flip side, the altcoin could record a low of $55 and an average price of $95.

Hyperliquid Price Analysis 2029

The HYPE crypto prediction for the year 2029 could range between $85 to $155 and the average price could be around $110.

HYPE Price Prediction 2030

Looking forward to 2030, the Hyperliquid Price may range between $105 and $185, and a potential average value of around $125.

Market Analysis

Firm Name202520262030
Binance$37$63$164
DigitalCoinPrice$76$54$97

*The aforementioned targets are the average targets set by the respective firms.

CoinPedia’s HYPE Price Projection

This Layer-1 project has taken the crypto market by storm within a short time frame. With a market cap of over $7 billion, this altcoin has successfully secured a position in the top 25. Moreover, with the mass adoption, this altcoin could claim a spot in the top 10 during the upcoming bull run.

If the bullish sentiment intensifies, the Hyperliquid price will reach a high of $41.39 this year. On the flip side, if the market experiences unfavorable events, this could result in this altcoin settling at a low of $14.65.

YearPotential LowPotential AveragePotential High
2025$14.65$28.02$41.39
Never Miss a Beat in the Crypto World!

Stay ahead with breaking news, expert analysis, and real-time updates on the latest trends in Bitcoin, altcoins, DeFi, NFTs, and more.

FAQs

What is Hyperliquid (HYPE) and why is it gaining popularity?

Hyperliquid is a fast, decentralized trading platform with no KYC and low fees, making HYPE popular among traders seeking speed and independence.

What is the Hyperliquid (HYPE) price prediction for 2026?

HYPE price in 2026 is projected to range between $25 and $90, with an average near $60 if adoption and trading volumes keep rising.

What could HYPE be worth by 2030?

Long-term projections suggest HYPE might reach an average of $125 by 2030, with possible highs near $185 if platform usage keeps expanding.

Is Hyperliquid (HYPE) a good long-term investment?

HYPE may appeal to long-term investors due to strong platform growth, but like all crypto, it carries risk and requires careful research.

Avalanche Price Prediction 2026, 2027 – 2030: Will AVAX Price Hit $100?

Avalanche Price Prediction

The post Avalanche Price Prediction 2026, 2027 – 2030: Will AVAX Price Hit $100? appeared first on Coinpedia Fintech News

Story Highlights

  • The live price of the Avalanche is  $ 8.94539346.
  • Price predictions for 2026 range from $400 to $600.
  • Long term outlook suggests gradual growth potential to approach $1200 by 2030.

Aave (AAVE) is a decentralized finance protocol built on Ethereum that facilitates permissionless lending and borrowing through smart contracts. After witnessing a strong expansion in the previous market cycle, AAVE entered a prolonged correction phase, with price gradually retracing from its earlier highs. Throughout 2025, AAVE remained in a consolidation structure, reflecting a period of market digestion rather than trend continuation. While short-term momentum has cooled, the broader technical structure suggests that AAVE may be transitioning into a new accumulation phase. 

As volatility contracts and price holds above long-term demand levels, attention is now shifting toward whether 2026 can trigger the next major price discovery cycle.

Avalanche Price Today

Cryptocurrency Avalanche
Token AVAX
Price $8.9454 down -0.78%
Market Cap$ 3,862,370,079.79
24h Volume$ 160,482,751.2986
Circulating Supply431,771,961.1772
Total Supply463,441,061.1772
All-Time High$ 146.2179 on 21 November 2021
All-Time Low$ 2.7888 on 31 December 2020

CoinPedia’s Avalanche Price Prediction

Currently, the Avalanche price is testing the $9 mark in March after hitting resistance at $15 in January. A recovery is expected in March, and projections for the first quarter of 2026 suggest it could regain previous levels. Experts are targeting $20, with a potential rise to $28. If it breaks through $28, it may reach $44 by mid-year. However, if $28 acts as strong resistance, consolidation may continue.

Avalanche (Avax) Price Prediction 2026

AVAX price prediction 2026

The price action of AVAX hasn’t been so great since its Q1 2024 high of $65; it has been in decline ever since. Most of 2024 and all of 2025 were in decline.

Even in 2026, this bearish momentum’s shadow didn’t lift; it worsened, with the broader market in turmoil. In January, the AVAX price faced rejection from $15 and slipped to $9 support zone after hitting a low of $7.53 in February. But things can change this time around. Since Q1 still has several days left, a recovery remains an option, as it has been testing a demand area of $9 that ignited the late 2024 rally. Sustained demand here could signal a reversal.

Now, expectations for its recovery, which are gaining momentum in Q1 2026, are significantly higher. Now, it appears AVAX may not have performed in the past two years, but it was all about establishing a base, and it seems it has done so. Now, an impressive rally ahead is a strong possibility.

For Q1, we expect $20 with potential to test the pattern’s upper border at $28. However, if it clears the upper border, we can expect AVAX to hit $44 by the end of the first half. But if $28 repels, then the first half could see consolidation stretching.

YearPotential LowPotential AveragePotential High
2026 (conservative)$25$33$50

AVAX On-Chain Analysis

AVAX shows a highly bullish sentiment. Big Whale Orders in both spot and futures indicate strong institutional accumulation. With Taker Buy Dominance at 90 days, aggressive buyers are in control, while the Cooling volume bubble map suggests a healthy consolidation phase. Collectively, major metrics point to a bullish rally ahead.

AVAX onchain analysis

Avalanche Price Prediction 2026 – 2030

YearPotential Low ($)Potential Average ($Potential High ($)
2026400500600
2027550690820
2028650830980
20297409501100
203082010001200

AAVE Price Forecast 2026

Looking ahead to 2026, AVAX’s potential price is anticipated to rise even further, with a projected low of $20.00 and a high of $80.00. The average price for AVAX in 2026 will likely be $50.00.

AAVE Price Prediction 2027

In 2027, the analysis suggests a continued upward trend in AVAX’s value, with the price potentially ranging between $31.50 and $126.50. Based on the calculated figures, the average price is projected to be approximately $79.00 during this period.

AAVE Prediction 2028

By 2028, AVAX’s price could potentially experience further growth, falling within the range of $50.50 and $202.50. The average price during this period, calculated from the data, is expected to be around $126.50.

AAVE Price Prediction 2029

Moving forward to 2029, AVAX’s price is predicted to ascend between $81.00 and $324.00. The average price during this period is estimated at around $202.50 based on calculated figures.

AAVE Price Prediction 2030

By 2030, AVAX’s price is forecasted to soar between $129.50 and $518.50. Further, the average price during this period, calculated from the data, could stand at $324.00.

AAVE Price Prediction 2031, 2032, 2033, 2040, 2050

Based on the historic market sentiments and trend analysis of the largest cryptocurrency by market capitalization, here are the possible AAVE price targets for the longer time frames.

YearPotential Low ($)Potential Average ($)Potential High ($)
203189011001350
203292012001500
2033110013501780
2040160022003000
2050260033004500

AAVE Price Prediction: Market Outlook?

Year202620272030
Changelly$500$750$1100
DigitalCoinPrice$480$680$1000
WalletInvestor$520$650$1250
Never Miss a Beat in the Crypto World!

Stay ahead with breaking news, expert analysis, and real-time updates on the latest trends in Bitcoin, altcoins, DeFi, NFTs, and more.

FAQs

Is AAVE a good investment for 2026?

AAVE shows long-term growth potential if it breaks key resistance levels. However, price depends on market conditions and DeFi adoption.

What should investors watch before buying AAVE?

Watch support near $135–$150, resistance above $250, overall market trend, and activity within the Aave protocol.

What could drive Avalanche (AVAX) price growth in the coming years?

Key drivers include DeFi expansion, institutional adoption, subnet growth, and overall crypto market recovery cycles.

What is the AVAX price prediction for 2026?

The AVAX price prediction for 2026 suggests a potential range between $400 and $600 if market momentum and network growth remain strong.

What is the AVAX coin price prediction for 2030?

AVAX coin price prediction for 2030 points to a possible range of $820 to $1,200, assuming sustained adoption and favorable market conditions.

What is the Avalanche price prediction for 2040?

Avalanche price prediction for 2040 estimates a broad range between $1,600 and $3,000 if long-term blockchain adoption accelerates globally.

AVAX
BINANCE
❌