Reading view

Pippin Price Rally Today: Is the 14% Surge a Bull Trap?

PIPPIN Token Price Surges 40% Today – Here’s Why It’s Rallying

The post Pippin Price Rally Today: Is the 14% Surge a Bull Trap? appeared first on Coinpedia Fintech News

Pippin price rally today has caught traders’ attention after the token posted a sharp 14% intraday surge, signaling a sudden return of buying momentum. At first glance, the rally appears to reflect growing optimism across parts of the altcoin market. However, a deeper look at derivatives positioning and on-chain metrics reveals a more complicated picture.

While price action is moving higher, several key indicators still show weak participation from leveraged traders, raising the possibility that the current rally may be driven more by short-term demand than sustained market conviction. This divergence between price and market data has now sparked debate among traders: is the latest Pippin rally the beginning of a recovery, or simply a temporary bounce?

On-chain Flows Paint a Cautious Picture

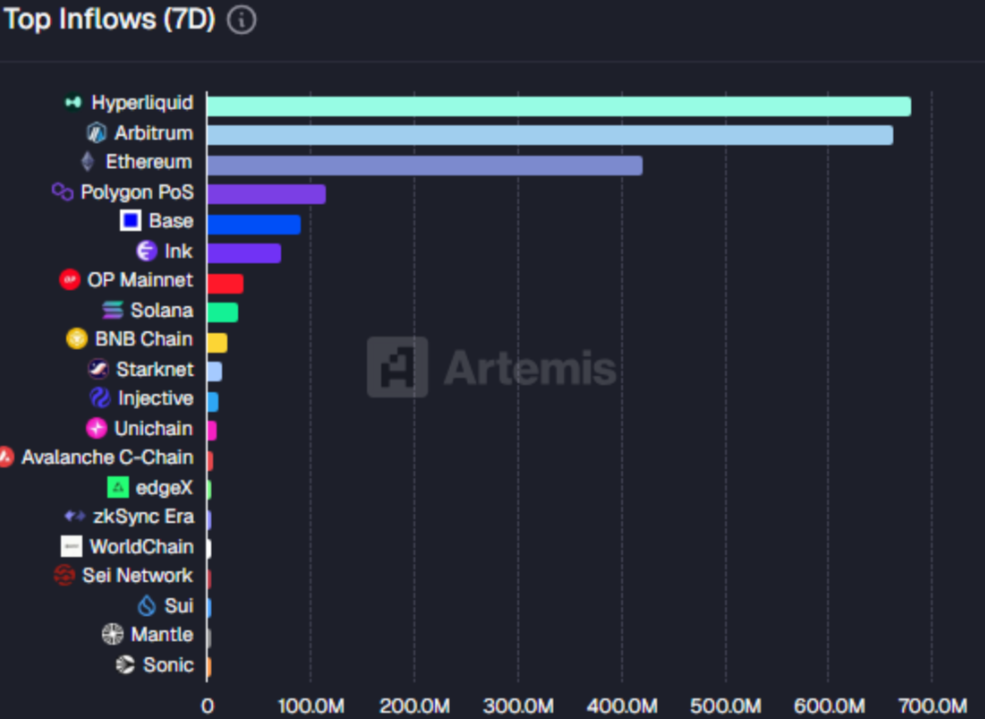
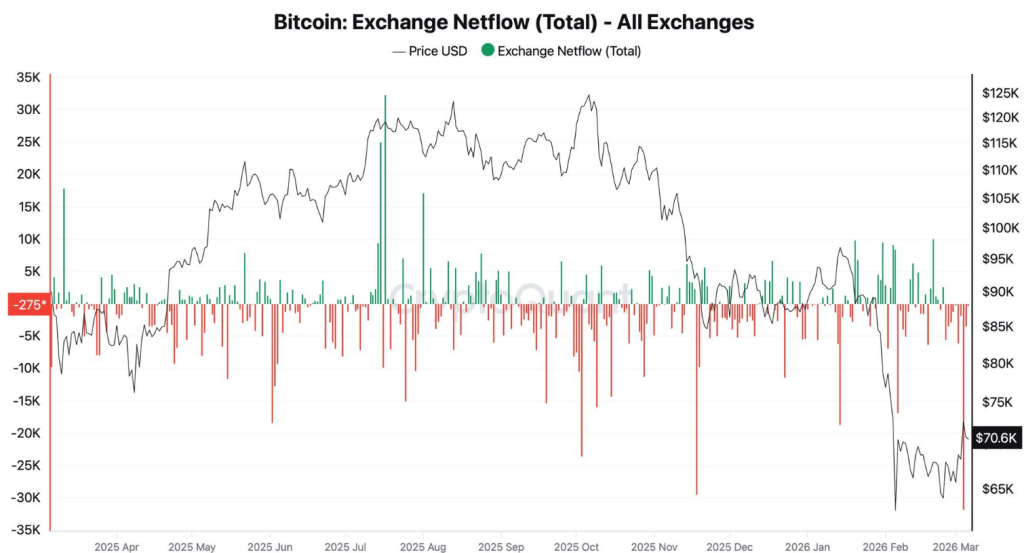
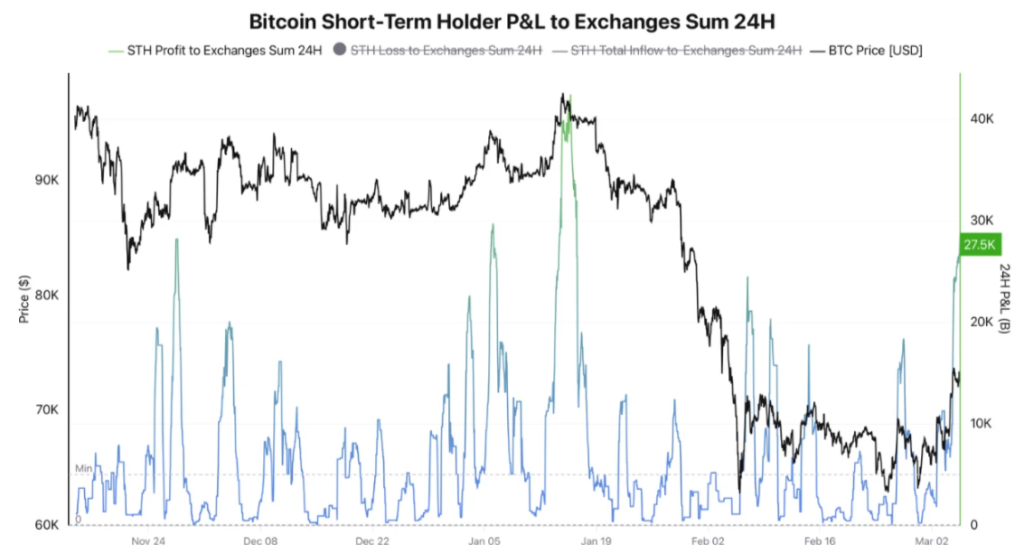
Despite the strong Pippin price rally today, spot flow data suggests that broader market participation may still be limited. Netflow metrics indicate that exchange flows remain largely negative, meaning more tokens continue to move out of active trading flows rather than being supported by strong new inflows. Historically, sustained price rallies tend to coincide with clear inflows of fresh capital, reflecting growing investor participation. In contrast, the latest rebound appears to be unfolding during a period of relatively muted spot demand.

Pippin spot flows

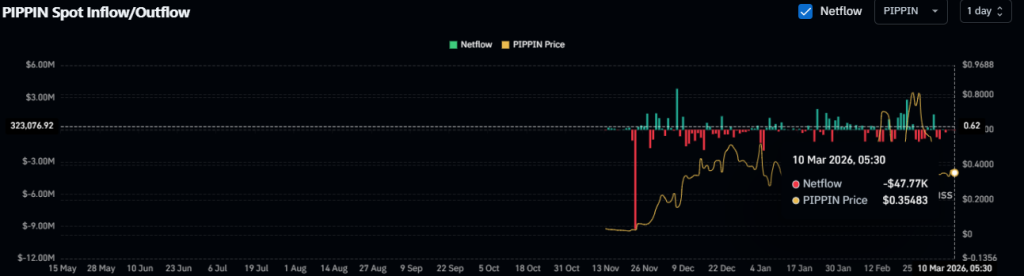
The flow chart also highlights how earlier phases of Pippin’s rally were supported by stronger inflow activity. The absence of similar capital inflows during the latest price jump suggests that the move may currently be driven more by short-term speculative buying than by broader accumulation.

Such divergences between price action and market flows often signal that bullish conviction across the market is still developing.

Derivatives positioning still leans bearish

Derivative data reinforces the cautious narrative emerging from on-chain flows. Current market metrics show that the long–short ratio remains below 1, indicating that short positions still dominate across derivatives platforms.

In practical terms, this means a larger share of traders are currently positioning for potential downside rather than expecting a sustained bullish breakout.

Pippin on-chain

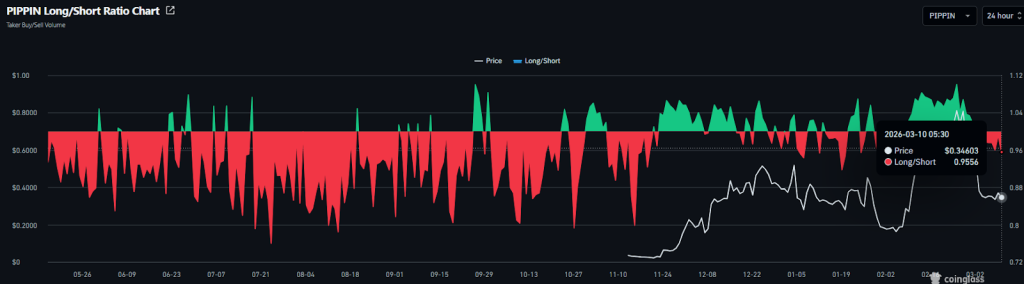
Such positioning often reflects lingering skepticism among leveraged traders, particularly after periods of heightened volatility or failed rally attempts. While a continued price increase could trigger a short squeeze, forcing bearish traders to close positions, the broader derivatives market currently appears defensive despite the latest price surge. Until this ratio shifts decisively in favor of long positions, analysts suggest the Pippin price rally today may still face resistance from cautious trader sentiment.

Pippin Price Analysis: Breakdown raises downside risks

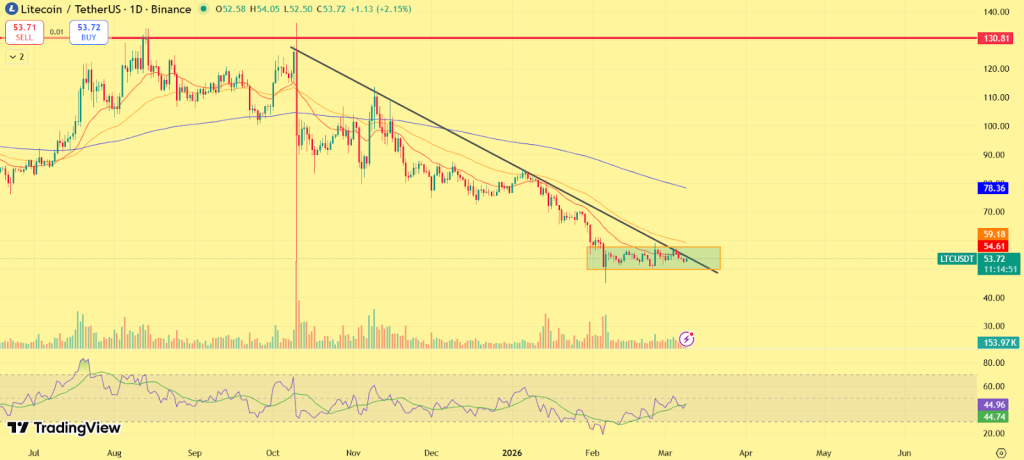
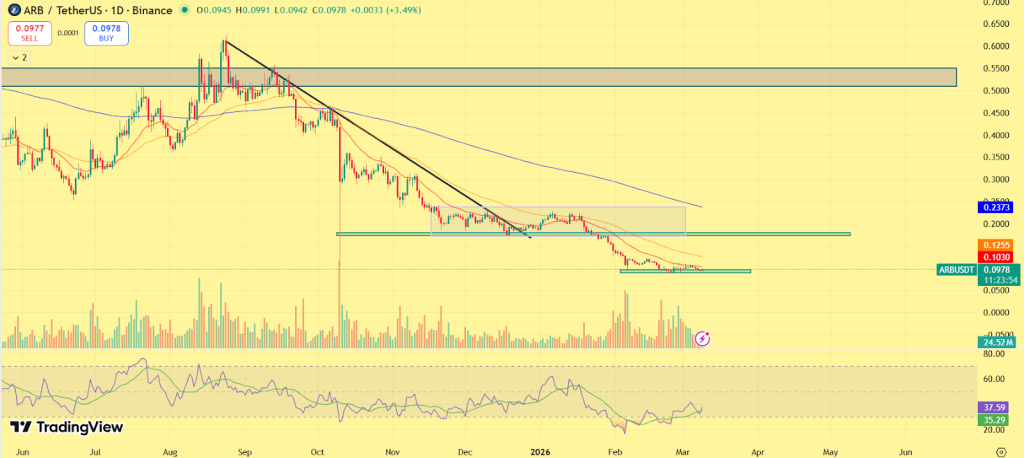
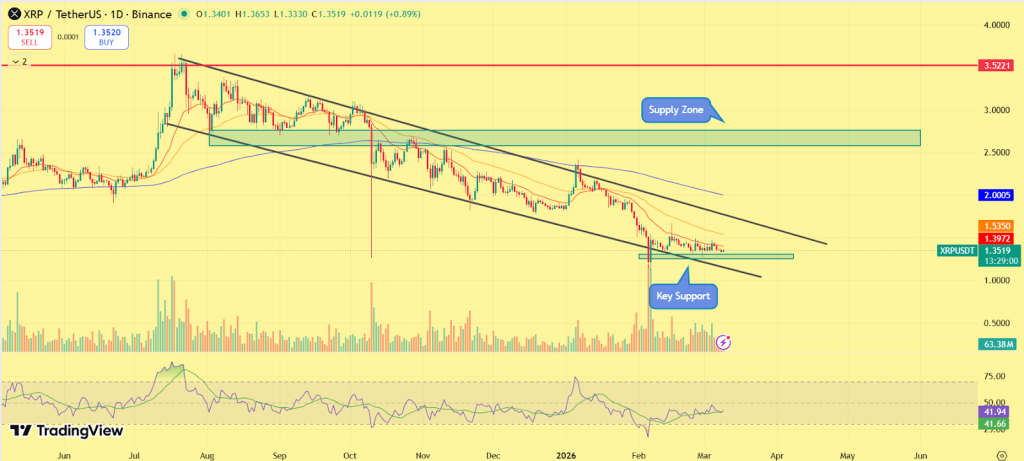
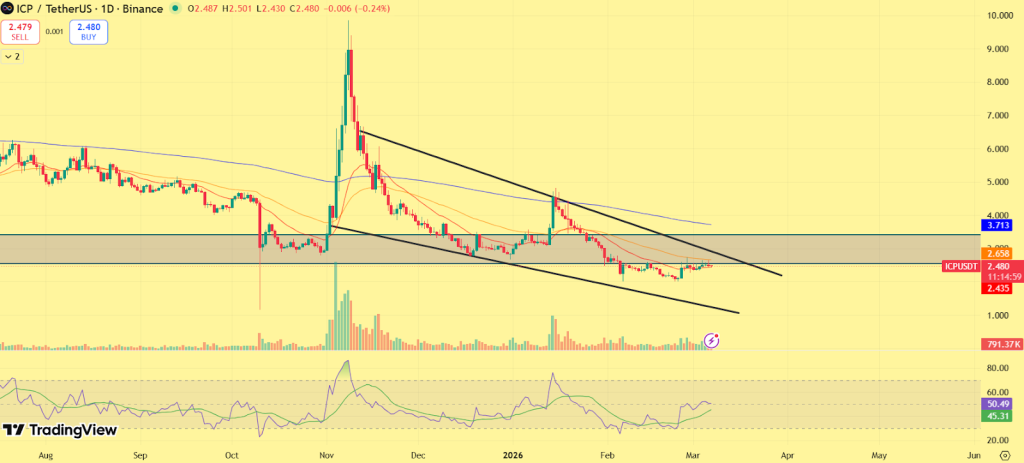
Pippin price chart structure suggests that Pippin may still be navigating a fragile recovery attempt. At the time of writing, Pippin was trading near $0.34, after failing to sustain momentum above the key resistance zone around $0.43–$0.45. This region has acted as a major supply zone over the past few months, repeatedly capping upward price movement. The latest rally attempt also faced rejection near this area.

Pippin price rally today

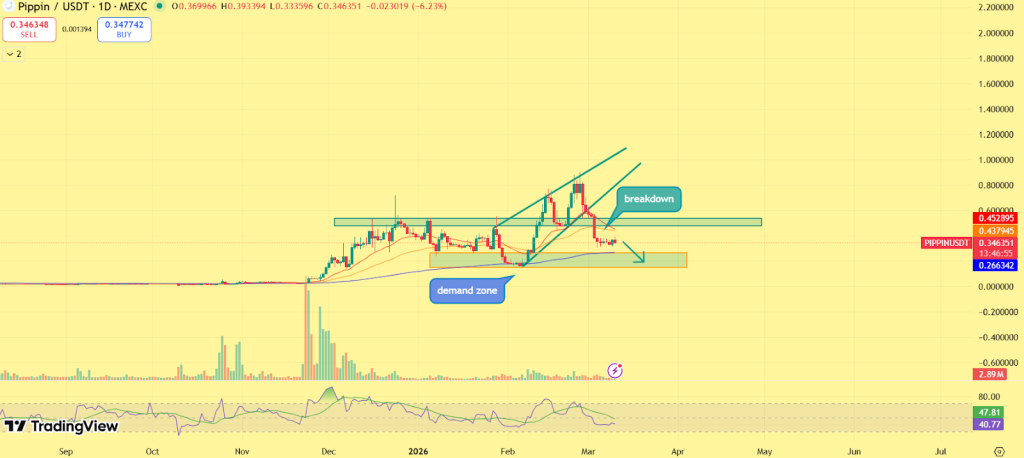
The chart further shows that Pippin had previously formed a short-term rising channel, which supported its upward movement earlier in the year. However, price has now broken below that structure, signaling weakening bullish momentum. Following the breakdown, the token has retested the former support range around $0.38–$0.40, which now appears to be flipping into resistance, a classic technical pattern that often confirms trend weakness.

Looking ahead, traders are closely watching the demand zone between $0.26 and $0.30, which previously acted as a strong accumulation area. If selling pressure continues, this region could become the next key support level. However, if Pippin manages to reclaim the $0.40–$0.43 resistance zone, the current bearish structure could weaken and allow the token to attempt another rally.

Final Outlook

For now, the Pippin price rally today highlights a classic market divergence. While the token’s sharp 14% surge reflects renewed buying activity, underlying indicators such as negative netflows and bearish derivatives positioning suggest that broader market confidence remains limited.

Unless market participation strengthens and derivatives sentiment shifts toward bullish positioning, the current rally may remain vulnerable to renewed volatility. In the coming sessions, traders will likely monitor exchange flows, derivatives positioning, and key technical levels to determine whether Pippin’s latest rebound evolves into a sustained recovery, or fades into another short-lived rally.

FAQs

Why is the Pippin price rallying today?

Pippin price jumped about 14% as buyers returned to the market. However, weak derivatives activity and limited capital inflows suggest the rally may still lack strong support.

Is the Pippin price rally sustainable?

The rally may face challenges. Bearish derivatives positioning and weak spot inflows indicate traders remain cautious despite the recent price surge.

Could the Pippin rally trigger a short squeeze?

Yes, if Pippin continues rising, short traders may close positions quickly. This could push prices higher, creating a short squeeze and stronger upward momentum.

Crypto Market Today: Bitcoin Price Climbs to $70K as Oil Prices Drops Below $85

Crypto Market Today

The post Crypto Market Today: Bitcoin Price Climbs to $70K as Oil Prices Drops Below $85 appeared first on Coinpedia Fintech News

The crypto market today is witnessing renewed buying momentum as Bitcoin reclaimed the $70,000 level, marking one of its strongest daily recoveries this week. Today’s crypto market rally comes as global macro conditions show early signs of easing. Brent crude, which had recently surged on geopolitical tensions, has now fallen below the $85 mark, cooling inflation concerns that had weighed on financial markets.

As oil prices retreated, risk assets across global markets began to stabilize. Bitcoin (BTC) quickly followed, rebounding from intraday lows near $67,000 before pushing back toward the $70K zone. For traders, the move highlights how closely digital assets are now linked to broader macroeconomic trends.

Why Falling Oil Prices Matter for Crypto

Oil prices play a key role in shaping global inflation expectations and investor sentiment. When energy prices rise sharply, inflation fears typically increase. This can push central banks to maintain tighter monetary policies, reducing liquidity across financial markets. Risk-sensitive assets like cryptocurrencies often struggle in such environments.

BIG BREAKING 💥

MIDDLE EAST WAR ABOUT TO END

The US will retreat and end the war in the middle east leaving the same regime. Failed mission?

OIL prices are down over 30% from today's highs.

If it really happens this is extremely bullish for all stock and crypto markets pic.twitter.com/s3IWYWnmzw

— Mr hunter (@TrueGemHunter) March 9, 2026

However, the recent decline in oil prices could signal the opposite dynamic. With Brent crude falling below $85 per barrel, inflation pressures may begin to ease. This shift can improve investor confidence and increase demand for risk assets such as technology stocks and cryptocurrencies.

Historically, periods of cooling commodity prices have often coincided with renewed strength in digital asset markets.

Bitcoin Price Outlook: Key Levels to Watch

Bitcoin price recovery above $70,000 is an important development. The level represents a significant psychological threshold for traders. Reclaiming it suggests buyers are attempting to regain control after several sessions of consolidation.

Bitcoin price rally

If bullish momentum continues, analysts say Bitcoin could soon test the $72,000–$74,000 resistance range, where sellers previously capped upward movement. A break above this zone could open the door for a move toward $75,000, a key upside target in the current market structure. On the downside, $68,000 remains an important support level. Holding above this area would keep the broader bullish structure intact in the near term.

Altcoins Stabilize as Market Sentiment Improves

The improvement in Bitcoin’s price is already supporting the broader crypto market today. Several major altcoins are stabilizing after recent volatility, reflecting a modest shift in investor sentiment. 

Crypto market today

Traders say the easing of macro pressure from the oil market has helped reduce risk aversion across digital assets. While uncertainty still remains in global markets, the cooling of energy prices may provide a short-term tailwind for cryptocurrencies if the trend continues.

Crypto Market Outlook

For now, the crypto market today appears to be reacting positively to improving macro signals. Bitcoin price holding above $70,000 would strengthen bullish sentiment, while continued weakness in oil prices could further ease inflation concerns. Traders will likely continue monitoring both macro indicators and key technical levels, as these factors increasingly influence the direction of the crypto market. If current momentum persists, analysts say the next few trading sessions could determine whether Bitcoin’s latest rebound develops into a broader market rally.

FAQs

Why is the crypto market up today?

The crypto market is up as Bitcoin rebounds above $70K, supported by falling oil prices and easing inflation fears boosting investor confidence.

How do oil prices affect cryptocurrency prices?

Lower oil prices ease inflation pressures, encouraging risk-taking and boosting demand for cryptocurrencies like Bitcoin and major altcoins.

Are altcoins benefiting from Bitcoin’s recovery?

Yes, stabilizing Bitcoin prices are lifting major altcoins, reflecting improved market sentiment and reduced risk aversion.

Could crypto markets continue to rally?

If macro signals remain positive and Bitcoin stays above $70K, analysts see potential for further gains toward $72K–$75K in the near term.

Litecoin (LTC) Price Prediction 2026, 2027 – 2030: How High Will LTC Price Go?

Litecoin Price Prediction

The post Litecoin (LTC) Price Prediction 2026, 2027 – 2030: How High Will LTC Price Go? appeared first on Coinpedia Fintech News

Story Highlights

  • Litecoin price today  $ 54.04450533
  • Price predictions for 2026 range from $100 to $150.00.
  • Long term outlook suggests gradual growth potential toward $1000+ by 2030.

Litecoin (LTC) continues to position itself as a reliable digital payment network, offering quick transactions and consistently low transaction fees. 

As 2025 sets the base for the next phase of crypto adoption, Litecoin’s growth fundamentals together make its forward-looking valuation an important metric for investors tracking stability-driven growth into 2026, 2027 and beyond.

LTC entered 2026 in a recovery-driven market phase, with price action reflecting renewed accumulation after a consolidation period. Trading above its demand zone for most of the year, LTC showed early signs of structural stability, forming a strong base around $60-$70.

Now, Questions abound: “Will Litecoin break the long-term consolidation phase?” and “What heights can LTC reach by 2050?” Explore this Litecoin price prediction 2026 and beyond, filled with expert insights and ambitious forecasts.

Litecoin Price Today

Cryptocurrency Litecoin
Token LTC
Price $54.0445 up 1.31%
Market Cap$ 4,157,865,822.55
24h Volume$ 305,628,161.9841
Circulating Supply76,934,108.2335
Total Supply84,000,000.00
All-Time High$ 412.9601 on 10 May 2021
All-Time Low$ 1.1137 on 14 January 2015

Can Litecoin Be Halved? When is the Next Litecoin Halving Event?

Yes, Litecoin can be halved, employing a mechanism similar to Bitcoin’s that reduces the block reward by half approximately every four years. The most recent Litecoin halving occurred in August 2023, successfully completing the procedure. The next Litecoin halving event is estimated to take place in July 2027. 

CoinPedia’s LTC Price Prediction

Coinpedia’s price prediction for LTC is neutral to bullish. However, Litecoin’s success will largely depend on its continued relevance as a payment-focused blockchain. While Litecoin may not deliver explosive gains, it remains a potential long-term value asset within diversified crypto portfolios.

CoinPedia expects the LTC Price to reach $150.00 by the year-end. 

On the downside,, if LTC price sees a downtrend in the upcoming months, it may collapse the coin’s price to $100.00.

YearPotential Low ($)Potential Average ($)Potential High ($)
2026100.00125.00150.00

LTC Price Prediction March 2026

Litecoin (LTC) is currently trading around $53.77, continuing to move inside a tight consolidation range after a prolonged downtrend that began late last year. The chart structure suggests that sellers have been controlling the broader trend, but price action is now stabilizing within a short-term demand zone. The $52–$54 region has emerged as a near-term support band where buyers have repeatedly stepped in during recent sessions. Holding above this zone keeps Litecoin in a consolidation phase rather than extending the downtrend immediately.

However, the token still faces pressure from a descending resistance trendline, which has been capping recovery attempts. For Litecoin to shift momentum in March, it would first need to reclaim the $59–$60 resistance area, which aligns with previous breakdown levels. A sustained move above this region could allow the price to gradually push toward $70–$78, where stronger resistance clusters remain. On the downside, if Litecoin fails to defend the $52 support, the market could revisit the $48–$45 range, which represents the next structural demand zone visible on the chart.

Overall, March may remain a range-bound phase for Litecoin, with traders closely watching whether the current consolidation near $53 develops into a recovery attempt or leads to another leg lower in the broader downtrend.

Litecoin Price Prediction 2026

The year 2026 is expected to be a defining phase and could mark a transitional phase for Litecoin, balancing between stability and gradual growth. Entering in 2026, LTC is likely to carry forward the base it formed in 2025 around $60-$70.

In a bullish scenario, increasing adoption of crypto payments and renewed interest in legacy blockchain networks could drive LTC toward higher levels.

A clean breakout above $100 may open the doors toward $120 followed by $150. Based on chart setup, maintaining higher highs and holding above 50 day EMA be crucial for sustaining bullish momentum.

LTC Price

If broader market conditions align, 2026 could establish Litecoin as a steady outperform rather than an explosive asset.

YearPotential Low ($)Potential Average ($)Potential High ($)
LTC Price Prediction 2026100.00125.00150.00

LTC Price Onchain Outlook

Litecoin’s on-chain indicators currently point toward a structurally stable price base rather than overheated speculative conditions. Active address activity has remained steady during price pullbacks, suggesting limited distribution and ongoing accumulation near key support zones.

Transaction volume has stayed consistent without sharp spikes, indicating organic network usage instead of short-term trading driven activity. 

From a pricing perspective, this lowers the probability of abrupt sell-off’s and supports gradual upside expansion. Overall, LTC’s on-chain data aligns with a slow-building price structure. As long as network participation remains stable and miner selling stays controlled.

LTC Crypto Price Prediction 2026 – 2030

YearPotential Low ($)Potential Average ($Potential High ($)
2026100.00125.00150.00
2027150.00200.00280.00
2028220.00290.00380.00
2029290.00370.00530.00
2030430.00650.001000.00

Litcoin (LTC) Price Prediction 2026

The LTC price range in 2026 is expected to be between $100.00 and $150.00.

LTC Price Forecast 2027

Litecoin (LTC) price range can be between $150.00 to $280.00 during the year 2027. 

LTC Prediction 2028

In 2028, Litecoin is forecasted to potentially reach a low price of $220.00, an average price of $220.00, and a high price of $380.00.

LTC Price Targest 2029

Thereafter, the LTC price for the year 2029 could range between $290.00  and $530.00.

Litecoin (LTC) Price Prediction 2030

Finally, in 2030, the price of LTC is predicted to maintain a steady positive. It may trade between $430.00 and $1000.00.

LTC Price Prediction 2031, 2032, 2033, 2040, 2050

Based on the historic market sentiments and trend analysis of the largest cryptocurrency by market capitalization, here are the possible LTC price targets for the longer time frames.

YearPotential Low ($)Potential Average ($)Potential High ($)
2031570.00750.00900.00
2032720.00840.001200.00
2033800.00920.001300.00
20401000.001200.001800.00
20501200.001500.002200.00

LTC Price Prediction: Market Analysis?

Year202620272030
Changelly$165$245.00$420.00
CoinCodex$130.00$220.00$280.00
Binance$150.00$250.00$310.00

CoinPedia’s LTC Price Prediction

Coinpedia’s price prediction for LTC is neutral to bullish. However, Litecoin’s success will largely depend on its continued relevance as a payment-focused blockchain.

While Litecoin may not deliver explosive gains, it remains a potential long-term value asset within diversified crypto portfolios.

CoinPedia expects that LTC Price to reach $150.00 by the year-end. 

On the downside,, if LTC price sees a downtrend in the upcoming months, which may collapse the coin’s price to $100.00.

YearPotential Low ($)Potential Average ($)Potential High ($)
2026100.00125.00150.00
Never Miss a Beat in the Crypto World!

Stay ahead with breaking news, expert analysis, and real-time updates on the latest trends in Bitcoin, altcoins, DeFi, NFTs, and more.

FAQs

What is Litecoin (LTC) and how does it work?

Litecoin is a fast, low-fee digital currency designed for payments, using a secure blockchain similar to Bitcoin for peer-to-peer transfers.

When is the next Litecoin halving event?

Litecoin’s next halving is expected in July 2027, reducing block rewards by half and potentially impacting supply and price over time.

Can Litecoin be a long-term investment?

Litecoin offers stable growth potential as a payment-focused blockchain, making it a strong option for diversified crypto portfolios over time.

What is Litecoin’s price prediction for 2026?

Litecoin may trade between $100-$150 in 2026, driven by adoption, network stability, and potential bullish momentum in crypto markets.

What is Litecoin’s price prediction for 2028?

Litecoin could reach $220-$380 in 2028, reflecting gradual adoption, network growth, and positive market trends over the medium term.

What is Litecoin’s price prediction for 2030?

By 2030, Litecoin is projected to trade between $430-$1,000, supported by steady network use, adoption, and long-term crypto market growth.

Arbitrum (ARB) Price Prediction 2026, 2027 – 2030: Will ARB Hit $6 by 2030?

Arbitrum Price Prediction

The post Arbitrum (ARB) Price Prediction 2026, 2027 – 2030: Will ARB Hit $6 by 2030? appeared first on Coinpedia Fintech News

Story Highlights

  • The live price of the ARB token is $ 0.0993.
  • Price predictions for 2026 range from $0.70 to $1.20.
  • ARB could extend toward $6 by 2030, if recovery structure holds.

Arbitrum (ARB) is a layer-2 scaling solution designed to enhance Ethereum’s transaction throughput while reducing costs. Since its launch, ARB has seen significant volatility, driven largely by early speculative interest followed by prolonged price adjustment. Like many infrastructure tokens, Arbitrum has spent considerable time correcting excess valuations while attempting to establish a sustainable trading range.

Over the past year, ARB’s price behavior has gradually shifted. Sharp sell-offs have given way to more controlled movements, and prices have begun stabilizing around key demand zones. With volatility compressing and downside momentum fading, the market is now watching whether ARB can transition from correction into recovery as 2026 approaches.

Arbitrum Price Today

Cryptocurrency Arbitrum
Token ARB
Price $0.0993 up 1.98%
Market Cap$ 589,520,256.59
24h Volume$ 73,226,004.0409
Circulating Supply5,939,074,958.00
Total Supply10,000,000,000.00
All-Time High$ 2.3975 on 12 January 2024
All-Time Low$ 0.0886 on 23 February 2026

Arbitrum (ARB) Price Prediction March 2026

Arbitrum (ARB) price continues to trade under pressure as the broader market consolidation keeps Layer-2 tokens in a cautious phase. At the time of writing, ARB price is hovering near $0.097, sitting just above a key demand zone that has repeatedly attracted buyers over the past few weeks. ARB price chart shows a prolonged descending trendline that has been guiding the downtrend since late 2025. Price action is currently compressing near the $0.09–$0.10 support area, which now acts as the most important level for March.

If this support continues to hold, ARB could attempt a short-term recovery toward the $0.12–$0.13 region, where the next resistance cluster sits. A break above this range would open the door for a move toward $0.18–$0.23, which previously acted as a consolidation zone earlier in the trend. However, downside risks remain if market sentiment weakens. Losing the $0.09 support could expose ARB to further declines toward $0.07, where the next structural demand zone may appear.

Overall, March could remain a stabilization phase for Arbitrum, with the market watching whether the token can defend its current support and gradually attempt a recovery above the descending resistance structure.

Arbitrum Price Prediction 2026

The broader outlook for Arbitrum in 2026 depends on whether its current base structure can support higher prices. From a technical standpoint, prolonged consolidation phases often precede gradual trend reversals once resistance zones are reclaimed.

Arbitrum Price Prediction 2026

If ARB successfully breaks above the $0.80–$0.90 resistance area and maintains acceptance, price could advance toward the $1.00–$1.20 range. This zone represents a major technical milestone and would confirm that the corrective phase has ended. A move into this range would likely unfold gradually, supported by higher lows rather than sharp rallies. Reaching $1.20 by the end of 2026 would signal a structural recovery rather than speculative excess. If momentum remains mixed, ARB may trade between $0.60 and $0.95, continuing to build a higher base before attempting further expansion. A sustained break below $0.50 would weaken the recovery thesis and delay bullish expectations.

Arbitrum Crypto Price Prediction 2026 – 2030

YearPotential Low ($)Potential Average ($Potential High ($)
20260.701.001.20
20271.002.002.80
20281.402.704.00
20293.004.205.20
20304.605.007.00

Arbitrum Price Forecast 2026

The Arbitrum price range in 2026 is expected to be between $0.70 and $1.20.

ARB Crypto Price Prediction 2027

Arbitrum (ARB) price range can be between $1.70 to $2.80 during the year 2027. 

Arbitrum Coin Price Prediction 2028

In 2028, the Arbitrum price is forecasted to potentially reach a low price of $1.40. and a high price of $4.00.

ARB Price Prediction 2029

Thereafter, the Arbitrum (ARB) price for the year 2029 could range between $3.00  and $5.20.

Arbitrum(ARB) Price Prediction 2030

Finally, in 2030, the price of Arbitrum is predicted to remain steadily positive. It may trade between $4.60 and $7.00.

Arbitrum Price Prediction 2031, 2032, 2033, 2040, 2050

Based on the historic data and trend analysis of the cryptocurrency along with the market sentiments, here are the possible Arbitrum price targets for the longer time frames.

YearPotential Low ($)Potential Average ($)Potential High ($)
20314.005.808.00
20325.007.309.80
20336.508.2011.00
20409.0013.0020.00
205013.0022.0032.00

Arbitrum (ARB) Price Prediction: Market Analysis?

Year202620272030
Changelly$1.20$2.40$6.00
DigitalCoinPrice$1.90$2.60$5.70
WalletInvestor$25.60$1.00$5.20

CoinPedia’s Arbitrum Price Prediction

Based on current technical structure and observed market behavior, Coinpedia’s price outlook implies that Arbitrum (ARB) price is expected to trade between $0.70 and $1.20 in 2026, assuming price remains above its long-term support zone. Over the longer term, if market sentiment remains positive and recovery persists, Arbitrum could potentially reach a price range of $3 to $6 by 2030.

YearPotential Low ($)Potential Average ($)Potential High ($)
20260.701.001.20
Never Miss a Beat in the Crypto World!

Stay ahead with breaking news, expert analysis, and real-time updates on the latest trends in Bitcoin, altcoins, DeFi, NFTs, and more.

FAQs

What is the Arbitrum (ARB) price prediction for 2026?

In 2026, ARB is expected to trade between $0.70 and $1.20 if it holds key support and confirms a long-term recovery trend.

What is the ARB price prediction for 2030?

ARB price prediction for 2030 suggests a potential range between $4.60 and $7.00, assuming sustained adoption and market growth.

What is the Arbitrum price prediction for 2040?

Arbitrum price prediction for 2040 indicates a possible range of $9 to $20 if Ethereum scaling demand remains strong long term.

What is the Arbitrum price prediction for 2050?

Arbitrum price prediction for 2040 indicates a possible range of $9 to $20 if Ethereum scaling demand remains strong long term.

What could impact Arbitrum’s price the most?

ARB price is influenced by Ethereum activity, Layer-2 adoption, overall crypto market trends, and broader investor sentiment.

Is Arbitrum a good long-term investment?

Arbitrum shows long-term potential due to Ethereum adoption, but ARB remains volatile and best suited for investors with risk tolerance.

XRP Price Faces Pressure as $50B Turns Underwater – But Data Hints at a Possible Setup

XRP Holders Selling at Loss as Price Struggles

The post XRP Price Faces Pressure as $50B Turns Underwater – But Data Hints at a Possible Setup appeared first on Coinpedia Fintech News

XRP price is trading near $1.35 today as fresh on-chain data shows nearly $50 billion worth of XRP has moved underwater, highlighting growing pressure across the network. While the broader crypto market remains uncertain, several underlying indicators are beginning to reveal shifts beneath the surface. Large portions of the XRP supply are now sitting at a loss, trading momentum on major exchanges has slowed, and the asset itself is compressing within a tightening technical structure.

As a result, analysts are now closely watching whether XRP price is simply stabilizing after its recent decline, or quietly preparing for a larger move in the weeks ahead.

A Large Portion of XRP Supply is Now Underwater

According to Glassnode data tracking the “Total Supply in Loss” metric, approximately 36.8 billion XRP tokens are now trading below the price at which they were acquired. At current market prices, this translates to nearly $50 billion in unrealized losses across the network. This indicator measures how much of a cryptocurrency’s circulating supply is currently held at a loss. Rising supply in loss typically occurs during market corrections when investors who bought near local highs begin to see their positions move underwater.

XRP on chain

However, historically such phases can also signal late-stage corrections, where weaker hands exit positions while longer-term investors gradually accumulate. In previous market cycles, spikes in underwater supply have often appeared near major market turning points, though such signals rarely play out immediately.

XRP Trading Momentum is Cooling

Alongside rising unrealized losses, trading activity across major exchanges has also begun to slow. XRP Volume Z-Score on Binance shows the indicator recently falling to around -1.16. The Volume Z-Score compares current trading activity with historical averages, helping analysts identify abnormal spikes or declines in market participation.

XRP volume Z score

A negative reading suggests that current trading volumes are below the historical norm, indicating reduced speculative activity in the market.

Periods of declining trading volume often occur when markets enter consolidation phases, where traders temporarily step back and liquidity begins to thin. Historically, these quieter market conditions have sometimes preceded larger volatility moves once momentum returns.

XRP Price Coiling Near Key Support: What’s Next?

XRP price is currently trading within a descending channel pattern, reflecting the broader consolidation phase underway. For the past few sessions, XRP token price has been hovering near a key support region between $1.30 and $1.35, which has recently acted as a short-term demand zone.

XRP price

At the same time, a descending resistance trendline continues to cap upside attempts, keeping the broader corrective structure intact. If buyers manage to break above this resistance line, analysts suggest the next potential resistance area could emerge near $2, followed by a broader supply region between $2.8 and $3. However, failure to maintain the current support level could expose XRP price to additional downside pressure, particularly if weakness across the broader crypto market continues.

The Bottom Line

Although XRP price currently appears relatively stable, underlying market data suggests that pressure may be building beneath the surface. Rising unrealized losses, declining trading momentum, and tightening technical structure all point toward a market entering an important decision phase. Whether this leads to renewed downside pressure or a broader recovery will likely depend on how XRP price reacts around its current support levels in the coming sessions.

Bitcoin Exchange Reserves Drop to 2019 Levels: Is a BTC Supply Shock Coming?

Core Scientific Sells 1,900 BTC

The post Bitcoin Exchange Reserves Drop to 2019 Levels: Is a BTC Supply Shock Coming? appeared first on Coinpedia Fintech News

Bitcoin exchange reserves drop to their lowest levels in nearly six years, and the shift could quietly reshape the market’s supply dynamics. Recent on-chain data indicates that the amount of BTC held on centralized exchanges has fallen back to levels last seen in 2019, highlighting a significant structural change in how investors are choosing to hold the asset.

While price volatility often dominates market headlines, deeper indicators such as exchange reserves can reveal important changes in supply and liquidity. With institutional demand rising and more investors opting for self-custody, the pool of Bitcoin available for active trading may be shrinking. This development has now sparked a key question across the crypto market: could declining exchange reserves become the next bullish catalyst for Bitcoin price?

Bitcoin Exchange Reserves Drop to Multi-Year Lows

According to on-chain data, Bitcoin exchange reserves have declined to roughly 2.7 million BTC, marking the lowest level since 2019. The trend has been unfolding gradually over several years but accelerated significantly following the collapse of centralized platforms during the 2022 market crisis. After the FTX collapse, investors rushed to withdraw funds from exchanges and move their Bitcoin into private wallets. In November 2022 alone, more than 325,000 BTC left exchange reserves, marking one of the largest single-month outflows in Bitcoin’s history.

Bitcoin Exchange Reserves Drop

Even years after that event, the downward trend has continued, suggesting a long-term shift toward self-custody and long-term holding strategies.

Among centralized exchanges, Binance currently holds around 20% of all exchange-based BTC reserves, making it the largest retail liquidity hub. Meanwhile, Coinbase Advanced reportedly holds nearly 800,000 BTC, although this is roughly 200,000 BTC lower than levels seen in mid-2025.

Spot Bitcoin ETFs Are Absorbing Supply

Another key factor behind why Bitcoin exchange reserves drop is the rapid rise of spot Bitcoin ETFs. Since their launch in early 2024, institutional investors have been steadily accumulating Bitcoin through regulated investment products. At the time ETFs entered the market, exchange reserves were still above 3.2 million BTC. Today, these funds collectively hold roughly 1.3 million BTC, representing about 6–7% of Bitcoin’s circulating supply.

Because ETF holdings are typically stored with custodians rather than exchanges, this Bitcoin is effectively removed from the liquid trading supply.

As ETF inflows continue, the amount of Bitcoin available on exchanges may keep declining.

Corporate Bitcoin Treasuries Continue to Grow

Corporate treasury strategies are also contributing to the trend where Bitcoin exchange reserves drop. Over the past few years, several companies have adopted Bitcoin as a strategic reserve asset, allocating BTC to their balance sheets as a hedge against currency debasement and macroeconomic uncertainty. Collectively, corporate treasury entities now hold around 1.1 million BTC, which accounts for roughly 5% of the total circulating supply.

Unlike short-term traders, these organizations typically follow long-term accumulation strategies, meaning their Bitcoin is unlikely to return to exchanges anytime soon. This further reduces the liquid supply available for active market trading.

What This Means for Bitcoin Price

When Bitcoin exchange reserves drop, it often signals tightening supply conditions across the market. With more BTC moving into long-term storage, ETFs, and corporate treasuries, fewer coins remain available for immediate trading on exchanges.

Historically, declining exchange reserves have sometimes preceded supply-driven price expansions, particularly when demand simultaneously increases. While the impact may not appear immediately, analysts believe the ongoing reduction in exchange balances could play an important role in shaping Bitcoin’s next market cycle.

Chainlink Price Forms Breakout Setup as Inflows Rise: What Charts Reveal

Chainlink Price Targets $53 Could LINK Be the Next Blue Chip to Rally

The post Chainlink Price Forms Breakout Setup as Inflows Rise: What Charts Reveal appeared first on Coinpedia Fintech News

Chainlink price has been quietly building strength while much of the crypto market struggles to regain momentum. Despite broader uncertainty and volatility across major altcoins, LINK has managed to hold a critical support region while gradually tightening its price range. This type of compression often appears before major directional moves, and the latest on-chain data suggests investors are still positioning around the Chainlink ecosystem.

At the same time, LINK price is now trading close to a key descending resistance trendline, raising an important question for traders: Is Chainlink preparing for a breakout rally, or will the consolidation continue? A closer look at capital flows and the chart structure may provide the answer.

LINK Attracts Fresh Capital Despite Market Weakness 

One of the most notable signals supporting the current Chainlink price outlook is the steady inflow of capital into LINK-related investment products. Recent data shows that Chainlink recorded approximately $935K in inflows on March 6, following $1.93 million in inflows the previous day.

This pushed the cumulative inflow figure to nearly $90.66 million, highlighting continued interest in the Chainlink ecosystem. What makes this development particularly important is that the inflows are occurring during a weak market environment, when many altcoins are experiencing capital outflows.

LINK ETF inflows

Sustained inflows during uncertain market conditions often indicate strategic accumulation, where investors gradually increase exposure while prices remain compressed. For Chainlink, which plays a critical role in providing decentralized oracle infrastructure, this continued capital flow reflects ongoing demand for its underlying technology.

Chainlink Price Tightens Near Key Trendline: Is $12 Level Next?

Chainlink price is currently forming a tightening consolidation pattern. The chart shows LINK trading inside a structure defined by a descending resistance trendline and a stable support zone near $8.40–$8.60.

This pattern has produced a sequence of lower highs, but buyers continue defending the lower boundary of the range. Such compression typically indicates a buildup of market pressure, where volatility gradually contracts before a larger move unfolds. LINK price remains inside this structure, the stronger the eventual breakout tends to be.

Chainlink Price

With LINK now approaching the upper boundary of the trendline, the next move could determine the short-term direction. The most important level for Chainlink price right now is the descending resistance trendline near $9.20–$9.40. A decisive breakout above this region could allow LINK to reclaim the $10 psychological level, which has previously acted as a strong supply zone. If bullish momentum accelerates, analysts are watching the $11–$12 region as the next major upside target.

This zone aligns with previous consolidation areas seen during earlier phases of the market cycle. On the downside, the $8.40–$8.60 demand zone remains the key support structure. Holding above this region keeps the current breakout setup intact, while a breakdown below it could delay the bullish scenario. For now, the structure suggests that Chainlink price is approaching an important inflection point.

Final Outlook

Chainlink continues to show resilience in a market that remains uncertain. The combination of steady capital inflows and tightening price structure suggests that LINK may be entering a key decision phase. If buyers manage to push the token above its descending resistance trendline, the current consolidation could quickly transition into a stronger rally. Until then, the ongoing compression indicates that Chainlink price may be preparing for its next major move.

Internet Computer (ICP) Price Prediction 2026, 2027 – 2030: Is ICP Preparing a Move Toward $25?

Internet Computer Price Prediction

The post Internet Computer (ICP) Price Prediction 2026, 2027 – 2030: Is ICP Preparing a Move Toward $25? appeared first on Coinpedia Fintech News

Story Highlights

  • The live price of the ICP crypto is  $ 2.49805801.
  • If the recovery structure develops, ICP could gradually climb toward the $27 region by the end of 2026.
  • With stronger Web3 infrastructure adoption, ICP price could potentially expand toward $70 by 2030.

Internet Computer (ICP) has spent the past year rebuilding its market structure after one of the sharpest corrections among large-cap crypto assets. While the token once commanded significantly higher valuations during its early market debut, the current phase suggests a slow stabilization as the broader crypto market gradually prepares for its next expansion cycle.

Developed by the DFINITY Foundation, Internet Computer aims to extend blockchain capabilities beyond payments by enabling developers to build full-scale applications directly on-chain. The protocol functions as a decentralized cloud platform where websites, enterprise tools, and services can run entirely on blockchain infrastructure without relying on traditional cloud providers.

If the broader cryptocurrency market regains momentum and developer adoption continues expanding across decentralized computing platforms, Internet Computer could gradually regain investor attention over the coming years. So, let’s dive into Coinpedia’s Internet Computer (ICP) Price Prediction 2026, 2027 – 2030.

Internet Computer Price Today

Cryptocurrency Internet Computer
Token ICP
Price $2.4981 up 4.48%
Market Cap$ 1,372,523,557.56
24h Volume$ 56,507,719.2853
Circulating Supply549,436,223.5677
Total Supply549,436,223.5677
All-Time High$ 750.7305 on 10 May 2021
All-Time Low$ 1.9773 on 10 October 2025

Internet Computer (ICP) Price March 2026 Outlook

As March progresses, Internet Computer continues trading within a tight consolidation range near $2.40–$2.60, suggesting the market is waiting for a decisive breakout. The $2.20–$2.30 zone currently acts as a key support region. Holding above this level keeps the short-term recovery structure intact and signals that buyers remain active in the market.

On the upside, the first meaningful resistance sits around $3.50, where previous rallies stalled. If ICP manages to break above this area, momentum could push the price toward $5–$6, which historically acted as a major trading range. For now, the market appears to be in a consolidation phase where traders are watching whether the token can reclaim higher levels during the next market expansion.

Internet Computer Price Prediction 2026

Looking deeper into 2026, Internet Computer’s trajectory will likely depend on both technical recovery and broader Web3 infrastructure demand. The project continues positioning itself as a decentralized cloud platform, and if developer activity and ecosystem usage increase, market sentiment toward ICP could gradually improve. ICP first needs to stabilize above the $3–$4 region, which has repeatedly acted as a short-term ceiling during recovery attempts. A sustained move above this range would signal that buyers are slowly regaining control of the market. Once this zone is reclaimed, the next important resistance sits around $6–$8, an area where previous rallies in the past cycle lost momentum. Breaking this level would likely bring renewed investor interest and could open the door toward $12–$15, which historically acted as a major liquidity zone.

Internet Computer (ICP) Price Prediction 2026

If the broader cryptocurrency market enters another expansion phase and capital rotates back into infrastructure projects, ICP could gradually push toward $20–$27 by 2026, aligning with long-term recovery expectations.

However, the downside scenario should also be considered. If the market weakens or Bitcoin enters another prolonged correction, ICP could revisit $2–$2.20, which currently acts as the strongest long-term support zone. Losing this level could extend consolidation before a stronger recovery begins.

Overall, the 2026 outlook for Internet Computer remains cautiously optimistic. A combination of improving market liquidity, developer adoption, and stronger Web3 infrastructure demand could gradually help the asset rebuild its long-term value.

Internet Computer Crypto Price Prediction 2026 – 2030

YearPotential Low ($)Potential Average ($Potential High ($)
2026101827
2027142434
2028183045
2029254055
2030355070

Internet Computer Price Projection 2026

In 2026, Internet Computer  price could project a low price of $10, an average price of $18, and a high of $27

ICP Crypto Price Action 2027

As per the Internet Computer price Prediction 2027, Internet Computer   may see a potential low price of $14, The potential high for Internet Computer  price in 2027 is estimated to reach $34

Internet Computer Price Target 2028

In 2028, Internet Computer price is forecasted to potentially reach a low price of $18, and a high price of $45.

ICP Token Price Forecast 2029

Thereafter, the Internet Computer (ICP) price for the year 2029 could range between $25 and $55.

Internet Computer Price Prediction 2030

Finally, in 2030, the price of Internet Computer (ICP) is predicted to maintain a steady positive. It may trade between $35 and $70

Internet Computer Price Prediction 2031, 2032, 2033, 2040, 2050

Over the long term, the value of Internet Computer (ICP) will depend on Web3 adoption and the expansion of decentralized cloud services, which could support gradual growth across future market cycles.

YearPotential Low ($)Potential Average ($)Potential High ($)
2031406085
20324570100
20335085120
2040120185250
2050350520700

Internet Computer (ICP) Price Prediction: Market Analysis?

Year202620272030
Changelly$15$35$35
CoinCodex$18$42$50
WalletInvestor$20$38$45

CoinPedia’s Internet Computer Price Prediction

Coinpedia’s price prediction highlights that Internet Computer (ICP) appears to be entering a long-term accumulation phase following an extended correction period. If the project continues expanding its decentralized cloud ecosystem and attracts more developers building Web3 applications, the token could gradually regain market momentum.

In a favorable market environment, ICP could reach around $27 by 2026, while stronger adoption across decentralized infrastructure platforms could push the token toward $70 by 2030.

YearPotential Low ($)Potential Average ($)Potential High ($)
2026101827
Never Miss a Beat in the Crypto World!

Stay ahead with breaking news, expert analysis, and real-time updates on the latest trends in Bitcoin, altcoins, DeFi, NFTs, and more.

FAQs

What is Internet Computer (ICP) and what is it used for?

Internet Computer (ICP) is a layer-1 blockchain that lets developers build fully on-chain apps without traditional cloud servers.

What is the Internet Computer (ICP) price prediction for 2026?

ICP is projected to trade between $6 and $25 in 2026, depending on market momentum, support levels, and broader crypto sentiment.

How high can ICP price go by 2030?

If adoption of decentralized cloud platforms expands and crypto markets strengthen, ICP could potentially reach around $70 by 2030 in a strong growth cycle.

How much will ICP cost in 2035

Long-term models suggest ICP could trade between about $80 and $150 by 2035 if decentralized computing platforms gain wider adoption.

What will ICP be worth in 2040?

Long-term projections estimate ICP could range between roughly $120 and $250 by 2040, depending on Web3 adoption, developer activity, and broader crypto market growth.

What factors influence ICP price movements?

ICP’s price is influenced by market trends, developer adoption, token supply dynamics, network upgrades, and overall crypto sentiment.

Is ICP a good long-term investment?

ICP may suit long-term investors who believe in decentralized cloud computing, but price volatility means risk management is essential.

Hyperliquid Price Prediction: $680M Inflows and Falling Wedge Breakout Hint at $58 Target

Hyperliquid Unstakes 140K HYPE Tokens

The post Hyperliquid Price Prediction: $680M Inflows and Falling Wedge Breakout Hint at $58 Target appeared first on Coinpedia Fintech News

Hyperliquid price is gaining fresh momentum this week as the HYPE token trades near the $30 region, while nearly $680 million in capital inflows has entered the network. This surge in activity is now strengthening the broader Hyperliquid price prediction narrative among traders and analysts.

The rapid rise in liquidity, combined with strong protocol revenue and expanding derivatives trading activity, has pushed the decentralized trading platform into the spotlight across the crypto market.

With improving fundamentals and strengthening technical signals, traders are increasingly asking: Could Hyperliquid price rally toward the $55–$58 range in the coming weeks?

Hyperliquid Sees $680M Weekly Capital Inflows

One of the biggest catalysts supporting the current Hyperliquid price prediction outlook is the sharp increase in capital entering the ecosystem.

According to data from blockchain analytics platform Artemis, Hyperliquid recorded around $680 million in net inflows during the past week, making it the top-performing blockchain network in terms of capital growth during that period. 

Hyperliquid inflows

The platform outpaced several major ecosystems including Ethereum, Polygon, and Arbitrum, which followed behind in weekly inflows.

Large capital inflows typically indicate growing investor confidence and expanding liquidity, both of which tend to support stronger price momentum for network tokens. For derivatives-focused platforms like Hyperliquid, rising liquidity is particularly important because it improves market depth, trading efficiency, and platform usage. The latest inflow surge suggests that traders are increasingly viewing Hyperliquid as a rapidly growing infrastructure layer for decentralized derivatives trading.

Hyperliquid Price Analysis: Falling Wedge Breakout Signals Potential Rally

Hyperliquid price is beginning to show signs of a bullish reversal. The HYPE token had previously been trading inside a descending price structure, reflecting the broader consolidation phase seen across the crypto market in recent months.

Hyperliquid price prediction

However, recent price action indicates that Hyperliquid price is attempting to break out of a falling wedge pattern, a structure commonly viewed by analysts as a bullish reversal formation. Following the breakout attempt, the token is currently consolidating near the $30–$32 region, which is starting to act as an important short-term support zone. Immediate resistance sits around $32, a level that has capped several recent upward attempts. A strong breakout above this region could accelerate bullish momentum.

Based on the projected move from the wedge pattern, analysts are watching a potential upside target in the $55–$58 range, which would represent a major expansion if buying pressure continues.

Hyperliquid Leads Blockchains in Fee Generation

Another factor strengthening the Hyperliquid price outlook is the network’s rising protocol revenue. Recent data shows Hyperliquid generating approximately $1.7 million in fees within a single 24-hour period, making it the highest fee-generating blockchain during that timeframe.

The protocol managed to outperform several major networks including Ethereum, TRON, and BNB Chain, highlighting the scale of trading activity currently taking place on the platform.

Hyperliquid fees

In blockchain ecosystems, rising fee generation is widely considered a strong indicator of real network demand and user engagement. Higher fees typically reflect growing trading volume, deeper liquidity, and increasing adoption of the platform’s services. For Hyperliquid, this surge in protocol revenue suggests the platform is quickly evolving into one of the most actively used decentralized trading ecosystems in the crypto market.

Final Thoughts 

Hyperliquid is rapidly emerging as one of the fastest-growing ecosystems in decentralized derivatives trading. Strong capital inflows, rising protocol revenue, and expanding platform activity are reinforcing its long-term fundamentals. At the same time, Hyperliquid price is forming a bullish technical structure that could support further upside. If the token maintains support above the $30 zone and successfully clears the $32 resistance level, the current setup may evolve into the next major rally for the HYPE token.

FAQs

What is driving Hyperliquid’s recent price surge?

Hyperliquid’s price is rising due to $680M capital inflows, strong protocol revenue, and growing derivatives trading activity on the platform.

What is the current support and resistance for HYPE token?

HYPE token is consolidating near $30–$32, with $30 acting as support and $32 as immediate resistance for potential upside moves.

Why is rising protocol revenue important for Hyperliquid?

Higher revenue reflects growing trading volume, deeper liquidity, and increased platform adoption, supporting long-term token value.

Bitcoin Bottom Near? 5 On-Chain Signals Suggest the Bitcoin Price Bottom

Will Bitcoin Recover or Crash to $40K Next Analysts Can’t Agree

The post Bitcoin Bottom Near? 5 On-Chain Signals Suggest the Bitcoin Price Bottom appeared first on Coinpedia Fintech News

Bitcoin has entered March under heavy uncertainty. After weeks of volatile trading and macro-driven market pressure, Bitcoin price is hovering around the $70,000 region, leaving investors divided over whether the correction is over or if another drop lies ahead. Sentiment across the crypto market remains fragile, yet on-chain data is beginning to tell a different story. Several key metrics, many of which have historically appeared near major turning points, are now flashing signals that often emerge around a Bitcoin bottom or Bitcoin price bottom formation.

So the big question remains: Is the Bitcoin bottom already forming? Here are five on-chain signals suggesting the Bitcoin price bottom could be closer than many traders expect.

A Historic Bitcoin Exodus from Exchanges

One of the clearest signals pointing toward a potential Bitcoin bottom comes from exchange flow data. Nearly 31,900 BTC, worth around $3 billion, was withdrawn from exchanges in a single day, marking one of the largest outflow events seen this year.

Bitcoin exchange data

When Bitcoin leaves exchanges at this scale, it usually indicates investors are moving coins into long-term storage rather than preparing to sell. Reduced supply on exchanges often appears during accumulation periods when experienced investors begin positioning for future price appreciation.

Historically, large exchange outflows have appeared near Bitcoin price bottom zones, when institutional and long-term investors accumulate while market sentiment remains pessimistic.

Short-Term Holder Selling Signals Capitulation

Another important signal comes from short-term holder behavior, which often reflects emotional reactions to market volatility. Recent data shows that more than 27,000 BTC in profit was sent to exchanges by short-term holders, one of the largest readings in recent weeks. Most of these coins were accumulated between one week and one month ago, with a realized price near $68,000.

BTC STH DATA

Short-term holders typically react quickly to uncertainty, often selling during corrections. Historically, this type of selling pressure tends to appear near Bitcoin price bottom formations, when weaker hands exit the market.

Rather than signaling structural weakness, the activity may represent a classic capitulation phase, where reactive traders sell while long-term investors quietly accumulate.

Long-Term Holders Are Accumulating Again

Long-term holder behavior is widely considered one of the most reliable indicators of a Bitcoin bottom. On-chain data now shows that long-term holders are accumulating Bitcoin at the fastest pace since July 2025, ending nearly eight months of steady distribution.

BTC LTH DATA

This group typically consists of experienced investors who accumulate during undervalued periods and distribute near market peaks. Historically, when long-term holders shift from selling to aggressive buying, Bitcoin often enters a macro accumulation phase that precedes the next major rally. The recent shift suggests these investors may believe the market is approaching a Bitcoin price bottom zone

Inter-Exchange Flow Pulse Golden Cross Appears

Another signal comes from the Inter-Exchange Flow Pulse (IFP) indicator, which tracks Bitcoin movement between spot exchanges and derivatives markets.

BTC on chain

The indicator recently formed a golden cross, a signal that has historically preceded strong bullish phases in the Bitcoin market. Golden cross events in this indicator typically appear after extended consolidation or re-accumulation periods, suggesting market participants are shifting back toward spot accumulation rather than speculative derivatives activity. Analysts believe the signal could indicate that the current re-accumulation phase is nearing completion.

Bitcoin Holding the 2021 All-Time High Support

Bitcoin is currently trading near one of the most historically significant levels in its price structure, the 2021 all-time high region. This level has transitioned from major resistance into a long-term support zone, reinforcing the argument that the broader market structure remains strong despite recent corrections.

Bitcoin Price Bottom

Bitcoin price is also moving within a descending channel pattern, a formation that often appears during consolidation phases before bullish breakouts once selling pressure fades. If Bitcoin continues to hold above this region, analysts argue it could strengthen the case that the market is forming a macro Bitcoin price bottom, potentially laying the foundation for the next expansion phase of the cycle.

Final Words

Markets rarely confirm a bottom in real time, but several on-chain signals are beginning to align. Massive exchange outflows, renewed buying from long-term holders, and strong technical support near historic levels are patterns often seen around a Bitcoin bottom. While volatility may persist in the short term, the current data suggests Bitcoin could be stabilizing near a potential Bitcoin price bottom, with investors closely watching whether the market can defend key support levels in the coming weeks.

Why Crypto Market Is Down Today?

Crypto Market Crash Today Bitcoin Falls Below $66K, Ethereum and XRP Extend Losses

The post Why Crypto Market Is Down Today? appeared first on Coinpedia Fintech News

The crypto market is under pressure again after a brief recovery attempt earlier this week. Bitcoin had surged toward $73,000, sparking optimism that the broader market could regain bullish momentum heading into March. That optimism did not last long. As of March 7, the crypto market has turned lower again. Bitcoin has dropped toward $68,000, Ethereum price is trading near $1,976, and XRP has slipped toward $1.36.

The latest decline comes as traders react to a combination of macroeconomic shocks, including surging oil prices, a surprisingly weak U.S. jobs report, and a wave of leveraged liquidations across crypto derivatives markets. Together, these forces have pushed investors into a risk-off environment, explaining why the crypto market is down today.

Macro Shocks Hit Risk Assets

One of the major triggers behind the market decline is rising geopolitical tension in the Middle East. Concerns about disruptions in the Strait of Hormuz, a critical shipping route responsible for roughly 20% of global oil supply, have pushed energy markets sharply higher. As a result, Brent crude oil surged above $91 per barrel, marking a sharp weekly increase.

JUST IN: Brent crude oil price surges to $91, up 25% in the past 7 days. pic.twitter.com/2uXw8TyPK5

— Watcher.Guru (@WatcherGuru) March 6, 2026

Higher oil prices typically increase inflation pressure and reduce expectations of near-term interest rate cuts from central banks. When interest rates remain elevated, risk assets such as cryptocurrencies often face renewed selling pressure.

Weak U.S. Jobs Data Adds to Market Uncertainty

Another catalyst weighing on the crypto market is the latest U.S. labor market report. The February Nonfarm Payrolls report showed the U.S. economy lost roughly 92,000 jobs, a sharp miss compared with expectations for job growth. Meanwhile, the unemployment rate climbed to around 4.4%, signaling signs of a cooling labor market.

FEBRUARY U.S. JOBS REPORT

NONFARM PAYROLLS -92K, (Est. +55K) UNEMPLOYMENT RATE 4.4%, (Est. 4.3%)

The probability of a rate cut is rising pic.twitter.com/R23L5M4ZhC

— Couch Investor🛋 (@Couch_Investor) March 6, 2026

The weak data has increased fears of economic slowdown while inflation risks remain elevated due to rising energy prices. For crypto markets, which tend to react strongly to global liquidity conditions, the combination of slowing growth and persistent inflation has created additional uncertainty.

$302M Liquidations Accelerate the Crypto Sell-Off

The latest drop in prices has also been intensified by large liquidations across crypto derivatives markets. According to Coinglass data, more than $302.75 million in crypto positions were liquidated in the past 24 hours.

Bitcoin accounted for the largest share of liquidations at roughly $132.79 million, followed by Ethereum with about $63.73 million, while the remaining liquidations were spread across various altcoins.

Crypto Liquidations

Such liquidation cascades occur when leveraged traders are forced to close positions after prices move against them. This forced selling often amplifies market declines and increases volatility.

Bitcoin Price Analysis: Key Levels To Watch

After briefly touching $73,000 earlier this week, the BTC price failed to sustain its bullish momentum and has now retraced toward the $68,000 level. Technically, the $67,000–$68,000 region now represents a critical support zone. This area previously acted as a demand region during the recent consolidation phase and may determine the next direction for the market. If buyers manage to defend this level, Bitcoin could attempt a rebound toward $70,000 and $72,000. However, a decisive break below $67,000 could open the door for a deeper correction toward the $65,000 support level.

Ethereum Price Analysis: Can ETH Reclaim $2,200?

Ethereum has also moved lower alongside Bitcoin and is currently trading around $1,976, slipping below the important $2,000 psychological level.

The $1,850–$1,900 zone now acts as a key support range for Ethereum. If buyers manage to defend this area, the asset could attempt a recovery toward $2,080 and $2,200. However, if bearish pressure continues, ETH may revisit deeper support near $1,850, which previously served as a strong demand region.

XRP Price Analysis: What’s Next for XRP?

XRP is also experiencing mild downside pressure as the broader crypto market weakens. The token is currently trading near $1.36, consolidating after failing to extend its earlier recovery. The $1.30 level now represents a critical support level. If this zone holds, XRP could attempt another move toward $1.45 and $1.50. However, if Bitcoin continues to decline and broader market sentiment weakens, XRP could revisit the $1.20 support zone before buyers step in again.

FAQs

Why does geopolitical tension in the Middle East impact crypto?

Rising conflict, like in the Strait of Hormuz, fuels fear and volatility, causing investors to move away from risk assets like crypto.

Can rising interest rates affect Bitcoin and altcoins?

Yes. Higher rates make risk assets less attractive, often leading to declines in Bitcoin, Ethereum, and other cryptocurrencies.

What is a liquidation cascade in crypto markets?

When leveraged traders are forced to close positions due to price drops, it triggers further selling, amplifying market declines.

How do oil price surges influence crypto volatility?

Spiking oil prices raise inflation concerns and market risk, which can lead to short-term drops in Bitcoin and major altcoins.

❌