Something strange is happening with USDT, and it’s not the kind of shift traders and investors usually celebrate. On the surface, Ethereum’s USDT activity looks vibrant. Active addresses recently surged to 340,000, a level that normally screams strong network engagement.
But digging a little deeper and the story changes fast. This isn’t a speculative frenzy. Instead, it reflects a major pivot in how USDT is being used during the March 2026 Hormuz Crisis.
As geopolitical tensions disrupt traditional banking rails, stablecoins have quietly stepped in to fill the gap. Cross-border payments, emergency transfers, and quick settlements in fiat are increasingly happening through stablecoin rails rather than banks. In other words, the token that once fueled exchange trading desks is now doing something far more practical. And that shift is draining liquidity from where markets need it most.
USDT Leaves Exchanges as Users Build Private War Chests
The imbalance is striking. Exchange data shows elevating withdrawal transactions, compared with declining depositing transactions with recent just 11,000 deposits recorded. Users aren’t simply trading less; they’re actively pulling funds into private custody wallets or may be in fiat.
Why? Because when geopolitical instability enters the equation, trust becomes fragile.
Investors appear to be prioritizing self-sovereign storage over the perceived risks of leaving assets on centralized platforms. In uncertain environments, holding funds directly often feels safer than relying on an exchange infrastructure tied to global financial systems. So while wallets are filling up, exchange reserves are shrinking.
Well, here’s the uncomfortable part. Exchange-side stablecoin reserves have dropped in last three months and in march it fell more to $50.6 billion, leaving noticeably less liquidity sitting on order books. Markets rely heavily on stablecoins like USDT as the settlement layer for trades.
When those reserves shrink, the cushion that normally absorbs large sell orders gets thinner. And thin markets behave differently.
Without a deep pool of liquidity, even moderate liquidations can cause sharp price slippage. Moves that would normally be absorbed quietly by order books suddenly ripple across the market. In other terms, the engine is still running but the oil level is dropping.
Prolonged Hormuz Crisis Could Intensify USDT Liquidity Drain
That said, if the Strait of Hormuz blockade continues the global crisis will worsen and that could lead to rise in withdrawal of stablecoins. As long as global banking routes remain delayed or uncertain, USDT will likely continue functioning as a fast settlement layer outside the traditional financial system.
That creates a tricky environment for crypto markets. With less stablecoin liquidity available on exchanges, major assets from BTC and ETH to XRP could face increased vulnerability to volatility-driven swings. In that scenario, a routine correction could turn into something deeper simply because the usual buying power isn’t sitting on platforms ready to stabilize prices.
And right now, the shrinking exchange reserves suggest one thing: USDT isn’t just moving around the market, it’s quietly leaving it.
The Bitcoin price might look calm on the surface, but beneath that quiet chart is a familiar cocktail of fear, speculation, and historical pattern-chasing. And right now, the ingredients look oddly familiar.
Fresh on-chain data shows the percentage of coins sitting on exchanges has fallen to its lowest level since November 2017. That’s a long time in crypto years back when the market was still discovering what a parabolic rally even looked like. Since then, the industry has gone through bans, crashes, and full-blown institutional adoption phases. Yet here we are again, staring at supply metrics that resemble the early days of a major cycle shift.
The BTC/USD market may not be screaming bullish yet, but the structural signals are starting to whisper.
Exchange Supply Shrinks as Long-Term Holders Pull Coins Away
Tracked wallet data from santiment insights, it shows exchange balances dropping to an eight-year low, meaning fewer coins are readily available for trading. Historically, declining exchange supply tends to reduce immediate selling pressure. It doesn’t guarantee a rally, but it does tighten the available float.
This shift has been quietly developing while the Bitcoin price chart stabilizes. It’s not dramatic and no fireworks yet but it’s a structural change worth watching. Because when supply tightens in crypto, things can move fast.
Historical Cycle Panic Often Appears Right Before Massive Expansion
Now here’s where the narrative machine kicks in. Cycle watchers are pointing to a recurring pattern that begins with panic. In 2013, a market shakeout was followed by a staggering 24,000% expansion. A similar fear-driven phase appeared in 2016, eventually leading to a 6,300% move. Even the 2020 cycle started with panic before delivering an 842% surge.
The idea is simple: each cycle begins with doubt before momentum takes over. And now, in 2026, some observers argue the same psychological setup is forming again. Cycles may compress over time, but the emotional pattern which shows fear first, rally later has remained surprisingly consistent.
Well, despite many bullish things circulating major onchain metrics still doesn’t give the green light yet.
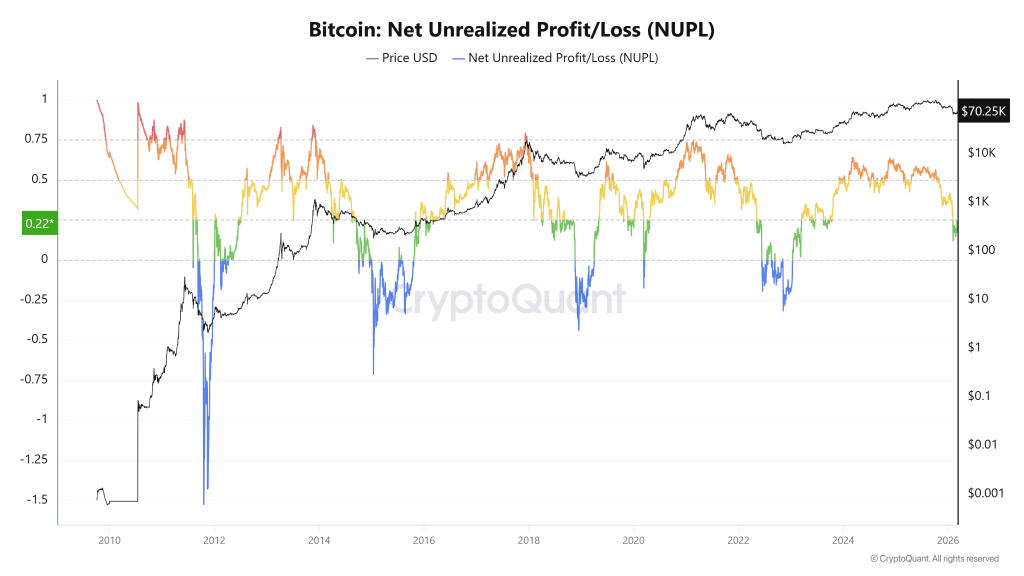
One of the most widely watched on-chain indicators the Net Unrealized Profit/Loss (NUPL) still hasn’t flashed the classic bottom signal. Historically, major market recoveries began when the metric dipped below zero, signaling widespread unrealized losses across the network.
Right now, it’s still above that level. That doesn’t invalidate the bullish narrative. It just means the market hasn’t yet entered the deep capitulation zone that typically precedes a strong reversal.
In short: the setup looks intriguing, supply dynamics are tightening, and historical cycle patterns are being dusted off once again. But until on-chain signals like NUPL confirm a deeper reset, the Bitcoin price may still be navigating the uneasy middle ground between fear and recovery.
TRUMP memecoin cools near $5.66 as election hype fades, but 2026–2030 price predictions show potential surges toward $69.90 amid rising crypto and political momentum.
TRUMP token forecast signals major volatility ahead, with 2026 lows at $5 and highs up to $11.20 as memecoin trends, DeFi adoption, and political narratives drive demand.
OFFICIAL TRUMP (TRUMP), the political-themed memecoin linked to U.S. President Donald Trump, has become one of the most watched and volatile tokens in the market.
Its sharp rise in 2025 was driven by election hype, strong celebrity support, and massive social media attention. This pushed TRUMP into the spotlight as a cultural trend, not just another cryptocurrency.
So, let’s dive deep into our in-depth analysis of TRUMP Price Prediction 2026–2030, to find out what’s coming for the investors.
The TRUMP asset has seen declining interest, but recent efforts, like the new game launching on the App Store, are starting to make a difference. The “Trump Billionaire Game” is set to hit the Apple Store on May 5, 2026, and could help revitalize the asset this year after the struggles of 2025.
Moreover, the Q1 was stretched in a downtrend, but March showed a spike now price staying close to the upper boundary of a falling wedge pattern. If demand increases, we can expect a rebound to $6 in March. However, if demand doesn’t pick up, prices may drop further.
Trump Price Prediction 2026
In 2025, the TRUMP token did not appear to be a dead asset, particularly with the announcement of the “Trump Billionaire Game,” which added a utility aspect beyond its initial memecoin status. The launch is scheduled for May 5th, 2026, on the Apple Store.
However, the outlook for 2026 is complicated by the 2025 market performance, where bulls struggled significantly against robust bearish sentiment. This dynamic reflects the speculative and often volatile nature of TRUMP’s price movement throughout 2025.
As we look forward to the possibilities that 2026 may bring, particularly with Donald Trump’s ongoing influence in the political arena, the potential for adoption is indeed compelling. On the price front, the weekly chart showcases an intriguing setup; we’ve recently seen a demand coming back, and March showed a spike with recent claims of the top holder of Trump to be invited for a dinner with Trump, fueled short-term hype, but whether it will trigger a momentum remains a mystery.
The price pattern indicates a falling wedge, reflecting a tightly compressed trading range, much like a coiled spring ready to unleash its energy and TRUMP at its top border making the pattern more interesting.
Given this technical formation, a rebound appears likely. If bullish momentum emerges in rest of Q1 2026, it will be crucial to monitor the $5.50 resistance level. A decisive breakout above this level could signal a significant rally, potentially advancing toward $8.50 as the uptrend unfolds and could extend to $16 if demand remains stable.
Year
Potential Low ($)
Potential Average ($)
Potential High ($)
2026
$3
$18
$26
Trump Coin On-Chain Analysis
The Santiment data for the TRUMP token reveals a significant shift in holder dynamics through early March 2026. While mid-sized “shark” wallets (yellow) are aggressively accumulating, the largest whale tier (red) shows more cautious, fluctuating interest. This indicates retail-to-mid-tier conviction is currently driving the momentum over massive institutional-scale positioning.mem
TRUMP Price Prediction 2026 – 2030
Year
Potential Low ($)
Potential Average ($)
Potential High ($)
2026
$5.00
$7.10
$11.20
2027
$6.05
$12.65
$18.90
2028
$8.20
$18.20
$27.50
2029
$12.40
$28.10
$44.80
2030
$18.10
$45.10
$69.90
TRUMP Price Prediction 2026
By 2026, the value of a single OFFICIALTRUMP coin price could reach a maximum of $42.00, with a potential low of $14.00. With this, the average price could land at around the $28.00 mark.
TRUMP Price Prediction 2027
Looking forward to 2027, the TRUMP coin Price may range between $21.00 and $42.00, and a potential average value of around $63.00.
TRUMP Price Prediction 2028
The Trump price could achieve the $94.25 milestone by the year 2028. However, the viral memecoin could record a low of $31.50 and an average price of $62.00 if the crypto market turns bearish.
TRUMP Price Prediction 2029
During 2029, the TRUMP crypto could reach a maximum trading value of $141.50 with a potential low of around $88. Evaluating the market sentiments, the average price of this altcoin could settle at around $94.50.
TRUMP Price Prediction 2030
The TRUMP memecoin crypto prediction for the year 2030 could range between $70.75 to $212.25. Considering the buying and selling pressure, the average price could be around $141.50 for that year.
What Does The Market Say?
Firm Name
2025
2026
2030
Mudrex
$60
$100
$600
Icobench
$100
$150
$500
Binance
$13.93
$14.63
$17.78
CoinPedia’s TRUMP Price Prediction
According to CoinPedia’s analysis, TRUMP could recover from its 2025 decline if strong social buzz returns. As per our price outlook, renewed interest in political-themed tokens may help TRUMP climb toward a possible $11.58.
However, if the market turns cautious, the token may drop back toward $5.0 before finding stable support.
Year
Potential Low ($)
Potential Average ($)
Potential High ($)
2026
$5.0
$7.18
$11.58
Never Miss a Beat in the Crypto World!
Stay ahead with breaking news, expert analysis, and real-time updates on the latest trends in Bitcoin, altcoins, DeFi, NFTs, and more.
FAQs
What is the TRUMP token and why is it gaining popularity?
The TRUMP token is a political-themed memecoin that surged due to election buzz, celebrity attention, and strong community hype.
What is the TRUMP price prediction for 2026?
Analysts expect TRUMP to trade between $5.00 and $11.20 in 2026, depending on market liquidity, sentiment, and political momentum.
Can the TRUMP token reach $20 by 2028?
Yes, if market demand rises, TRUMP could test the $20 zone by 2028 as memecoins mature and investor interest strengthens.
What could drive TRUMP’s price higher by 2030?
Community activity, strong market cycles, and sustained interest in political tokens may push TRUMP toward higher long-term levels.
Sei (SEI) remains in a bearish trend in 2026, with price approaching the $0.020 demand zone. A strong rebound could push SEI back toward $0.10–$0.20 by year-end.
Long-term projections remain bullish for Sei, with analysts forecasting steady growth that could push SEI toward the $1.26–$1.45 range by 2032.
Originally recognized as the first sector-specific Layer 1 blockchain, Sei has evolved into a powerhouse of parallelized execution. While its initial mission focused on optimizing decentralized exchanges (DEXs), the 2024-2025 “V2” upgrade transformed Sei into the Parallelized EVM. This pivot allowed the network to combine the vast developer ecosystem of Ethereum with the blazing-fast performance typically reserved for non-EVM chains like Solana.
As we move through 2026, the network is undergoing its most ambitious technical overhaul yet: the Sei Giga upgrade. By implementing the “Autobahn” consensus and asynchronous execution, Sei aims to support over 200,000 transactions per second with sub-400ms finality. From institutional real-world asset (RWA) tokenization to high-frequency gaming and AI-agent economies.
Planning on investing in this crypto project but concerned about its prospects? Fear not and scroll down, as in this article, we have uncovered the market trends of SEI price prediction from 2026 up until 2032.
The 2026 outlook for Sei (SEI) indicates a continuing downtrend. In the first quarter, it failed to maintain support at $0.10 and is currently forming a falling wedge pattern. It is nearing the $0.020 demand zone, where a potential reversal could push prices back up to $0.10 or even $0.20. In a bullish scenario, there is a possibility of retesting $0.30 by the end of the year.
Sei (SEI) Price Prediction March 2026
In January, the SEI price dropped below $0.100, hitting a low of $0.064 in late February. If it fails to hold the $0.060 to $0.064 support range in March, it could decline further to $0.040 or $0.020.
However, if it maintains this support, the price might recover to the $0.10 to $0.12 range, aligning with the long-term falling wedge pattern.
Recent News/Updates
Sumvin, Inc. officially launched on February 26, 2026, utilizing Sei’s sub-second finality for AI-powered financial execution.
Coinbase Markets announced on February 27th that Sei will transition from Cosmos-based transactions to an EVM-only architecture. They will be facilitating this migration to the Sei EVM, which will take place from April 6-8, 2026.
Sei (SEI) Price Prediction 2026
The technical outlook for Sei (SEI) in 2026 reflects a challenging macroeconomic trend defined by a persistent descending structure. Looking back at the weekly chart, 2024 was marked by two significant but ultimately capped rallies: an explosive surge to the $1.00 mark in the early months, followed by a secondary peak near $0.70 late in the year 2024. Both movements highlighted intense bearish pressure, as sellers consistently utilized these rallies to exit positions, effectively constraining the price within a tightening range.
This market structure deteriorated further in 2025 when the SEI price failed to hold the critical $0.30 demand zone. The breakdown confirmed that the SEI asset had abandoned traditional horizontal support levels and is favoring a massive falling wedge pattern.
This technical formation has been dictated by three clear resistance touches, the most recent occurring in September 2025. While analysts initially hoped the early 2023 demand floor would exhaust the selling pressure, the first quarter of 2026 saw a continuation of the slide, with the price slipping beneath the psychological $0.10 support area.
Current price action suggests that the SEI price is now gravitating toward the lower boundary of the falling wedge. This decline is expected to persist through mid-2026 until the price meets the primary demand area situated around the $0.020 mark. This level represents a deep value zone where selling exhaustion is highly probable.
If buyers successfully defend this floor, the resulting spike in demand could ignite a trend reversal, potentially driving the SEI token price back toward the $0.10 and $0.20 levels. Under a highly bullish recovery scenario, a retest of the $0.30 breakdown point remains a possibility before the year concludes.
Sei (SEI) Long-Term Price Projections: 2027 – 2032
Year
Minimum Price ($)
Maximum Price ($)
Average Price ($)
2027
0.2450
0.2940
0.2500
2028
0.3550
0.4260
0.3650
2029
0.5240
0.6190
0.5350
2030
0.7850
0.9050
0.8060
2031
0.8900
1.1000
0.9950
2032
1.2600
1.4500
1.3210
Sei (SEI) Price Prediction 2027
The SEI price forecast maintains an upward climb throughout 2027. Market analysts project the SEI token will fluctuate between $0.2450 and $0.2940, centering on an annual average SEI/USD price of $0.2500.
Sei Crypto Price Prediction 2028
Growth is expected to accelerate in 2028 as ecosystem maturity attracts deeper liquidity. SEI crypto price is projected to trade within a bullish corridor of $0.3550 to $0.4260, maintaining a robust year-round average of $0.3650.
SEI Token Price Prediction 2029
By 2029, SEI token’s price movements are anticipated to reach a significant peak of $0.6190. On the lower end, strong support is expected at $0.5240, leading to a projected average trading cost of $0.5350.
SEI Price Prediction 2030
Entering the new decade, SEI Crypto’s valuation is expected to be driven by global market recognition. Projections suggest a price range of $0.7850 to $0.9050, with an expected average price of $0.8060.
SEI/USD Prediction 2031
The bullish momentum continues into 2031, with the high target set at $1.1000. While retracements may dip toward $0.8900, the overall market equilibrium is expected to sit near $0.9950.
Sei (SEI) Price Prediction 2032
Based on current expert modeling, 2032 represents a major milestone for the token. SEI is estimated to range between $1.2600 and $1.4500, with an average valuation of $1.3210.
Never Miss a Beat in the Crypto World!
Stay ahead with breaking news, expert analysis, and real-time updates on the latest trends in Bitcoin, altcoins, DeFi, NFTs, and more.
FAQs
What will the SEI price be in 2026?
Analysts expect SEI to trade between $0.02 and $0.30 in 2026. A rebound from the $0.02 demand zone could push the token back toward $0.10–$0.20 if buying momentum returns.
What is the SEI price prediction for 2027?
Market forecasts suggest SEI may trade between $0.245 and $0.294 in 2027, with an average price near $0.25 as adoption and ecosystem growth continue.
What is the Sei Coin price prediction for 2030?
Market projections suggest SEI may trade between $0.78 and $0.90 by 2030, with an average around $0.80, assuming steady adoption and favorable crypto market trends.
What Is Sei crypto price prediction for 2040?
If adoption continues to grow, long-term projections suggest SEI could potentially exceed $3–$5 by 2040, driven by institutional use, DeFi expansion, and network upgrades.
Is SEI a good investment for long term?
SEI shows strong long-term potential due to its high-speed blockchain, EVM compatibility, and DeFi ecosystem, but investors should still consider crypto market risks.
The XLM price has quietly staged a recovery this week, climbing toward the $0.163 level after printing a string of bullish daily candles. It’s not exactly a moonshot but it’s a clear shift in tone compared to the sluggish price action seen earlier.
Momentum has been building since the start of the week, and the latest move on the XLM/USD pair suggests buyers are beginning to reclaim some control.
Still, crypto markets rarely move in straight lines. And beneath the surface, there are a few signals that make the rally look… a bit complicated.
XLM Price Chart Shows Buyers Regaining Control Above Neutral RSI
Starting with the technicals, we can witness indicators on the daily XLM price chart, like the RSI has pushed above the key neutral threshold, currently sitting at 53.44. That move might not sound dramatic, but it matters. Crossing the 50 line typically signals that momentum has shifted back toward buyers.
In other words, bullish traders are finally showing up again. Meanwhile, the CMF indicator remains slightly negative at -0.09. But, it’s trending upward from previous lows. That suggests capital outflows are slowing down, even if inflows haven’t fully taken over yet.
Put those signals together and the picture becomes clearer: selling pressure is fading while demand is gradually returning. Not explosive, but constructive.
Social Metrics Spike As Community Interest Returns To Stellar
Well, here’s where things start getting noisy. On-chain data from Santiment shows a sharp increase in Social Volume and Social Dominance for Stellar crypto. Both metrics have surged alongside the price rally, hitting their highest levels since mid-February.
And that’s rarely a coincidence. When social engagement spikes at the same time as price momentum, it often means the market narrative is shifting. Retail traders are paying attention again, discussions are heating up, and sentiment starts turning.
That doesn’t guarantee sustained gains but it definitely fuels short-term momentum. In this case, the rising chatter appears to be amplifying the ongoing recovery.
But let’s not pretend everything is perfectly bullish. Because while retail participation seems to be rising, whale behavior tells a different story. The Whale vs. Retail Delta currently shows a negative reading of -14.840, indicating that large holders may be distributing into the strength created by smaller traders.
That kind of divergence tends to complicate rallies. It suggests the current move may be more of a retail-led relief bounce rather than the start of a full-scale trend reversal. For the momentum to evolve into something more durable, whale activity would likely need to stabilize rather than lean toward selling.
Now for the fundamental catalyst behind the excitement. A recent announcement from Stellar leadership highlighted a new development involving Akuna Wallet, a payments platform designed to serve African creators. The wallet has been admitted into the Bank of Ghana’s VASP regulatory sandbox, marking a step toward regulated experimentation within the region.
The payments system hasn't kept pace with African creators. @AkunaWallet is. Proud to be building this alongside Idris Elba and the whole team. https://t.co/ZVzcLuD9u9
And there’s a direct link to the network itself. Akuna Wallet is built on the Stellar blockchain, meaning any growth in the platform could translate into increased usage of the ecosystem.
That’s the narrative currently feeding optimism in the market. Adoption potential, rising social interest, and improving technical momentum are all colliding at once. Whether that’s enough to sustain the rally remains to be seen but for now, the XLM price appears to be enjoying the spotlight again.
The SUI price is back at a level traders have been staring at for weeks. After grinding through a long stretch of consolidation since February, the token has climbed to around $1.05, a range that now acts as a decisive resistance on the daily chart.
And markets love moments like this. Because when price reaches the upper boundary of consolidation, something usually gives either momentum explodes higher, or the rally runs out of steam.
Right now, the SUI/USD pair appears to be leaning toward the former. Since Monday, the asset has shown steady bullish momentum, with today’s move pushing price up nearly 10% intraday.
So naturally, attention is turning to what happens next.
SUI Price Breakout Attempt From Months of Consolidation
The current level isn’t random. On the SUI price chart, the $1.05 zone represents the upper border of a consolidation range that has held the market in check for months.
Break that barrier convincingly and things could escalate quickly. From a purely technical standpoint, two immediate levels stand out on the radar: $1.60 and $2.00. These are the nearest targets traders are watching if the resistance flips into support.
But let’s be clear, resistance zones don’t surrender easily. Markets often test them multiple times before committing to a breakout. Still, momentum building throughout the week has given bulls a reason to stay optimistic.
Weekly Falling Wedge Support Adds Technical Strength
The current setup gets more interesting. As the recent upward move didn’t appear out of nowhere. It actually started from a weekly chart dynamic support, specifically the lower boundary of a falling wedge pattern.
When price rebounds from the lower border of such a formation, it tends to signal growing demand at discounted levels. That seems to be exactly what happened here.
The bounce from that support zone helped push price back toward the top of the consolidation range, placing the market in a crucial decision phase. Demand continues to build or it doesn’t.
Of course, price charts alone rarely tell the entire story. On-chain data is starting to echo the same bullish tone. Daily transaction activity has risen over the past seven days, signaling that network participation is gradually picking up again.
That type of activity matters because sustainable rallies typically require more than just speculative trading. They need real usage, or at least the perception of it.
And the timing of today’s move adds another layer. The nearly 10% intraday surge coincided with the launch of OpenZeppelin Move Contracts on Sui Network. The same security library that has protected over $35 trillion in on-chain value across the broader crypto ecosystem is now available for Sui developers.
OpenZeppelin Move Contracts are now live on @SuiNetwork
The same library securing over $35 trillion in onchain value and trusted by the industry's most critical protocols is now purpose-built for Sui.
That’s not exactly a small headline. So now the SUI price analysis highlights that the market sits at a familiar crossroads. If demand continues to rise and resistance breaks with conviction, the next chapter for the SUI price could involve a much faster climb than the slow grind traders endured since February.
Price prediction for 2026 targets $0.85, with potential highs of $3.50.
The Pi coin price forecast for 2030 highlights a price target as high as of $22.00
Pi Network’s vision of mobile-based crypto mining attracted millions worldwide, making it a standout community-driven project. However, its lack of exchange listings, limited liquidity, and minimal real-world integration now challenge its sustainability.
As the broader crypto landscape shifts toward utility-based projects and DeFi innovation, Pi Coin struggles to maintain relevance. As a reason, the PI price faced a seamless fall. While social and Google search curiosity still remains high, especially with growing searches like “1 Pi to INR” and “1 Pi to PKR,” the absence of strong fundamentals keeps Pi price recovery uncertain.
This is leaving investors questioning whether this once-hyped token can ever reclaim its lost glory. As a result, the current period aligns perfectly with the current year’s calendar to change soon, making people intrigued towards the PI price prediction for 2026-2030.
Pi’s price declined from $0.19 to $0.28 in Q4 2025, then to $0.1297 in January, indicating strong bearish sentiment. But this low was followed by short-term demand driven by ecosystem-level demand and the Kraken exchange listing, leading to an increase above $0.28 in March.
However, the overall recovery prospects for PI/USD in 2026 remain bleak due to low liquidity in the crypto market. Still, if the broader market improves, there may be an opportunity for Pi to rally more in March and recover some of its lost value, but $0.28 needs to be sustained.
PI Price Prediction 2026: Potential Scenarios for a Reversal
Pi’s price was firmly within its current consolidation range of $0.19-$0.28 in Q4 2025, but in January, it failed to trade within this range, hitting a new low of $0.1297.
This means momentum was completely on the bearish side, and PI investors were dumping like they had no chance of ever recovering. Investors and traders assumed it had become a dead asset for now, considering it worse than memecoins.
Since the PI price prediction for 2026 still shows no significant improvement in the long term, after a devastating decline, a short-term momentum in February and march was observed that saw PI price beyond $0.28.
Now, at this stage, when PI price is at its weakest long-term levels, but the short-term rally suggests a recovery chance, as few ecosystem updates were announced on X in early March along with an exchange listing from Kraken, which boosted this surge. Since it came with a new plan to revive its ecosystem, this strong possibility could turn around the dying momentum it’s was seeing till now.
Despite the challenges faced in December 2025 and since then, when the bear market suppressed momentum across the entire crypto sector, we’ve observed that no altcoin has managed to stage the anticipated rally. This was largely due to a lack of liquidity, with new investors still cautious, leaving many feeling apprehensive about the power of the bears.
However, the outlook for 2026 is optimistic for the sector, and if it flourishes, maybe PI could get a few more drops of liquidity, too. but if the broader market improves, the odds of a substantial rally may increase but key here is flipping $0.28 with confidence.
Pi Coin Price Targets 2026 – 2030
Year
Potential Low ($)
Potential Average ($)
Potential High ($)
2026
$0.85
$2.25
$3.50
2027
$1.25
$3.25
$5.25
2028
$2.00
$5.50
$8.50
2029
$3.50
$8.50
$13.75
2030
$5.50
$13.75
$22.00
Pi Crypto Price Forecast 2026
The Pi crypto prediction for the year 2026 could range between $0.85 to $3.50. Considering the buying and selling pressure, the average price could be around $2.25 for that year.
Pi Coin Price Prediction 2027
During 2027, the Pi network value could reach a maximum trading value of $5.25 with a potential low of $1.25. Evaluating the market sentiments, the average price of this altcoin could settle at around $3.25.
Pi Token Price Projection 2028
By 2028, the value of a single Pi coin price could reach a maximum of $8.50 with a potential low of $2.00. With this, the average price could land at around the $5.50 mark.
Pi Network Price Analysis 2029
Looking forward to 2029, the Pi coin Price may range between $3.50 and $13.75, and a potential average value of around $8.50.
Pi Network Price Prediction 2030
As per our Pi Coin Price Prediction 2030, the Pi coin value in 2030 could reach a high of $22.00. However, the viral altcoin could record a low of $5.50 and an average price of $13.75, if the crypto market turns bearish.
Market Analysis
Firm Name
2025
2026
2030
CoinCodex
$ 2.08
$ 1.48
$ 2.63
priceprediction.net
$1.08
$1.61
$6.74
DigitalCoinPrice
$107.98
$125.57
$265.95
*The aforementioned targets are the average targets set by the respective firms.
Conclusion
The Pi Network’s recent developments—from major token accumulation and Banxa integration to Binance listing rumors—are clear indicators that Pi is no longer just a test project. As market conditions turn favorable and institutional interest grows, Pi Coin is entering a new phase of maturity.
Never Miss a Beat in the Crypto World!
Stay ahead with breaking news, expert analysis, and real-time updates on the latest trends in Bitcoin, altcoins, DeFi, NFTs, and more.
FAQs
Will Pi Network price recover in 2026?
Pi may recover in 2026 if liquidity improves, exchange listings expand, and overall crypto market sentiment turns bullish.
What is the Pi price prediction for 2026?
Pi price prediction for 2026 suggests a range between $0.85 and $3.50, depending on adoption progress and market momentum.
Can Pi Coin reach $1 again?
Yes, Pi can reach $1 if buying demand strengthens and the token breaks out of its long-term consolidation range.
What is the Pi Network price prediction for 2030?
Pi Network price prediction for 2030 targets a potential high near $22.00 if ecosystem growth and real-world utility improve.
Is Pi Coin a good long-term investment?
Pi carries high risk due to limited utility and listings, but long-term upside depends on successful integration and network adoption.
Price predictions for 2026 range from $0.45 to $3.00.
Curve Dao (CRV) could extend toward $8.00 by 2030, if recovery structure holds.
In the Decentralized Finance (DeFi) world, Curve DAO is known for its sophisticated Automated Market Maker (AMM) that redefined stablecoin liquidity. By utilizing non-custodial smart contracts to minimize slippage and trading costs, the protocol offers a seamless, permissionless environment for both traders and liquidity providers. At its core is the CRV token, a powerhouse of utility that drives governance and rewards through its unique staking architecture.
However, with the CRV price currently trading 98% below its all-time high, the protocol stands at a critical crossroads. As the market pivots toward more sustainable yield models and enhanced capital efficiency, investors are asking: Can Curve’s deep-rooted infrastructure spark a massive recovery? This analysis dives into the fundamental shifts within the Curve ecosystem and provides a comprehensive long-term Curve DAO (CRV) price prediction 2026-2030 to determine if CRV can recapture its former dominance in the next bull cycle.
Based on the daily chart, the CRV price has entered a period of relative calm following a difficult start to the year. After losing the $0.34 level in January, the downward momentum persisted through February. However, as of March 2026, the price action has shifted into a tight range consolidation, signaling that the aggressive selling phase may be transitioning into a neutral state.
This current behavior mirrors the price action observed during the second half of 2024. During that period, CRV/USD remained trapped within a narrow range, defined by squeezed Bollinger Bands, for several months. That extended phase of sideways movement served as a necessary cooling-off period before the market eventually ignited a massive rally toward $1.33 in November 2024.
The technical patterns currently emerging suggest that the first quarter of 2026 has successfully placed CRV back into a primary “buy zone.” We are likely seeing the start of a multi-month accumulation phase. From March onwards, the price will likely remain engulfed in this consolidation as supply is absorbed, setting the stage for a potential breakout once the market builds sufficient energy.
Recent News / Opinions
On March 6th, Curve Finance publicly addressed PancakeSwap regarding an alleged license violation, claiming their code was used without permission. Curve cautioned that such actions are historically unwise and illegal, yet extended an olive branch by offering formal licensing and expertise to ensure user safety and legal compliance.
On February 4th, River announced an integration with Curve Finance to deepen satUSD liquidity. This partnership establishes a crvUSD-satUSD stable pool, allowing 1:1 swaps via the River module. The collaboration positions satUSD as a core DeFi primitive, leveraging Curve’s efficient AMM infrastructure to streamline stablecoin routing across the ecosystem.
Curve Dao (CRV) Price Prediction 2026
Based on the weekly chart, the CRV/USD pair has faced a grueling period for long-term investors. Since losing the critical $1.90 support level in 2022, the price action has been overwhelmingly pessimistic, dominated by a persistent bearish trend. This multi-year underperformance eventually saw the asset bottom out near the $0.18 mark by 2024, as sellers maintained a firm grip on the market.
While late 2024 brought a wave of broader market optimism that lifted CRV, the recovery lacked the strength to challenge its former glory. The momentum stalled prematurely near $1.33, failing to even revisit the $1.90 threshold. This rejection led to a full retracement, with the price drifting back down to the $0.18 demand zone throughout 2025 and now stretching even in the first quarter of 2026.
Despite this sluggish history, there are emerging signs of a potential bottom. Weekly volume is beginning to fade, suggesting that selling pressure around the $0.18 area may finally be waning. Furthermore, the weekly Bollinger Bands are currently shrinking, that are mirroring the setup seen before the late 2024 pump, with the lower band providing a technical turning point from the existing demand zone.
If a fresh influx of demand enters the market, the odds favor a recovery attempt. A successful bounce from this floor would likely see CRV target a retest of the $1.00 psychological level. If bulls can sustain that momentum, a move back toward the $1.33 resistance and a long-awaited retest of the $1.90 level could become a reality.
Curve Dao Crypto Price Prediction 2026 – 2030
Year
Potential Low ($)
Potential Average ($
Potential High ($)
2027
1.50
2.00
4.50
2028
2.10
4.10
6.00
2029
3.40
6.00
7.20
2030
4.80
6.50
8.00
Curve Dao Price Forecast 2027
As per the Curve Dao Price Prediction 2027, Curve Dao may see a potential low price of $1.50 . Meanwhile, the average price is predicted to be around $2.00. The potential high for Curve Dao price in 2027 is estimated to reach $4.50.
Curve Dao (CRV) Price Prediction 2028
In 2028, Curve Dao price is forecasted to potentially reach a low price of $2.10 and a high price of $6.00.
CRV Price Prediction 2029
Thereafter, the Curve Dao (Curve Dao) price for the year 2029 could range between $3.40 and $7.20.
Curve Dao Price Prediction 2030
Finally, in 2030, the price of Curve Dao is predicted to maintain a steady positive. It may trade between $4.80 and $8.00.
Curve Dao Price Prediction 2031, 2032, 2033, 2040, 2050
The long-term projection assumes Curve Dao sustains relevance in enterprise blockchain use cases, with growth moderating over time as the asset matures.
Year
Potential Low ($)
Potential Average ($)
Potential High ($)
2031
5.20
7.40
9.00
2032
6.00
8.60
10.80
2033
7.00
11.50
13.50
2040
19.00
25.00
32.00
2050
35.00
48.00
70.00
Curve Dao (CRV) Price Prediction: Market Analysis?
Year
2026
2027
2030
Changelly
$2.40
$3.80
$6.50
CoinCodex
$1.90
$3.50
$7.00
WalletInvestor
$2.00
$3.60
$6.40
CoinPedia’s Curve Dao Price Prediction
Curve Dao Price has fallen from a high of $1.33 late in 2024 and into 2025, and even into Q1 2026, but most importantly, it fell back to $0.18 through early 2026, which supported the late 2024 rally. Signs of a bottom are emerging, with decreasing selling pressure. If demand increases, the CRV price could target $1.00 and potentially retest $1.33 and $1.90 by the end of 2026.
Never Miss a Beat in the Crypto World!
Stay ahead with breaking news, expert analysis, and real-time updates on the latest trends in Bitcoin, altcoins, DeFi, NFTs, and more.
FAQs
What is the Curve DAO Token (CRV) used for?
Curve DAO Token (CRV) is used for governance, staking, and boosting rewards on Curve Finance, a leading DeFi protocol for low-slippage stablecoin trading.
What is the Curve DAO price prediction for 2026?
Curve DAO price prediction for 2026 suggests CRV may trade between $0.45 and $3.00 if long-term support holds and DeFi demand improves.
What is the CRV price prediction for 2030?
CRV price prediction for 2030 estimates a range between $4.80 and $8.00 if Curve continues serving as key liquidity infrastructure in DeFi.
What factors will influence Curve DAO price long term?
CRV’s long-term price depends on DeFi adoption, stablecoin growth, protocol revenue, governance activity, and broader crypto market cycles.
The live price of the Zilliqa crypto token is $ 0.00422334.
Zilliqa’s price could move toward $0.045 if the recovery structure develops.
Broader adoption may support a long-term rise toward $0.20.
Zilliqa is a high-performance, public blockchain platform designed to solve the long-standing challenges of scalability and speed through its pioneering use of “sharding.” By dividing the network into smaller, parallel groups called shards, the protocol can process thousands of transactions per second, ensuring the network remains efficient as it grows.
At the heart of this ecosystem is the ZIL token, which serves as the primary utility and governance asset. ZIL is used to pay for transaction fees, execute smart contracts written in the secure Scilla language, and reward miners and stakers for securing the network.
As the platform expands its presence in DeFi and the metaverse, ZIL acts as the essential fuel driving all on-chain activity. But as competition in the Layer 1 space intensifies, can Zilliqa’s technical edge translate into sustained market dominance? To explore the long-term outlook, read our Zilliqa price prediction 2026-2030 for a deep dive.
ZIL/USDT is revisiting a critical demand zone between $0.003 and $0.008, where strong accumulation occurred in early 2020. After a long retracement, this stage suggests potential for a trend reversal. If demand exceeds supply, ZIL could target $0.040 by the end of 2026.
Zilliqa Price Targets For March 2026
Ziliqa’s price in Q1 2026 continued the overall long-term downtrend, but it has entered the green box of demand, where it has remained around $0.0040, below the mid-level of the box, and could hit $0.0025 in March if short-term bearish pressure increases. But if short-term bullish demand rises, it could rise towards $0.0060 or $0.0080 as well.
Zilliqa Price Prediction 2026
Based on the weekly chart for ZIL/USDT, the price is currently revisiting a critical historical demand zone between $0.003 and $0.008. This area carries immense technical significance, as it served as the primary accumulation floor in early 2020 before Zilliqa’s massive rally toward its all-time high of approximately $0.240.
After years of retracement, the ZIL price has returned to these baseline levels in early 2026. This prolonged sideways movement suggests a deep phase of accumulation, where supply is being absorbed by patient buyers.
As the consolidation continues within this green-shaded support band, the market is essentially “filling its demand quota.” Once the selling pressure is fully exhausted and accumulation is complete, the groundwork for a trend reversal is set.
Therefore, If historical patterns repeat and demand outweighs supply, a significant recovery rally is anticipated. By the end of 2026, ZIL could realistically target the first major resistance flip at the $0.040 level, which represents a key structural pivot point on the macro scale.
Zilliqa (ZIL) Price Prediction 2026 – 2030
Year
Potential Low ($)
Potential Average ($
Potential High ($)
2027
0.028
0.045
0.065
2028
0.050
0.080
0.120
2029
0.090
0.140
0.180
2030
0.120
0.165
0.200
Zilliqa Price Prediction 2027
As per the Zilliqa Price Prediction 2027, Zilliqa may see a potential low price of $0.028 The potential high for Zilliqa price in 2027 is estimated to reach $0.065
Zilliqa Price Forecast 2028
In 2028, Zilliqa price is forecasted to potentially reach a low price of $0.050, and a high price of $0.120
Zilliqa Coin Price Prediction 2029
Thereafter, the Zilliqa (Zilliqa) price for the year 2029 could range between $0.090 and $0.180.
Zilliqa Price Prediction 2030
Finally, in 2030, the price of Zilliqa is predicted to maintain a steady and positive. It may trade between $0.120 and $0.200
The long-term projection assumes Zilliqa sustains relevance in enterprise blockchain use cases, with growth moderating over time as the asset matures.
Year
Potential Low ($)
Potential Average ($)
Potential High ($)
2031
0.15
0.22
0.30
2032
0.20
0.30
0.45
2033
0.28
0.42
0.60
2040
1.20
1.80
2.50
2050
4.00
6.50
9.00
Zilliqa (ZIL) Price Prediction: Market Analysis?
Year
2026
2027
2030
Changelly
$0.038
$0.050
$0.085
CoinCodex
$0.040
$0.060
$0.090
WalletInvestor
$0.050
$0.070
$0.140
Never Miss a Beat in the Crypto World!
Stay ahead with breaking news, expert analysis, and real-time updates on the latest trends in Bitcoin, altcoins, DeFi, NFTs, and more.
FAQs
What is the price prediction for Zilliqa (ZIL) in 2026?
Zilliqa could trade between $0.018 and $0.045 in 2026 if support holds and the crypto market strengthens, signaling steady recovery, not hype-driven spikes.
What is the Zilliqa price prediction for 2028?
Zilliqa could trade between $0.050 and $0.120 in 2028 if adoption improves and the broader crypto market enters a sustained growth cycle.
How high can Zilliqa price go by 2030?
By 2030, ZIL may reach up to $0.20 in a strong market cycle, supported by ecosystem growth and consistent long-term development progress.
What is the Zilliqa (ZIL) price prediction for 2040?
If Zilliqa maintains relevance and real-world use, ZIL could trade between $1.20 and $2.50 by 2040, reflecting gradual long-term expansion.
What role does Zilliqa 2.0 play in ZIL’s future price?
Zilliqa 2.0 shifts the network to Proof-of-Stake, improving speed and efficiency, which could support long-term value if adoption rises.
Is Zilliqa (ZIL) a good investment?
Zilliqa may appeal to long-term investors if upgrades translate into real usage, but it carries risk due to strong Layer-1 competition.
Notcoin may possibly hit $0.200 by 2030 if support holds and adoption strengthens steadily.
NOT remains in consolidation, with key support at $0.00030
Notcoin (NOT) began as a viral sensation, pioneering the “tap-to-earn” model on Telegram and onboarding over 35 million users into the TON ecosystem.
However, the initial euphoria gave way to a significant “demise” in market value, as the token plummeted over 95% from its 2024 highs to a current market cap of approximately $39M. This decline was driven by massive airdrop sell pressure and a lack of sustainable utility beyond the initial clicker game.
Today, the NOT token is attempting a “strategic resurgence,” evolving from a simple game into a gaming hub and DeFi platform. It now powers the “Not Games” ecosystem, serves as collateral in DeFi protocols, and even backs a digital Visa card with buyback mechanisms.
Can this pivot from hype to infrastructure restore investor confidence, or was the viral spark a one-time phenomenon? To explore its potential recovery, read our Notcoin price prediction 2026-2030 for a deep dive.
NOT/USD experienced a parabolic surge to $0.029 after its Q2 2024 launch but then declined, breaking key supports. As of early 2026, it trades at $0.00039 in a consolidation zone. Bulls need to reclaim $0.002 for a potential reversal.
Notcoin (NOT) Price March 2026 Outlook
As March approaches, Notcoin’s price action remains defined by stability rather than expansion. The $0.00030–$0.00035 range has emerged as a key support zone, where selling pressure has consistently eased. As long as NOT holds above this area, the risk of deeper downside remains limited, and price is likely to continue moving sideways.
On the upside, initial resistance is located near $0.00060, followed by a broader recovery zone between $0.0010 and $0.0015. These levels have a capped price during previous attempts and will likely require time and steady participation to overcome. March is unlikely to deliver a sharp breakout. Instead, its importance lies in whether Notcoin can maintain its base and slowly build higher structure, setting the stage for recovery later in the year.
Notcoin (NOT) Price Prediction 2026
The weekly chart for NOT/USD illustrates a classic “hype-to-capitulation” cycle. Following its Q2 2024 launch, the token experienced a massive parabolic surge, peaking near $0.029. However, this was met with intense selling pressure, breaking key psychological supports at $0.012 and $0.009.
By 2025, the price entered a persistent “bleeding” phase, characterized by lower highs and diminishing volume. Currently, in early 2026, the asset is trading at extreme lows around $0.00039, deep within a terminal consolidation zone. For a reversal, bulls must reclaim the $0.002 level to break the long-term bearish structure.
Notcoin Crypto Price Prediction 2026 – 2030
Year
Potential Low ($)
Potential Average ($
Potential High ($)
2027
0.035
0.055
0.080
2028
0.060
0.095
0.140
2029
0.110
0.160
0.190
2030
0.150
0.180
0.200
Notcoin Price Prediction 2027
As per the Notcoin Price Prediction 2027, Notcoin may see a potential low price of $0.035. The potential high for Notcoin price in 2027 is estimated to reach $0.080.
Notcoin (NOT) Price Forecast 2028
In 2028, Notcoin price is forecasted to potentially reach a low price of $0.060 and a high price of $0.140.
Notcoin Crypto Price Prediction 2029
Thereafter, the Notcoin (Notcoin) price for the year 2029 could range between $0.110 and $0.190.
Notcoin (NOT) Price Prediction 2030
Finally, in 2030, the price of Notcoin is predicted to remain steady and positive. It may trade between $0.150 and $0.200.
The Ethereum price might finally be catching its breath. After weeks of brutal leverage-driven chaos, the market appears to be shifting gears away from forced liquidations and toward something far less dramatic: actual demand.
Recent data suggests the violent liquidation cycles that dominated late February are fading. Short liquidations, which previously spiked during the market’s most chaotic moments, have now dropped sharply to around 700. In simpler terms, the short squeeze fuel that once powered explosive moves has largely burned out.
And without that forced buying pressure, the market has to do something unfamiliar and that to move organically with spot demand.
Ethereum Price Leaves Liquidation Chaos
But let’s rewind a bit. Back in mid-February, leveraged traders were getting absolutely steamrolled. Long liquidations surged as overexposed positions were wiped out, sending waves of forced selling through the market.
Now that storm has calmed. Per analyst PelinayPA, current long liquidations are hovering near 1,000, dramatically lower than the aggressive flush seen earlier in the year. Meanwhile, short liquidations have also cooled, suggesting traders on both sides are finally dialing back the leverage.
That matters more than it sounds. When both long and short liquidations shrink simultaneously, it usually signals a transition phase. Less leverage means fewer forced moves. Fewer forced moves mean price action becomes… well, normal. The ETH/USD market appears to be entering that quieter stage.
Spot Demand Slowly Takes Over
Well, here’s where things get even more interesting. As seen over the past 15 days, price action has quietly climbed even while liquidation volumes continue to fall. That’s a subtle but important signal. When prices rise without massive liquidations, it usually means one thing: spot buyers are stepping in.
Not leveraged gamblers. Actual investors. Of course, the momentum isn’t screaming “bull market” just yet. The Ethereum price chart still shows a market searching for direction rather than exploding higher.
Technical indicators confirm the cautious tone. The RSI is sitting near the 50 midline, which basically screams neutrality. Meanwhile, the CMF is hovering around zero, suggesting that capital flows are balanced rather than aggressively bullish. In other words, momentum exists but it’s still tentative.
Institutional Access Changes Narrative
Moreover, A significant development just hit the market: the official launch of BlackRock’s Ethereum staking ETF, ETHB. The new fund offers investors exposure not only to the asset’s market price but also to on-chain staking yields.
And the pricing? A 0.25% fee, matching the structure of its non-staking counterpart, ETHA.
NEW: BlackRock is launching their Ethereum Staking ETF today — $ETHB. It will have the same fee as $ETHA at 0.25% bps but has a fee waiver down to 0.12% for the first year or first $2.5 billion in assets. pic.twitter.com/aR3FVRChPz
That’s not just another ETF headline. It potentially opens the door for institutional and retail investors to access staking returns through a familiar financial vehicle something traditional markets tend to appreciate.
So, what does all this mean? For now, the Ethereum price appears to be transitioning out of a liquidation-driven phase and into a slower environment defined by spot accumulation and institutional accessibility. Not explosive. But potentially far more sustainable.
The River price just woke up violently. After posting a sharp 25.90% intraday surge, the asset has marched straight into a major technical battlefield between $18 and $20. That zone isn’t just another resistance level. It’s the neckline of a massive inverted head and shoulders pattern that has been quietly forming ever since the brutal correction back in February.
Now the market is staring at a simple question: does it break, or does it fake out?
Because if this neckline cracks with a daily close above $20, the technical roadmap suddenly opens up. The next obvious checkpoint sits near $25.14, a level marked by a previous structural barrier on the River price chart.
And if the current momentum keeps building? Well, traders are already eyeing the next liquidity pocket closer to $37.00.
River Price Tests Key Breakout Level
Here’s the thing about neckline breakouts they tend to attract attention fast, like in this crypto asset. Right now the RIVER/USD pair is hovering inside that critical $18–$20 zone, which makes the current moment more of a decision point than a celebration. Breakouts need confirmation, not just excitement.
Still, the setup itself is hard to ignore. The inverted head and shoulders pattern is widely viewed as a classic trend-reversal formation, especially when it forms after a steep market correction like the one seen in February.
So the logic is pretty straightforward: reclaim the neckline, confirm the reversal. Fail to do that, and the breakout narrative gets a lot less convincing.
Indicators Flash Early Bullish Signals
Well, the rise is verified with price indicators and momentum felt real for now. As momentum indicators aren’t screaming “overbought panic” yet and they’re actually suggesting the move may still have room to run.
The RSI currently sits at 56.68, which places it comfortably in bullish territory but still far from exhaustion. That means traders aren’t yet dealing with the typical overheating that kills rallies prematurely.
Meanwhile, the CMF is hovering around -0.04. It’s technically still negative, but the trajectory is what matters here but it’s rising sharply from previous lows, hinting that selling pressure is fading while accumulation quietly builds.
Then there’s the whale activity. The Whale vs. Retail Delta has flipped noticeably positive, with green histogram bars printing around 11.470. In simpler terms, large players appear to be buying more aggressively than retail traders.
That kind of imbalance doesn’t guarantee a breakout but historically it often shows up right before one.
Partnership Boosts Fundamental Narrative
Of course, charts alone rarely move markets forever. The recent surge also coincides with a new partnership with DIA, where River is integrating DIA’s oracle infrastructure for satUSD across five chains. The upgrade aims to strengthen reliability for lending markets and vaults, particularly during volatile periods.
Infrastructure improvements aren’t always flashy headlines, but they matter. Markets tend to reward projects that reinforce their backbone. And traders seem to be pricing that in.
On-Chain Activity Starts Recovering
Then there’s the on-chain data quietly telling its own story. Activity on the River contract shows a V-shaped recovery in transfer counts starting in early March 2026. In short, more users are interacting with the network again after February’s slump.
Transfer volumes have also stabilized following the massive spike seen during the February sell-off. That spike likely represented redistribution, while the recent uptick hints that liquidity is flowing back into the ecosystem.
Even wallet growth is turning upward. Both unique senders and receivers have been increasing since early March, signaling that the holder base is expanding something breakouts usually need to survive.
Which brings the market back to the same question. If momentum holds and the neckline breaks, the River price may have finally found its next leg higher.
The live price of the Monero crypto is $ 353.64894158.
XMR eyes $820 in 2026 if price reclaims and sustains above $500 resistance.
Privacy demand and macro liquidity will shape Monero’s 2027–2030 trend.
Key support at $300; breakout above $360 could trigger upside momentum.
Envision the capability to conduct online payments without a digital footprint; that’s payment privacy. Numerous cryptocurrency assets possess a distinct selling proposition (USP), some safeguard transaction details concerning the parties or institutions involved, but some do not.
But, this transparency enables larger investors and institutional capital to be easily traced. While unshielded transactions are valued by researchers for the accessible information they provide regarding investments, individuals whose data is subject to scrutiny often experience frustration, as they perceive a loss of privacy over their own financial assets.
This is where Monero (XMR) comes in. Since its inception in 2014, Monero has offered robust privacy features. It has become the top choice for users seeking to maintain a high standard of anonymity in blockchain transactions. The impact of Monero’s privacy capabilities was particularly evident in the fourth quarter of 2025.
Despite the government’s tightening of the rules around digital assets, Monero has ranked 21st globally. Driven by rising interest, XMR stands out as a privacy-focused coin. So, what’s coming next for Monero in 2026 and the years to come? In this Monero price prediction 2026-2030 article, we look at the potential price targets.
Monero (XMR) surged in Q4 2025, reaching $800 in 2026 before dropping to around $285, indicating bearish dominance. If demand increases, it could revisit $422, but failure to break this level may lead to a decline toward $200 or even $130 by year-end. Currently, XMR is retreating from the upper boundary of its ascending channel and has reached mid-way already, suggesting a correction may be imminent if more ground is lost.
Monero (XMR) Price March 2026 Outlook
The one-day price chart for Monero shows a downward trend in the market, indicating a significant price change. The price of XMR declined rapidly after it failed to hold above $422 in January. In February, it dropped below $370. However, there was a short-term recovery during the same month, although it continues to struggle near the 200-day EMA and around the $370 mark.
The XMR/USD pair has found short-term support, but if it breaks this level, another rapid decline could occur, potentially dropping below $300. Conversely, if the support holds, a retest of $422 could be possible by the end of March.
Recent News and Opinions
Per the late February 2026 post from ProbeLab, they show that findings confirm the Monero network’s resilience against surveillance. Analysis reveals that 46% of community nodes have proactively adopted a “ban list,” effectively neutralizing nearly all identified spy nodes. This grassroots defense highlights a robust, decentralized commitment to privacy, strengthening the network’s topology against potential deanonymization attempts.
Monero (XMR) Price Prediction 2026
The price action of Monero (XMR) showed remarkable bullish momentum, particularly in Q4 2025, driven by a broader trend in privacy coins, which resulted in a significant price surge during that period.
In 2026, Monero followed the same privacy narrative, continuing the rally and pushing the price to new all-time highs (ATH) of $800. However, this increase was short-lived, as the price dropped to around $285 in February, losing more than 60% from its peak. Additionally, the mid-trendline of an ascending channel was breached, confirming a bearish dominance in the market at that time.
But, the remaining days of Q1 2026 showed some improvements that pushed it back above mid-trendline support, and now we see consolidation going on.
Now, if demand for XMR price increases, it could potentially revisit the $422 mark. It’s important to note that a recovery to this level might not inspire much excitement, as it could form a significant trap for investors. To regain a bullish setup, a weekly close above $422 would be crucial for attracting investor interest.
Conversely, if the price fails to break through $422 or even collapses below mid-trendline support again, then the first half of 2026 could see a drop towards $200 area, which could accelerate to $130 by year’s end to touch the lower border of the ascending channels as a support, like in the past.
Furthermore, it’s essential to recognize that the price has reached the upper boundary of its ascending parallel channel. As with previous patterns, a correction appears to be imminent. When it pierced the upper boundary, it had two choices: break away from the earlier pattern and establish new price action, but it briefly exceeded the channel before falling back within it, echoing historical trends. Ultimately, it returned to the pattern, continuing its legacy from the past.
Monero Crypto Price Prediction 2026 – 2030
Year
Potential Low ($)
Potential Average ($)
Potential High ($)
2027
$910.00
$1000.00
$1200.00
2028
$863.46
$1,726.90
$2,590.35
2029
$1,295.19
$2,590.35
$3,885.53
2030
$1,942.76
$3,885.53
$5,828.30
Monero Price Forecast 2027
Looking forward to 2027, XMR’s price is expected to reach a low of $910, with a high of $1,200 and an average forecast price of $1,000.
XMR Price Prediction 2028
In 2028, the price of a single Monero is anticipated to reach a minimum of $863.46, with a maximum of $2,590.35 and an average price of $1,726.90.
Monero Price Prediction 2029
By 2029, XMR’s price is predicted to reach a minimum of $1,295.19, with the potential to hit a maximum of $3,885.53 and an average of $2,590.35.
Monero (XMR) Price Prediction 2030
In 2030, Monero is predicted to touch its lowest price at $1,942.76, hitting a high of $5,828.30 and an average price of $3,885.53.
The long-term projection assumes Monero sustains relevance in enterprise blockchain use cases, with growth moderating over time as the asset matures.
Year
Potential Low ($)
Potential Average ($)
Potential High ($)
2031
3800
5200
6800
2032
5500
7500
9500
2033
7700
10000
11500
2040
15000
22000
42000
2050
30000
40000
60000
Monero (XMR) Price Prediction: Market Analysis?
Year
2026
2027
2030
Changelly
$720
$900
$1900
CoinCodex
$680
$880
$1800
WalletInvestor
$740
$870
$2000
Never Miss a Beat in the Crypto World!
Stay ahead with breaking news, expert analysis, and real-time updates on the latest trends in Bitcoin, altcoins, DeFi, NFTs, and more.
FAQs
What is Monero (XMR) price prediction for 2026?
Monero could revisit the $422 level if buying demand strengthens. However, if bearish pressure continues, the price may fall toward $200 or even $130 during 2026.
How much will Monero be worth in 2030?
Projections indicate Monero could trade between about $1,942 and $5,828 by 2030, with an estimated average price around $3,885 if adoption continues growing.
How high can Monero price go by 2040?
Long-term projections vary widely, but some estimates place Monero between $2,000 and $5,000 by 2040, depending on adoption and regulation.
What factors influence the price of Monero?
Monero’s price is driven by privacy demand, regulatory developments, network adoption, market sentiment, and overall crypto market trends.
Will Monero be the next Bitcoin?
Monero serves a different role than Bitcoin. Bitcoin focuses on transparency, while Monero prioritizes privacy, making it a niche but valuable crypto asset.
The Bitcoin price is hovering near $69,926, but not everyone is convinced the worst is over. In fact, some voices like Arthur Hayes in the market are openly saying they wouldn’t buy right now even if they had fresh capital ready to deploy.
In a recent appearance on the Coin Stories podcast, he made it clear that if he had $1 to invest today, it wouldn’t be going into BTC just yet. He’d wait. Specifically, he’d wait for central banks to start printing money again.
Because according to this view, it’s not war that’s bullish for crypto. It’s the monetary response that follows.
Bitcoin Price Hinges On Money Printing
Well, the argument is simple: geopolitical conflicts can initially trigger risk-off reactions across markets. That means equities fall, liquidity dries up, and yes, the crypto often gets dragged down with everything else.
LATEST: Arthur Hayes says he would not invest in Bitcoin right now and would wait for the Fed to start money-printing, warning BTC could fall below $60,000 if geopolitical tensions persist. pic.twitter.com/OnHu6EpxP7
The ongoing tensions between the United States and Iran could create exactly that environment. If the conflict drags on, the theory goes, markets might see a broader sell-off before policymakers step in with stimulus. And that’s the moment many large traders are waiting for.
Once central banks begin easing monetary policy and liquidity floods back into the system, assets that thrive on abundant money supply historically start to move. For anyone tracking a Bitcoin price prediction narrative, that policy shift is seen as the real catalyst not the conflict itself.
War Could Trigger Market Liquidations
But let’s be real for a second. Before the liquidity wave comes the storm.
The warning is that prolonged geopolitical stress could trigger a sharp sell-off across equities and crypto markets alike. In that scenario, the Bitcoin/USD pair might not just dip, it could experience cascading liquidations.
One potential target mentioned? A drop below $60,000. That kind of move wouldn’t be unprecedented. The asset briefly touched the $60K level back on early february, before stabilizing and drifting into a mild recovery phase.
Still, traders watching the Bitcoin price chart know how quickly momentum can flip once leveraged positions start unwinding.
On-Chain Metrics Suggest Bottom Missing
And then there’s the on-chain data often the reality check when narratives get loud.
Two metrics are currently raising eyebrows, as well. First is Net Unrealized Profit/Loss (NUPL). Historically, major cycle bottoms have appeared when NUPL drops below zero. So far, that hasn’t happened yet.
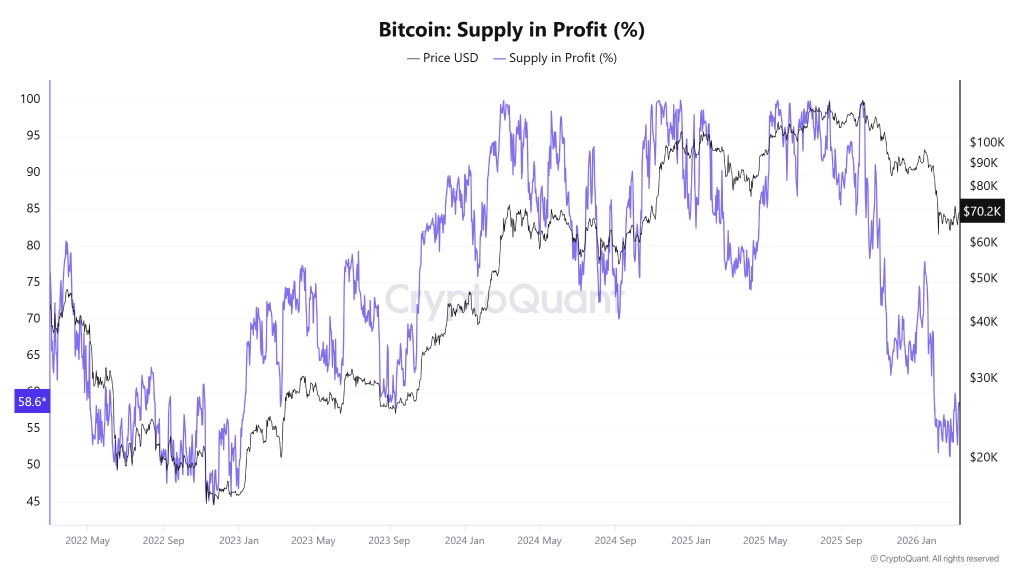
Second is Supply in Profit. Right now, roughly 58.6% of supply remains in profit, comfortably above the 50% threshold that historically coincided with major market bottoms. For context, the last major cycle bottom in November 2022 occurred when the metric dropped to around 45% while prices hovered near $16,000.
So what does all that suggest? Simply put, the Bitcoin price may not have reached its ultimate floor yet, even if the long-term outlook remains bullish.
Interestingly, despite the caution, the same long-term outlook still includes a bold projection: a potential $250,000 valuation by 2026. But before that kind of rally can happen, the market might have to endure one more shakeout.
The BNB price might be getting its groove back after a major decline from ATH and this time the action isn’t coming from just the usual spot traders. Nope. The real fireworks are happening inside the derivatives segment, where leverage-hungry traders seem to be piling in again.
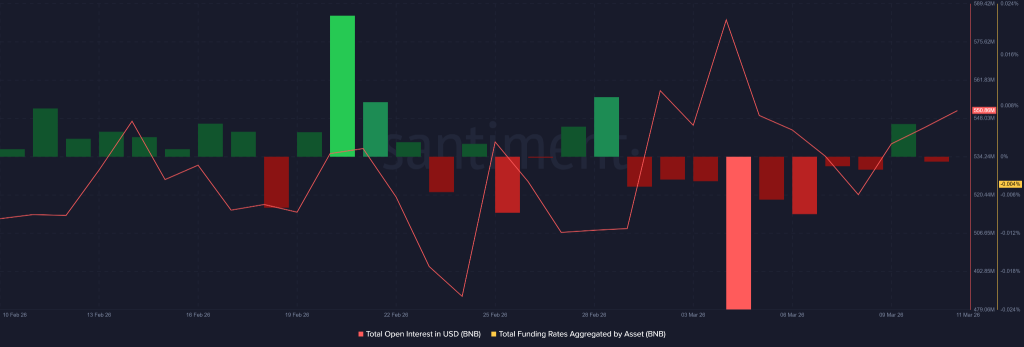
Data shows derivatives activity around BNB is picking up steam, with Open Interest climbing to $550.86 million. That number alone doesn’t guarantee anything, of course. But paired with funding rates leaning toward improving long positions side, it definitely hits the odds higher that traders are increasingly betting that the next move might be upward rather than sideways for much longer.
And honestly? The market structure is starting to reflect that optimism slowly due to a recent case against Binance got dismissed, making sense to the shortterm momentum.
Derivatives Traders Step In
Let’s start with the obvious signal: derivatives demand. Open Interest sitting at $550.86 million means a sizable amount of capital is locked into active BNB futures contracts. More importantly, funding rates are currently aligned with long-side positioning, indicating traders are willing to pay a premium to maintain bullish exposure, per Santiment charts.
Now, here’s the interesting twist. The Futures Volume Bubble Map suggests the market isn’t overheated, at least not yet. Instead, it’s sitting in a neutral zone after coming from ATH. That’s the kind of environment momentum traders actually like because it leaves room for growth without the immediate risk of a crowded trade collapsing.
If optimistic demand keeps building, those volume bubbles could shift toward light orange, which could increase the odds of rising derivatives momentum. And when that happens, things can move fast.
Naturally, anyone staring at a BNB price chart will want to watch that transition carefully.
Binance Futures Market Surges
But the bigger story isn’t just BNB price itself. It’s what’s happening across the exchange, as well.
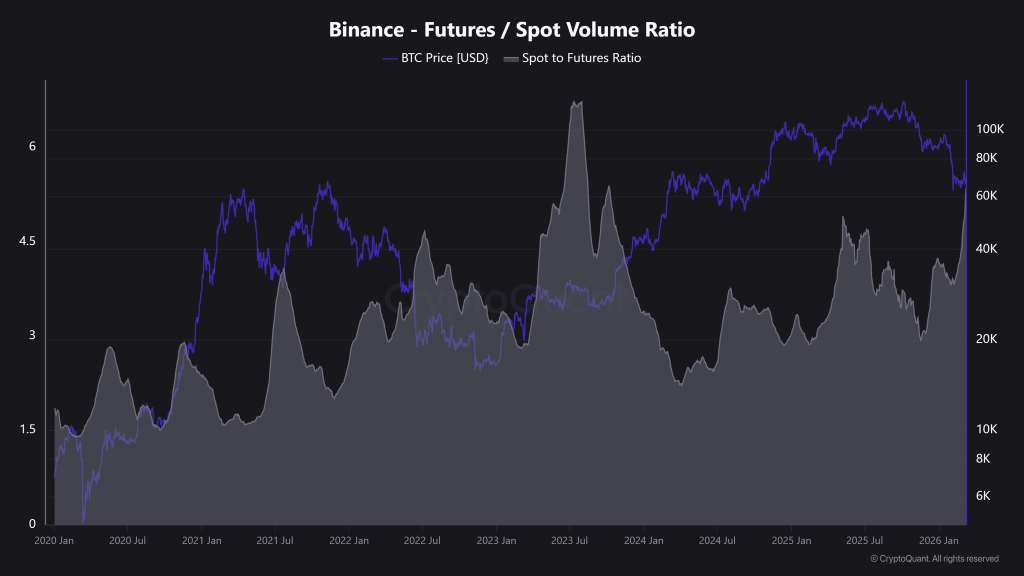
On Binance, the futures-to-spot volume ratio has surged to 5.1, a level not seen in about 1.5 years, the highest reading since mid-2023. Put simply, the futures market is now processing more than five times the trading volume of spot markets, which means that people are trading all sorts of pair and giving the fundamentals a boost to Binance as well.
That’s not a small shift. That’s structural. When the majority of trading moves toward derivatives, price action tends to become faster, sharper, and far more volatile.
Futures Growth Drives Market Shift
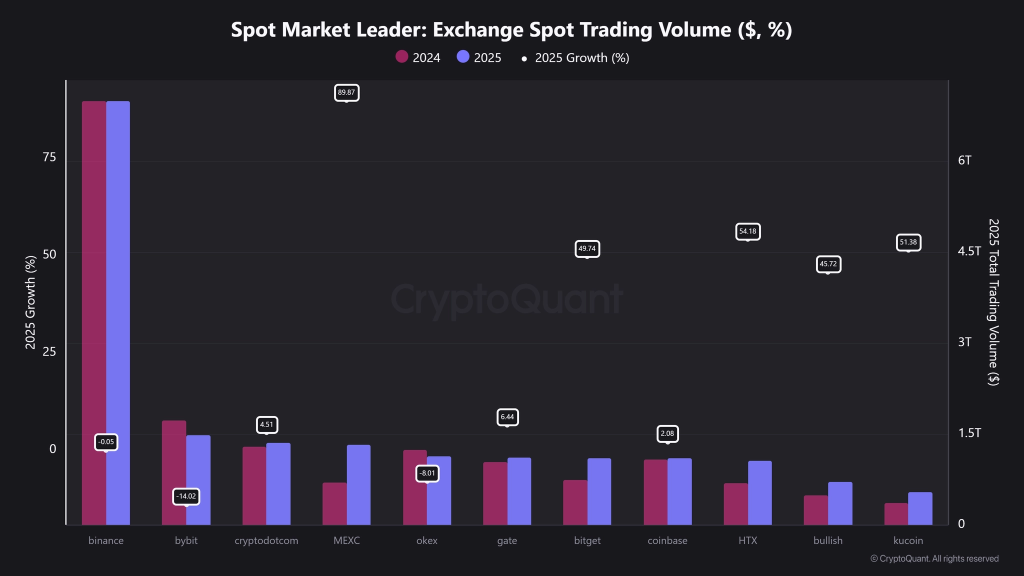
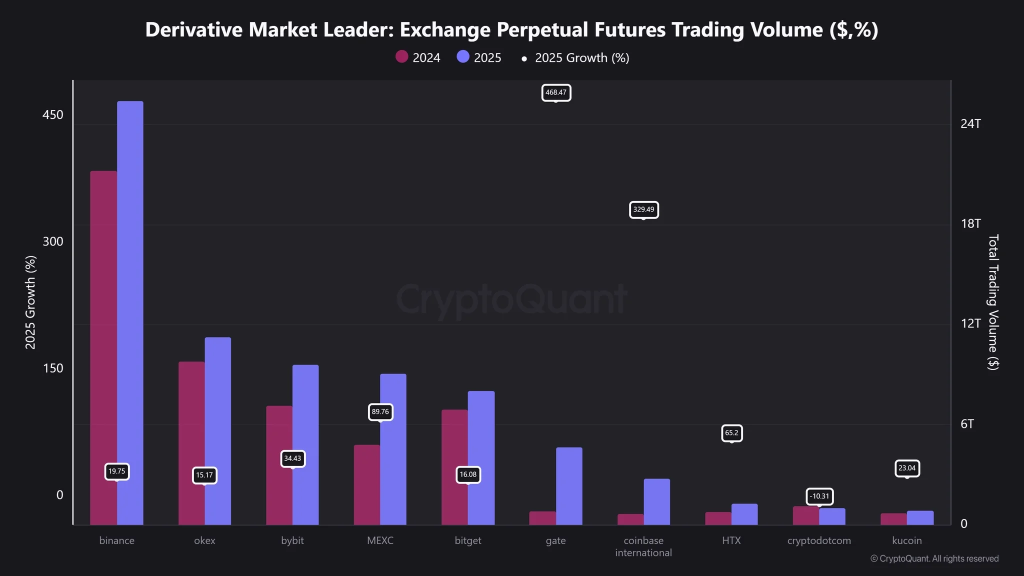
The data from analyst maartunn makes the trend even clearer. He said, in 2025, total trading volume on Binance reached $32.39 trillion. Derivatives activity alone accounted for $25.4 trillion, up from $21.21 trillion in 2024 showing a 19.7% increase year-over-year.
Spot trading, meanwhile, didn’t budge. It stayed flat at $6.99 trillion across both years.
Well, traders appear to be shifting toward leverage and hedging strategies rather than simple spot accumulation. Futures offer flexibility and risk, obviously, but they also attract liquidity.
That liquidity matters. Because when derivatives volume expands while spot markets stagnate, the result is often explosive price swings once demand returns.
And that brings us back to the BNB price. If derivatives liquidity continues building and bullish positioning strengthens, the BNB/USD pair could find itself with plenty of trading fuel. The BNB price prediction crowd will undoubtedly keep a close eye on the next derivatives surge.
Expanding exchange-ecosystem demand could lift BNB price toward $2000 by the end of this year.
Long-term network usage growth may extend BNB price toward $10,000.
Binance Coin (BNB) suggests a fundamental shift in how the asset responds to broader market dynamics. In 2026, the token’s performance increasingly reflects on-chain utility and ecosystem liquidity rather than mere speculative volatility. This transition from reactive price swings to a more structured price action indicates a maturing market environment.
As the ecosystem stabilizes, the technical narrative centers on long-term accumulation and the absorption of supply within established demand zones. Sustained network activity across the Binance Smart Chain provides a foundational backdrop for this consolidation, potentially setting the stage for a period of extended price discovery. By focusing on fundamental network health and institutional integration, the outlook for the next several years leans toward organic growth and structural resilience within the global digital asset landscape.
So, what’s next for the BNB price in the rest of 2026 and beyond? What can be the future price movements? Let’s get into the Binance Coin (BNB) Price Prediction 2026–2030.
Binance Coin (BNB) Price February- March 2026 Outlook
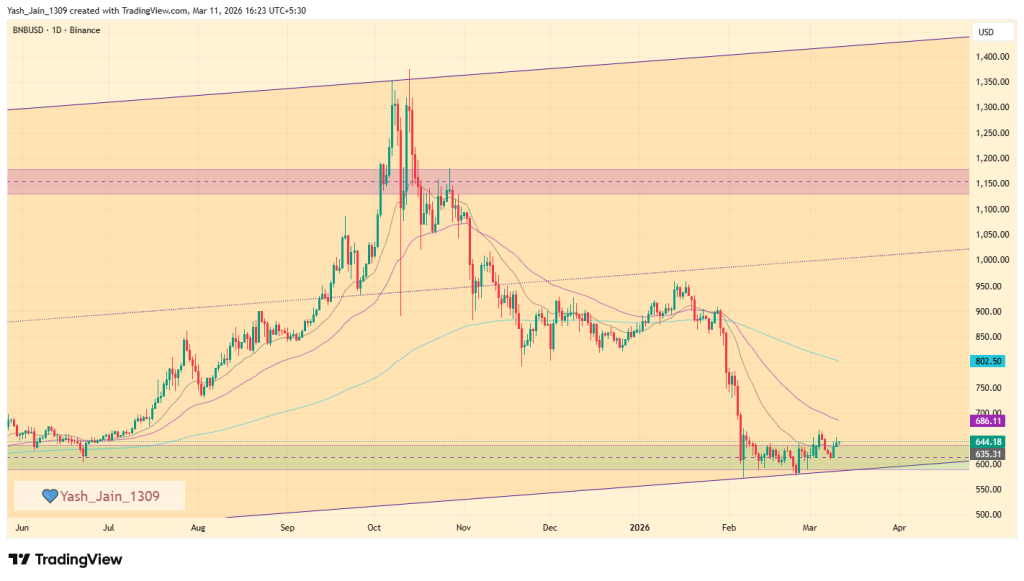
In Q3 2025, we saw a 125% rally from the $600 support level to $1,375. However, by Q4 2025 and Q1 2026, the price returned to the $600 demand area, completely wiping out those gains. Since February, there has been visible accumulation on the daily chart around this $600 demand area, indicating that it could serve as a strong support level where bullish momentum might resume.
Despite the broader market pessimism, the consolidation continued throughout March, demonstrating resilience as the price remained above the $600 mark without further declines. In March of Q1 2026, long-term accumulation may persist, and short-term reactions could turn bullish, as early March indicators already suggest. If bullish pressure increases, we could see BNB price retest the $750 level by the end of March, but if short-term reactions stay muted, then further consolidation could continue throughout March.
Recent News/ Opinions
A recent ruling news on March 7th came from the US federal court that it has positively dismissed all anti-terrorism claims against Binance, alleviating a significant legal burden. In the Southern District of New York, a judge concluded that the plaintiffs, comprising 535 individuals citing 64 attacks from 2017 to 2024, did not establish sufficient evidence to demonstrate that Binance had assisted or conspired with terrorist organizations. This decision marks a commendable step forward for Binance, affirming its commitment to compliance and integrity.
Binance Coin (BNB) Price Prediction 2026
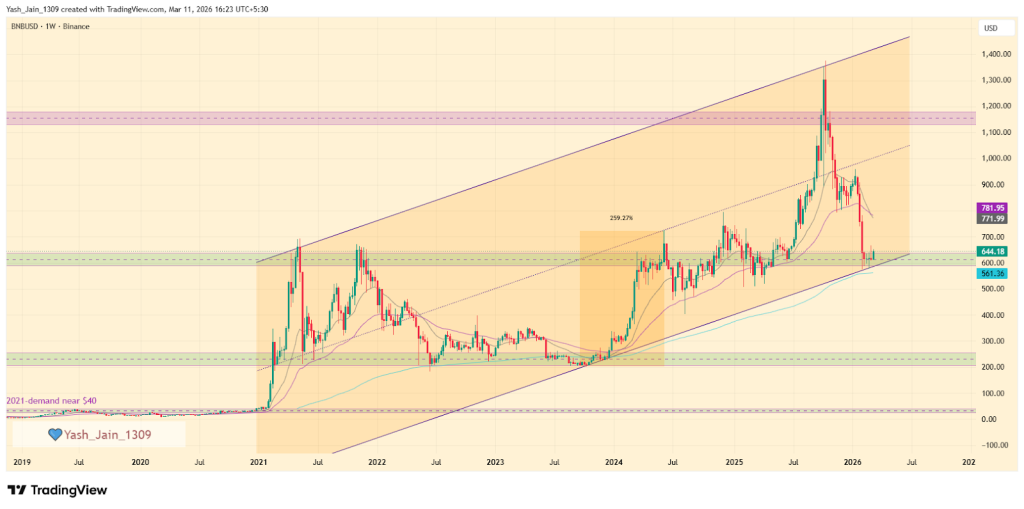
Based on the technical structure of the BNB/USD weekly chart, the price action reflects a long-term ascending channel (or wedge) that has defined the asset’s trajectory since the massive demand surge from the $40 level in early 2021. This multi-year uptrend culminated in a new all-time high of approximately $1,375 in late 2025, validating the token’s utility and its position within the Binance ecosystem. Currently, the market is witnessing a convergence of horizontal price levels with channel’s dynamic trendline support, which reinforces the technical significance of the current price zone.
As of Q1 2026, BNB price is testing a critical turning support zone around the $600 horizontal support, which aligns precisely with the lower boundary of the primary ascending channel. This area is currently serving as a consolidation floor, suggesting a period of institutional accumulation. Historical precedent highlights the importance of this trendline; a similar touchpoint in late 2023 at the $200 range served as the launchpad for a massive rally, though it took roughly 238 days to reach the channel’s median line.
Looking ahead through 2026, the primary bullish thesis anticipates a recovery toward the $1,000 psychological level. If the recovery pace mirrors previous cycles, BNB/USD could reach the channel’s middle band by Q3 2026. However, if consolidation extends further into the year, the recovery might be more gradual, stretching toward the year-end.
Conversely, a decisive break below the $600 footing would invalidate the current setup, significantly increasing the probability of a deeper correction toward the major $200 demand zone.
BNB Onchain Analysis
Recent on-chain data highlights the network’s resilience, with daily transactions stabilizing at 15 million in Q1 2026 despite market fluctuations. This sustained utility, paired with total unique addresses nearing the 800 million mark, signals a consistent rise in global adoption. These fundamental metrics suggest a robust foundation for long-term ecosystem growth and structural asset valuation.
Binance Coin Crypto Price Prediction 2026 – 2030
Year
Potential Low ($)
Potential Average ($
Potential High ($)
2027
1200
1420
1800
2028
1600
1950
2300
2029
2100
3250
3900
2030
2500
3800
4500
Binance Coin Price Prediction 2027
As per the Binance Coin Price Prediction 2027, Binance Coin may see a potential low price of $1200. The potential high for Binance Coin price in 2027 is estimated to reach $1800.
BNB Price Prediction 2028
In 2028, Binance Coin price is forecasted to potentially reach a low price of $1600 and a high price of $2300.
Binance Coin Price Prediction 2029
Thereafter, the Binance Coin (Binance Coin) price for the year 2029 could range between $2100 and $3900.
Binance (BNB) Coin Price Prediction 2030
Finally, in 2030, the price of Binance Coin is predicted to remain steadily positive. It may trade between $2500 and $4500.
The long-term projection assumes Binance Coin sustains relevance in enterprise blockchain use cases, with growth moderating over time as the asset matures.
The BNB/USD chart shows a long-term ascending channel which is testing a key support at $600 in Q1 2026, indicating potential accumulation.
For 2026, a recovery towards $1,000 is expected, possibly reaching the median of the channel by Q3. However, if it stays below $600, the risk of a deeper drop to $200 increases.
Never Miss a Beat in the Crypto World!
Stay ahead with breaking news, expert analysis, and real-time updates on the latest trends in Bitcoin, altcoins, DeFi, NFTs, and more.
FAQs
What is the BNB price prediction for 2026?
BNB could recover toward $1,000 in 2026 if the $600 support holds and Binance ecosystem demand grows, supported by rising network usage and liquidity.
What will be the BNB price in 2030?
BNB could trade between $2,500 and $4,500 by 2030 if blockchain adoption grows and the Binance ecosystem maintains strong network activity.
How high can BNB price go by 2040?
Long-term projections suggest BNB could reach $13,000–$38,000 by 2040 if the network expands globally and maintains strong adoption across DeFi and Web3.
What factors influence Binance Coin’s price?
Price depends on exchange network usage, liquidity, adoption trends, historical support/resistance zones, and institutional participation.
Is Binance Coin (BNB) a good long-term investment?
BNB is often viewed as a strong long-term asset due to exchange utility, token burns, and ecosystem growth, though crypto investments always carry risk.
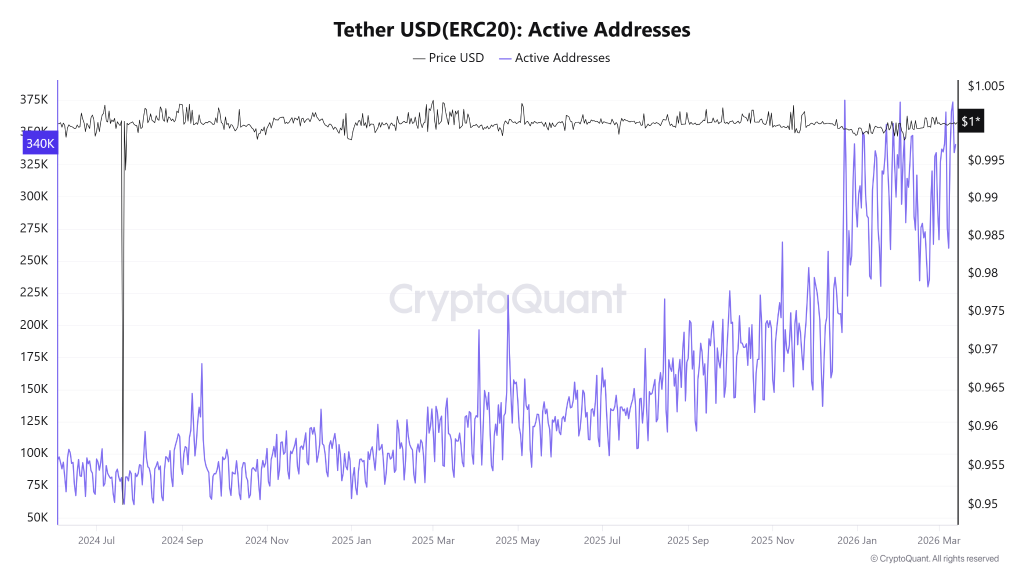
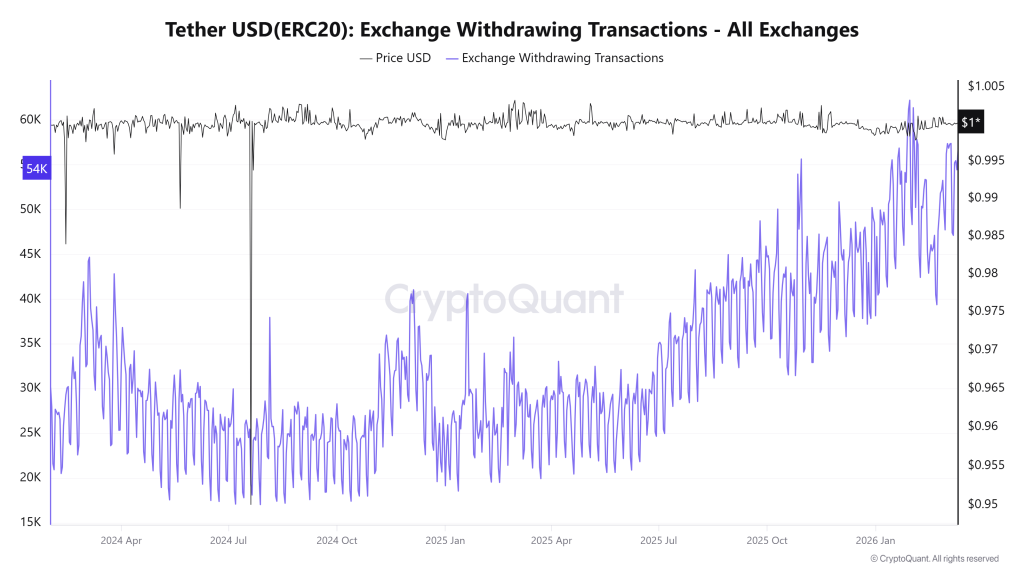
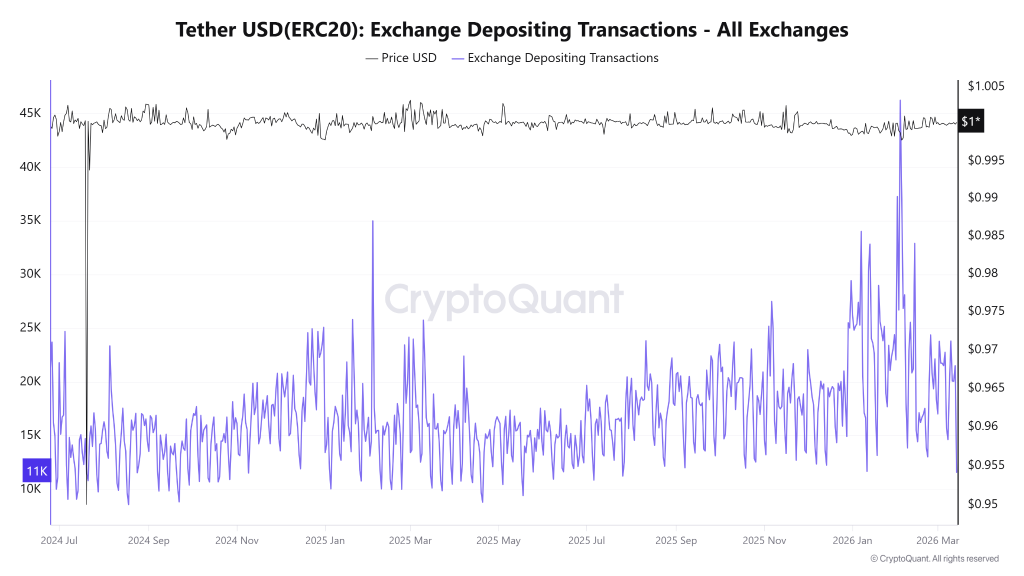
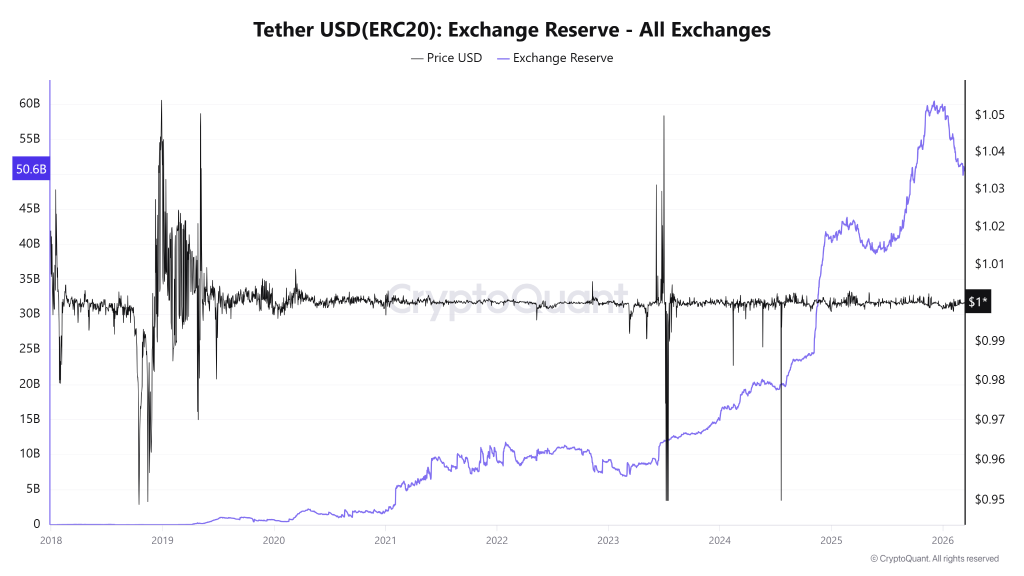
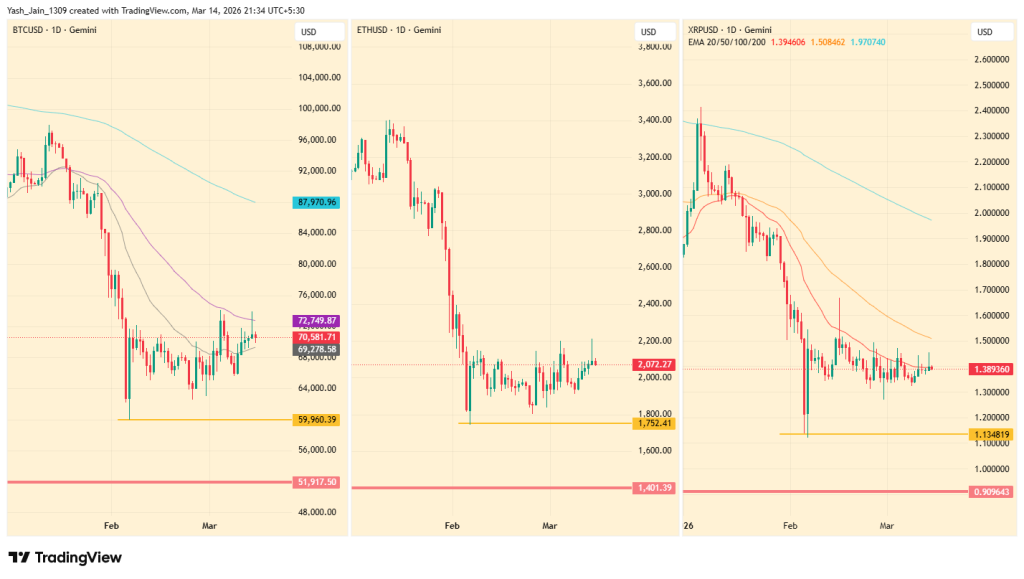
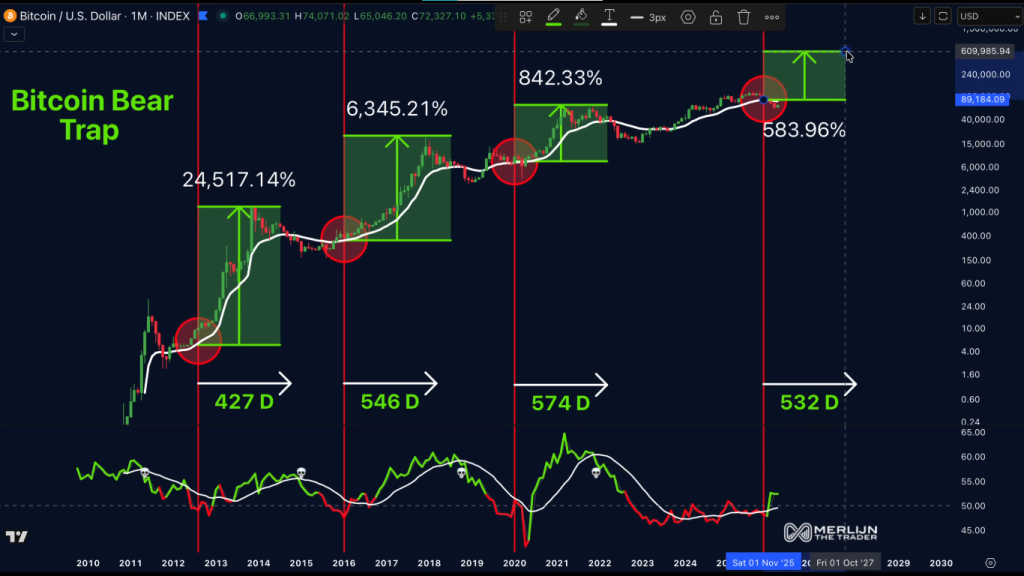
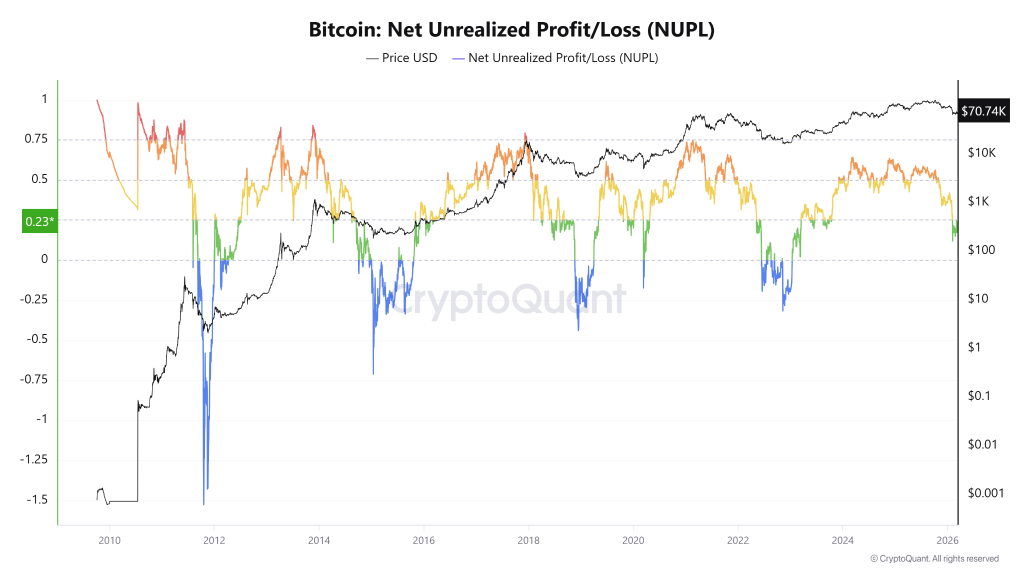

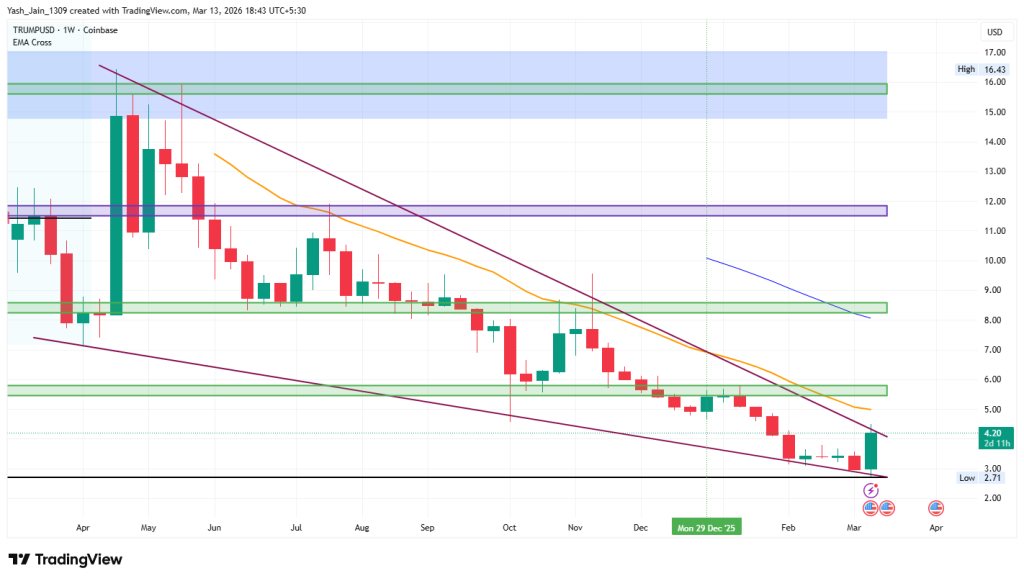
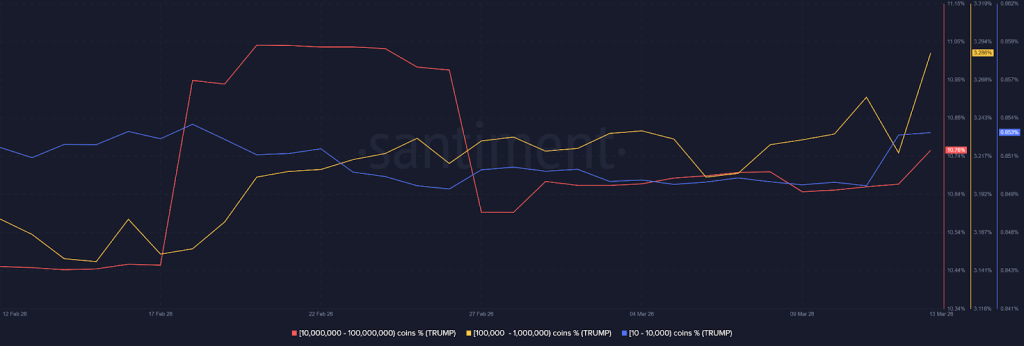
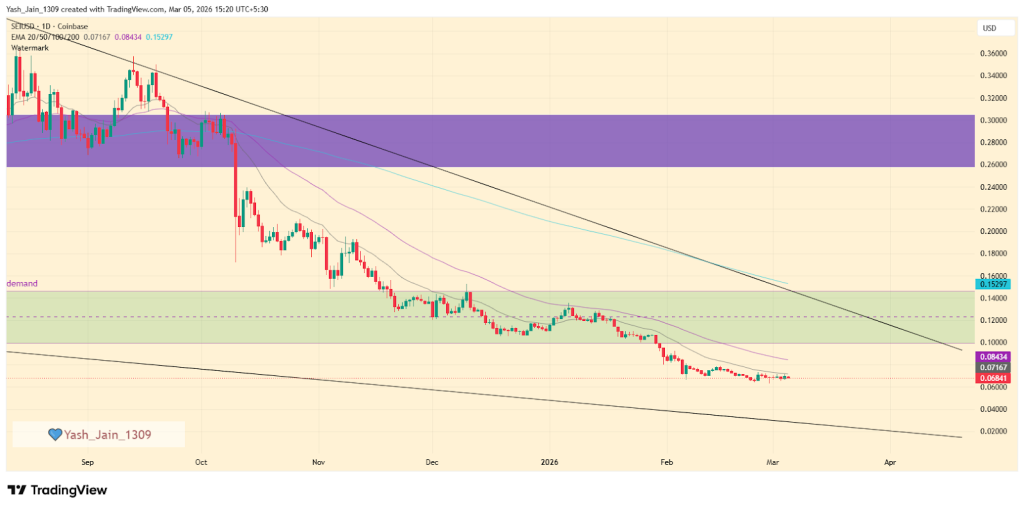
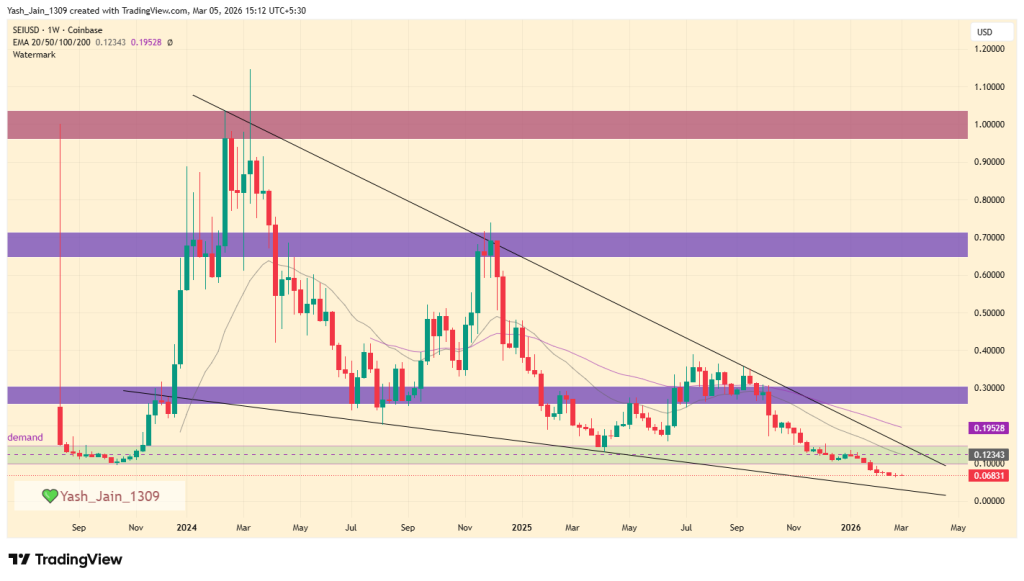
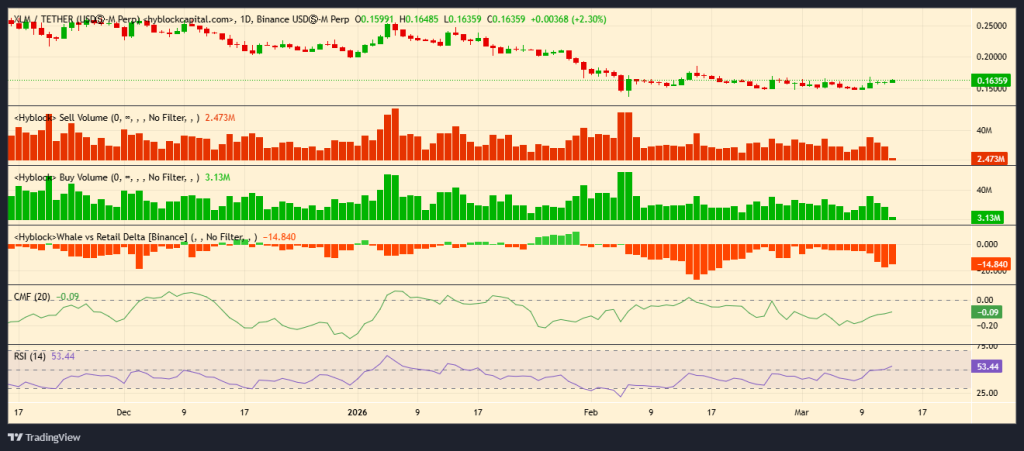
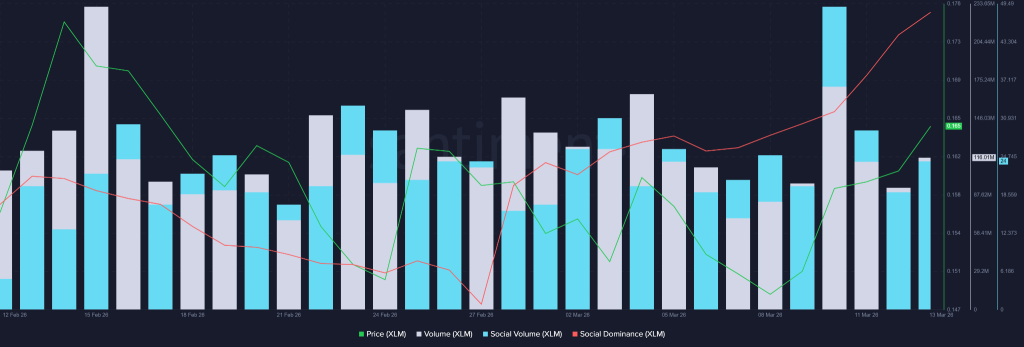


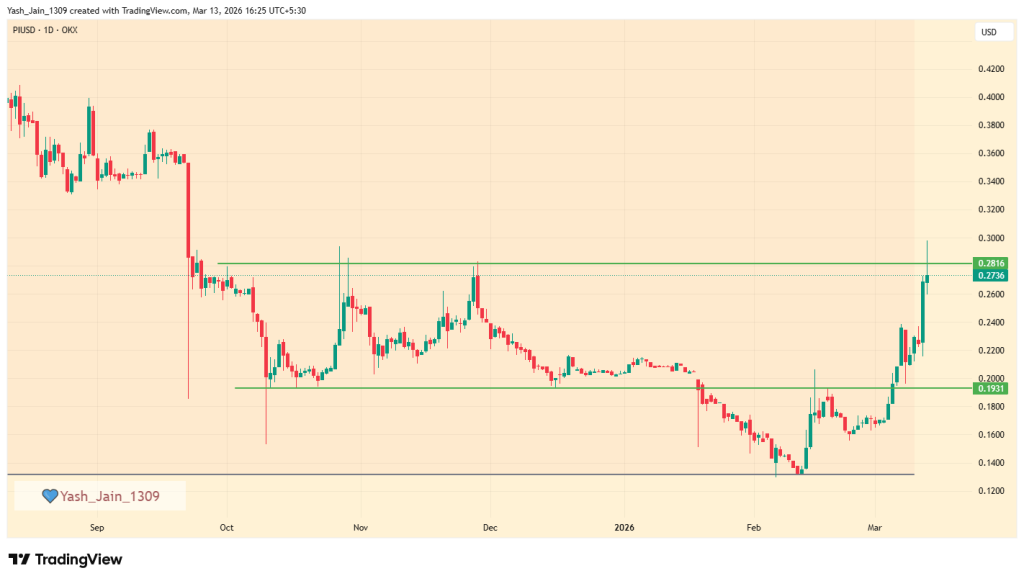
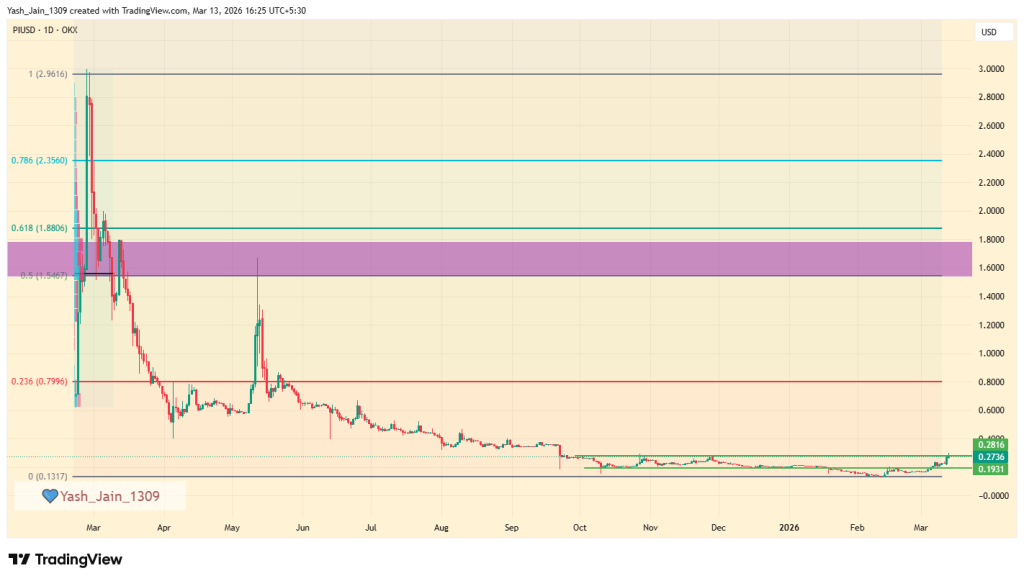
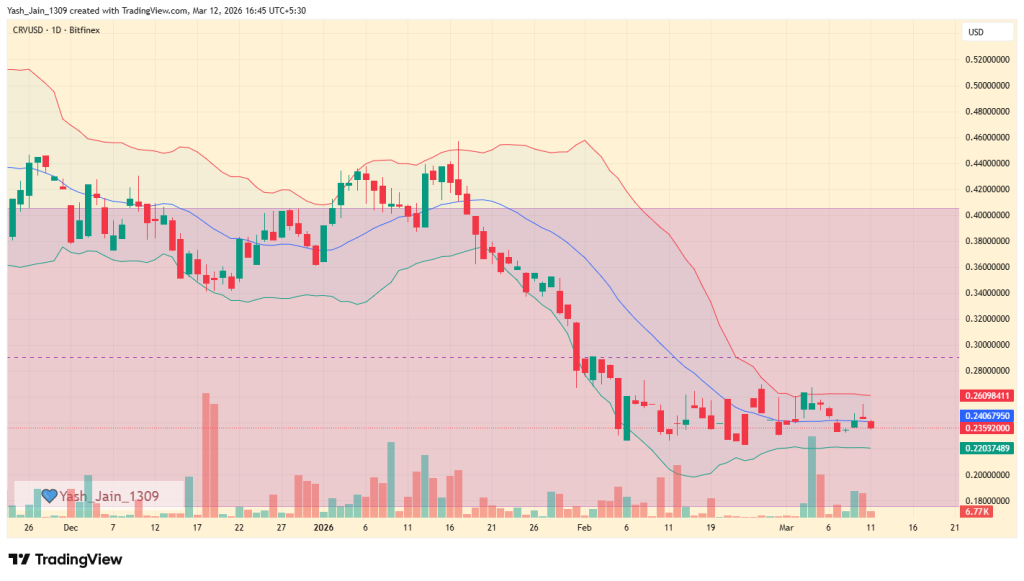
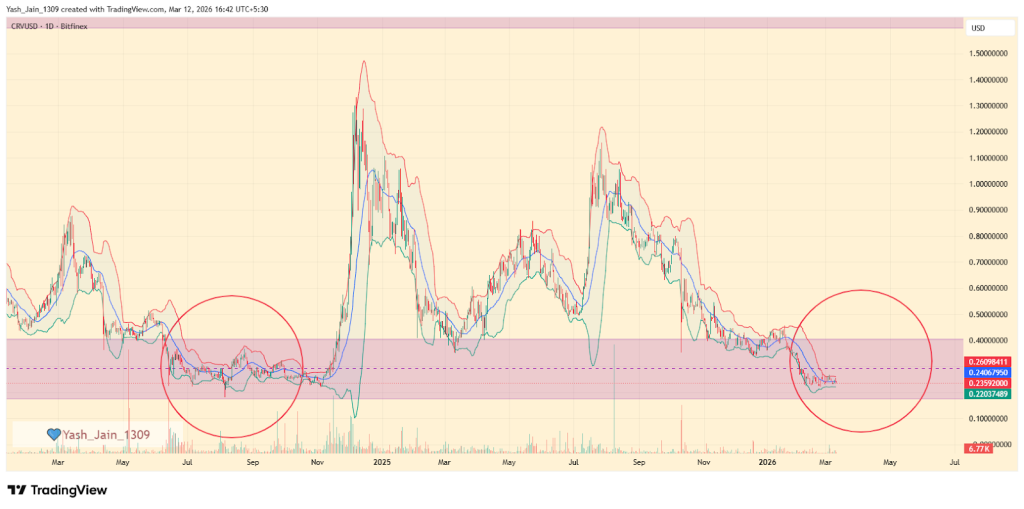
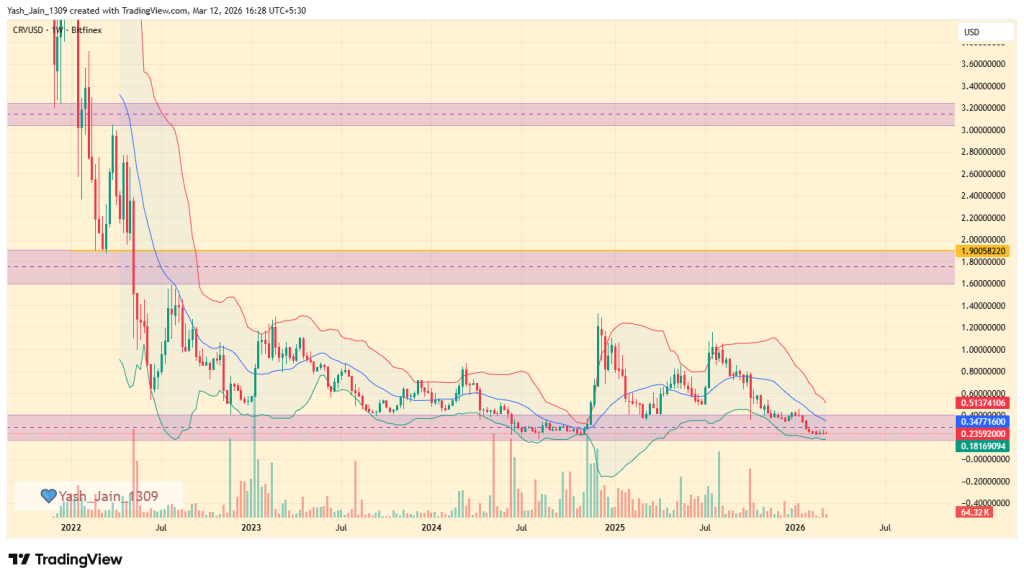
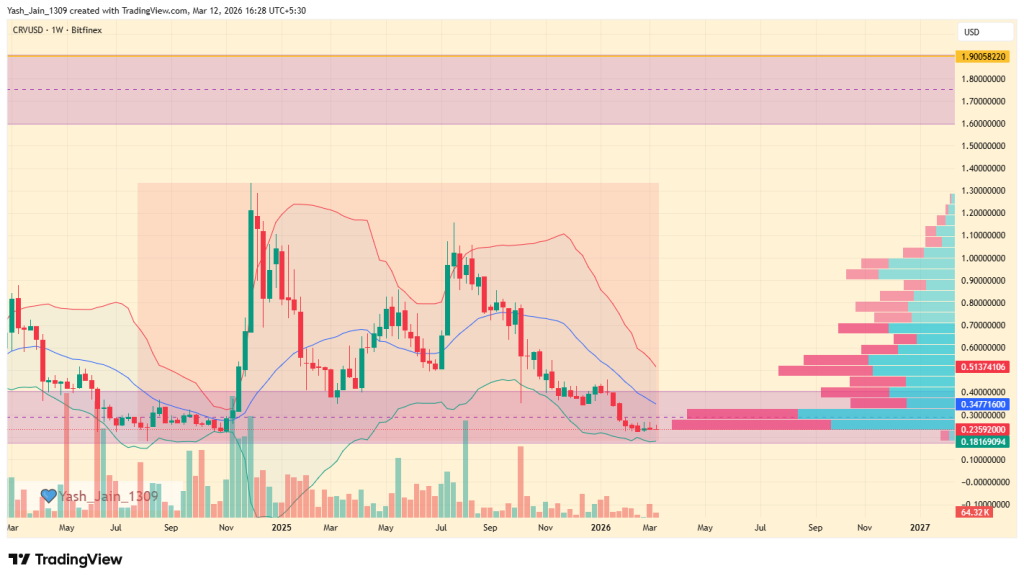
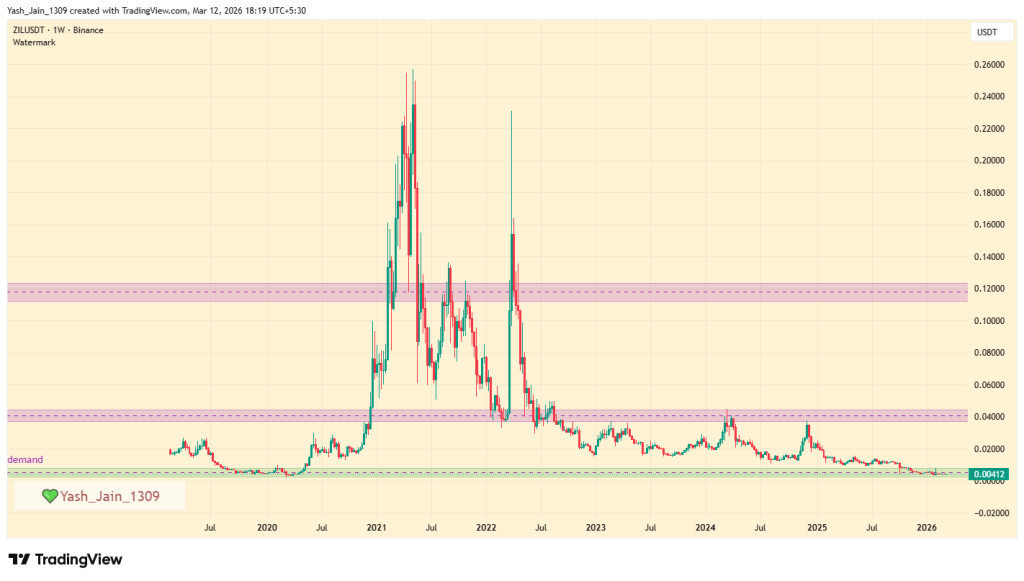
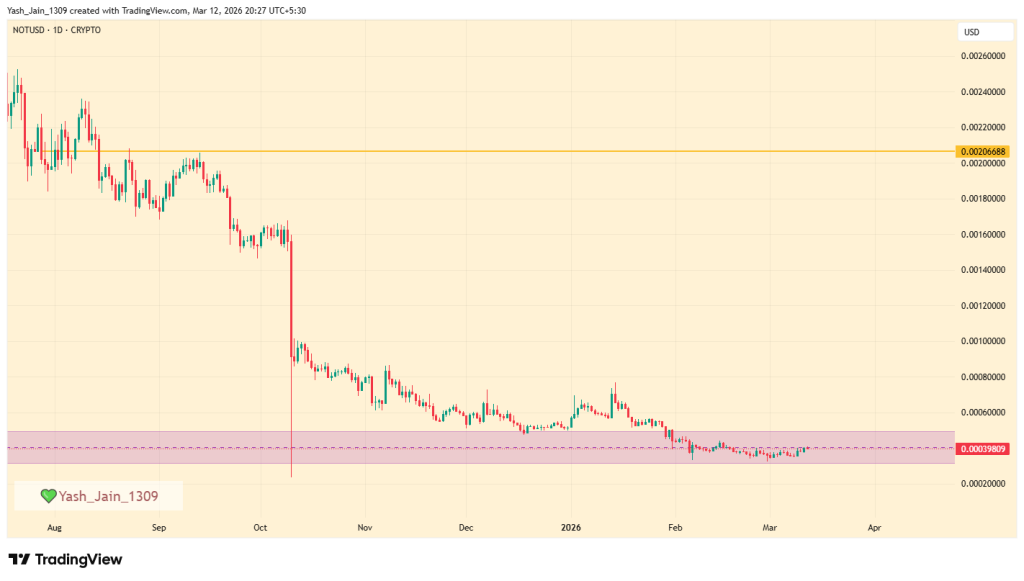

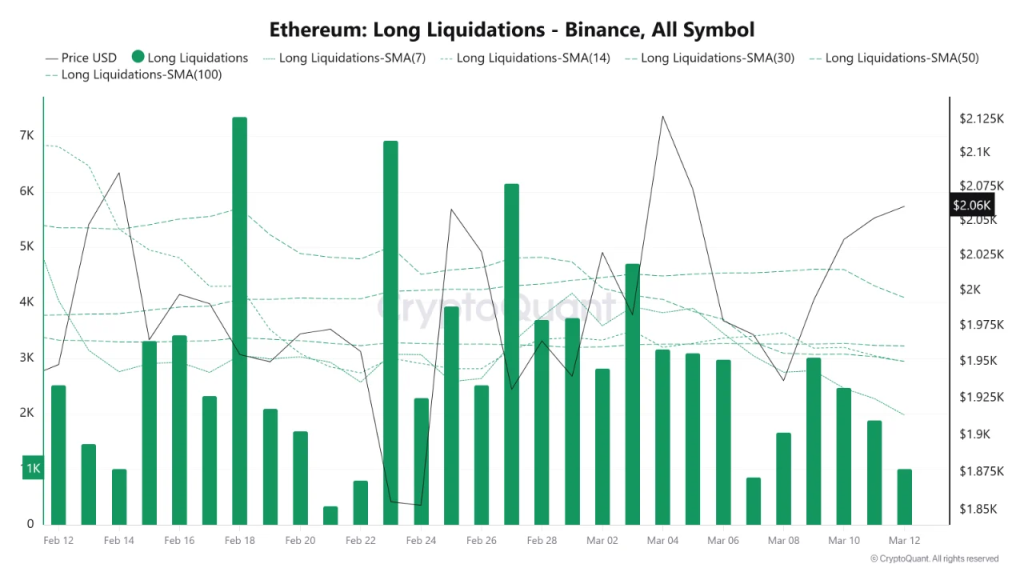
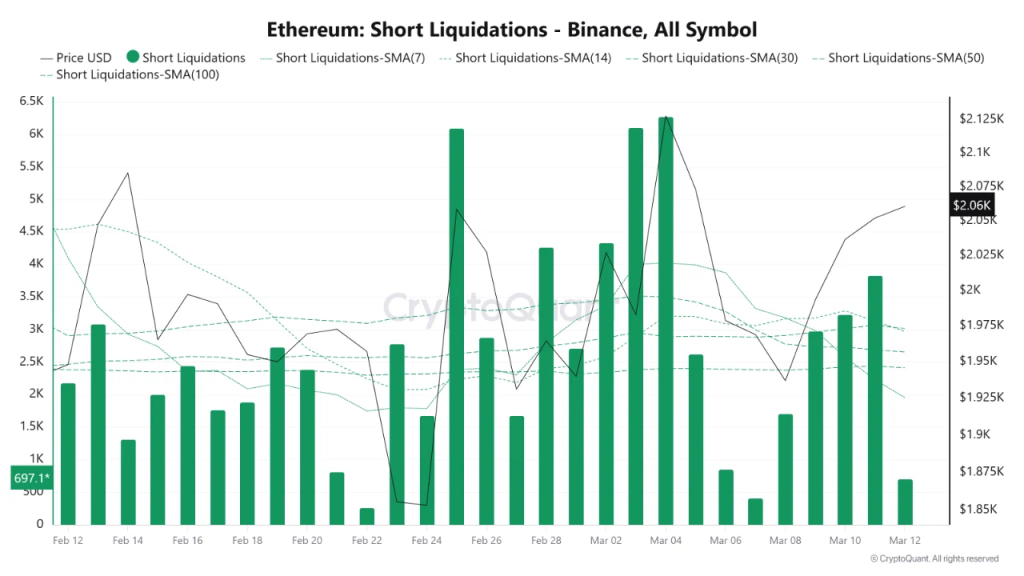
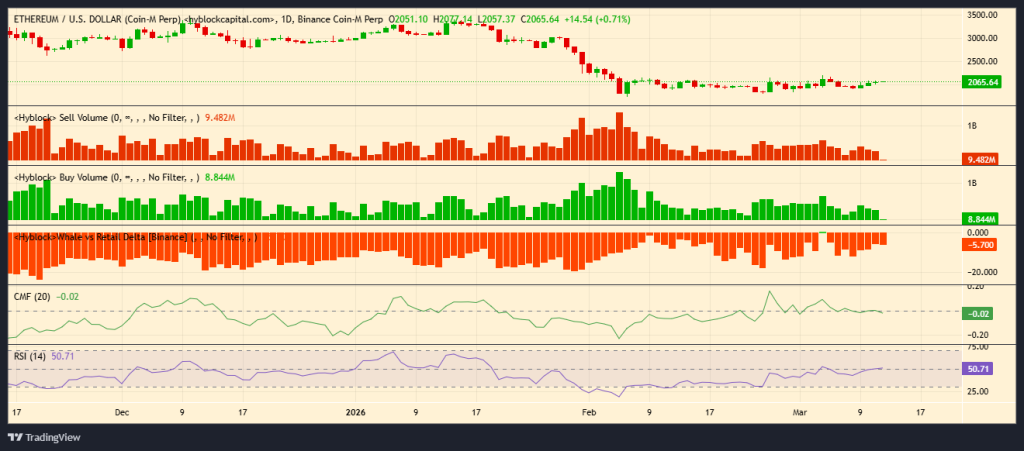

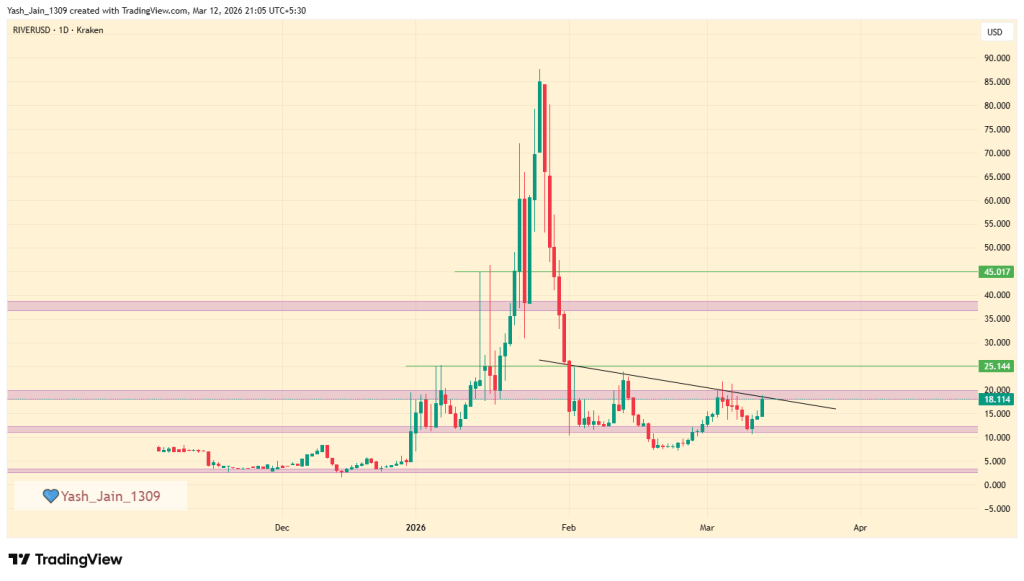
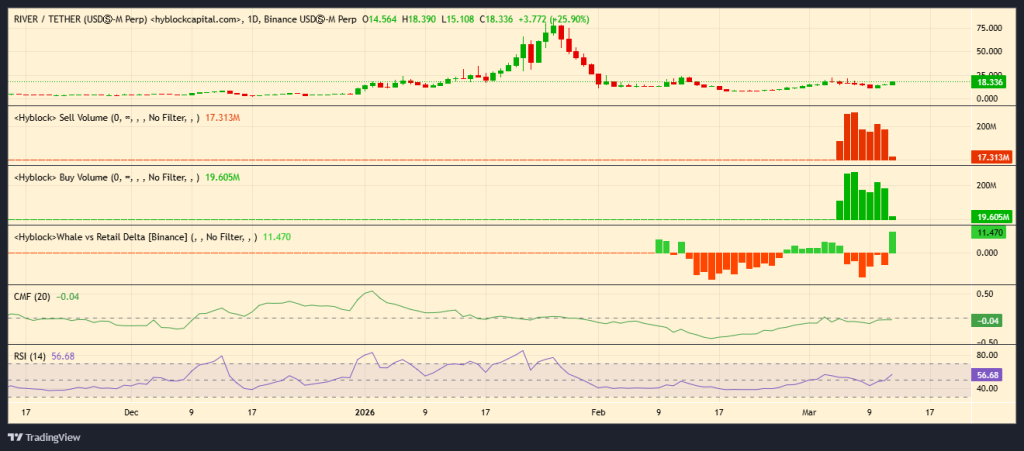
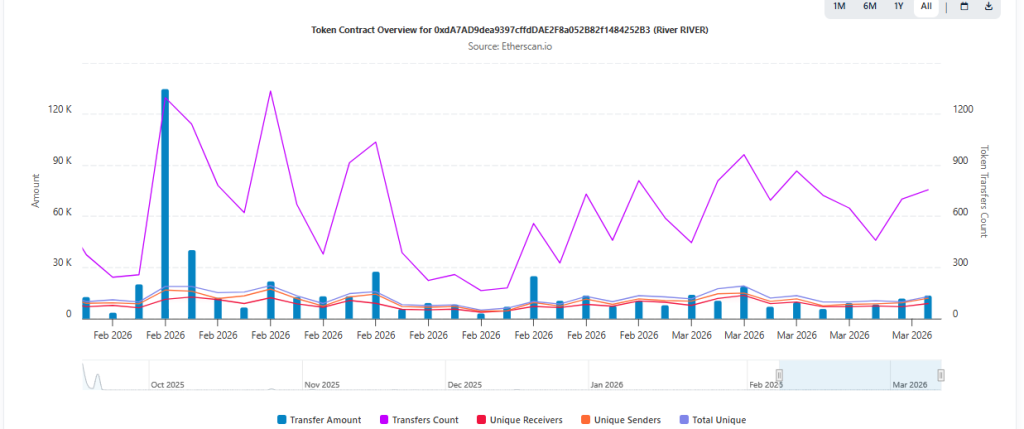

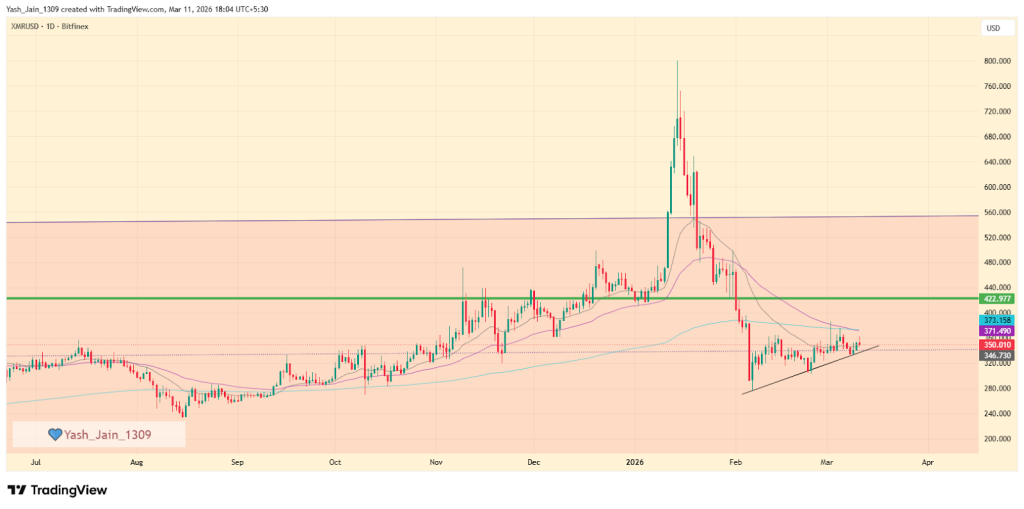
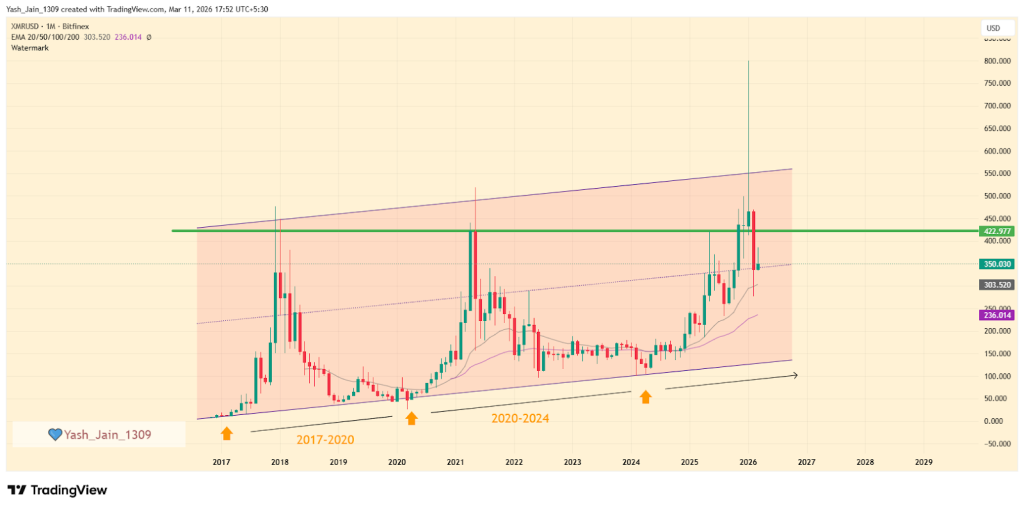
 Arthur Hayes says he would not invest in Bitcoin right now and would wait for the Fed to start money-printing, warning BTC could fall below $60,000 if geopolitical tensions persist.