Reading view

Ripple (XRP) Price Prediction 2026, 2027-2030: Will XRP Reach $5?

Ripple (XRP) Price Prediction

The post Ripple (XRP) Price Prediction 2026, 2027-2030: Will XRP Reach $5? appeared first on Coinpedia Fintech News

Story Highlights

  • The live price of the XRP is  $ 1.36068158.
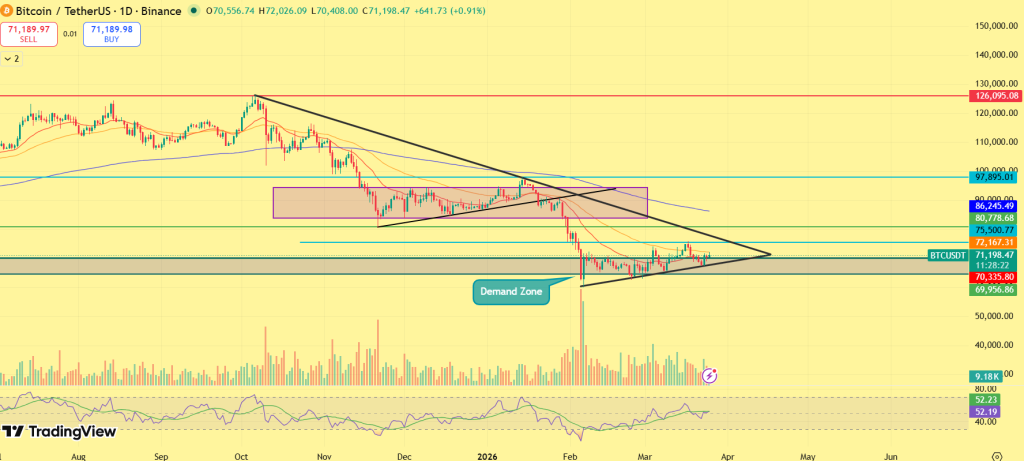
  • XRP holds a strong demand zone at $1.30–$1.40. If support remains intact, the token could shift from consolidation to recovery as broader crypto market momentum builds..
  • Long-term forecasts suggest XRP could reach $5–$6 by 2026 and potentially $18 by 2030, driven by institutional adoption, Ripple partnerships, and global payment integration

Ripple (XRP) Ripple’s XRP remains one of the most closely watched assets in the crypto market, largely due to its strong positioning in the cross-border payments sector and the continued expansion of Ripple’s financial infrastructure. Over the years, Ripple has focused on building partnerships with banks and payment providers to streamline international settlements through blockchain technology. XRP’s long-term outlook continues to revolve around global payment integration, institutional partnerships, and the adoption of RippleNet and On-Demand Liquidity solutions. These developments could gradually strengthen XRP’s role as a bridge asset for international payments.

XRP price structure around $1.30–$1.40 has emerged as an important demand zone where buyers have shown consistent interest. If this area continues to hold, the market could gradually shift from consolidation to recovery. With the broader crypto market entering another potential expansion phase, XRP remains positioned as one of the major altcoins that could benefit from renewed institutional and retail participation.Now, making this the most ideal time for XRP price prediction 2026-2030 to be in more focus. Read this to know in depth what’s coming next in XRP.

XRP Price Today

Cryptocurrency XRP
Token XRP
Price $1.3607 down -3.95%
Market Cap$ 83,470,444,954.37
24h Volume$ 1,881,552,499.5485
Circulating Supply61,344,583,754.00
Total Supply99,985,695,443.00
All-Time High$ 3.8419 on 04 January 2018
All-Time Low$ 0.0028 on 07 July 2014

Coinpedia’s XRP Price Prediction

Ripple’s XRP continues to maintain strong relevance in the cryptocurrency market due to its role in cross-border payments and financial infrastructure. If Ripple continues expanding its institutional partnerships and blockchain adoption grows globally, XRP could gradually regain stronger market momentum.

Coinpedia’s price outlook for Ripple highlights that  XRP could reach around $5–$6 by 2026, while a stronger market cycle and increased institutional usage could push the token toward $18 by 2030.

YearPotential Low ($)Potential Average ($)Potential High ($)
20263.406.509.50

XRP Price Prediction March 2026

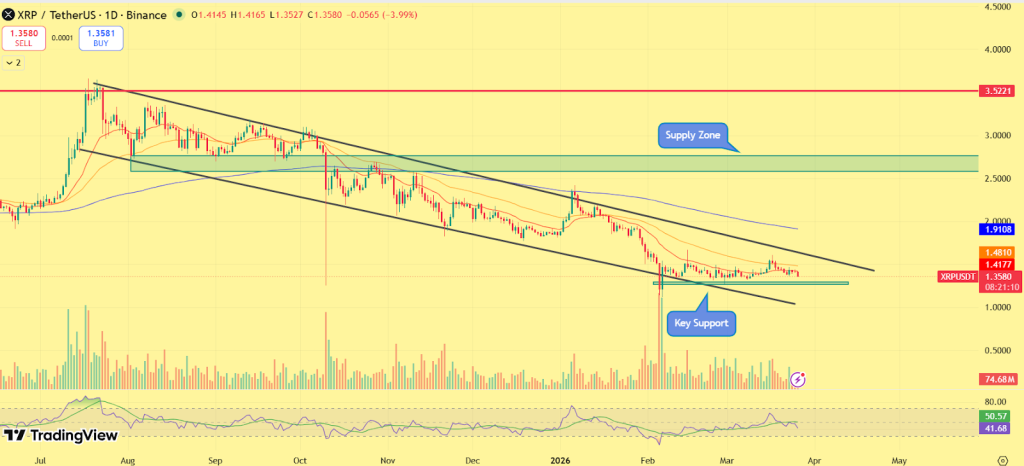
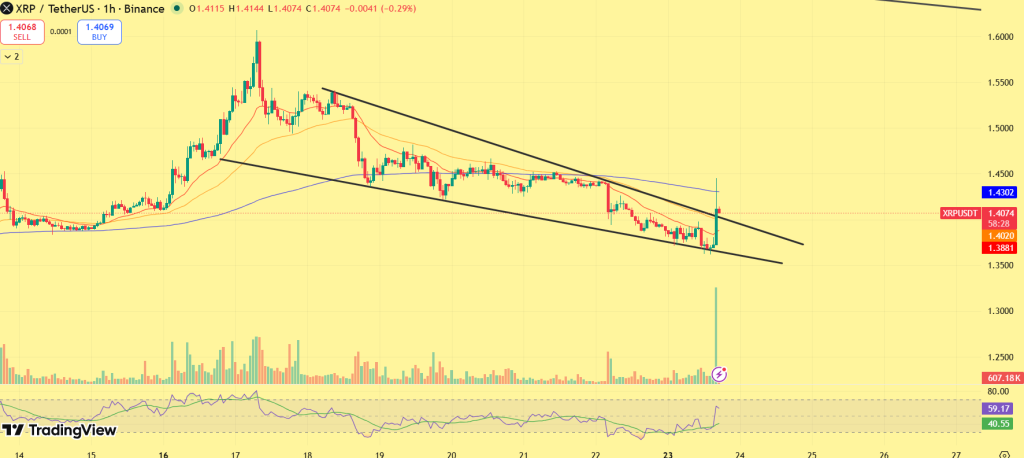
XRP is currently trading around $1.35, holding a steady range after recent volatility, and as March comes to an end, the price structure suggests a tight consolidation phase rather than a clear trend. Throughout March, XRP has struggled to sustain moves above the $1.40–$1.45 resistance zone, while buyers have consistently defended the $1.25–$1.30 support range. This behavior reflects a market where momentum is limited, but downside pressure is also being absorbed.

Heading into April, the key trigger remains a breakout above $1.45. If XRP manages to clear this level with strength, it could open the path toward the $1.60–$1.75 range, signaling a shift in momentum.

On the downside, if XRP loses the $1.25 support, the price may slip toward the $1.10–$1.15 zone, where the next demand area is likely to emerge. Overall, XRP appears to be in a range-bound accumulation phase, and the upcoming breakout from this structure will likely define its direction for April.

XRP Price Prediction 2026

Looking further into 2026, XRP’s growth potential will largely depend on the broader cryptocurrency market cycle and Ripple’s continued expansion in the financial sector. If Ripple strengthens its partnerships with global financial institutions and the adoption of blockchain-based payment infrastructure increases, XRP could gradually regain investor confidence. 

XRP Price Prediction 2026

Historically, major altcoins tend to perform strongly during bullish market cycles, and XRP has often been among the leaders during such periods.

From a technical perspective, reclaiming the $2 level would be the first signal of a stronger recovery. Once this level is established as support, XRP could move toward $3–$4, where significant resistance previously existed. If the broader market enters a strong expansion phase, XRP could potentially reach $5–$6 by the end of 2026, supported by increasing liquidity and institutional interest.

XRP On-Chain Outlook

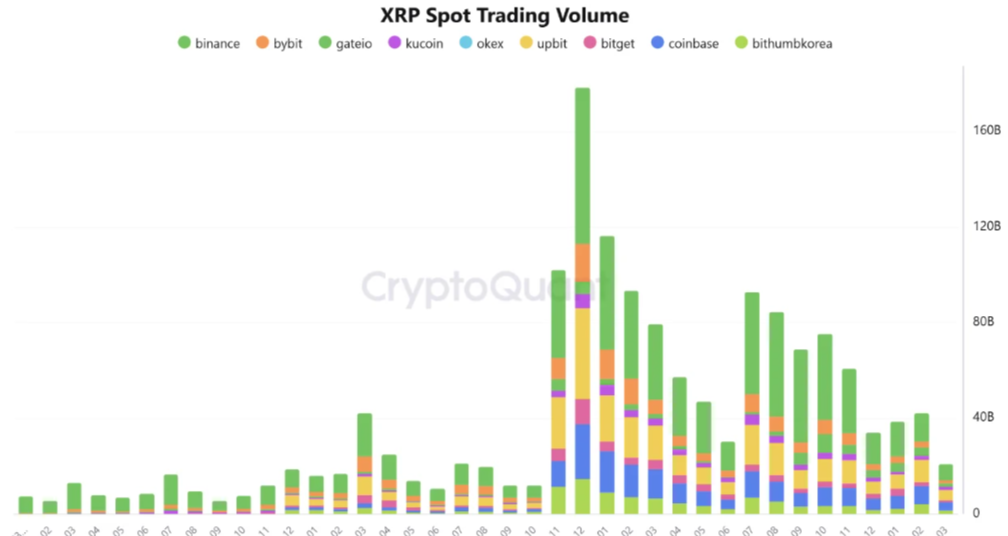
XRP’s on-chain data is currently pointing toward a cooling market environment, where activity has slowed but structural conditions are quietly improving. Spot trading volume across exchanges has dropped to its lowest level since 2024, reflecting reduced participation and weaker short-term momentum. This decline indicates that the market is no longer driven by aggressive trading, but is instead moving through a low-liquidity consolidation phase. At the same time, liquidity remains concentrated on major platforms like Binance, Upbit, and Coinbase, suggesting that while overall activity has declined, core market interest is still intact.

XRP On Chain Data

On the derivatives side, a more significant shift is unfolding. XRP’s leverage and open interest in Binance have dropped sharply, signaling a major reset in speculative positioning. The estimated leverage ratio has fallen substantially from previous highs, while open interest has cooled to much lower levels. This indicates that leveraged traders have largely exited or reduced exposure, removing excess risk from the market.

XRP Ledger

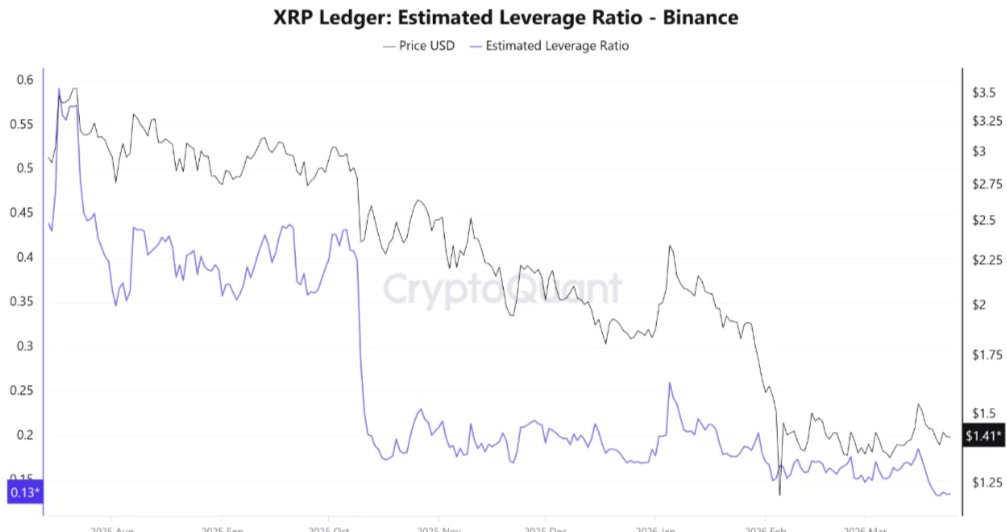
This combination of declining spot activity and reduced leverage suggests that XRP is transitioning from a highly speculative phase into a cleaner, more stable structure. With the market now less crowded and less prone to liquidation-driven volatility, the current setup reflects a reset phase, where pressure is building more gradually.

Overall, XRP’s on-chain signals point toward a market that is not weakening, but resetting after excess, creating conditions that often precede a more sustainable and directional move once momentum returns.

Ripple (XRP) Price Prediction 2026 – 2030

YearPotential Low ($)Potential Average ($Potential High ($)
20263.406.509.50
20277.5010.0012.00
20288.8011.5016.00
202914.2019.0022.00
203018.8023.0030.00

Ripple (XRP) Price Prediction 2026

The XRP price range in 2026 is expected to be between $3.40 and $9.50

XRP Price Prediction 2027

Ripple (XRP) price range can be between $7.50 to $12.00 during the year 2027. 

XRP Price Forecast 2028

In 2028, Ripple is forecasted to potentially reach a low price of $8.80, an average price of $11.50, and a high price of $16.00.

XRP Price Targets 2029

Thereafter, the XRP price for the year 2029 could range between $14.20  and $22.00.

Ripple (XRP) Price Prediction 2030

Finally, in 2030, the price of XRP is predicted to remain steady and positive. It may trade between $18.80 and $23.00.

Ripple (XRP) Price Projection 2031, 2032, 2033, 2040, 2050

Based on historical market sentiment and trend analysis, the following are the possible XRP price targets for longer-term time frames.

YearPotential Low ($)Potential Average ($)Potential High ($)
203125.0029.5035.25
203231.5036.7541.25
203335.7542.2547.75
204097.50135.50179.00
2050219.25331.50526.00

Market Analysis

Year202620272030
Changelly$3.00$6.50$17.76
DigitalCoinPrice$4.20$7.50$18.00
WalletInvestor$4.80$7.90$20.00
Never Miss a Beat in the Crypto World!

Stay ahead with breaking news, expert analysis, and real-time updates on the latest trends in Bitcoin, altcoins, DeFi, NFTs, and more.

FAQs

What is the XRP price prediction for 2026?

XRP could trade between $3 and $6 in 2026 if crypto market momentum strengthens and Ripple expands partnerships with banks using RippleNet and ODL.

How high will XRP go in 2030?

XRP could potentially reach $18–$30 by 2030 if the crypto market enters a strong bull cycle and Ripple expands global payment partnerships.

What is the price prediction for XRP in 2031?

Market projections suggest XRP could trade around $25–$35 in 2031, depending on global crypto adoption and Ripple’s continued growth in payment infrastructure.

How much will 1 XRP be worth in 2040?

If adoption of blockchain payments grows and Ripple strengthens its financial network, XRP could trade between $97 and $179 by 2040.

How much will 1 XRP be worth in 2050?

Long-term projections indicate XRP could reach $219–$526 by 2050 if blockchain payment networks become widely used across global financial systems.

What could drive XRP’s price growth long term?

XRP’s long-term growth may depend on global payment adoption, institutional partnerships, and wider use of Ripple’s blockchain infrastructure.

Is XRP a good investment?

XRP may be a promising investment due to its role in cross-border payments and growing institutional adoption, but price volatility and regulation risks remain.

Cardano Price Nearing a Major Reversal? Key Indicators Signal Bottom Formation

Cardano Price Prediction Is ADA About to Skyrocket as Whales Accumulation Signals Major Rally Ahead

The post Cardano Price Nearing a Major Reversal? Key Indicators Signal Bottom Formation appeared first on Coinpedia Fintech News

Cardano price may be flashing one of its strongest reversal signals in months, and most of the market is still looking the other way. As sentiment sinks deeper into fear, on-chain data shows holders sitting on heavy losses, while smart money quietly flips bullish. At the same time, derivatives positioning is shifting fast, with top traders aggressively building long exposure. Historically, this combination has marked key turning points, not continuation phases.

With price compressing and pressure building, the setup is clear, Is ADA price about to catch the market off guard with a sharp breakout?

On-Chain Data Signals Deep Undervaluation

Recent on-chain data highlight a critical development: Cardano’s MVRV (Market Value to Realized Value) has dropped sharply into negative territory, with average wallets sitting at significant unrealized losses. Historically, such extreme negative MVRV levels have aligned with accumulation phases, where long-term investors begin to step in as risk-reward improves. The logic is straightforward, when the majority of holders are at a loss, selling pressure tends to exhaust, creating conditions for a potential trend reversal.

Cardano price chart

In previous market cycles, similar setups have often marked macro bottoms or early-stage recovery zones, making the current structure particularly noteworthy from a risk-adjusted perspective.

Binance Traders Flip Bullish on ADA

Adding to the bullish narrative, derivatives data from Binance reveals a clear shift in positioning among top traders. Long positions in ADA have increased sharply, rising by nearly 10% within just a few days, signaling growing confidence among experienced market participants. At the same time, broader funding rate data shows an unusually high concentration of short positions in the market. This imbalance creates conditions for a potential short squeeze, where any upward price movement could force short sellers to cover positions, accelerating upside momentum.

ADA on-chain data

This divergence between retail pessimism and smart money positioning often acts as an early signal of trend shifts, particularly when combined with supportive on-chain metrics.

Cardano Price Analysis: ADA Coils at Key Breakout Zone as Pressure Builds

Cardano’s price structure is now entering a decisive phase, where compression is nearing its resolution point. After a prolonged downtrend, ADA has transitioned into a tight symmetrical consolidation, reflecting a balance between buyers stepping in and sellers gradually losing control.

Cardano price chart

The $0.25–$0.26 support level has acted as a strong base, absorbing selling pressure despite broader market weakness. On the upside, ADA continues to face a firm supply barrier around $0.33–$0.34, a level that has rejected multiple breakout attempts. This repeated rejection confirms it as a critical liquidity zone where sellers remain active. 

However, the narrowing price action suggests that this resistance is being tested under increasing pressure. A decisive move above this region could trigger a shift in market structure, opening the path toward $0.42–$0.45, where the next major resistance cluster lies. If ADA fails to hold above the $0.25 support, the bullish thesis weakens, potentially exposing downside toward lower liquidity zones. However, as long as price continues to hold and compress within this range, the probability of an upside breakout gradually increases.

FAQs

Why is Cardano (ADA) showing a potential reversal signal?

ADA’s MVRV is deeply negative, signaling holders’ losses may exhaust selling pressure and smart money is starting to accumulate.

What is Cardano (ADA) price prediction for 2026?

ADA may rise if $0.25 support holds and buyers push past $0.34 resistance, potentially targeting $0.42–$0.45 in the near term.

Is Cardano a good buy during the current market dip?

With negative MVRV and smart money accumulating, ADA shows strong risk-reward potential for buyers seeking early-stage recovery opportunities.

What technical levels should traders watch for Cardano?

Key levels: support $0.25–$0.26, resistance $0.33–$0.34. Breaking resistance may open the path to $0.42–$0.45, confirming bullish momentum.

FET Price Breakout Incoming? Whale Buying and OBV Flash Bullish Signal

FET Bullish Divergence Hints at 45% Surge, Buy Signal

The post FET Price Breakout Incoming? Whale Buying and OBV Flash Bullish Signal appeared first on Coinpedia Fintech News

While most of the market remains distracted, FET’s on-chain data and technical indicators are aligning in a way that often precedes major breakouts. A recent multi-million dollar whale accumulation, combined with a strong signal from the On-Balance Volume (OBV) indicator, suggests that smart money may already be positioning. With price beginning to recover from its base and momentum slowly building, the big question now is, is FET price about to surprise the market with a sharp upside rally?

Whale Accumulation Signals Growing Confidence

Fresh on-chain data reveals that a whale has accumulated 914 million FET tokens worth approximately $2.34 million from Binance, alongside additional altcoin purchases. Such large-scale accumulation typically reflects growing conviction among high-net-worth participants, especially when it occurs after a prolonged consolidation phase. Historically, whale buying at lower levels has often preceded strong upward moves, as large players tend to position early before momentum becomes obvious to the broader market. 

FET whale data

The timing of this accumulation suggests that institutional or smart money interest in FET may be increasing, particularly as AI-related narratives regain traction in the crypto space. This development is critical because it indicates that despite recent market uncertainty, capital is selectively flowing into high-potential assets, with FET emerging as one of the key beneficiaries.

OBV Indicator Flashes Bullish Divergence

Adding further weight to the bullish case is the behavior of the On-Balance Volume (OBV) indicator. According to market analysts, OBV is showing a steady rise even when price action has remained relatively subdued. This type of divergence is often interpreted as a leading signal of accumulation, where buying pressure builds beneath the surface before reflecting in price. In simpler terms, volume is increasing in favor of buyers, even though price has yet to fully respond.

FET price chart

Such setups have historically preceded strong breakouts, as latent demand eventually pushes price higher once resistance levels are tested. The current OBV structure suggests that FET may be in the early stages of this process.

FET Price Action Points to Recovery Structure

FET price appears to be transitioning out of a downtrend into a recovery phase. The chart shows that price has formed a base and is now attempting to move higher, supported by improving momentum. A key observation is the formation of a higher low structure, indicating that selling pressure is gradually weakening. At the same time, price is approaching a critical resistance zone, which could act as the trigger point for the next major move.

If bulls manage to sustain momentum and break above this resistance, it could open the door for a sharp continuation toward higher levels, aligning with the signals observed in both on-chain data and volume indicators.

Key Levels to Watch

In the near term, immediate support is seen around the recent higher low region around $0.2200, which is acting as a foundation for the current recovery. Holding this level will be crucial to maintaining bullish structure. On the upside $0.2500, the primary resistance zone lies ahead, and a confirmed breakout above this level could accelerate momentum significantly toward $0.2700 followed by $0.2900. If this breakout occurs with strong volume confirmation, it may validate the ongoing accumulation narrative and trigger a broader rally.

FAQs

Is FET a good investment right now?

FET shows early bullish signs with whale accumulation and rising OBV. While promising, it remains volatile, so traders should confirm breakouts before entering.

What does whale accumulation mean for FET price?

Whale accumulation often signals confidence from large investors. It can precede price rallies, as big players typically position before momentum becomes visible.

Can FET trigger a breakout soon?

Yes, if momentum continues and resistance breaks with volume. Current structure, OBV divergence, and whale activity all point toward a potential breakout setup.

What is FET price prediction for 2026?

FET price predictions for 2026 vary widely, with estimates ranging from $0.20 to $0.55 on average, while bullish scenarios could reach $1+ depending on AI adoption and market trends.

TRUMP Coin in Trouble? $23M Whale Move Hints at Sell-Off as Price Faces Breakdown Risk

Whales Are Accumulating TRUMP as Price Soars 30% Here’s What Data Shows

The post TRUMP Coin in Trouble? $23M Whale Move Hints at Sell-Off as Price Faces Breakdown Risk appeared first on Coinpedia Fintech News

A sudden $23 million on-chain transfer has put the Official TRUMP memecoin ($TRUMP) back under the spotlight, but this time, for the wrong reasons.

The move, traced to wallets linked with internal allocations, comes at a moment when price is already struggling below critical resistance. Historically, such transfers have often preceded exchange inflows and sharp volatility spikes, raising concerns of a potential sell-off. 

With price structure weakening and whale activity surging, the market now faces a crucial question. Is the TRUMP coin preparing for a breakdown, or is this a calculated shakeout before the next rally?

Whale Movement Triggers Market Speculation

On-chain data reveals that approximately $23 million worth of $TRUMP tokens was moved from a team-associated wallet into a fresh address, a pattern that typically signals preparation for redistribution. While no direct exchange inflow has been confirmed yet, the market rarely waits for confirmation in such cases. Historically, similar high-value transfers have led to increased circulating supply once tokens hit exchanges, often triggering short-term price pressure. The timing of this move, combined with an already fragile technical setup, has amplified bearish expectations across the market.

$TRUMP: HUGE TRANSFER

$23M worth of tokens were transferred from a wallet associated with the team to a fresh wallet, from which we can potentially expect further withdrawals to exchanges.

We are tracking both of these wallets to stay informed of new movements, as only a… pic.twitter.com/iEP7LPzqNc

— onchainschool.pro (@how2onchain) March 25, 2026

At the same time, whale metrics paint a more complex picture. The number of large holders has climbed to a multi-month high, suggesting that accumulation may be quietly taking place. This divergence, where potential distribution meets rising accumulation, creates a high-stakes environment, often leading to sharp and unpredictable price swings.

TRUMP Coin Price Retest Support Zone: Rebound or Breakdown?

The TRUMP coin is showing clear signs of weakness. The asset continues to trade within a descending structure, marked by consistent lower highs, a classic indication of bearish control. The most critical level remains the $3.80 to $4.00 resistance zone, where price has faced repeated rejection. Each failed breakout attempt has strengthened this zone as a supply barrier, with sellers aggressively defending higher levels. As a result, bullish momentum has been unable to sustain, keeping the broader trend under pressure.

Trump coin price chart

Currently, the TRUMP coin price is hovering near the $3.10 support level, a zone that has provided temporary stability. However, the absence of strong buying continuation suggests that demand remains weak. Volume patterns further indicate that recent moves may be driven more by distribution than accumulation, reinforcing the cautious outlook.

Key Levels to Watch

The immediate structure places strong emphasis on the $3.00–$3.10 support zone, which now acts as a critical line of defense. A breakdown below this level could accelerate downside momentum, potentially pushing price toward the $2.60–$2.80 demand zone, where stronger buyer interest may emerge. On the upside, recovery depends on reclaiming the $3.50–$3.60 region, which would signal short-term strength returning. However, a full bullish shift would require a decisive breakout above the $3.80 resistance, a level that has consistently capped upside attempts.

Ethereum Classic (ETC) Price Prediction 2026, 2027-2030: Forecast, Targets & Future Outlook

Ethereum Classic (ETC) Price Prediction

The post Ethereum Classic (ETC) Price Prediction 2026, 2027-2030: Forecast, Targets & Future Outlook appeared first on Coinpedia Fintech News

Story Highlights

  • The live price of the ETC crypto is  $ 8.45733595.
  • Price predictions for 2026 range from $30.00 to $80.00.
  • Long-term outlook suggests gradual growth potential to approach $300 by 2030.

Ethereum Classic (ETC) is a Layer-1 blockchain that preserves the original Ethereum chain, maintaining a strong focus on immutability and decentralized principles. 

Unlike Ethereum, which transitioned to proof-of-stake, Ethereum Classic continues to operate on a proof-of-work consensus, making it one of the few major smart contract platforms still relying on mining. 

From a market standpoint, ETC is considered a legacy smart contract asset with cyclical relevance rather than continuous ecosystem-driven growth. Its price action is often influenced by broader market sentiment, proof-of-work narratives, and Bitcoin-led momentum. 

As ETC trades near long-term historical lows, its forward price outlook becomes increasingly sensitive to the recovery phase in the wider crypto market.

As Ethereum Classic (ETC) price hangs around the demand zone of $10, its price behaviour and network fundamentals have positioned it as a speculative yet structurally resilient asset to track into 2026 and beyond.

Ethereum Classic Price Today

Cryptocurrency Ethereum Classic
Token ETC
Price $8.4573 down -2.64%
Market Cap$ 1,319,741,634.06
24h Volume$ 54,671,634.2634
Circulating Supply156,046,968.2035
Total Supply210,700,000.00
All-Time High$ 176.1577 on 06 May 2021
All-Time Low$ 0.4524 on 25 July 2016

CoinPedia’s ETC Price Prediction

Coinpedia’s price prediction for ETC is neutral to bullish. However, Ethereum Classic’s long-term outlook depends largely on its ability to retain relevance as a proof-of-work smart contracts network.

Moreover, Ethereum Classic’s long-term growth is likely to remain cyclical and sentiment-driven, with price expectations closely tied to broader market recoveries rather than organic adoption alone

CoinPedia expects that the ETC price will reach $80.00 by the year-end. 

On the downside,, if ETC price sees a downtrend in the upcoming months, it may collapse the coin’s price to $30.00.

YearPotential Low ($)Potential Average ($)Potential High ($)
202630.0045.0080.00

ETC Price Prediction March 2026

Ethereum Classic is currently trading near $8.70, where the price is attempting to stabilize after a prolonged downward trend. The recent structure suggests that ETC has entered a late-stage consolidation phase, with volatility compressing and price holding near a key base zone.

As March approaches its end, ETC is hovering just above the $8.40–$8.60 support region, which has started to act as a short-term demand zone. The repeated defense of this level indicates that sellers are losing momentum, while buyers are gradually stepping in to absorb supply.

Heading into early April, the price is likely to test the immediate resistance near $9.20–$9.50, which aligns with previous rejection zones. A sustained move above this range would be the first signal of a potential structure shift, opening the path toward $10.50–$11.50, where stronger resistance is expected. If momentum continues to build alongside broader market stability, ETC could extend toward $12–$13, marking a transition from consolidation into early recovery. However, if the price fails to hold above the $8.40 support, the structure could weaken again, leading to a potential drop toward $7.50–$7.80, where deeper demand may emerge.

Overall, the period between late March and early April appears to be a decision phase, where ETC is attempting to move out of its prolonged downtrend and establish a base for recovery.

Ethereum Classic Price Prediction 2026

Looking at the broader 2026 outlook, Ethereum Classic appears to be in the early stages of rebuilding after an extended correction cycle. The current structure suggests that the market is transitioning from accumulation toward a gradual recovery phase, although momentum is still developing. For ETC to confirm a stronger shift in trend, the price would need to reclaim the $12–$14 range, which represents a key structural resistance zone. A sustained move above this level would indicate that buyers are regaining control and that the recovery phase is strengthening.

Ethereum Classic Price Prediction 2026

Once this zone is secured, the price could gradually move toward $18–$22, where significant resistance is expected due to previous supply zones. This area will act as a major test for continuation, as it reflects a transition from recovery into expansion.

If broader market conditions turn supportive and capital flows back into mid-cap altcoins, ETC could extend its upside toward $25–$30, representing a more mature phase of the recovery cycle. At the same time, if ETC struggles to maintain support above the $8–$7.5 region, the recovery could be delayed, keeping the asset in a prolonged sideways structure before any meaningful breakout occurs.

In essence, 2026 is likely to unfold as a gradual rebuilding phase for Ethereum Classic, where price action shifts from consolidation into a structured uptrend, with upside developing progressively rather than through an immediate rally.

YearPotential Low ($)Potential Average ($)Potential High ($)
ETC Price Prediction 202630.0045.0080.00

ETC Crypto Price Prediction 2026 – 2030

YearPotential Low ($)Potential Average ($Potential High ($)
202630.0045.0080.00
202740.0080.00100.00
202880.00100.00150.00
2029130.00180.00220.00
2030200.00220.00300.00

Ethereum (ETC) Classic Price Prediction 2026

The ETC price range in 2026 is expected to be between $30.00 and $80.00.

ETC Crypto Price Prediction 2027

Ethereum Classic (ETC) price range can be between $40.00 to $100.00 during the year 2027. 

Ethereum Classic Token Price Forecast 2028

In 2028, Ethereum Classic is forecasted to potentially reach a low price of $80.00, an average price of $100.00, and a high price of $150.00.

ETC Price Forecast 2029

Thereafter, the ETC price for the year 2029 could range between $130.00  and $220.00.

Ethereum Classic Price Prediction 2030

Finally, in 2030, the price of ETC is predicted to maintain a steady positive. It may trade between $200.00 and $300.00.

ETC Price Prediction 2031, 2032, 2033, 2040, 2050

Based on the historic market sentiments and trend analysis of the largest cryptocurrency by market capitalization, here are the possible ETC price targets for the longer time frames.

YearPotential Low ($)Potential Average ($)Potential High ($)
2031250.00350.00500.00
2032320.00400.00600.00
2033480.00650.00770.00
2040800.00980.001200.00
20501200.001500.002000.00

ETC Price Prediction: Market Analysis?

Year202620272030
Changelly$25$45.00$70.00
CoinCodex$18.00$29.00$50.00
Binance$35.00$50.00$80.00
Never Miss a Beat in the Crypto World!

Stay ahead with breaking news, expert analysis, and real-time updates on the latest trends in Bitcoin, altcoins, DeFi, NFTs, and more.

FAQs

What is Ethereum Classic (ETC) and how is it different from Ethereum?

Ethereum Classic is the original Ethereum blockchain that runs on proof-of-work, prioritizing immutability, unlike Ethereum’s proof-of-stake model.

What is the Ethereum Classic price prediction for 2026?

ETC is projected to trade between $30 and $80 in 2026, depending on market recovery, Bitcoin momentum, and proof-of-work demand.

What is the Ethereum Classic price prediction for 2027?

Ethereum Classic is expected to trade between $40 and $100 in 2027, driven by cyclical market recovery and renewed interest in proof-of-work assets.

What is the Ethereum Classic price prediction for 2028?

In 2028, ETC may range from $80 to $150 as broader crypto adoption and long-term accumulation phases support higher valuations.

What is the Ethereum Classic price prediction for 2030?

By 2030, Ethereum Classic could trade between $200 and $300 if long-term market growth and proof-of-work relevance continue.

What is the Ethereum Classic price prediction for 2040?

Long-term projections suggest ETC could reach $800 to $1,200 by 2040, assuming sustained crypto market expansion and legacy chain demand.

Bitcoin (BTC) Price Prediction 2026, 2027 – 2030: How High Will BTC Price Go?

Bitcoin Price Prediction

The post Bitcoin (BTC) Price Prediction 2026, 2027 – 2030: How High Will BTC Price Go? appeared first on Coinpedia Fintech News

Story Highlights

  • Bitcoin is currently trading at: $ 70,044.84668093
  • Bitcoin holds strong near $70K in 2026, signaling accumulation. A breakout above $75K could drive BTC toward $120K–$150K this cycle.
  • BTC remains range-bound between $67K–$75K, with strong demand below. Analysts predict a bullish expansion toward $150K+ before 2026 ends.
  • Bitcoin’s consolidation phase in 2026 reflects accumulation, not weakness, with long-term forecasts targeting $250K+ and up to $900K by 2030.

Three months into 2026, Bitcoin price continues to hover around the $70K–$71K zone, and the market is starting to realize that this isn’t weakness, it’s a phase of positioning. Despite multiple attempts, BTC has struggled to sustain moves above the $72K–$75K resistance, while every dip toward the $67K–$69K range is being absorbed quickly. This behavior reflects a market where selling pressure is no longer dominant, but buyers are also not chasing price aggressively. At the same time, capital rotation across the crypto market remains selective. 

Large-cap assets like Bitcoin continue to hold relatively stable, while broader participation remains uneven, a pattern often seen when the market is rebalancing rather than trending. What’s also notable is the steady demand during dips. Recent price action shows consistent buying interest near support, suggesting that stronger hands are gradually building positions, while the lack of breakout continuation indicates that liquidity above remains heavy.

This push-and-pull dynamic has resulted in a tight compression structure, where volatility continues to contract and price action becomes increasingly controlled. Such phases don’t reflect weakness, they reflect preparation. With Bitcoin spending extended time within this range, the structure suggests that the market is building pressure near a key inflection zone, where the next move could define the broader trend for the months ahead.

With that in focus, let’s move into Bitcoin’s price prediction for 2026 and understand what lies ahead.

Coinpedia’s BTC Price Prediction 2026

Coinpedia’s price prediction suggests that Bitcoin is currently in a transitional phase, cooling off after its 2025 peak while holding a long-term bullish structure. The ongoing consolidation near $70K reflects a reset in momentum rather than a breakdown, with the market rebalancing before its next move. While short-term volatility may persist, BTC could gradually recover, with potential to reach $120K–$150K+ in 2026, as the cycle shifts toward expansion.

Bitcoin Price Today

Cryptocurrency Bitcoin
Token BTC
Price $70,044.8467 down -1.30%
Market Cap$ 1,401,110,080,087.11
24h Volume$ 35,569,529,773.5318
Circulating Supply20,003,043.00
Total Supply20,003,043.00
All-Time High$ 126,198.0696 on 06 October 2025
All-Time Low$ 0.0486 on 14 July 2010

Bitcoin March Price Prediction 2026

Bitcoin’s recent price action clearly shows a range-bound structure, with price oscillating between $67K–$75K over the past few weeks.

On the downside, the $67K–$69K zone continues to act as a strong demand area, where buyers are consistently stepping in and preventing deeper corrections. Each dip into this region is being absorbed quickly, indicating that downside momentum remains limited.

On the upside, Bitcoin is facing repeated rejection near the $72K–$75K resistance zone. Despite multiple attempts, the price has failed to sustain above this level, suggesting that supply remains active and breakout momentum is still lacking. This behavior reflects a tight compression phase, where volatility is shrinking and price is getting squeezed between support and resistance. If Bitcoin manages to break above the $75K level, it could trigger a momentum shift toward the $80K–$85K range, potentially opening the door for further upside expansion.

However, if BTC fails to hold the $67K support, the price may revisit the $62K–$64K zone, aligning with previous demand levels. Overall, Bitcoin price is currently in a range-bound accumulation phase, and the longer it continues within this structure, the stronger the eventual breakout is likely to be.

Bitcoin Price Prediction 2026

Bitcoin’s price structure in 2026 points toward a transition year, where the market is gradually shifting from consolidation into expansion rather than entering a fresh bearish phase.

The first key trigger remains the $75K–$80K range. A sustained reclaim of this zone would indicate strengthening momentum, allowing BTC to move toward the $90K–$100K region, where the next resistance is likely to emerge. If price stabilizes above this level, it would confirm a shift out of the current range, opening the path toward the $110K–$130K zone in the later part of the year. 

At the same time, external uncertainties continue to keep the upside controlled. Periodic spikes in geopolitical tensions, sudden liquidity shifts, and risk-off reactions across global markets are creating intermittent pressure, preventing immediate breakout continuation. This is one of the key reasons why Bitcoin, despite holding strong support, is still struggling to trend decisively.

Bitcoin Price Prediction 2026

However, what stands out is the consistency in demand. Every dip toward lower levels is being absorbed, suggesting that the market is building a base rather than weakening. This kind of structure typically forms before expansion, especially when downside follow-through remains limited. On the downside, failure to hold the $67K support zone could trigger a temporary correction toward the $60K–$62K region. But unless this level breaks decisively, the broader structure remains intact.

Overall, 2026 is shaping up as a rebuilding and controlled expansion phase, where Bitcoin is stabilizing under external pressure while gradually preparing for its next major move.

Bitcoin Price On-chain Outlook

Bitcoin’s on-chain data is currently reflecting a strong shift in supply dynamics and holder behavior, aligning closely with the ongoing range-bound structure on the chart. One of the most notable developments is the decline in Bitcoin reserves on major exchanges like Binance, which have dropped to their lowest levels since the start of 2026. This reduction in available supply suggests that coins are increasingly being moved off exchanges into cold storage or long-term holdings, effectively reducing immediate selling pressure in the market. 

BTC Exchange Reserve Binance

At the same time, a contrasting trend is visible on platforms like Upbit, where reserves have climbed to their highest levels since 2024. This divergence highlights a shift in liquidity distribution, where global supply is tightening while regional trading activity, particularly in the Korean market, is increasing, often acting as an early signal of rising demand or short-term volatility.

Alongside this, holder behavior is undergoing a significant transition. Data shows that Bitcoin accumulated during late 2025 has now crossed the 155-day threshold, moving into the long-term holder (LTH) category. This shift indicates that a large portion of previously active supply is no longer being traded, but instead held with conviction. Historically, the transition from short-term holder dominance to long-term holder dominance marks a move away from speculative trading toward accumulation-driven phases. The current environment reflects a similar pattern, where conviction-based holding is beginning to outweigh short-term market activity.

BTC Dominance Ratio

Taken together, these on-chain signals suggest that Bitcoin is in a phase where supply is tightening while holding behavior is strengthening, even as price remains range-bound. This kind of setup typically forms when the market is building a base, where reduced sell pressure and increasing long-term conviction gradually set the stage for a stronger directional move ahead.

Recent Events Affecting Bitcoin’s Price

  • The shift from late 2025 into 2026 has completely changed Bitcoin’s momentum. After hitting its peak near $120K+, the market entered a cooling phase as profit-taking kicked in and the price slipped into a prolonged consolidation. This marked the transition from a high-momentum rally into a structure-building phase, where volatility started to compress.
  • The biggest trigger in recent months has been the ongoing Iran conflict, which has injected uncertainty across global markets. Rising tensions, drone strikes, and threats around the Strait of Hormuz have disrupted energy markets and increased volatility, keeping risk assets like Bitcoin, capped despite strong support. 
  • At the same time, the Trump factor has played a direct role in Bitcoin’s short-term moves. Announcements around delaying strikes on Iran or initiating negotiations have repeatedly triggered relief rallies, pushing BTC back above $70K. However, the lack of sustained resolution has also caused sharp reversals, keeping the price locked in a range. 
  • Institutional behavior has also influenced price direction. Earlier outflows and profit booking created downward pressure, but recent sessions have shown renewed positioning near lower levels, preventing deeper breakdowns and supporting the current range-bound structure. 
  • Another layer of uncertainty comes from ongoing regulatory developments in the U.S., where delays and debates around crypto legislation continue to impact sentiment. Proposals affecting stablecoins and broader market rules have created hesitation among investors, limiting aggressive upside momentum.
  • Meanwhile, global markets themselves remain unstable. Fluctuations in oil prices, shifts in bond yields, and defensive positioning by investors have created a mixed environment, where Bitcoin is reacting to both risk-on and risk-off signals without a clear trend.

Bitcoin Crypto Price Prediction 2026 – 2030

YearPotential Low ($)Potential Average ($Potential High ($)
2026100k150k180k
2027170K250K330K
2028200K350K450K
2029275K500K640K
2030380K750K900K

Bitcoin Price Prediction 2026 Forecast

The BTC price range in 2026 is expected to be between $100K and $180K.

BTC Price Prediction 2027

Subsequently, the Bitcoin price range can be between $170K to $330K during the year 2027. 

Bitcoin (BTC) Price Prediction 2028

With the next Bitcoin halving, the price will see another bullish spark in 2028. Specifically, as per our Bitcoin Price Prediction, the potential BTC price range in 2028 is $200K to $450K. 

BTC Price Target For 2029

Thereafter, the BTC price for the year 2029 could range between $275K and $640K.

Bitcoin (BTC) Price Prediction 2030

Finally, in 2030, the price of Bitcoin is predicted to maintain a positive trend. Indeed, the BTC price is expected to reach a new all-time high, ranging between $380K and $900K.

Bitcoin Price Prediction 2031, 2032, 2033, 2040, 2050

The long-term projection assumes Bitcoin (BTC) sustains relevance in overall cryptocurrency adoption and the continued development of blockchain payment solutions, with growth moderating over time as the asset matures.

YearPotential Low ($)Potential Average ($)Potential High ($)
2031540,830901,3831,261,936
2032757,1621,261,9361,766,711
20331,059,9451,766,7112,473,477
20405,799,4549,665,75713,532,059
2050161,978,188269,963,647377,949,106

Bitcoin Prediction: Analysts and Influencers’ BTC Price Target

“Jack Dorsey, former Twitter CEO (now X), predicts Bitcoin could exceed $1 million by 2030 due to its ecosystem growth and increasing adoption.

Cathie Wood, CEO of Ark Invest, projects Bitcoin to reach $1.5 million by 2030, driven by institutional adoption and its position as digital gold.”

“Wall Street broker Bernstein believes 2026 will mark the start of a tokenization “supercycle,” maintaining its $150,000 Bitcoin price target for this year and $200,000 for the 2027 cycle peak.”

“Brad Garlinghouse, the Ripple CEO, predicts Bitcoin will hit $180,000 in 2026, due to favorable market and regulatory conditions.”

Never Miss a Beat in the Crypto World!

Stay ahead with breaking news, expert analysis, and real-time updates on the latest trends in Bitcoin, altcoins, DeFi, NFTs, and more.

FAQs

What is the Bitcoin price prediction for 2026?

Bitcoin is expected to range between $100K and $180K in 2026, with bullish momentum building as consolidation near $70K shifts into expansion.

How much will 1 Bitcoin be worth in 2030?

Bitcoin could range between $380K and $900K by 2030, with an average target near $750K as adoption, scarcity, and institutional demand grow.

What will 1 BTC be worth in 2040?

By 2040, Bitcoin could range between $5,799,454 and $13,532,059, with an average estimate near $9,665,757 as adoption and scarcity increase.

How much will Bitcoin be in 2050?

Bitcoin in 2050 could range from $161M to $377M, with an average estimate near $269M, driven by long-term adoption, scarcity, and global demand.

Is it safe to invest in Bitcoin today for long-term?

Bitcoin can be a strong long-term asset, but it remains volatile. Investing gradually and holding long-term may reduce risk and improve potential returns.

Is it worth putting $100 into Bitcoin?

Yes, investing $100 in Bitcoin can be a good start. It allows beginners to gain exposure, learn the market, and benefit from potential long-term growth.

Bitcoin Price Eyes Breakout as Supply Shock Builds: Can BTC Price Reach $75K?

Bitcoin Experiences Rare Two-Block Fork

The post Bitcoin Price Eyes Breakout as Supply Shock Builds: Can BTC Price Reach $75K? appeared first on Coinpedia Fintech News

Bitcoin price is knocking on the door again, but this time, the setup feels different. After reclaiming the $70K zone, BTC price is once again testing resistance, yet the usual signs of exhaustion are missing. Instead, selling pressure appears to be fading while underlying demand quietly strengthens.

So here’s the real question: Is Bitcoin price about to break out, or is this another rejection before the next move?

Bitcoin Price Compresses Under Resistance as Breakout Structure Forms

Bitcoin price is currently consolidating around $71,000, repeatedly pressing against a key resistance band while forming higher lows, an early indication that buyers are gaining control. According to analyst projections, BTC is shaping a right-angled descending broadening wedge, a structure often seen before volatility expansion. Price continues to respect an upward-sloping support while compressing against horizontal resistance, tightening the range.

Bitcoin $BTC is approaching a breakout from this right-angled descending broadening wedge.

$75,700 could be next. pic.twitter.com/9mFGB7YqIm

— Ali Charts (@alicharts) March 25, 2026

At the same time, the broader structure reveals a triangular consolidation above the $69K–$70K demand zone, suggesting that the market is stabilizing rather than weakening. If Bitcoin price clears the $71K–$72K zone, the breakout could extend toward $73.3K, $74.5K, and $75.7K, aligning with the projected move from the pattern.

Exchange outflows signal tightening supply dynamics

While price action tightens, on-chain data shows a major shift beneath the surface. More than 77,000 BTC have been withdrawn from exchanges, including:

BTC exchange data

~33K BTC from Bitfinex

~30K BTC from Binance

~14K BTC from Gemini

This movement reflects a decline in exchange reserves, typically associated with long-term holding behavior rather than short-term selling. A similar trend was observed in 2025, when large outflows preceded a rally from $84K to $118K. The current scale of withdrawals suggests that supply is once again being absorbed, reducing sell-side pressure. 

BTC MVRV data

On-chain models point to accumulation, not distribution Beyond flows, valuation metrics provide deeper confirmation. Key on-chain indicators suggest Bitcoin is operating within a favorable accumulation zone:

  • MVRV below 1, indicating price is near realized value
  • NUPL below 0.2, reflecting reduced unrealized profit and limited euphoria
  • Puell Multiple near 0.35, historically linked to undervaluation phases

Together, these signals define a phase where downside risk compresses while long-term upside improves, often seen during early accumulation cycles.

Key levels define the next move

Bitcoin price is now positioned at a critical technical level. Immediate resistance lies at $71K–$72K, where price has faced repeated rejection. A clean breakout above this zone could trigger momentum toward: $73,300 followed by $75,700. 

Bitcoin price chart

On the downside, support remains firm at $69K–$70K, with a deeper safety level near $66K. As long as the BTC price holds above support, the bullish structure remains intact.

Final Take

Bitcoin is entering a phase where technical structure and on-chain signals are aligning. The chart shows compression, supply is tightening, and accumulation signals are strengthening. This combination often precedes decisive directional moves. If resistance breaks, Bitcoin may not just move higher, it could accelerate toward $75K faster than expected. For now, the market is waiting, but the setup suggests it won’t be waiting for long.

FAQs

What is Bitcoin price prediction for 2026?

Bitcoin could trade between $90K and $150K by 2026 if adoption grows and supply tightens, with cycles and macro trends shaping the pace.

How much will 1 Bitcoin be worth in 2030?

By 2030, Bitcoin is widely projected to reach $150K–$300K, driven by institutional demand, limited supply, and global adoption growth.

What will 1 BTC be worth in 2040

Long-term projections suggest Bitcoin could exceed $500K by 2040 if it becomes a global store of value and demand continues rising.

How much will Bitcoin reach in 10 years?

Over the next decade, Bitcoin could range between $200K and $500K depending on adoption, regulation, and macroeconomic conditions.

Is Bitcoin a good long-term investment?

Bitcoin is seen as a long-term asset due to scarcity and adoption trends, but price remains volatile, so risk management is essential.

Hyperliquid Price Prediction: Whale Buys $4M HYPE- Rally Ahead?

Hyperliquid Price Prediction Whale Buys $4M HYPE- Rally Ahead

The post Hyperliquid Price Prediction: Whale Buys $4M HYPE- Rally Ahead? appeared first on Coinpedia Fintech News

Hyperliquid price is starting to turn heads again. After a quiet consolidation phase, HYPE is showing strength at a time when most altcoins are still struggling to find direction. But this move isn’t just another bounce, it’s backed by something deeper. Fresh whale inflows, a clean structural breakout, and rising momentum are beginning to align. That raises a critical question: Is Hyperliquid price quietly entering its next major rally phase?

Whale Accumulation Builds the Foundation

The biggest signal right now is not coming from price, it’s coming from smart money activity. On-chain data confirms that:

Whales are buying $HYPE

– Whale “0x96d” deposited $2M $USDC and increased its $HYPE position to 427,851 $HYPE, bought for $15.08M at $35.24. It’s currently worth ~$17.2M, for a profit of ~$2.14M.

– A newly created wallet “0xa58” deposited $2M $USDC and bought 51,850 $HYPE at… pic.twitter.com/Wq3rnLnTmH

— Onchain Lens (@OnchainLens) March 25, 2026
  • A major wallet deployed nearly $2 million USDC, accumulating HYPE and already moving into profit
  • Another newly created wallet followed with an additional $2 million USDC, signaling fresh conviction

This back-to-back accumulation is significant. It suggests that large players are positioning early, not reacting late. Historically, such accumulation phases tend to precede strong upside expansions, especially when they coincide with a shift in market structure. Simply put, whales are not chasing the move, they are building it.

HYPE Price Retest Breakout Zone: Major Rally Next?

Hyperliquid price has already made a key move. HYPE has broken out of a descending channel, ending a prolonged downtrend. More importantly, the breakout is holding, price is not slipping back into the range, which validates the strength of the move. The structure now shows:

HYPE price chart
  • A support flip around $35–$37, previously acting as resistance
  • Formation of higher lows, signaling buyers stepping in consistently
  • Stabilization above the breakout zone, confirming control has shifted

This is a classic transition from bearish to bullish structure. It marks the point where trend reversal begins, not ends.

Expansion Phase Could Drive Hyperliquid Price Higher

With the breakout confirmed, attention shifts to what comes next.

The current setup reflects a typical impulse-correction-expansion cycle: The breakout provided the initial impulse

  • The breakout provided the initial impulse
  • The consolidation formed a healthy correction
  • Now, price appears to be entering the expansion phase

If momentum continues, the next levels to watch are:

  • $45–$48 as immediate resistance. 
  • A breakout above this zone could accelerate the move toward $55–$60. 

This aligns with the projected trajectory seen in the chart, where the next wave is just beginning to unfold.

Final Words

Hyperliquid price is no longer in a passive phase; it’s transitioning into a high-momentum setup backed by both whales and structure. The signals are aligning:

  • Whale accumulation confirms early conviction
  • Technical breakout validates trend reversal
  • Wave structure points toward expansion

If HYPE holds above $37 support and pushes through $45 resistance, the path toward $55–$60 becomes increasingly likely. Right now, Hyperliquid isn’t just moving, it’s building a breakout narrative that the market is only starting to notice.

FAQs

What is the Hyperliquid (HYPE) price prediction for 2026?

HYPE price in 2026 is projected to range between $25 and $90, with an average near $60 if adoption and trading volumes keep rising.

What could HYPE be worth by 2030?

Long-term projections suggest HYPE might reach an average of $125 by 2030, with possible highs near $185 if platform usage keeps expanding.

Is Hyperliquid (HYPE) a good long-term investment?

HYPE may appeal to long-term investors due to strong platform growth, but like all crypto, it carries risk and requires careful research.

Bitcoin Cash (BCH) Price Eyes $500 Breakout as Bullish Wave Structure Forms

Bitcoin Cash (BCH) Price Eyes $500 Breakout as Bullish Wave Structure Forms

The post Bitcoin Cash (BCH) Price Eyes $500 Breakout as Bullish Wave Structure Forms appeared first on Coinpedia Fintech News

Bitcoin Cash (BCH) price is beginning to shift gears, and this time, the structure suggests it’s not just another short-term bounce. As the broader crypto market stabilizes with Bitcoin holding higher levels and Ethereum regaining momentum, BCH is now flashing a clean, technically-driven breakout setup.

Trading near the $470–$480 range, Bitcoin Cash price is not showing exhaustion. Instead, it is coiling below resistance, building pressure in a way that often precedes sharp upside moves. The bigger signal, however, lies in the wave structure forming beneath the surface.

Wave Structure Confirms Next Expansion Phase Is Underway

The current Bitcoin Cash (BCH) price action is following a classic impulsive wave cycle, and the sequence is now entering its most critical phase. The first leg, an impulsive move from the base, already played out with strong volume confirmation. That move established directional bias. What followed was a controlled corrective phase, where BCH pulled back but crucially held a higher low.

BCH price target

That higher low is not just a technical detail, it is the foundation of the next move. Now, the chart shows the emergence of the next impulsive wave, with price beginning to push upward again.  This wave progression, from impulse to Correction and then Expansion, is one of the most reliable continuation structures in trending markets. Right now, BCH is transitioning into the expansion phase, with momentum quietly building.

$500 Breakout Level Aligns With Wave Target and Liquidity Zone

The projected wave path on the chart is not arbitrary. It points directly toward the $500 level, which now acts as both a technical and psychological trigger. This level has previously acted as a rejection zone, but the current approach is fundamentally different. Bitcoin Cash is no longer rallying into resistance, it is compressing beneath it, absorbing sell-side liquidity.

Bitcoin Cash (BCH) price chart

A confirmed breakout above $500 would validate the wave expansion and likely open the door toward $520–$550, where the next liquidity cluster sits. Once momentum kicks in, these moves tend to unfold quickly. On the downside, the bullish structure remains intact as long as BCH holds above $460–$465. This zone now acts as the base of the current wave cycle.

On-Chain Data Signals Smart Money Accumulation

Beyond the chart, on-chain data adds a critical layer of confirmation. The BCH spot inflow/outflow data reveals a consistent trend of net outflows from exchanges, particularly during recent price consolidation. This is a key signal.

BCH netflows data

Outflows indicate that investors are moving BCH off exchanges, typically into cold storage, suggesting accumulation rather than selling intent. Even as price dipped earlier, outflows remained dominant, showing that larger players were absorbing supply during weakness. This behavior often precedes upward price expansion, as reduced exchange supply tightens available liquidity. At the same time, the broader crypto market flow shows mixed but stabilizing conditions, with capital beginning to rotate back into select assets, BCH being one of them.

Final Outlook: Structure, Data, and Momentum Align for Breakout

Bitcoin Cash is no longer just forming a setup; it is entering a trigger zone. The signals are aligning:

  • A completed impulsive wave and a higher-low correction
  • Emergence of the next expansion wave
  • Strong exchange outflows indicating accumulation
  • Compression below a key resistance level

If BCH confirms a breakout above $500, the next wave could unfold rapidly, driven by both technical momentum and tightening supply dynamics. In a market searching for clean setups, Bitcoin Cash is now standing out. The next wave is not a possibility anymore; it’s already in motion. And $500 may just be the first checkpoint.

FAQs

Is Bitcoin Cash (BCH) about to break out?

Yes, technical indicators suggest Bitcoin Cash is approaching a breakout. The price is consolidating below the key $500 resistance level, forming a classic wave structure that typically leads to sharp upward moves once a breakout is confirmed.

Why is the BCH price showing strength right now?

BCH is showing strength due to a combination of a clean impulsive wave structure and on-chain data. Investors are moving coins off exchanges, indicating accumulation and tightening supply, which reduces selling pressure and supports the current price stability.

What is the Bitcoin Cash (BCH) price prediction for 2026?

BCH price in 2026 may trend higher if adoption grows and momentum continues, with potential ranges often projected between $600–$1,000 in bullish scenarios.

Flare (FLR) Price Prediction 2026, 2027 – 2030: Is FLR Setting the Stage for a Long-Term Breakout?

Flare (FLR) Price Prediction

The post Flare (FLR) Price Prediction 2026, 2027 – 2030: Is FLR Setting the Stage for a Long-Term Breakout? appeared first on Coinpedia Fintech News

Story Highlights

  • The live price of Flare crypto is  $ 0.00804321.
  • Price predictions for 2026 range from $0.008 to $0.014.
  • FLR could extend toward $0.30 by 2030, if the recovery structure holds.

Flare (FLR) is a smart contract–enabled blockchain focused on cross-chain data access and interoperability. Since its initial listing phase, the token has spent a significant amount of time repricing, moving from early volatility into a prolonged period of range-bound trading.

Recently, however, the nature of price action has begun to change. Instead of sharp declines, FLR has started forming more stable reactions around established demand zones. Volatility has eased, and price swings have become narrower. From a market structure standpoint, these conditions often appear when an asset is transitioning from distribution into base formation, raising questions about whether FLR could be approaching a turning point as 2026 draws closer.

Flare Price Today

Cryptocurrency Flare
Token FLR
Price $0.0080 down -1.76%
Market Cap$ 686,420,061.21
24h Volume$ 2,727,910.2108
Circulating Supply85,341,591,460.4873
Total Supply105,309,186,569.21
All-Time High$ 0.0797 on 10 January 2023
All-Time Low$ 0.0079 on 23 March 2026

Flare (FLR) Price Prediction April 2026

Flare is currently trading near $0.008085, holding within a tight consolidation range after a prolonged downtrend. The price structure shows that FLR has started to stabilize near its lower base, with selling pressure gradually fading and volatility compressing over recent sessions. As March is ending and April is near, the Flare price is hovering just above a short-term support zone around $0.0078–$0.0080, which is acting as a key demand area. Buyers have shown interest at these levels, preventing further downside extension and allowing the structure to flatten out.

On the upside, FLR is facing immediate resistance near $0.0088–$0.0092, where previous rejections have occurred. If the price manages to build momentum and break above this zone, it could open the path toward $0.010–$0.011, marking the first meaningful recovery attempt. A sustained move beyond this level would indicate that accumulation is transitioning into a short-term expansion phase, with the potential to test $0.012–$0.014 later in the month if broader market conditions remain supportive. However, if FLR fails to hold the $0.0078 support, the structure could weaken again, leading to a retest of the $0.0070–$0.0072 range, delaying any immediate recovery.

Overall, April is shaping up as a transition phase for Flare, where the market is attempting to move from prolonged weakness into early stabilization, with breakout confirmation still pending.

Flare (FLR) Price Prediction 2026

Looking at the broader 2026 outlook, Flare appears to be positioned in the early stages of a recovery cycle after an extended correction. The current price structure suggests that the token is building a base, which is often a prerequisite before any sustained upward movement begins. For FLR to establish a stronger recovery trend, the first critical step would be reclaiming the $0.012–$0.015 range, which represents a key structural resistance zone. A successful move above this level would signal that buyers are gaining control and that the accumulation phase is transitioning into expansion.

Flare Price Prediction 2026

Once this zone is cleared, the price could gradually move toward $0.018–$0.022, where stronger resistance is expected due to previous supply zones. This area will act as an important checkpoint to determine whether the recovery has enough strength to continue. If the broader crypto market enters a more favorable phase and Flare’s ecosystem continues to develop, the price could extend toward $0.025–$0.030, reflecting a more mature recovery cycle.

At the same time, if FLR struggles to hold above the $0.007–$0.008 base, the recovery could remain delayed, keeping the token in a prolonged sideways structure before any meaningful upside unfolds. In essence, 2026 is likely to be a rebuilding year for Flare, where price action gradually shifts from accumulation into a structured uptrend, rather than delivering an immediate breakout, with upside potential developing steadily as market conditions improve.

Flare Crypto Price Prediction 2026 – 2030

YearPotential Low ($)Potential Average ($Potential High ($)
20260.0100.0300.060
20270.0250.0600.095
20280.0500.1150.175
20290.0900.1900.245
20300.1500.2400.300

Flare (FLR) Price Prediction 2026

The Flare price range in 2026 is expected to be between $0.010 and $0.060.

FLARE Price Forecast for 2027

Flare (FLR) price range can be between $0.025 to $0.095 during the year 2027. 

FLARE Price Outlook for 2028

In 2028, the Flare price is forecasted to potentially reach a low price of $0.050 and a high price of $0.175.

FLR Price Forecast for 2029

Thereafter, the Flare (FLR) price for the year 2029 could range between $0.090  and $0.245.

Flare Coin Price Prediction 2030

Finally, in 2030, the price of Flare is predicted to remain steadily positive. It may trade between $0.150 and $0.300.

Flare Crypto Price Prediction 2031, 2032, 2033, 2040, 2050

Based on the historic data and trend analysis of the cryptocurrency along with the market sentiments, here are the possible Flare  price targets for the longer time frames.

YearPotential Low ($)Potential Average ($)Potential High ($)
20310.1800.2900.390
20320.2200.3600.480
20330.2200.4300.560
20400.4500.7201.00
20500.7001.101.50

Flare (FLR) Price Prediction: Market Analysis?

Year202620272030
Changelly$0.054$0.090$0.250
CoinCodex$0.060$0.108$0.270
WalletInvestor$0.037$0.080$0.280

CoinPedia’s Flare Price Prediction

Based on current technical structure and observed market behavior, Coinpedia’s price outlook implies that Flare (FLR) price is expected to trade between $0.010 and $0.060 in 2026, assuming support levels remain intact. Over the longer horizon, continued recovery could allow FLR to move toward the $0.20-$0.30 range by 2030, subject to overall market conditions.

YearPotential Low ($)Potential Average ($)Potential High ($)
20260.0100.0300.060
Never Miss a Beat in the Crypto World!

Stay ahead with breaking news, expert analysis, and real-time updates on the latest trends in Bitcoin, altcoins, DeFi, NFTs, and more.

FAQs

What is Flare (FLR) coin price prediction for 2026?

Flare (FLR) is expected to range between $0.010 and $0.060 in 2026, driven by base formation, market recovery, and gradual ecosystem adoption.

How high can FLR price go by 2030?

FLR could reach $0.20 to $0.30 by 2030 if adoption grows, key resistance levels break, and the broader crypto market enters a strong bullish cycle.

How much will Flare be worth in 2040?

By 2040, Flare (FLR) could trade between $0.45 and $1.00, assuming long-term adoption, strong utility demand, and continued crypto market expansion.

Is Flare a good long-term investment?

Flare shows long-term potential due to its cross-chain data utility, but like all crypto, it carries risk. Growth depends on adoption and market conditions.

Decred (DCR) Price Prediction 2026, 2027 – 2030: Will Decred Price Hit $1000?

Decred (DCR) Price Prediction

The post Decred (DCR) Price Prediction 2026, 2027 – 2030: Will Decred Price Hit $1000? appeared first on Coinpedia Fintech News

Story Highlights

  • The live price of the Decred token is  $ 22.55985457.
  • Price predictions for 2026 range from $40 to $200.
  • Decred could extend toward $1000 by 2030, if the recovery structure holds.

Decred (DCR) has abruptly returned to the spotlight after posting a sharp 28% intraday rally, marking one of its strongest single-day moves in recent months. The surge comes after a prolonged phase of low volatility and compressed trading ranges, a technical backdrop that often precedes trend expansion rather than short-lived relief bounces.

From a broader perspective, the breakout has pushed DCR above near-term resistance while reviving volume activity, suggesting that dormant market interest may be re-engaging. With higher-timeframe charts still reflecting a long accumulation structure, the latest price action strengthens the case that Decred could be transitioning from base formation into an early recovery phase, setting the stage for a more constructive outlook through 2026 and beyond.

Decred Price Today

Cryptocurrency Decred
Token DCR
Price $22.5599 up 1.25%
Market Cap$ 391,141,960.51
24h Volume$ 6,399,145.4891
Circulating Supply17,337,964.6231
Total Supply17,337,964.6231
All-Time High$ 250.0164 on 17 April 2021
All-Time Low$ 0.3948 on 28 December 2016

Decred (DCR) Price March 2026 Outlook

Decred is currently trading near $22.38, holding just above a well-defined demand zone around the $21.8–$22 region, which has consistently acted as a strong base in recent weeks. The price structure reflects a clear range formation, with repeated rejections from the $25.5–$26 resistance zone, indicating that sellers are still active at higher levels while buyers continue to defend the lower boundary. 

The recent pullback toward support did not trigger aggressive downside continuation, suggesting that selling pressure is gradually weakening while accumulation interest begins to build near the demand zone. This type of structure typically signals a compression phase, where volatility tightens before a directional move unfolds. If Decred continues to hold above the $22 support, the price is likely to attempt another move toward the $25–$27 region. A decisive breakout above this resistance band could shift short-term momentum and open the path toward $30–$32, marking a transition from consolidation into recovery. On the other hand, a breakdown below $21.5 would weaken the structure and could drag the price toward $20–$19, where deeper support is expected to emerge.

Overall, March appears to be a phase where Decred is building a base within a defined range, with the market waiting for a breakout to confirm the next directional trend.

Decred (DCR) Price Prediction 2026

Looking at the broader 2026 outlook, Decred appears to be positioned in the early stages of a recovery cycle, following a prolonged consolidation phase. The current structure suggests that the market is gradually transitioning from accumulation toward expansion, although momentum is still dependent on broader altcoin participation.

The first meaningful shift in structure would occur if Decred manages to reclaim the $30–$32 range, which has historically acted as a key pivot zone. Sustained strength above this level would indicate that buyers are gaining control and that the recovery phase is strengthening.

Decred (DCR) Price Prediction 2026

Once this region is cleared, the price could gradually move toward the $38–$40 zone, where stronger resistance is likely to emerge. This level will act as a critical test for continuation, as it represents a zone where previous supply could return to the market. If broader market conditions remain supportive and Decred maintains steady demand, the price could extend toward the $45–$50 range, reflecting a more mature recovery phase. At the same time, if the price fails to sustain above the $22–$20 support region, the recovery could be delayed, keeping Decred within a prolonged sideways structure before any meaningful expansion takes place.

In essence, 2026 is likely to unfold as a gradual rebuilding year for Decred, where the market transitions from consolidation into a structured uptrend, rather than experiencing an immediate or aggressive breakout.

Decred Crypto Price Prediction 2026 – 2030

YearPotential Low ($)Potential Average ($Potential High ($)
202640100200
202785170320
2028210410500
2029320600800
20306708501000

Decred (DCR) Price Forecast 2026

In 2026, Decred price could project a low price of $40, an average price of $100, and a high of $200.

Decred Price Prediction 2027

As per the Decred Price Prediction 2027, Decred may see a potential low price of $85 . Meanwhile, the average price is predicted to be around $170. The potential high for Decred price in 2027 is estimated to reach $320

Decred (DCR) Price Prediction 2028

In 2028, Decred  price is forecasted to potentially reach a low price of $210 and a high price of $500.

Decred Price Prediction 2029

Thereafter, the Decred  (Decred) price for the year 2029 could range between $320 and $800.

Decred Price Prediction 2030

Finally, in 2030, the price of Decred  is predicted to maintain a steady positive. It may trade between $670 and $1000.

Decred Price Prediction 2031, 2032, 2033, 2040, 2050

The long-term projection assumes Decred sustains relevance in enterprise blockchain use cases, with growth moderating over time as the asset matures.

YearPotential Low ($)Potential Average ($)Potential High ($)
203184012001800
2032100018002500
2033200028003500
2040290033005400
2050250048006000

Decred (DCR) Price Prediction: Market Analysis?

Year202620272030
Changelly$165$280$550
CoinCodex$140$250$700
WalletInvestor$180$300$840

CoinPedia’s Decred Price Prediction

Coinpedia’s price prediction for Decred remains bullish over the long term, supported by the recent breakout from consolidation and improving market structure. If DCR sustains acceptance above its reclaimed support zones, the asset could steadily work toward the $180–$200 range by 2026. Over a full market cycle, Coinpedia projects that Decred has the potential to revisit and exceed prior highs, with $1,000 emerging as a plausible 2030 milestone, contingent on broader crypto-market expansion.

YearPotential Low ($)Potential Average ($)Potential High ($)
202640100200
Never Miss a Beat in the Crypto World!

Stay ahead with breaking news, expert analysis, and real-time updates on the latest trends in Bitcoin, altcoins, DeFi, NFTs, and more.

FAQs

What is Decred (DCR) and why is it gaining attention?

Decred is a cryptocurrency focused on community governance. Recent price rallies and breakout patterns are drawing renewed investor interest.

Is Decred (DCR) a good investment for long-term growth?

DCR shows long-term potential with a strong governance model and historical support levels, but volatility remains high.

What is Decred (DCR) Price Prediction 2026?

In 2026, DCR could trade between $40 and $200, supported by strong accumulation and breakout patterns.

What is the Decred coin price prediction for 2028?

By 2028, DCR may reach $210–$500, depending on market sentiment, adoption, and sustained bullish trends.

What is the Decred price prediction for 2030?

DCR is projected to trade between $670 and $1,000 by 2030 if it maintains growth and market relevance.

What factors influence Decred’s future price?

Price depends on adoption in blockchain use cases, market sentiment, and ability to hold support and break resistance levels.

How high could Decred (DCR) go in the next crypto cycle?

With consistent adoption and bullish cycles, DCR could revisit highs near $1,000 by 2030, making it attractive for patient investors.

Ethereum Price Could Be Next to Surge: Here’s the Hidden Signal

Ethereum Price Could Be Next to Surge: Here’s the Hidden Signal

The post Ethereum Price Could Be Next to Surge: Here’s the Hidden Signal appeared first on Coinpedia Fintech News

While most of the market is watching Bitcoin’s move, Ethereum is building something far more subtle, and potentially more explosive. Ethereum price is currently hovering near $2,150, but beneath this sideways action, a clear shift is unfolding. Smart money is accumulating. Technical structure is tightening, and historically, this exact combination has preceded strong directional moves.

The question now is not whether Ethereum price will move, but how soon the market notices the signal forming beneath the surface.

Smart Money Is Positioning Before the Move

On-chain data shows a decisive change in behaviour among large holders. Wallets holding between 100 and 100,000 ETH have accumulated aggressively over a short period, absorbing supply while price remains relatively stable. 

ETH price data

At the same time, entities like Bitmine adding over 65,000 ETH reinforces a broader institutional narrative, one that suggests Ethereum is transitioning out of a weak phase into accumulation. This divergence is critical. Retail sentiment remains cautious, but large players are quietly positioning, a pattern that has historically preceded breakout moves rather than followed them.

Ethereum Price Structure Is Tightening: What’s Next?

Ethereum price is still trading below a descending trendline, reflecting the broader corrective phase. However, the recent move tells a different story. A sharp upward spike from the demand zone signals aggressive buying activity, often associated with liquidity grabs and early breakout attempts.

Ethereum price chart

More importantly, ETH price is no longer making fresh lows. Instead, it is compressing beneath resistance, forming a structure where downside momentum weakens while upside pressure builds. This kind of compression typically resolves with expansion, and Ethereum now sits at that inflection point.

The immediate resistance sits at $2,200–$2,250, closely aligned with the descending trendline. A decisive break above this region would signal that buyers have regained control, opening the path toward $2,350, the level that defines a broader trend shift. On the downside, $2,050 remains the key support maintaining the current structure. As long as this level holds, the bullish setup remains intact. A break below could delay the move and extend consolidation toward the $1,900 range.

Hidden Signal: Valuation and Structure Begin to Align

Ethereum’s positioning becomes more compelling when viewed through MVRV pricing bands. Current levels place ETH near historically significant accumulation zones, with $1,655 acting as macro support and $2,356 emerging as the key resistance to reclaim. Above this, the next major expansion range lies between $2,647 and $3,639, where previous cycles have seen accelerated price discovery.

Ethereum price MVRV

This alignment, between valuation support, accumulation behavior, and tightening structure, forms a high-probability setup, where multiple market layers begin pointing in the same direction.

ETH Price Outlook: From Accumulation to Expansion?

Ethereum is entering a phase where structure, sentiment, and capital flows are beginning to align. Individually, whale accumulation, technical compression, and valuation support are incremental signals. Together, they form a setup that has historically preceded strong breakout moves.

If Ethereum reclaims key resistance levels in the sessions ahead, the narrative could shift rapidly, from uncertainty to momentum. For now, the market remains focused elsewhere. But Ethereum’s signal is building, and it’s getting harder to ignore.

Dogecoin (DOGE) Price Prediction 2026, 2027 – 2030: Will DOGE Reach 1 Dollar?

price prediction Dogecoin

The post Dogecoin (DOGE) Price Prediction 2026, 2027 – 2030: Will DOGE Reach 1 Dollar? appeared first on Coinpedia Fintech News

Story Highlights

  • The live price of the Dogecoin is  $ 0.09345330.
  • DOGE price prediction for 2026 suggests potential highs of $1.25
  • Long term forecasts indicate DOGE could reach $3.00 by 2030.

Dogecoin has entered a relatively quiet phase after months of uneven price action, but that doesn’t necessarily signal weakness. In past cycles, DOGE has often spent extended periods consolidating before reacting sharply once market conditions turned favorable. Currently hovering around $0.09401, the price is showing signs of stability rather than continued decline. Instead of forming fresh lows, DOGE is holding within a narrow range, suggesting that sellers are gradually losing control while buyers begin to absorb supply. At the same time, the broader crypto market is slowly finding balance, which could allow high-beta assets like Dogecoin to re-enter focus. 

Since DOGE is largely driven by sentiment and participation, even a moderate shift in market mood can have an outsized impact on its price behavior. This places Dogecoin in a phase where less movement on the surface may actually signal preparation for a larger move ahead.

Keep reading to find out!

Dogecoin Price Today

Cryptocurrency Dogecoin
Token DOGE
Price $0.0935 up 2.91%
Market Cap$ 14,348,555,583.97
24h Volume$ 1,636,081,897.7801
Circulating Supply153,537,166,383.71
Total Supply153,537,166,383.71
All-Time High$ 0.7376 on 08 May 2021
All-Time Low$ 0.0001 on 07 May 2015

Dogecoin (DOGE) Price March 2026 Outlook

Through March, DOGE is trading between $0.09 and $0.10, reflecting a steady consolidation phase. The $0.088 area continues to act as a reliable floor, with buyers stepping in each time the price approaches this level. As long as this support holds, the structure remains stable. On the upside, the immediate hurdle sits around $0.105–$0.11. A move above this level could bring fresh momentum, allowing DOGE to test $0.13–$0.15, which previously acted as a rejection zone.

If the move extends further, the next area to watch would be $0.18–$0.20, where the market may slow down again due to stronger selling pressure.

However, if DOGE slips below $0.088, the price could drift toward $0.075, indicating that the consolidation phase needs more time before any meaningful recovery. For now, March appears to be more about holding ground and building a base, rather than immediate breakout.

Dogecoin (DOGE) Price Prediction 2026

Moving into the broader 2026 outlook, Dogecoin’s direction will likely be shaped by how the overall crypto cycle develops. Historically, DOGE has not required strong fundamentals to rally, it tends to respond quickly once liquidity and attention return to the market. 

Dogecoin (DOGE) Price Prediction 2026

A move above $0.15–$0.18 would be the first sign that sentiment is shifting. From there, the next important zone lies around $0.30–$0.35, which could act as a mid-cycle barrier. If DOGE manages to maintain strength above this region, the structure begins to look more constructive, opening the door for a move toward $0.45–$0.50. Such a move would likely depend on broader market participation and renewed interest in meme-driven assets. At the same time, if the price struggles to hold above $0.08, the recovery timeline could extend, keeping DOGE in a longer consolidation phase. Overall, 2026 may not be about explosive moves initially, but rather about gradual rebuilding, with upside accelerating only if market conditions align.

Dogecoin Price Prediction 2026 – 2030

YearPotential Low ($)Potential Average ($)Potential High ($)
20260.751.001.25
20271.151.351.50
20281.251.752.00
20291.502.152.65
20302.502.753.00

This table, based on historical movements, shows DOGE price to reach $3 by 2030 based on compounding market cap each year. This table provides a framework for understanding the potential DOGE price movements. Yet, the actual price will depend on a combination of market dynamics, investor behavior, and external factors influencing the cryptocurrency landscape.

Dogecoin (DOGE) Price Prediction 2026

As per Dogecoin’s Price forecast for 2026, the high price could be $1.25, the low may reach $0.75. This makes the average around $1.00.

Dogecoin Price Prediction 2027

Moving to 2027, the DOGE Price projects that it might hit a high price of $1.50 potentially. With a $1.15 low and an average of $1.35

DOGE Coin Price Prediction 2028

Moving to 2028, the Dogecoin Price Forecast predicts a high price of $2.00. On the flip side, the low may fall to $1.25, and the average is projected to be around $1.75.

DOGE Price Prediction 2029

As per Dogecoin Price Forecast 2029, DOGE’s high price is predicted to be $2.65, with a low of $1.50 and an average of $2.15.

Dogecoin (DOGE) Price Prediction 2030

Finally, as per the Dogecoin Price Forecast 2030, DOGE’s price can reach a high price of $3.00. With a low of $2.50 and an average of $2.75.

Dogecoin Price Prediction 2031, 2032, 2033, 2040, 2050

Based on the historic market sentiments and trend analysis of the altcoin, here are the possible Dogecoin price targets for the longer time frames.

YearPotential Low ($)Potential Average ($)Potential High ($)
20313.013.494.00
20323.794.475.25
20334.965.756.75
204014.2219.5025.00
205054.99105.00155.00

Market Analysis

Year202620272030
Changelly$1.50$1.80 $3.00
CoinCodex$1.40$2.00$3.40
WalletInvestor$1.60$2.10$3.50
Never Miss a Beat in the Crypto World!

Stay ahead with breaking news, expert analysis, and real-time updates on the latest trends in Bitcoin, altcoins, DeFi, NFTs, and more.

FAQs

What is Dogecoin price prediction for 2026?

DOGE could trade between $0.75 and $1.25 in 2026, with an average around $1.00, depending on market sentiment and crypto adoption.

How much will Dogecoin be worth in 2030?

By 2030, DOGE may average around $2.75, with potential lows near $2.50 and highs reaching $3.00, depending on market conditions.

What will Dogecoin be worth in 2040?

Dogecoin may range between $14 and $25 by 2040 if long-term adoption and crypto market enthusiasm continue

Where will Dogecoin be in 10 years?

In 10 years, DOGE could trade between $2.50 and $3.00, depending on adoption, investor interest, and broader crypto trends.

Is Dogecoin a good investment?

DOGE can be a high-risk, high-reward investment, influenced by market sentiment, popularity, and crypto adoption cycles.

What factors influence Dogecoin’s future price?

DOGE price depends on market sentiment, crypto cycles, investor activity, broader adoption, and interest in meme-driven assets.

Chainlink (LINK) Price Prediction 2026, 2027 – 2030: Will LINK Price Reach $100?

Chainlink Price Prediction

The post Chainlink (LINK) Price Prediction 2026, 2027 – 2030: Will LINK Price Reach $100? appeared first on Coinpedia Fintech News

Story Highlights

  • The live price of the LINK token is  $ 9.07835550.
  • LINK price prediction for 2026 suggests potential highs of $65
  • Long term forecasts indicate LINK could reach $200 by 2030.

As the crypto market gradually stabilizes and capital begins rotating back into infrastructure-focused projects, Chainlink continues to stand out as one of the most critical components of the blockchain ecosystem. By providing decentralized oracle services, the network enables smart contracts to interact with real-world data, making it essential for DeFi, tokenization, and cross-chain applications.

At the same time, LINK is currently trading around $9.26, where price action is no longer showing aggressive downside continuation. Instead, the token has entered a stabilization phase, holding near key support while gradually attempting to rebuild structure. This phase often reflects early accumulation, especially in projects that maintain strong real-world utility. With demand for data feeds, real-world asset integration, and cross-chain communication continuing to grow, Chainlink remains positioned as a core infrastructure layer in the evolving Web3 ecosystem.

Chainlink Price Today

Cryptocurrency Chainlink
Token LINK
Price $9.0784 up 3.71%
Market Cap$ 6,428,383,264.36
24h Volume$ 943,030,203.4918
Circulating Supply708,099,970.4526
Total Supply1,000,000,000.00
All-Time High$ 52.8761 on 10 May 2021
All-Time Low$ 0.1263 on 23 September 2017

Coinpedia’s Chainlink Price Prediction 2026

Chainlink continues to hold a strong position as a leading oracle provider within the blockchain ecosystem. As decentralized applications, real-world asset tokenization, and cross-chain systems expand, the demand for reliable data infrastructure could increase significantly.

Based on current market structure and long-term fundamentals, LINK could potentially reach around $45 by 2026, while sustained adoption and infrastructure growth could push the token toward $120 by 2030.

YearPotential Low ($)Potential Average ($)Potential High ($)
2026355065

Chainlink (LINK) Price March 2026 Outlook

LINK is currently trading within a range near $9–$10, indicating that the market is consolidating after recent volatility. The $8.80–$9.00 zone is acting as immediate support, where buyers have repeatedly stepped in to defend the price. Holding this level keeps the short-term structure stable and allows for gradual recovery.

On the upside, the first resistance appears near $10.50–$11, which aligns with previous rejection zones. A breakout above this range could open the path toward $13–$15, where stronger liquidity is present. If momentum continues to build, LINK could extend toward $18–$20, signaling a shift in short-term structure. However, if the price fails to hold the $8.80 support, the token could slip toward the $7.50–$8 demand zone, delaying recovery. Overall, March appears to be a range-building phase, with the market watching for a breakout to confirm the next directional move.

Chainlink Price Prediction 2026

Looking ahead to 2026, Chainlink’s trajectory will likely depend on the expansion of oracle demand, real-world asset integration, and cross-chain infrastructure. As blockchain technology continues evolving, the need for reliable data feeds and off-chain connectivity is expected to grow significantly. Chainlink has already established itself as a leader in this space, which could support long-term demand for LINK. Reclaiming the $15–$18 range would mark the first major recovery signal. 

Chainlink (LINK) Price Prediction 2026

Once this level is secured, the token could gradually move toward $25–$30, where stronger resistance may appear. If broader market conditions turn bullish and infrastructure tokens regain momentum, LINK could build sustained upside. In a favorable scenario, Chainlink could potentially reach around $45 by 2026, reflecting a full recovery cycle supported by ecosystem growth.

Additionally, the Average Order Size in both the spot and futures markets has escalated into the “Big Whale” category. This shift signals the involvement of institutional participants, who significantly influence LINK’s market structure, rather than retail trading flows.

Chainlink Price Targets 2026 – 2030

YearPotential Low ($)Potential Average ($Potential High ($)
2026355065
2027708095
20287585120
202980110150
2030120170200

This table, based on historical movements, shows Chainlink price to reach $195 by 2030 based on compounding market cap each year. This table provides a framework for understanding the potential LINK price movements. Yet, the actual price will depend on a combination of market dynamics, investor behavior, and external factors influencing the cryptocurrency landscape.

LINK Crypto Price Forecast 2026

As per Chainlink’s Price forecast for 2026, the high price could be $55, the low may reach $35. This makes the average around $50.

LINK Price Prediction 2027

Moving to 2027, the LINK Price projects that it might hit a high price of $95 potentially. With a $70 low and an average of $80

Chainlink Price Analysis 2028

Moving to 2028, the Chainlink Price Forecast predicts a high price of $104. On the flip side, the low may fall to $58, and the average is projected to be around $85.

LINK Coin Price Prediction 2029

As per Chainlink Price Forecast 2029, LINK’s high price is predicted to be $150, with a low of $80 and an average of $110.

Chainlink Price Prediction 2030

Finally, as per the Chainlink Price Forecast 2030, LINK’s price can reach a high price of $200. With a low of $120 and an average of $170.

Chainlink Price Prediction 2031, 2032, 2033, 2040, 2050

The long-term projection assumes Chainlink sustains relevance in enterprise blockchain use cases, with growth moderating over time as the asset matures.

YearPotential Low ($)Potential Average ($)Potential High ($)
203175100120
203290120150
2033110150200
2040250550750
20505006501000

Chainlink (LINK) Price Prediction: Market Analysis?

Year202620272030
Changelly$60$72 $90
CoinCodex$55$78$98
WalletInvestor$62$85$100
Never Miss a Beat in the Crypto World!

Stay ahead with breaking news, expert analysis, and real-time updates on the latest trends in Bitcoin, altcoins, DeFi, NFTs, and more.

FAQs

How much is Chainlink worth?

At the time of writing, the value of one LINK crypto token was  $ 9.07835550.

What is Chainlink (LINK) price prediction for 2026?

Chainlink could reach $45–$65 in 2026, fueled by growing demand for decentralized oracles and cross-chain data solutions.

How much will 1 Chainlink be worth in 2030?

By 2030, LINK may reach $200 if DeFi, tokenized assets, and cross-chain adoption continue to expand steadily.

How high can LINK price go by 2040?

LINK’s price could potentially exceed $500 by 2040 if it remains a core infrastructure for Web3 and blockchain data services.

Is Chainlink a good long-term investment?

Chainlink is considered strong long term due to its real-world utility, oracle dominance, institutional adoption, and expanding cross-chain ecosystem.

What factors influence Chainlink price predictions?

LINK price is driven by oracle demand, CCIP adoption, staking growth, institutional interest, crypto market cycles, and global liquidity trends.

Trump Trigger Sparks Crypto Market Rally: Bitcoin Hits $71K, XRP & ETH Spikes

Trump Trigger Sparks Crypto Market Rally Bitcoin Hits $71K, XRP & ETH Spikes

The post Trump Trigger Sparks Crypto Market Rally: Bitcoin Hits $71K, XRP & ETH Spikes appeared first on Coinpedia Fintech News

A sudden crypto market rally has sent shockwaves across digital assets, with prices surging within hours after Donald J. Trump signaled a potential easing of geopolitical tensions. Bitcoin price surged more than 4% to reclaim $71,000, marking a sharp breakout from recent consolidation. Ethereum price followed with a similar move to $2,150, while XRP price climbed to $1.41, confirming a broad-based surge across the market.

What Triggered the Sudden Move?

The sudden rally comes after Trump hinted at de-escalation in U.S.–Iran tensions, easing fears of immediate conflict. Crypto markets reacted instantly. As geopolitical risk declined, capital rotated rapidly into risk assets, with crypto leading the move due to its high sensitivity to sentiment shifts. At the same time, the speed of the move suggests a short squeeze and breakout from compressed structures, where traders positioned for downside were forced to exit, accelerating the upside move.

BREAKING PRESIDENT TRUMP: 🇺🇸🇮🇷 We had very good and productive conversations regarding a complete and total resolution of hostilities in the Middle East.

Military strikes postponed for 5 days. pic.twitter.com/wiZh9F1H5p

— Donald J Trump Posts TruthSocial (@TruthTrumpPost) March 23, 2026

This combination, macro trigger and technical compression, is often seen at the start of impulsive moves.

Bitcoin Price Analysis: Key Levels To Watch

Bitcoin price is now trading around $71,000 after breaking out of a short-term descending structure visible on lower timeframes. The sudden spike suggests aggressive buying and short liquidations, pushing price back above a key psychological level.

Bitcoin Price analysis

Holding above $70,000 is critical, as it confirms this move as a valid breakout rather than a fake spike. On the upside, Bitcoin now faces resistance at $73,500–$75,000, which aligns with previous supply zones. A clean break above this region could accelerate momentum toward a broader rally phase. On the downside, $68,000–$69,000 remains the key support zone. A drop below this range would indicate the breakout is weakening and could lead to consolidation.

Ethereum Price Analysis: Is a Rally Toward $2500 Next?

Ethereum price is trading near $2,150, following a sharp bounce from recent lows and breaking above a descending trendline structure. The sudden spike here reflects renewed demand and participation, especially as Ethereum often follows Bitcoin’s momentum with slightly higher beta.

Ethereum price analysis

Immediate resistance lies at $2,250–$2,300, a zone where price previously struggled. A breakout above this could open the path toward $2,500, marking a stronger trend reversal. Support is now seen at $2,050, which must hold to maintain bullish momentum. A breakdown below $1,950 would weaken the structure and signal a potential pullback.

XRP Price Analysis: Early Signs of Trend Shift

XRP price is trading around $1.41, bouncing sharply from the lower boundary of a descending channel. The sudden spike suggests early accumulation and short-term breakout pressure, but XRP is still trading within a broader range compared to Bitcoin and Ethereum.

XRP price analysis

Immediate resistance is located at $1.50–$1.55, where selling pressure has previously emerged. A breakout above $1.60 would confirm a stronger trend shift and likely attract momentum buyers.

On the downside, $1.30–$1.32 remains a critical support zone. Holding this level keeps the structure intact, while a breakdown could invalidate the current bullish momentum.

Crypto Market Outlook: Momentum Shift or Short-Term Reaction?

This crypto market rally shows clear signs of a momentum shift driven by macro catalysts and technical breakouts. If Bitcoin sustains above $70K and resistance levels begin to break, this move could evolve into a broader rally. However, failure to hold key supports may turn this into a short-term spike followed by consolidation. For now, the market has transitioned sharply into risk-on mode, with momentum building rapidly.

FAQs

What triggered the recent crypto market rally?

The rally followed Trump hinting at easing U.S.–Iran tensions, sparking a surge in Bitcoin, Ethereum, and XRP prices.

How did Bitcoin respond to the sudden rally?

Bitcoin jumped over 4%, reclaiming $71,000, breaking key short-term resistance and triggering short-covering momentum.

Could the crypto market rally continue?

If key supports hold and resistance breaks, the rally could expand. Failing supports may lead to short-term consolidation instead.

Dogecoin Price Near Key Support as Whales Accumulate: Breakout Ahead?

Dogecoin Approaches Multi-Year Compression Breakout—Is a Major Move Brewing

The post Dogecoin Price Near Key Support as Whales Accumulate: Breakout Ahead? appeared first on Coinpedia Fintech News

Dogecoin is back at a level where past cycles have flipped from decline to explosive rallies, but will this time be different? As DOGE drifts toward a critical support zone, whales are quietly accumulating hundreds of millions of tokens, creating a rare divergence between price weakness and smart money positioning. The setup is tightening, and the market may be closer to a breakout than it appears.

Long-Term Support Zone Comes Back Into Focus

Dogecoin’s broader structure continues to revolve around a well-defined multi-year range, with the lower boundary near $0.053–$0.055 acting as a recurring demand zone. According to DOGE chart analysis shared by analyst Ali Martinez, this level has consistently marked areas where downside momentum begins to fade and accumulation phases take shape.

DOGE price analysis

Each prior interaction with this zone has led to stabilization followed by expansion, reinforcing its importance as a high-liquidity support region. Rather than acting as a breakdown trigger, this level has historically functioned as a cycle floor, where long-term participants re-enter the market. With price now approaching this area again, the market is watching closely for signs of reaction.

Whale Accumulation Signals Quiet Positioning

On-chain activity suggests that larger players are already moving. Recent data shows that whales accumulated over 470 million DOGE within a 72-hour period, even as price continued to weaken. This type of accumulation during downside movement typically reflects forward positioning, where high-capital participants absorb supply before volatility returns.

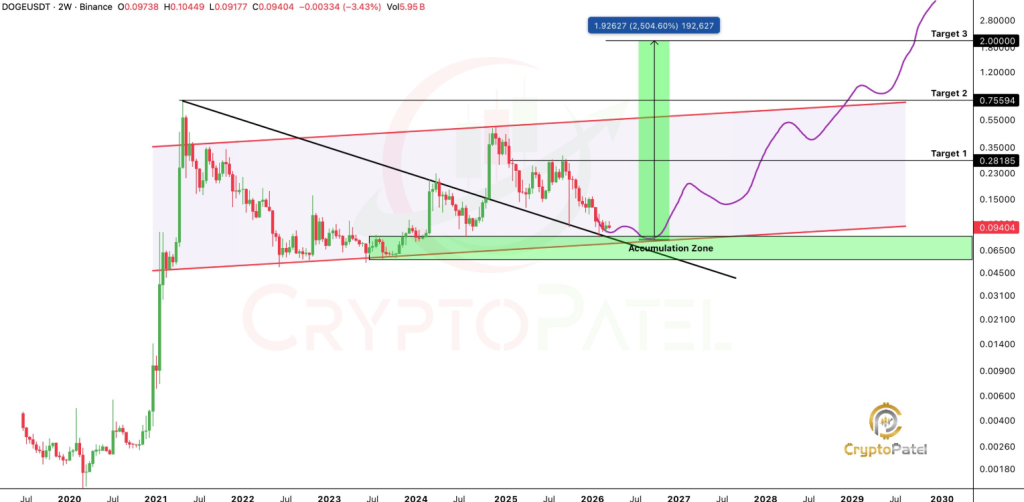
💥BREAKING: DOGECOIN WHALES ACCUMULATE 470 MILLION $DOGE IN 72 HOURS

Major wallet holders bought 470M $DOGE tokens over three days, fueling speculation about a potential rally to the $0.15 price target.

Whale accumulation often signals institutional confidence ahead of price… pic.twitter.com/cXtuDWx1WF

— BSCN (@BSCNews) March 21, 2026

As supply shifts into stronger hands, available liquidity on exchanges tightens, reducing immediate selling pressure. Historically, such divergence between price action and accumulation has often preceded strong upside expansions, particularly when aligned with key support levels.

In this case, the signal is clear: price may be stalled, but confidence beneath the surface is building.

Dogecoin Price Analysis: What Do the Charts Say?

Dogecoin price chart is forming a descending triangle on the higher timeframe, characterized by a series of lower highs compressing against a relatively stable support base. This pattern reflects a market in contraction. Volatility continues to decline, price movement tightens, and liquidity builds near key levels. Such conditions rarely last long and often resolve with a decisive directional move.

Dogecoin Price chart

With price nearing a critical zone, the next move will be defined by how DOGE reacts around key levels. The support area between $0.053 and $0.055 remains central to the structure. Holding this level keeps the accumulation thesis intact, while a breakdown would weaken the broader setup.

On the upside, reclaiming $0.10 would signal early strength and shift market sentiment. A move above $0.15 would carry greater significance, confirming a structural breakout and opening the path toward further upside. Until these levels are reclaimed, DOGE remains in a pre-breakout phase, where positioning continues to build.

Aptos (APT) Price Prediction 2026, 2027 – 2030: Will APT Price Hit $30 by 2026?

Aptos (APT) Price Prediction 2026, 2027 – 2030

The post Aptos (APT) Price Prediction 2026, 2027 – 2030: Will APT Price Hit $30 by 2026? appeared first on Coinpedia Fintech News

Story Highlights

  • The live price of the Aptos token is  $ 0.91706383
  • APT price prediction for 2026 suggests potential highs of $30.00
  • Long term forecasts indicate APT could reach $70 by 2030.

Aptos (APT) is a layer-one blockchain network developed to support high-throughput decentralized applications, focusing on scalability, security, and developer efficiency. Since its launch, Aptos has gained attention for its advanced architecture and Move-based smart contract environment. However, despite strong technological foundations, APT’s market performance has remained largely subdued following its initial speculative phase.

Throughout 2024 and 2025, APT experienced persistent price compression, with the token gradually stabilizing near multi-year support levels. While broader market sentiment remained cautious, recent technical structure suggests that APT may now be entering a prolonged accumulation phase. If historical cycle behavior repeats, 2026 could serve as the inflection point where long-term consolidation transitions into a renewed growth phase.

Aptos Price Today

Cryptocurrency Aptos
Token APT
Price $0.9171 down -3.86%
Market Cap$ 727,896,968.30
24h Volume$ 77,223,807.4375
Circulating Supply793,725,526.3092
Total Supply1,200,024,423.3257
All-Time High$ 19.9032 on 30 January 2023
All-Time Low$ 0.7926 on 23 February 2026

CoinPedia’s Aptos Price Prediction

Coinpedia’s price outlook for Aptos depends on its ability to sustain higher highs and establish acceptance above historical resistance zones. If the current consolidation resolves to the upside, APT could gradually transition into a new macro growth regime, with $30 acting as the first major structural milestone and $70 emerging as the next long-term valuation target.

YearPotential Low ($)Potential Average ($)Potential High ($)
2026101830

Aptos (APT) Price March 2026 Outlook

APT is currently consolidating around the $0.95–$1.05 range, indicating short-term equilibrium between buyers and sellers. The $0.90–$0.95 zone is acting as immediate support, where repeated buying interest is visible. Holding this level keeps the short-term structure stable.

On the upside, APT faces resistance near $1.10–$1.20. A breakout above this range could trigger a move toward $1.40–$1.60, marking the first bullish expansion phase.

If momentum strengthens further, APT may attempt a push toward $2.00, which acts as a psychological and structural resistance. However, a breakdown below $0.90 could expose the token to $0.75–$0.80, delaying recovery. Overall, March is shaping up as a base formation phase, with breakout confirmation required for trend reversal.

Aptos (APT) Price Prediction 2026

As 2026 progresses, Aptos is not in a momentum phase yet, it is in a rebuilding phase, where the market is slowly trying to shift from weakness into stability. After months of decline, APT is now holding near the $0.90–$1.00 region, which is acting as a base. This zone matters because it is where selling pressure has started to fade, and buyers are quietly absorbing supply. These phases usually don’t look exciting, but they often set the foundation for the next big move.

Aptos (APT) Price Prediction 2026

For the structure to improve, the first real signal would be a move back above $1.30–$1.50. That’s the area where the last breakdown happened, so reclaiming it would indicate that the market is no longer in a purely bearish phase. If that happens, the next stretch comes around $2.20–$2.80, where price previously struggled to hold. This zone will likely act as the first real test, whether the move is just a bounce or the start of something bigger.

A stronger shift only comes into play if APT starts holding above $3–$5. That’s where the structure begins to look healthier, with higher lows forming and confidence returning gradually. Once this phase is established, the market typically moves faster, as sidelined buyers start stepping back in. In a broader bullish setup, especially if the overall crypto market supports risk assets, Aptos could extend its recovery toward the $10–$18 range by late 2026. This wouldn’t be a straight move, but rather a step-by-step reclaim of lost levels. On the flip side, if APT fails to hold the $0.90 zone, the recovery narrative weakens. In that case, the price could slip back toward $0.70–$0.80, delaying the entire rebuilding process.

Overall, 2026 for Aptos looks less like a breakout year and more like a year of structure repair, and how well it reclaims key levels will decide how far it can actually go.

Aptos Crypto Price Prediction 2026 – 2030

YearPotential Low ($)Potential Average ($Potential High ($)
202610.0018.0030.00
202713.0025.0040.00
202820.0035.0050.00
202924.0040.0058.00
203036.0050.0060.00

Aptos (APT) Price Prediction 2026

The Aptos price range in 2026 is expected to be between $10.00 and $30.00.

Aptos Coin Price Prediction 2027

Aptos could trade between $13.00 and $40.00 in 2027

Aptos (APT) Price Prediction 2028

In 2028, Aptos is forecasted to potentially reach a low price of $20.00. and a high price of $50.00.

APT Price Prediction 2029

Thereafter, the Aptos price for the year 2029 could range between $24.00  and $58.00.

Aptos Price Prediction 2030

Finally, in 2030, the price of Aptos is predicted to maintain a steady positive. It may trade between $36.00 and $60.00.

Aptos Price Prediction 2031, 2032, 2033, 2040, 2050

Based on the historic data and trend analysis of the cryptocurrency along with the market sentiments, here are the possible Aptos price targets for the longer time frames.

YearPotential Low ($)Potential Average ($)Potential High ($)
203140.0060.0080.00
203245.0078.0097.00
203352.0088.00120.00
204080.00120.00200.00
2050150.00250.00400.00

Aptos Price Prediction: Market Analysis?

Year202620272030
Changelly$26.80$44.00$55.00
DigitalCoinPrice$33.00$56.00$68.00
WalletInvestor$30.00$45.00$50.00
Never Miss a Beat in the Crypto World!

Stay ahead with breaking news, expert analysis, and real-time updates on the latest trends in Bitcoin, altcoins, DeFi, NFTs, and more.

FAQs

What is Aptos (APT) and what makes it different from other blockchains?

Aptos is a Layer-1 blockchain built for speed and security, using the Move language to support scalable, low-latency decentralized applications.

What is the Aptos price prediction for 2026?

APT price forecasts for 2026 range between $10 and $30, depending on market conditions, adoption growth, and overall crypto cycle momentum.

Can Aptos (APT) reach $65 by 2030?

APT could approach $70 by 2030 if network usage grows steadily, developers continue building, and broader crypto markets remain supportive.

Is Aptos a good long-term investment?

Aptos shows long-term potential due to strong technology and scalability, but like all crypto assets, it carries risk and requires careful evaluation.

Why has Aptos price remained under pressure in recent years?

APT faced price pressure from early speculation cooling, token unlocks, and weak market sentiment, leading to prolonged consolidation phases.

Hedera (HBAR) Price Prediction 2026, 2027 – 2030: Will HBAR Price Hit $0.5?

Hedera Price Prediction 2024, 2025-2030

The post Hedera (HBAR) Price Prediction 2026, 2027 – 2030: Will HBAR Price Hit $0.5? appeared first on Coinpedia Fintech News

Story Highlights

  • The live price of Hedera crypto is  $ 0.08961033.
  • HBAR price prediction for 2026 suggests potential highs of $1.05
  • Long term forecasts indicate HBAR could reach $2.20 by 2030.

Hedera has been making waves in the cryptocurrency space, with a fast and secure blockchain that offers a distinct approach to transaction processing compared to Ethereum and other smart contract chains. It’s permission-only, meaning the blockchain is managed by private companies. Limiting what types of decentralised applications are allowed is what makes Hedera stand out from the rest.

Having entered the top 20 digital assets by market cap in 2024, it is now eyeing a potential leap into the top 10 by the end of 2025. Hedera has also recently ramped up its development activities for its ecosystem. Its ecosystem is strengthening, despite its capped price action. With increasing real-world use cases, institutional interest, and strategic partnerships, many are closely tracking HBAR price chart 2025 to gauge how high the token can rise.

With major companies like Google, IBM, and Chainlink Labs backing the project, and discussions about SEC approved HBAR ETF would flood string liquidity. Many are intrigued that: Will the HBAR Price Reach $1? Let’s discuss this in our Hedera price prediction 2025 article.

Hedera Price Today

Cryptocurrency Hedera
Token HBAR
Price $0.0896 down -0.78%
Market Cap$ 3,880,436,000.35
24h Volume$ 80,114,727.5453
Circulating Supply43,303,446,052.1368
Total Supply50,000,000,000.00
All-Time High$ 0.5701 on 16 September 2021
All-Time Low$ 0.0100 on 02 January 2020

Coinpedia’s HBAR Price Prediction 2026

HBAR fell below $0.100 by early 2026 and recently tested key dynamic support in February, suggesting potential demand. To maintain a bullish outlook for March, it needs to reclaim the $0.120 level; otherwise, it may pull back to $0.0800. In the long run, holding above $0.0800 is crucial to avoid a drop to $0.0453.

YearPotential Low ($)Potential Average ($)Potential High ($)
20260.150.401.05

Hedera (HBAR) Price March 2026 Outlook

HBAR is currently trading within a narrow range near $0.09–$0.10, indicating that the market is consolidating after recent volatility. The $0.088–$0.09 region has become an important support zone, where buyers have consistently defended the price. Holding this level keeps the short-term structure intact and allows for gradual recovery attempts.

On the upside, the first resistance sits near $0.105–$0.11, which aligns with previous rejection levels. A breakout above this zone could open the path toward $0.13–$0.15, where stronger liquidity is present. If momentum continues to build, HBAR could extend toward $0.18–$0.20, signaling a shift in short-term structure. However, if the price fails to hold the $0.088 support, the token could slip toward the $0.075–$0.08 demand zone, delaying recovery.

Overall, March appears to be a range-building phase, with the market watching closely for a breakout to confirm the next move.

Hedera (HBAR) Price Prediction 2026

Heading deeper into 2026, Hedera is likely to move through a recovery cycle rather than an immediate breakout phase. The current structure suggests that the market is gradually shifting from accumulation toward early expansion.

Hedera (HBAR) Price Prediction 2026

The first important level to watch is the $0.20–$0.25 range, which previously acted as a major resistance zone. Reclaiming this level would signal that HBAR has moved beyond its base formation and entered a recovery phase. Once this level is secured, the price could move toward $0.40–$0.50, where stronger selling pressure may appear. This zone will act as a key test of whether the recovery has enough strength to continue.

If the broader market enters a bullish phase and enterprise adoption within the Hedera ecosystem continues to expand, HBAR could gradually build momentum.

In a favorable scenario, HBAR could reach around $0.65 by 2026, reflecting a structured recovery rather than a sharp rally.

Hedera Price Prediction 2031, 2032, 2033, 2040, 2050

The long-term projection assumes Hedera sustains relevance in enterprise blockchain use cases, with growth moderating over time as the asset matures.

HBAR Price Prediction 2026 – 2030

YearPotential Low ($)Potential Average ($Potential High ($)
20260.450.801.05
20270.651.001.20
20280.801.101.60
20290.901.602.20
20301.402.203.00

HBAR Price Prediction 2026

Moving forward to 2026, forecast prices and technical analysis project that Hedera’s price is expected to reach a minimum of $0.45. The price could escalate to $1.05 on the higher end, with an average trading price hovering around $0.80.

HBAR Price Forecast 2027

Looking ahead to 2027, the optimism around Hedera will lead to steady growth. Hence, the HBAR price is forecasted to reach a low of $0.65, with a potential high touching $1.20 and an average forecast price of $1.00.

Hedera Price Forecast 2028

As we advance to 2028, with moderate gains, the HBAR predictions indicate that the price of a single HBAR could reach a minimum of $0.80, with the ceiling potentially rising to $1.60. Within the range, the average price will be $1.10.

HBAR Price Target 2029

By the time 2029 rolls around, it’s predicted that Hedera’s price will maintain its upward trajectory, reaching a minimum of $0.90, with the maximum price possibly reaching $2.20 and an average of $1.60, reflecting cautious optimism.

Hedera Price Prediction 2030

By the end of this decade, HBAR is predicted to touch its lowest price at $1.40, aiming for a high of $3.00 and an average price of $2.20. Hence, the prediction suggests stable long-term growth for Hedera’s market value.

Hedera Price Prediction 2031, 2032, 2033, 2040, 2050

The long-term projection assumes Hedera sustains relevance in enterprise blockchain use cases, with growth moderating over time as the asset matures.

YearPotential Low ($)Potential Average ($)Potential High ($)
20311.502.503.50
20322.003.204.50
20333.005.006.20
20408.2012.0015.00
205015.0022.0030.00

Hedera (HBAR) Price Prediction: Market Analysis?

Year202620272030
Changelly$0.68$1.10 $2.40
CoinCodex$0.90$1.50$2.20
WalletInvestor$0.86$1.40$2.80
Never Miss a Beat in the Crypto World!

Stay ahead with breaking news, expert analysis, and real-time updates on the latest trends in Bitcoin, altcoins, DeFi, NFTs, and more.

FAQs

What is the Hedera (HBAR) price prediction for 2026?

HBAR could trade between $0.45 and $1.05 in 2026, depending on market conditions, with steady recovery expected rather than a rapid breakout.

What is the price prediction for HBAR in 2030?

By 2030, HBAR could trade between $1.40 and $3.00, supported by steady adoption, enterprise use cases, and long-term market growth.

Could HBAR reach $1 by 2040?

Reaching $1 by 2040 is realistic if growth continues, as long-term projections suggest HBAR could exceed that level with sustained adoption.

How much is Hedera worth in 2050?

By 2050, HBAR could range between $15 and $30 if the network maintains relevance and adoption in enterprise blockchain use cases.

❌