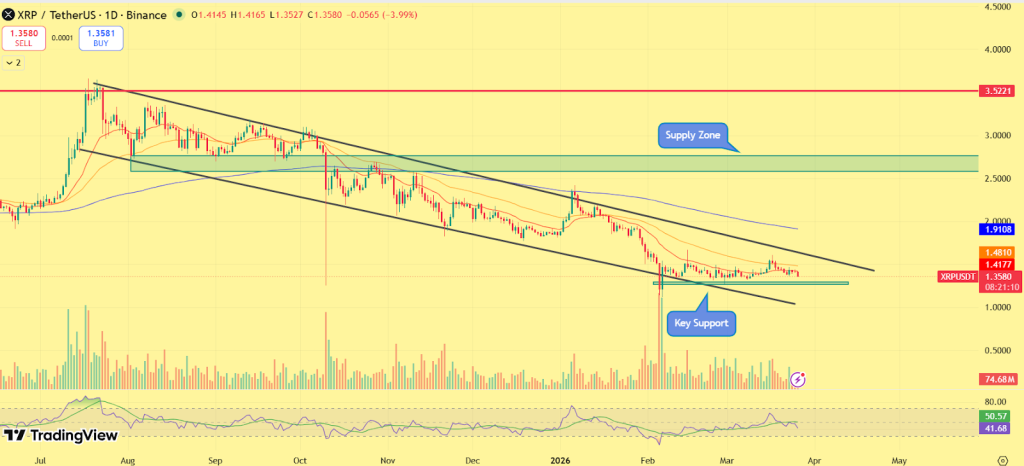
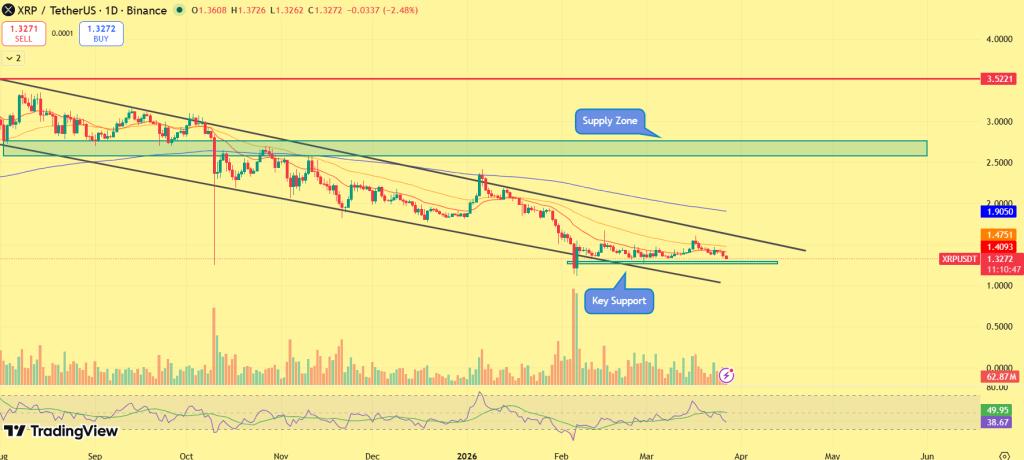
XRP price analysis shows the market entering a critical phase as conflicting signals begin to emerge beneath the surface. With XRP price trading around $1.33, derivatives data reflects a sharp increase in open interest, pointing to growing trader participation. At the same time, liquidation heatmaps reveal clearly defined liquidity zones, suggesting that price is now trading between key levels where strong reactions are likely.
This combination of rising positioning and structured liquidity zones often precedes significant moves. As volatility compresses and pressure builds, XRP appears to be approaching a decisive moment where the next breakout could define its short-term trend.
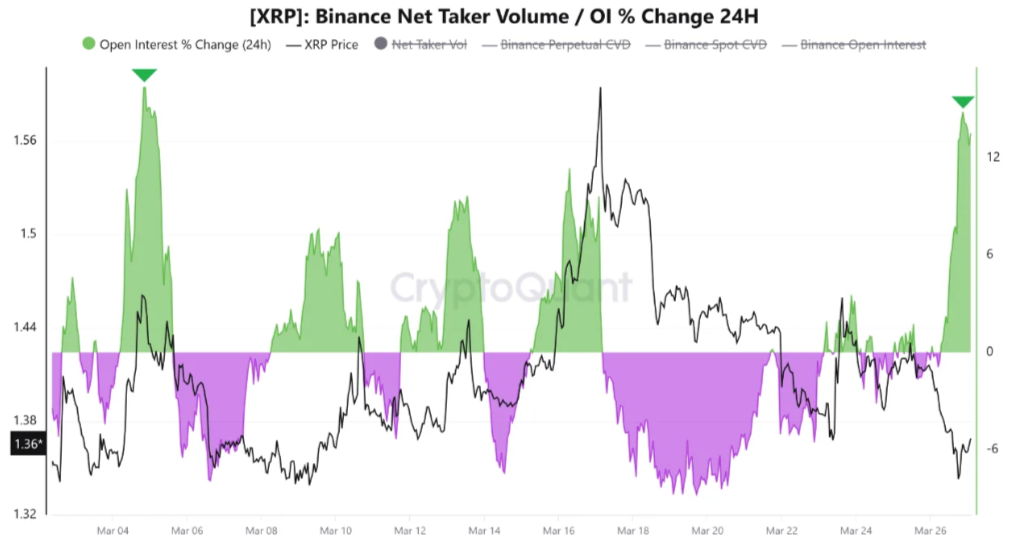
XRP Open Interest Climbs, Signaling Volatility Expansion
Recent derivatives data shows XRP’s open interest climbing to 14.8%, marking a notable increase in leveraged positioning across major exchanges.
This rise reflects renewed interest from traders positioning ahead of a potential move. Typically, such increases signal that the market is preparing for expansion, as both long and short positions build simultaneously. However, higher open interest also introduces increased volatility. As leverage builds, price movements tend to accelerate, often leading to sharp directional moves once key levels are tested.
In XRP’s current structure, the rise in open interest suggests that the market is coiling for a breakout, with positioning building ahead of a potential volatility expansion phase.
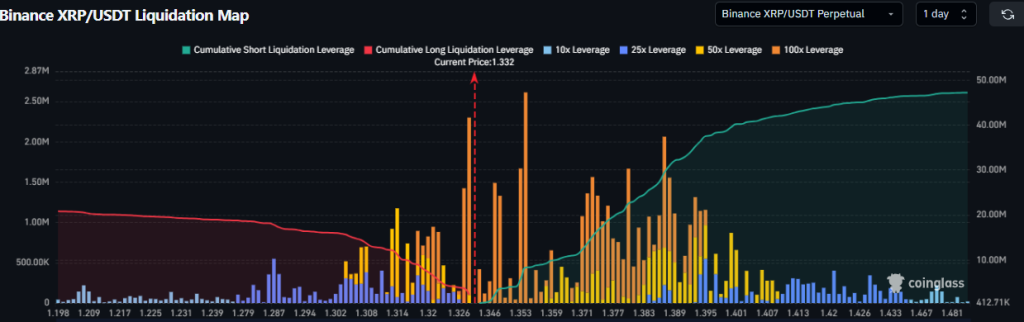
XRP Liquidation Map Identifies Key Support and Resistance Zones
Liquidation heatmap data provides a clearer picture of where liquidity is concentrated, helping define XRP’s key reaction zones. A dense cluster of liquidity is visible around the $1.25–$1.30 region, establishing this area as a strong support zone. This level has consistently attracted buying interest, as liquidity below it creates conditions for potential rebounds.
On the upside, significant liquidation concentration is observed near $1.45, marking it as an immediate resistance level. Beyond that, a larger liquidity pocket exists between $1.90 and $2.00, which could act as a major barrier if bullish momentum develops. These zones do not indicate weakness but rather highlight where price is likely to react. Markets are naturally drawn toward liquidity, and XRP is currently positioned between these key levels, suggesting that the next move may be driven by a liquidity sweep rather than gradual momentum.
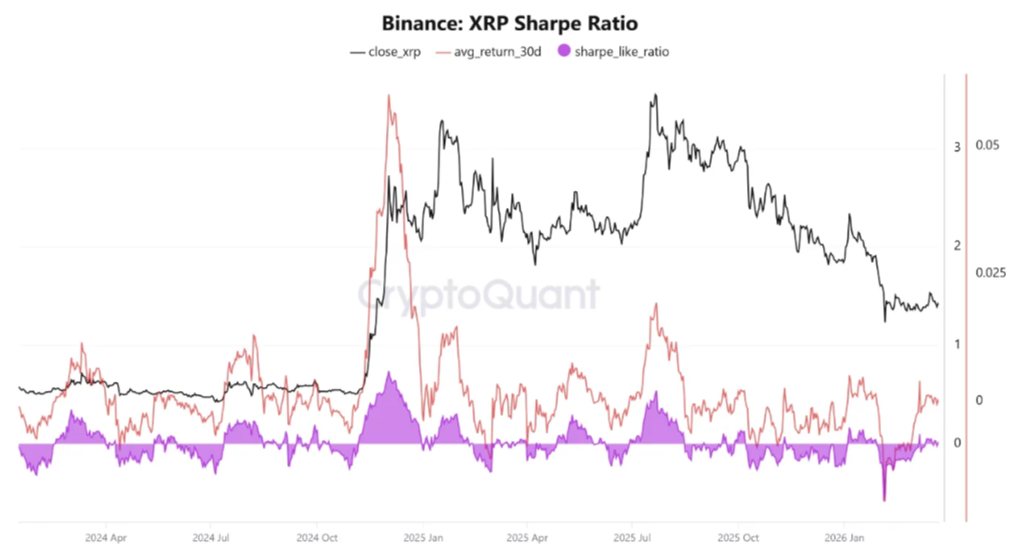
Sharpe Ratio Turns Positive, Suggesting Stabilization
Amid rising activity, XRP’s Sharpe Ratio has turned positive, indicating an improvement in risk-adjusted returns. This shift suggests that recent price performance is becoming more efficient relative to volatility, pointing to early signs of stabilization.
While not yet confirming a strong bullish trend, it reflects a transition from weaker conditions toward a more balanced market environment. Historically, such improvements often precede more sustained price movements, as stability returns beneath short-term fluctuations.
XRP Price Analysis: What’s Next for XRP?
XRP price is trading within a defined range between support and resistance liquidity zones. The $1.25–$1.30 region remains a critical support level. Holding this zone is essential for maintaining the current structure and preventing further downside.
On the upside, $1.45 acts as the immediate resistance level. A breakout above this zone could trigger a move toward the $1.90–$2.00 region, where the next major liquidity cluster sits. While a break below $1.20 could push XRP price toward the $1.05-$1.10 range. As price continues to compress within this range, the likelihood of a breakout increases. The direction of this move will largely depend on which liquidity zone is tested and cleared first.
Final Words
XRP is currently positioned in a high-liquidity, high-volatility environment, where multiple signals are converging. The rise in open interest highlights growing participation, while liquidation heatmaps define clear reaction zones. At the same time, improving risk metrics suggest that the market may be stabilizing beneath the surface. This setup typically leads to decisive price action, as markets move toward liquidity clusters before establishing direction.
If XRP breaks above resistance with strong follow-through, it could initiate a recovery phase. However, a move below support may trigger a downside liquidity sweep before any sustained upside develops. For now, XRP remains in a compression phase, where the next move is likely to be sharp, fast, and driven by liquidity dynamics rather than gradual sentiment shifts.
Solana is beginning to flash signals that traders rarely ignore. While the broader crypto market remains uncertain, SOL is quietly building a case for a potential breakout. A key technical indicator has flipped bullish, just as on-chain data shows Solana tightening its grip over one of crypto’s fastest-growing sectors, real-world asset (RWA) tokenization.
This convergence of technical reversal signals and strong network activity often emerges before major moves. With momentum starting to shift, the question now is: Is Solana price about to skyrocket?
TD Sequential Signals Potential Reversal
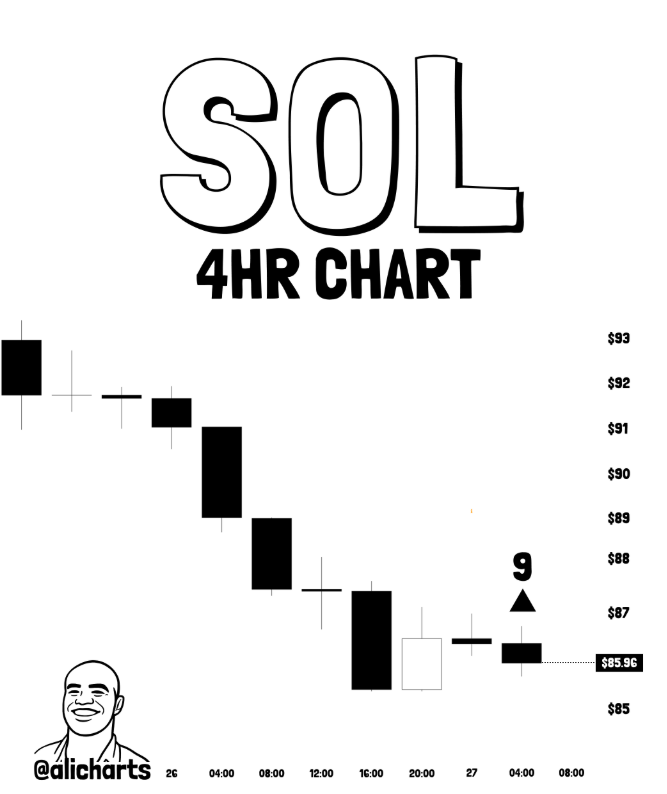
Recent chart data shows the TD Sequential indicator printing a buy signal on the 4-hour timeframe, a pattern commonly associated with exhaustion in downtrends. This signal typically appears when selling pressure begins to fade, suggesting that bears may be losing control.
While it does not guarantee an immediate rally, it often acts as an early indication that a short-term reversal could be forming. In the current setup, the signal aligns with stabilizing price action, increasing the probability that SOL may be transitioning from a corrective phase into an early recovery stage.
Solana Strengthens Its Position in RWA Market
Beyond technical signals, Solana’s fundamental growth is strengthening its market position. Recent data indicates that the network accounts for nearly 98% of all tokenized on-chain spot equity volume, placing it at the center of the rapidly expanding RWA narrative. This level of dominance reflects increasing adoption and confidence in Solana’s infrastructure for real-world financial applications.
BIG DATA: SOLANA DOMINATES IN RWA AND TOKENIZATION$SOL has established itself as the dominant L1 force when it comes to tokenization and RWAs, accounting for some 98% of all tokenized onchain spot equity volume over the past week (per TokensOnSolana).
In addition, the network processed approximately 826 million transactions within a single week, representing a significant share of overall blockchain activity. Such sustained throughput highlights strong user engagement and reinforces Solana’s role as a high-performance ecosystem. Together, these metrics point toward real demand rather than speculative interest, a key factor that often supports long-term price strength.
Historical Pattern: The Signal That Preceded Every Major Solana Rally
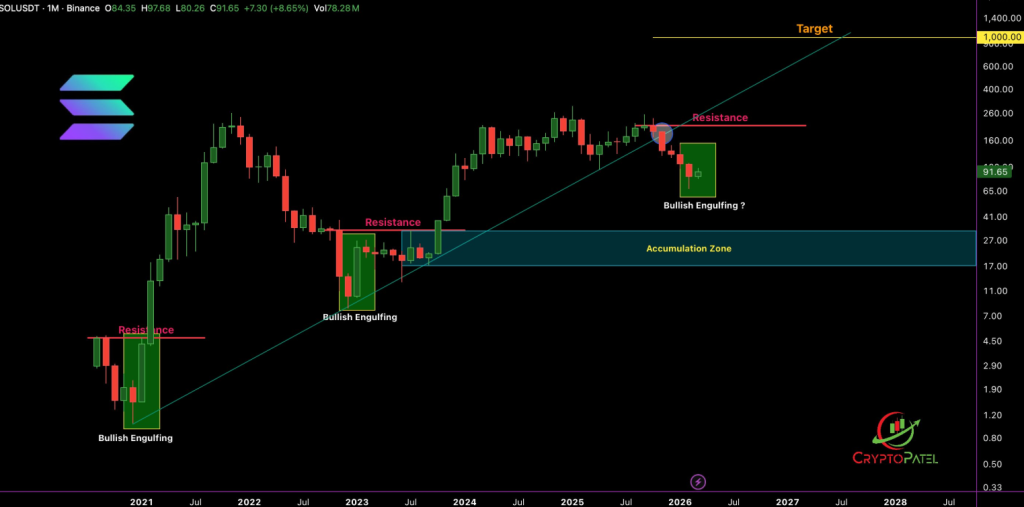
A deeper look into Solana’s historical price behavior reveals a recurring pattern that traders are beginning to monitor again, the formation of a monthly bullish engulfing candle.
In previous market cycles, this single signal has consistently preceded major upside expansions. Each time Solana printed a strong bullish engulfing structure on the monthly timeframe, it marked the beginning of a sustained rally phase.
Conversely, periods lacking this confirmation have struggled to generate meaningful upward momentum. This reinforces the importance of the pattern as a macro-level trigger, rather than just a short-term signal. At present, Solana has yet to fully confirm this structure. However, the developing setup is drawing attention, as a confirmed engulfing candle could signal a broader trend reversal and potentially unlock stronger upside momentum.
Key Levels to Watch
In the near term, maintaining support around the current consolidation zone around $75-$80, will be crucial for sustaining bullish momentum. A breakdown below this level could delay recovery and reintroduce downside risk toward $70. On the upside, the first major resistance lies near recent rejection levels around $90-$95. A breakout above this zone would act as confirmation of strength and could accelerate price toward higher levels toward $110-$120, aligning with the broader bullish signals seen across both technical and on-chain data.
Outlook: Can Solana Lead the Next Market Move?
Solana’s current setup reflects a strong alignment of technical indicators, network growth, and sector dominance. While macro conditions remain a key variable, SOL is beginning to show relative strength compared to the broader market. If momentum continues to build and resistance levels are cleared, Solana could transition into a high-momentum recovery phase, potentially positioning itself as a leader in the next market cycle.
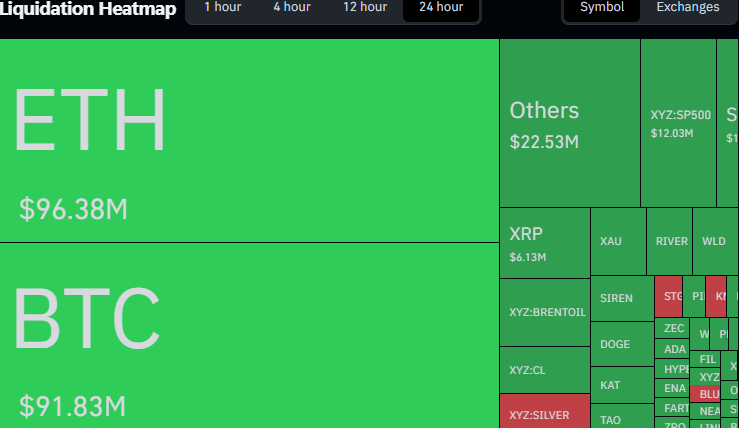
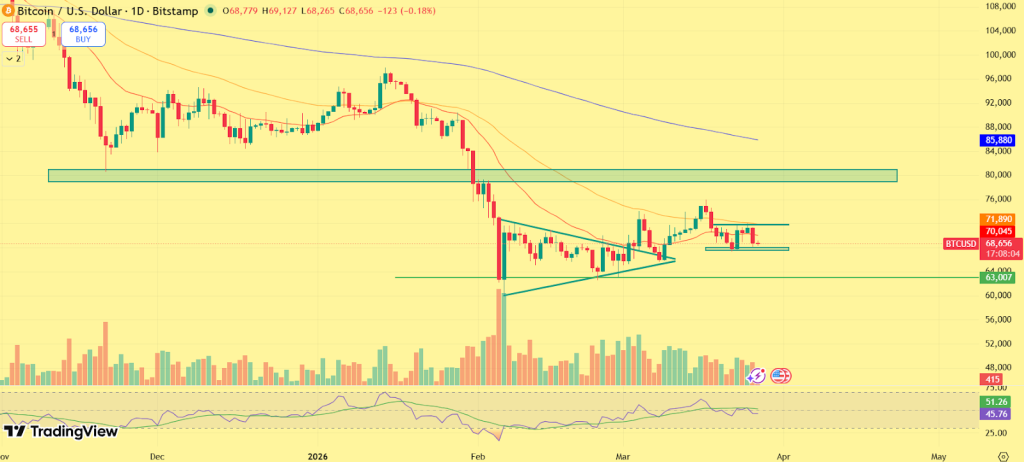
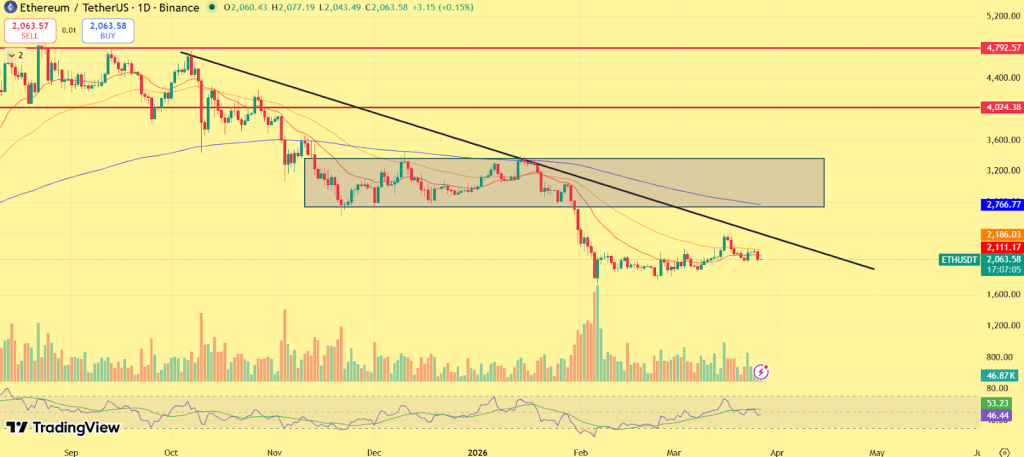
The crypto market is flashing a clear warning, and this time, it’s not just technicals driving the move. Bitcoin price has slipped to $68,670, Ethereum price has dropped near $2,050, and over $336 million in liquidations have already been triggered as geopolitical tensions escalate. The catalyst? A sharp deterioration in the US–Iran conflict, which is rapidly pushing global markets into a risk-off mode.
With sentiment now firmly in the fear zone, the big question is no longer whether volatility is coming, but how deep this crypto crash could go if macro pressure intensifies further.
War Tensions Trigger Broad Crypto Sell-Off
The latest escalation in the US–Iran conflict has rattled global financial markets, with investors quickly moving away from high-risk assets. Crypto, which has increasingly behaved like a risk-on instrument in recent cycles, is now reacting sharply to geopolitical uncertainty.
Recent developments indicate that Iran has rejected key diplomatic proposals, prolonging uncertainty and keeping markets on edge. This has directly impacted crypto sentiment, with Bitcoin dropping below the critical $69K region while Ethereum and other major altcoins follow suit. The broader market reaction highlights a growing trend, crypto is no longer acting as a hedge, but rather as a liquidity-sensitive asset tied to global macro conditions.
Liquidations Surge as Market Structure Weakens
The sudden downturn has triggered a cascade of liquidations across derivatives markets. Over $336 million in positions have been wiped out, with long traders taking the biggest hit as prices moved sharply lower.
This type of liquidation spike typically accelerates downside momentum, as forced selling pushes prices further down in a short period. It also reflects excessive leverage in the system, which tends to unwind aggressively during macro-driven shocks.
At the same time, the Crypto Fear and Greed Index dropping to 29 confirms a rapid deterioration in sentiment. Markets have shifted from cautious optimism to fear within a short span, indicating that traders are reducing exposure and waiting for stability.
Bitcoin & Ethereum Price Analysis: Key Levels To Watch
Bitcoin price is now testing a crucial support zone around $68,000–$68,500. This level has historically acted as a short-term demand area, but repeated tests weaken its strength.
A confirmed breakdown below this region could expose Bitcoin to a deeper move toward $65,000, where stronger support lies. For the past sessions, Bitcoin has failed to sustain above the hurdle of $70,000-$73,000 and faced rejection multiple times. A clean break above $73K would lead to a massive short covering move toward $80K in the short term.
Meanwhile, Ethereum price is holding near the $2,000–$2,050 range, a key psychological and structural level. If this zone fails to hold, downside could extend toward $1,900, increasing pressure across the altcoin market. On the upside, recovery will require Bitcoin to reclaim the $70,000 level, while Ethereum needs to move back above $2,200 to regain bullish momentum. Until then, rallies are likely to face selling pressure.
Outlook: Volatility Likely to Intensify
The current market setup reflects a clear convergence of macro stress, liquidation pressure, and weakening sentiment. The escalation in geopolitical tensions has introduced a layer of uncertainty that is difficult for markets to price in quickly. In the near term, volatility is expected to remain elevated. Any signs of de-escalation could trigger a relief bounce, but continued tensions may deepen the current correction.
For now, the crypto market remains in a fragile state, where macro headlines, not technical setups, are driving the next move.
XRP holds a strong demand zone at $1.30–$1.40. If support remains intact, the token could shift from consolidation to recovery as broader crypto market momentum builds..
Long-term forecasts suggest XRP could reach $5–$6 by 2026 and potentially $18 by 2030, driven by institutional adoption, Ripple partnerships, and global payment integration
Ripple (XRP) Ripple’s XRP remains one of the most closely watched assets in the crypto market, largely due to its strong positioning in the cross-border payments sector and the continued expansion of Ripple’s financial infrastructure. Over the years, Ripple has focused on building partnerships with banks and payment providers to streamline international settlements through blockchain technology. XRP’s long-term outlook continues to revolve around global payment integration, institutional partnerships, and the adoption of RippleNet and On-Demand Liquidity solutions. These developments could gradually strengthen XRP’s role as a bridge asset for international payments.
XRP price structure around $1.30–$1.40 has emerged as an important demand zone where buyers have shown consistent interest. If this area continues to hold, the market could gradually shift from consolidation to recovery. With the broader crypto market entering another potential expansion phase, XRP remains positioned as one of the major altcoins that could benefit from renewed institutional and retail participation.Now, making this the most ideal time for XRP price prediction 2026-2030 to be in more focus. Read this to know in depth what’s coming next in XRP.
Coinpedia’s price outlook for Ripple highlights that XRP could reach around $5–$6 by 2026, while a stronger market cycle and increased institutional usage could push the token toward $18 by 2030.
Year
Potential Low ($)
Potential Average ($)
Potential High ($)
2026
3.40
6.50
9.50
XRP Price Prediction March 2026
XRP is currently trading around $1.35, holding a steady range after recent volatility, and as March comes to an end, the price structure suggests a tight consolidation phase rather than a clear trend. Throughout March, XRP has struggled to sustain moves above the $1.40–$1.45 resistance zone, while buyers have consistently defended the $1.25–$1.30 support range. This behavior reflects a market where momentum is limited, but downside pressure is also being absorbed.
Heading into April, the key trigger remains a breakout above $1.45. If XRP manages to clear this level with strength, it could open the path toward the $1.60–$1.75 range, signaling a shift in momentum.
On the downside, if XRP loses the $1.25 support, the price may slip toward the $1.10–$1.15 zone, where the next demand area is likely to emerge. Overall, XRP appears to be in a range-bound accumulation phase, and the upcoming breakout from this structure will likely define its direction for April.
XRP Price Prediction 2026
Looking further into 2026, XRP’s growth potential will largely depend on the broader cryptocurrency market cycle and Ripple’s continued expansion in the financial sector. If Ripple strengthens its partnerships with global financial institutions and the adoption of blockchain-based payment infrastructure increases, XRP could gradually regain investor confidence.
Historically, major altcoins tend to perform strongly during bullish market cycles, and XRP has often been among the leaders during such periods.
From a technical perspective, reclaiming the $2 level would be the first signal of a stronger recovery. Once this level is established as support, XRP could move toward $3–$4, where significant resistance previously existed. If the broader market enters a strong expansion phase, XRP could potentially reach $5–$6 by the end of 2026, supported by increasing liquidity and institutional interest.
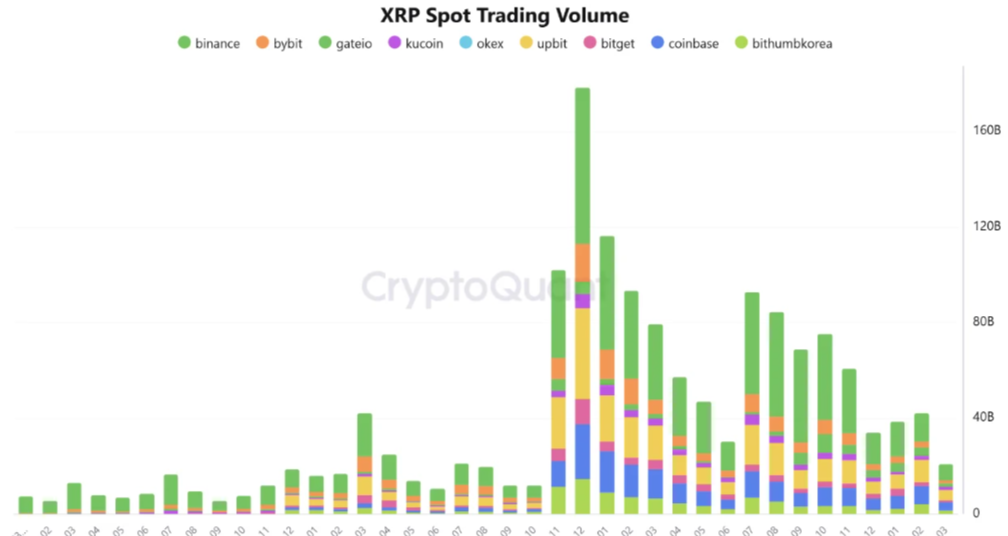
XRP On-Chain Outlook
XRP’s on-chain data is currently pointing toward a cooling market environment, where activity has slowed but structural conditions are quietly improving. Spot trading volume across exchanges has dropped to its lowest level since 2024, reflecting reduced participation and weaker short-term momentum. This decline indicates that the market is no longer driven by aggressive trading, but is instead moving through a low-liquidity consolidation phase. At the same time, liquidity remains concentrated on major platforms like Binance, Upbit, and Coinbase, suggesting that while overall activity has declined, core market interest is still intact.
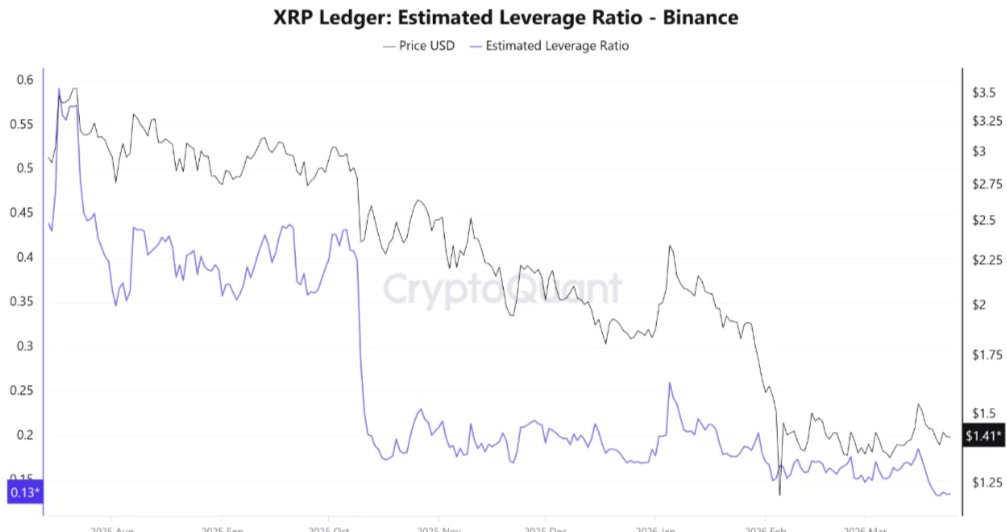
On the derivatives side, a more significant shift is unfolding. XRP’s leverage and open interest in Binance have dropped sharply, signaling a major reset in speculative positioning. The estimated leverage ratio has fallen substantially from previous highs, while open interest has cooled to much lower levels. This indicates that leveraged traders have largely exited or reduced exposure, removing excess risk from the market.
This combination of declining spot activity and reduced leverage suggests that XRP is transitioning from a highly speculative phase into a cleaner, more stable structure. With the market now less crowded and less prone to liquidation-driven volatility, the current setup reflects a reset phase, where pressure is building more gradually.
Overall, XRP’s on-chain signals point toward a market that is not weakening, but resetting after excess, creating conditions that often precede a more sustainable and directional move once momentum returns.
Ripple (XRP) Price Prediction 2026 – 2030
Year
Potential Low ($)
Potential Average ($
Potential High ($)
2026
3.40
6.50
9.50
2027
7.50
10.00
12.00
2028
8.80
11.50
16.00
2029
14.20
19.00
22.00
2030
18.80
23.00
30.00
Ripple (XRP) Price Prediction 2026
The XRP price range in 2026 is expected to be between $3.40 and $9.50
XRP Price Prediction 2027
Ripple (XRP) price range can be between $7.50 to $12.00 during the year 2027.
XRP Price Forecast 2028
In 2028, Ripple is forecasted to potentially reach a low price of $8.80, an average price of $11.50, and a high price of $16.00.
XRP Price Targets 2029
Thereafter, the XRP price for the year 2029 could range between $14.20 and $22.00.
Ripple (XRP) Price Prediction 2030
Finally, in 2030, the price of XRP is predicted to remain steady and positive. It may trade between $18.80 and $23.00.
Based on historical market sentiment and trend analysis, the following are the possible XRP price targets for longer-term time frames.
Year
Potential Low ($)
Potential Average ($)
Potential High ($)
2031
25.00
29.50
35.25
2032
31.50
36.75
41.25
2033
35.75
42.25
47.75
2040
97.50
135.50
179.00
2050
219.25
331.50
526.00
Market Analysis
Year
2026
2027
2030
Changelly
$3.00
$6.50
$17.76
DigitalCoinPrice
$4.20
$7.50
$18.00
WalletInvestor
$4.80
$7.90
$20.00
Never Miss a Beat in the Crypto World!
Stay ahead with breaking news, expert analysis, and real-time updates on the latest trends in Bitcoin, altcoins, DeFi, NFTs, and more.
FAQs
What is the XRP price prediction for 2026?
XRP could trade between $3 and $6 in 2026 if crypto market momentum strengthens and Ripple expands partnerships with banks using RippleNet and ODL.
How high will XRP go in 2030?
XRP could potentially reach $18–$30 by 2030 if the crypto market enters a strong bull cycle and Ripple expands global payment partnerships.
What is the price prediction for XRP in 2031?
Market projections suggest XRP could trade around $25–$35 in 2031, depending on global crypto adoption and Ripple’s continued growth in payment infrastructure.
How much will 1 XRP be worth in 2040?
If adoption of blockchain payments grows and Ripple strengthens its financial network, XRP could trade between $97 and $179 by 2040.
How much will 1 XRP be worth in 2050?
Long-term projections indicate XRP could reach $219–$526 by 2050 if blockchain payment networks become widely used across global financial systems.
What could drive XRP’s price growth long term?
XRP’s long-term growth may depend on global payment adoption, institutional partnerships, and wider use of Ripple’s blockchain infrastructure.
Is XRP a good investment?
XRP may be a promising investment due to its role in cross-border payments and growing institutional adoption, but price volatility and regulation risks remain.
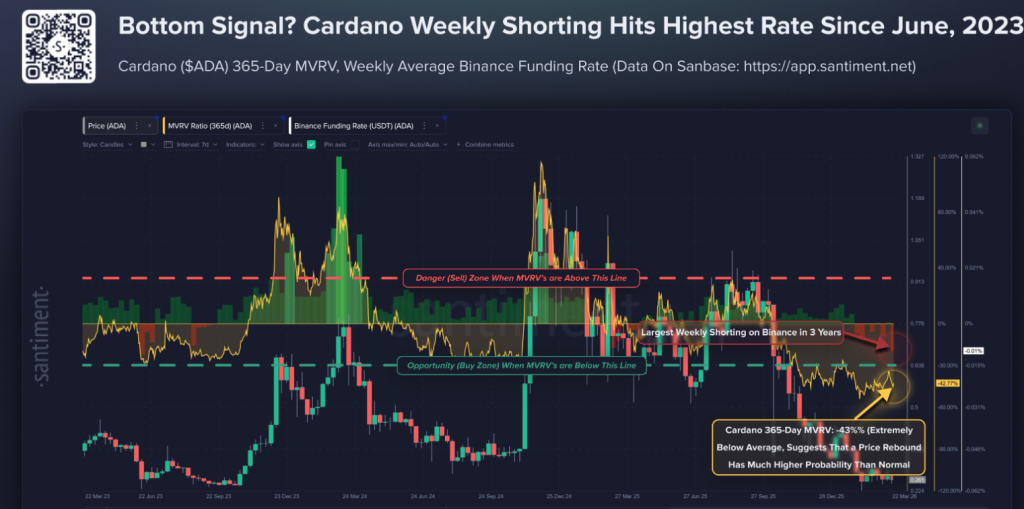
Cardano price may be flashing one of its strongest reversal signals in months, and most of the market is still looking the other way. As sentiment sinks deeper into fear, on-chain data shows holders sitting on heavy losses, while smart money quietly flips bullish. At the same time, derivatives positioning is shifting fast, with top traders aggressively building long exposure. Historically, this combination has marked key turning points, not continuation phases.
With price compressing and pressure building, the setup is clear, Is ADA price about to catch the market off guard with a sharp breakout?
On-Chain Data Signals Deep Undervaluation
Recent on-chain data highlight a critical development: Cardano’s MVRV (Market Value to Realized Value) has dropped sharply into negative territory, with average wallets sitting at significant unrealized losses. Historically, such extreme negative MVRV levels have aligned with accumulation phases, where long-term investors begin to step in as risk-reward improves. The logic is straightforward, when the majority of holders are at a loss, selling pressure tends to exhaust, creating conditions for a potential trend reversal.
In previous market cycles, similar setups have often marked macro bottoms or early-stage recovery zones, making the current structure particularly noteworthy from a risk-adjusted perspective.
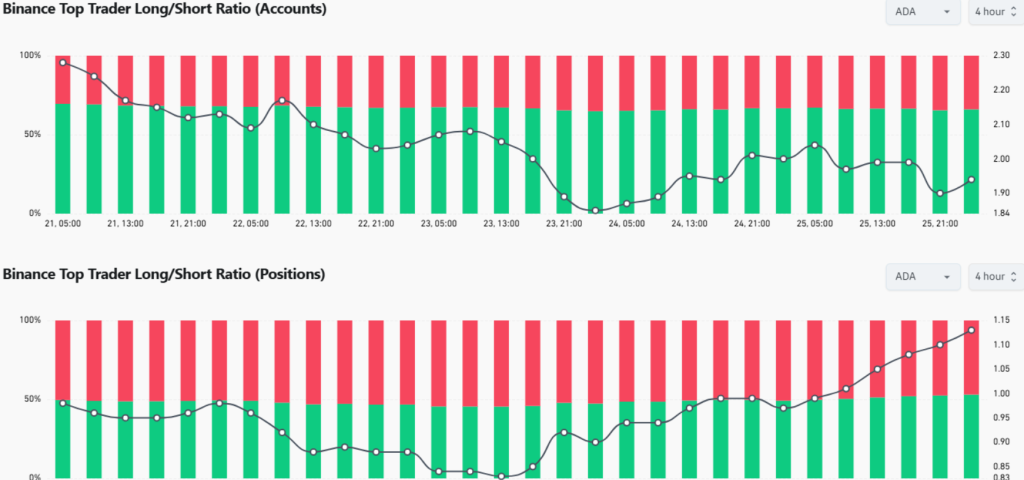
Binance Traders Flip Bullish on ADA
Adding to the bullish narrative, derivatives data from Binance reveals a clear shift in positioning among top traders. Long positions in ADA have increased sharply, rising by nearly 10% within just a few days, signaling growing confidence among experienced market participants. At the same time, broader funding rate data shows an unusually high concentration of short positions in the market. This imbalance creates conditions for a potential short squeeze, where any upward price movement could force short sellers to cover positions, accelerating upside momentum.
This divergence between retail pessimism and smart money positioning often acts as an early signal of trend shifts, particularly when combined with supportive on-chain metrics.
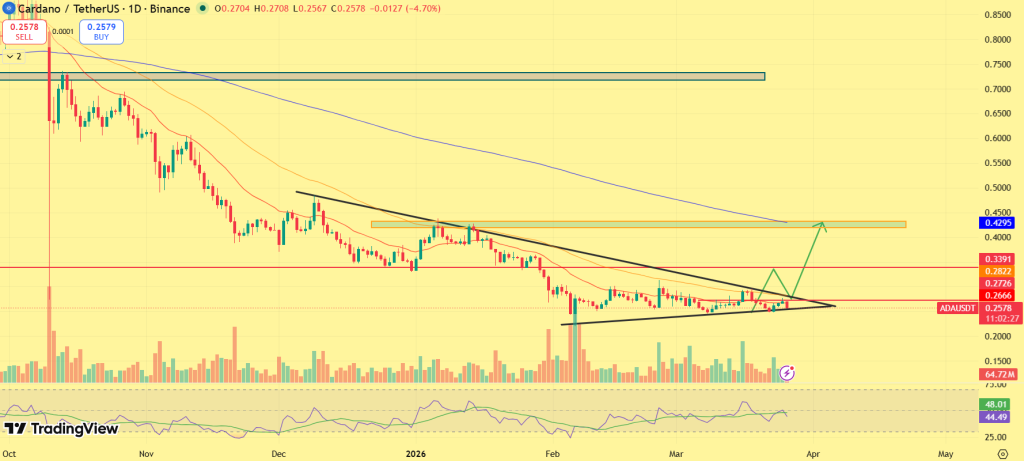
Cardano Price Analysis: ADA Coils at Key Breakout Zone as Pressure Builds
Cardano’s price structure is now entering a decisive phase, where compression is nearing its resolution point. After a prolonged downtrend, ADA has transitioned into a tight symmetrical consolidation, reflecting a balance between buyers stepping in and sellers gradually losing control.
The $0.25–$0.26 support level has acted as a strong base, absorbing selling pressure despite broader market weakness. On the upside, ADA continues to face a firm supply barrier around $0.33–$0.34, a level that has rejected multiple breakout attempts. This repeated rejection confirms it as a critical liquidity zone where sellers remain active.
However, the narrowing price action suggests that this resistance is being tested under increasing pressure. A decisive move above this region could trigger a shift in market structure, opening the path toward $0.42–$0.45, where the next major resistance cluster lies. If ADA fails to hold above the $0.25 support, the bullish thesis weakens, potentially exposing downside toward lower liquidity zones. However, as long as price continues to hold and compress within this range, the probability of an upside breakout gradually increases.
FAQs
Why is Cardano (ADA) showing a potential reversal signal?
ADA’s MVRV is deeply negative, signaling holders’ losses may exhaust selling pressure and smart money is starting to accumulate.
What is Cardano (ADA) price prediction for 2026?
ADA may rise if $0.25 support holds and buyers push past $0.34 resistance, potentially targeting $0.42–$0.45 in the near term.
Is Cardano a good buy during the current market dip?
With negative MVRV and smart money accumulating, ADA shows strong risk-reward potential for buyers seeking early-stage recovery opportunities.
What technical levels should traders watch for Cardano?
Key levels: support $0.25–$0.26, resistance $0.33–$0.34. Breaking resistance may open the path to $0.42–$0.45, confirming bullish momentum.
While most of the market remains distracted, FET’s on-chain data and technical indicators are aligning in a way that often precedes major breakouts. A recent multi-million dollar whale accumulation, combined with a strong signal from the On-Balance Volume (OBV) indicator, suggests that smart money may already be positioning. With price beginning to recover from its base and momentum slowly building, the big question now is, is FET price about to surprise the market with a sharp upside rally?
Whale Accumulation Signals Growing Confidence
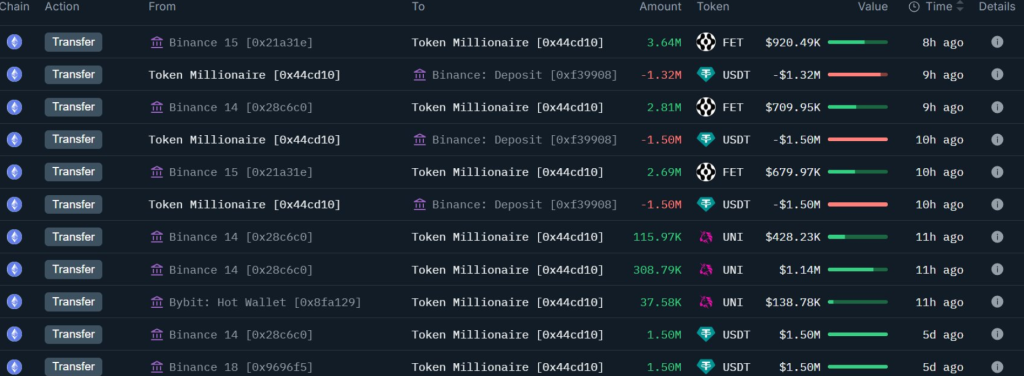
Fresh on-chain data reveals that a whale has accumulated 914 million FET tokens worth approximately $2.34 million from Binance, alongside additional altcoin purchases. Such large-scale accumulation typically reflects growing conviction among high-net-worth participants, especially when it occurs after a prolonged consolidation phase. Historically, whale buying at lower levels has often preceded strong upward moves, as large players tend to position early before momentum becomes obvious to the broader market.
The timing of this accumulation suggests that institutional or smart money interest in FET may be increasing, particularly as AI-related narratives regain traction in the crypto space. This development is critical because it indicates that despite recent market uncertainty, capital is selectively flowing into high-potential assets, with FET emerging as one of the key beneficiaries.
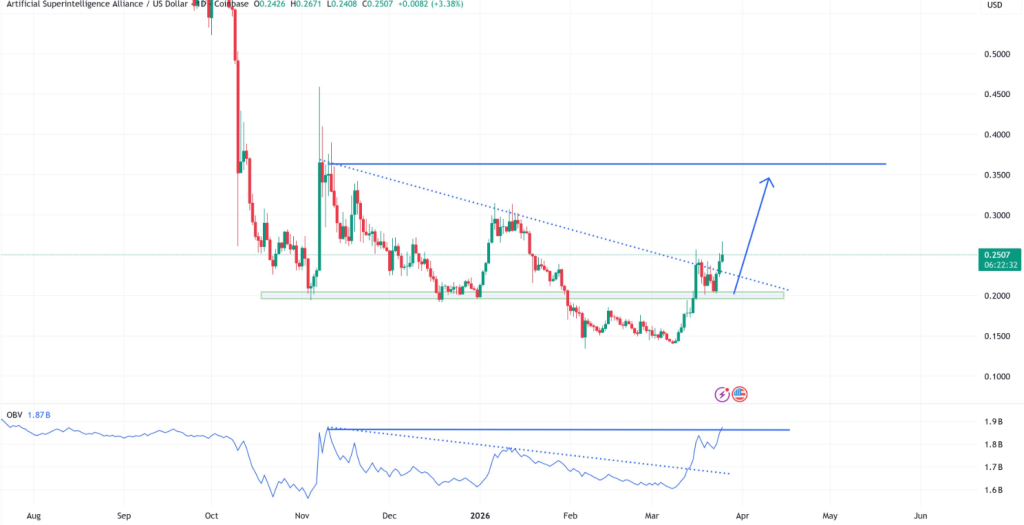
OBV Indicator Flashes Bullish Divergence
Adding further weight to the bullish case is the behavior of the On-Balance Volume (OBV) indicator. According to market analysts, OBV is showing a steady rise even when price action has remained relatively subdued. This type of divergence is often interpreted as a leading signal of accumulation, where buying pressure builds beneath the surface before reflecting in price. In simpler terms, volume is increasing in favor of buyers, even though price has yet to fully respond.
Such setups have historically preceded strong breakouts, as latent demand eventually pushes price higher once resistance levels are tested. The current OBV structure suggests that FET may be in the early stages of this process.
FET price appears to be transitioning out of a downtrend into a recovery phase. The chart shows that price has formed a base and is now attempting to move higher, supported by improving momentum. A key observation is the formation of a higher low structure, indicating that selling pressure is gradually weakening. At the same time, price is approaching a critical resistance zone, which could act as the trigger point for the next major move.
If bulls manage to sustain momentum and break above this resistance, it could open the door for a sharp continuation toward higher levels, aligning with the signals observed in both on-chain data and volume indicators.
Key Levels to Watch
In the near term, immediate support is seen around the recent higher low region around $0.2200, which is acting as a foundation for the current recovery. Holding this level will be crucial to maintaining bullish structure. On the upside $0.2500, the primary resistance zone lies ahead, and a confirmed breakout above this level could accelerate momentum significantly toward $0.2700 followed by $0.2900. If this breakout occurs with strong volume confirmation, it may validate the ongoing accumulation narrative and trigger a broader rally.
FAQs
Is FET a good investment right now?
FET shows early bullish signs with whale accumulation and rising OBV. While promising, it remains volatile, so traders should confirm breakouts before entering.
What does whale accumulation mean for FET price?
Whale accumulation often signals confidence from large investors. It can precede price rallies, as big players typically position before momentum becomes visible.
Can FET trigger a breakout soon?
Yes, if momentum continues and resistance breaks with volume. Current structure, OBV divergence, and whale activity all point toward a potential breakout setup.
What is FET price prediction for 2026?
FET price predictions for 2026 vary widely, with estimates ranging from $0.20 to $0.55 on average, while bullish scenarios could reach $1+ depending on AI adoption and market trends.
A sudden $23 million on-chain transfer has put the Official TRUMP memecoin ($TRUMP) back under the spotlight, but this time, for the wrong reasons.
The move, traced to wallets linked with internal allocations, comes at a moment when price is already struggling below critical resistance. Historically, such transfers have often preceded exchange inflows and sharp volatility spikes, raising concerns of a potential sell-off.
With price structure weakening and whale activity surging, the market now faces a crucial question. Is the TRUMP coin preparing for a breakdown, or is this a calculated shakeout before the next rally?
Whale Movement Triggers Market Speculation
On-chain data reveals that approximately $23 million worth of $TRUMP tokens was moved from a team-associated wallet into a fresh address, a pattern that typically signals preparation for redistribution. While no direct exchange inflow has been confirmed yet, the market rarely waits for confirmation in such cases. Historically, similar high-value transfers have led to increased circulating supply once tokens hit exchanges, often triggering short-term price pressure. The timing of this move, combined with an already fragile technical setup, has amplified bearish expectations across the market.
$23M worth of tokens were transferred from a wallet associated with the team to a fresh wallet, from which we can potentially expect further withdrawals to exchanges.
We are tracking both of these wallets to stay informed of new movements, as only a… pic.twitter.com/iEP7LPzqNc
At the same time, whale metrics paint a more complex picture. The number of large holders has climbed to a multi-month high, suggesting that accumulation may be quietly taking place. This divergence, where potential distribution meets rising accumulation, creates a high-stakes environment, often leading to sharp and unpredictable price swings.
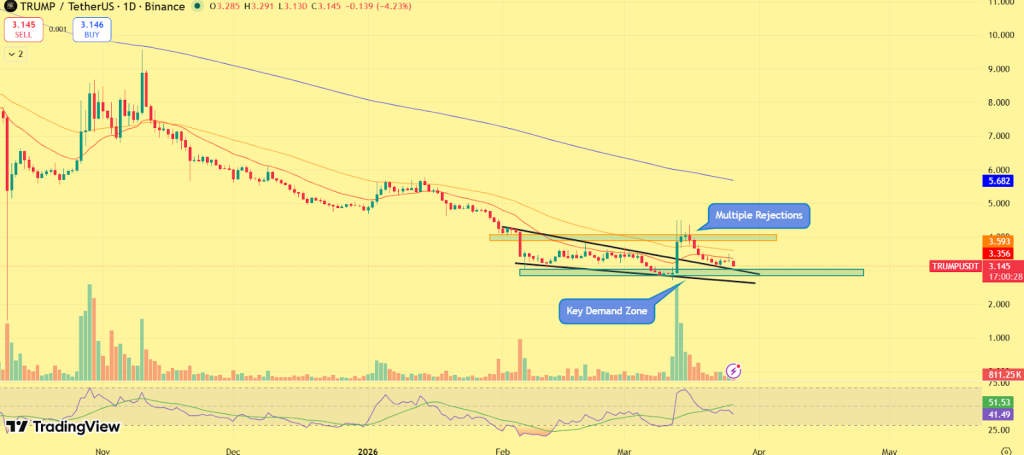
TRUMP Coin Price Retest Support Zone: Rebound or Breakdown?
The TRUMP coin is showing clear signs of weakness. The asset continues to trade within a descending structure, marked by consistent lower highs, a classic indication of bearish control. The most critical level remains the $3.80 to $4.00 resistance zone, where price has faced repeated rejection. Each failed breakout attempt has strengthened this zone as a supply barrier, with sellers aggressively defending higher levels. As a result, bullish momentum has been unable to sustain, keeping the broader trend under pressure.
Currently, the TRUMP coin price is hovering near the $3.10 support level, a zone that has provided temporary stability. However, the absence of strong buying continuation suggests that demand remains weak. Volume patterns further indicate that recent moves may be driven more by distribution than accumulation, reinforcing the cautious outlook.
Key Levels to Watch
The immediate structure places strong emphasis on the $3.00–$3.10 support zone, which now acts as a critical line of defense. A breakdown below this level could accelerate downside momentum, potentially pushing price toward the $2.60–$2.80 demand zone, where stronger buyer interest may emerge. On the upside, recovery depends on reclaiming the $3.50–$3.60 region, which would signal short-term strength returning. However, a full bullish shift would require a decisive breakout above the $3.80 resistance, a level that has consistently capped upside attempts.
Price predictions for 2026 range from $30.00 to $80.00.
Long-term outlook suggests gradual growth potential to approach $300 by 2030.
Ethereum Classic (ETC) is a Layer-1 blockchain that preserves the original Ethereum chain, maintaining a strong focus on immutability and decentralized principles.
Unlike Ethereum, which transitioned to proof-of-stake, Ethereum Classic continues to operate on a proof-of-work consensus, making it one of the few major smart contract platforms still relying on mining.
From a market standpoint, ETC is considered a legacy smart contract asset with cyclical relevance rather than continuous ecosystem-driven growth. Its price action is often influenced by broader market sentiment, proof-of-work narratives, and Bitcoin-led momentum.
As ETC trades near long-term historical lows, its forward price outlook becomes increasingly sensitive to the recovery phase in the wider crypto market.
As Ethereum Classic (ETC) price hangs around the demand zone of $10, its price behaviour and network fundamentals have positioned it as a speculative yet structurally resilient asset to track into 2026 and beyond.
Coinpedia’s price prediction for ETC is neutral to bullish. However, Ethereum Classic’s long-term outlook depends largely on its ability to retain relevance as a proof-of-work smart contracts network.
Moreover, Ethereum Classic’s long-term growth is likely to remain cyclical and sentiment-driven, with price expectations closely tied to broader market recoveries rather than organic adoption alone
CoinPedia expects that the ETC price will reach $80.00 by the year-end.
On the downside,, if ETC price sees a downtrend in the upcoming months, it may collapse the coin’s price to $30.00.
Year
Potential Low ($)
Potential Average ($)
Potential High ($)
2026
30.00
45.00
80.00
ETC Price Prediction March 2026
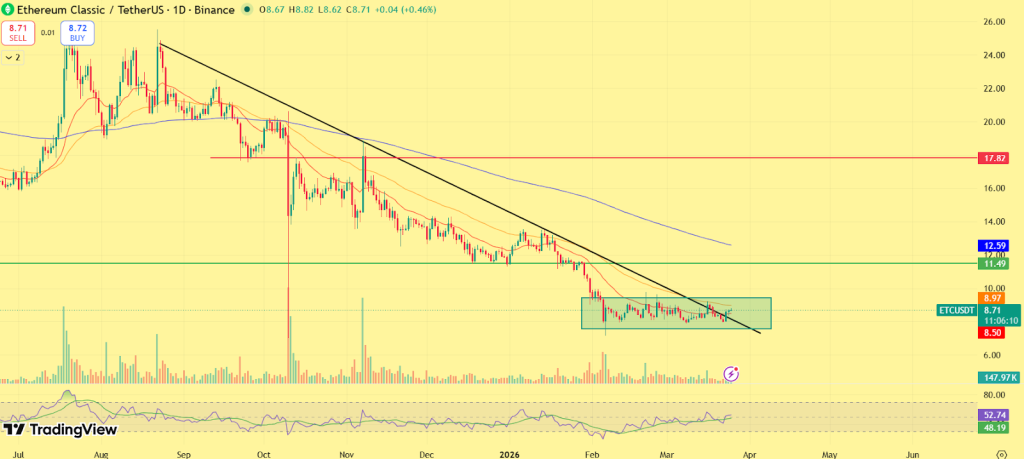
Ethereum Classic is currently trading near $8.70, where the price is attempting to stabilize after a prolonged downward trend. The recent structure suggests that ETC has entered a late-stage consolidation phase, with volatility compressing and price holding near a key base zone.
As March approaches its end, ETC is hovering just above the $8.40–$8.60 support region, which has started to act as a short-term demand zone. The repeated defense of this level indicates that sellers are losing momentum, while buyers are gradually stepping in to absorb supply.
Heading into early April, the price is likely to test the immediate resistance near $9.20–$9.50, which aligns with previous rejection zones. A sustained move above this range would be the first signal of a potential structure shift, opening the path toward $10.50–$11.50, where stronger resistance is expected. If momentum continues to build alongside broader market stability, ETC could extend toward $12–$13, marking a transition from consolidation into early recovery. However, if the price fails to hold above the $8.40 support, the structure could weaken again, leading to a potential drop toward $7.50–$7.80, where deeper demand may emerge.
Overall, the period between late March and early April appears to be a decision phase, where ETC is attempting to move out of its prolonged downtrend and establish a base for recovery.
Ethereum Classic Price Prediction 2026
Looking at the broader 2026 outlook, Ethereum Classic appears to be in the early stages of rebuilding after an extended correction cycle. The current structure suggests that the market is transitioning from accumulation toward a gradual recovery phase, although momentum is still developing. For ETC to confirm a stronger shift in trend, the price would need to reclaim the $12–$14 range, which represents a key structural resistance zone. A sustained move above this level would indicate that buyers are regaining control and that the recovery phase is strengthening.
Once this zone is secured, the price could gradually move toward $18–$22, where significant resistance is expected due to previous supply zones. This area will act as a major test for continuation, as it reflects a transition from recovery into expansion.
If broader market conditions turn supportive and capital flows back into mid-cap altcoins, ETC could extend its upside toward $25–$30, representing a more mature phase of the recovery cycle. At the same time, if ETC struggles to maintain support above the $8–$7.5 region, the recovery could be delayed, keeping the asset in a prolonged sideways structure before any meaningful breakout occurs.
In essence, 2026 is likely to unfold as a gradual rebuilding phase for Ethereum Classic, where price action shifts from consolidation into a structured uptrend, with upside developing progressively rather than through an immediate rally.
Year
Potential Low ($)
Potential Average ($)
Potential High ($)
ETC Price Prediction 2026
30.00
45.00
80.00
ETC Crypto Price Prediction 2026 – 2030
Year
Potential Low ($)
Potential Average ($
Potential High ($)
2026
30.00
45.00
80.00
2027
40.00
80.00
100.00
2028
80.00
100.00
150.00
2029
130.00
180.00
220.00
2030
200.00
220.00
300.00
Ethereum (ETC) Classic Price Prediction 2026
The ETC price range in 2026 is expected to be between $30.00 and $80.00.
ETC Crypto Price Prediction 2027
Ethereum Classic (ETC) price range can be between $40.00 to $100.00 during the year 2027.
Ethereum Classic Token Price Forecast 2028
In 2028, Ethereum Classic is forecasted to potentially reach a low price of $80.00, an average price of $100.00, and a high price of $150.00.
ETC Price Forecast 2029
Thereafter, the ETC price for the year 2029 could range between $130.00 and $220.00.
Ethereum Classic Price Prediction 2030
Finally, in 2030, the price of ETC is predicted to maintain a steady positive. It may trade between $200.00 and $300.00.
ETC Price Prediction 2031, 2032, 2033, 2040, 2050
Based on the historic market sentiments and trend analysis of the largest cryptocurrency by market capitalization, here are the possible ETC price targets for the longer time frames.
Year
Potential Low ($)
Potential Average ($)
Potential High ($)
2031
250.00
350.00
500.00
2032
320.00
400.00
600.00
2033
480.00
650.00
770.00
2040
800.00
980.00
1200.00
2050
1200.00
1500.00
2000.00
ETC Price Prediction: Market Analysis?
Year
2026
2027
2030
Changelly
$25
$45.00
$70.00
CoinCodex
$18.00
$29.00
$50.00
Binance
$35.00
$50.00
$80.00
Never Miss a Beat in the Crypto World!
Stay ahead with breaking news, expert analysis, and real-time updates on the latest trends in Bitcoin, altcoins, DeFi, NFTs, and more.
FAQs
What is Ethereum Classic (ETC) and how is it different from Ethereum?
Ethereum Classic is the original Ethereum blockchain that runs on proof-of-work, prioritizing immutability, unlike Ethereum’s proof-of-stake model.
What is the Ethereum Classic price prediction for 2026?
ETC is projected to trade between $30 and $80 in 2026, depending on market recovery, Bitcoin momentum, and proof-of-work demand.
What is the Ethereum Classic price prediction for 2027?
Ethereum Classic is expected to trade between $40 and $100 in 2027, driven by cyclical market recovery and renewed interest in proof-of-work assets.
What is the Ethereum Classic price prediction for 2028?
In 2028, ETC may range from $80 to $150 as broader crypto adoption and long-term accumulation phases support higher valuations.
What is the Ethereum Classic price prediction for 2030?
By 2030, Ethereum Classic could trade between $200 and $300 if long-term market growth and proof-of-work relevance continue.
What is the Ethereum Classic price prediction for 2040?
Long-term projections suggest ETC could reach $800 to $1,200 by 2040, assuming sustained crypto market expansion and legacy chain demand.
Bitcoin is currently trading at: $ 70,044.84668093
Bitcoin holds strong near $70K in 2026, signaling accumulation. A breakout above $75K could drive BTC toward $120K–$150K this cycle.
BTC remains range-bound between $67K–$75K, with strong demand below. Analysts predict a bullish expansion toward $150K+ before 2026 ends.
Bitcoin’s consolidation phase in 2026 reflects accumulation, not weakness, with long-term forecasts targeting $250K+ and up to $900K by 2030.
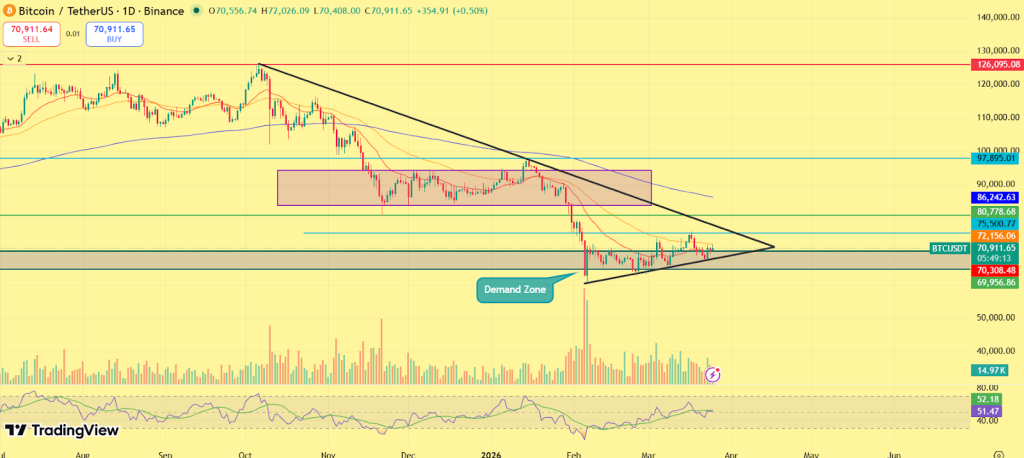
Three months into 2026, Bitcoin price continues to hover around the $70K–$71K zone, and the market is starting to realize that this isn’t weakness, it’s a phase of positioning. Despite multiple attempts, BTC has struggled to sustain moves above the $72K–$75K resistance, while every dip toward the $67K–$69K range is being absorbed quickly. This behavior reflects a market where selling pressure is no longer dominant, but buyers are also not chasing price aggressively. At the same time, capital rotation across the crypto market remains selective.
Large-cap assets like Bitcoin continue to hold relatively stable, while broader participation remains uneven, a pattern often seen when the market is rebalancing rather than trending. What’s also notable is the steady demand during dips. Recent price action shows consistent buying interest near support, suggesting that stronger hands are gradually building positions, while the lack of breakout continuation indicates that liquidity above remains heavy.
This push-and-pull dynamic has resulted in a tight compression structure, where volatility continues to contract and price action becomes increasingly controlled. Such phases don’t reflect weakness, they reflect preparation. With Bitcoin spending extended time within this range, the structure suggests that the market is building pressure near a key inflection zone, where the next move could define the broader trend for the months ahead.
With that in focus, let’s move into Bitcoin’s price prediction for 2026 and understand what lies ahead.
Coinpedia’s BTC Price Prediction 2026
Coinpedia’s price prediction suggests that Bitcoin is currently in a transitional phase, cooling off after its 2025 peak while holding a long-term bullish structure. The ongoing consolidation near $70K reflects a reset in momentum rather than a breakdown, with the market rebalancing before its next move. While short-term volatility may persist, BTC could gradually recover, with potential to reach $120K–$150K+ in 2026, as the cycle shifts toward expansion.
Bitcoin’s recent price action clearly shows a range-bound structure, with price oscillating between $67K–$75K over the past few weeks.
On the downside, the $67K–$69K zone continues to act as a strong demand area, where buyers are consistently stepping in and preventing deeper corrections. Each dip into this region is being absorbed quickly, indicating that downside momentum remains limited.
On the upside, Bitcoin is facing repeated rejection near the $72K–$75K resistance zone. Despite multiple attempts, the price has failed to sustain above this level, suggesting that supply remains active and breakout momentum is still lacking. This behavior reflects a tight compression phase, where volatility is shrinking and price is getting squeezed between support and resistance. If Bitcoin manages to break above the $75K level, it could trigger a momentum shift toward the $80K–$85K range, potentially opening the door for further upside expansion.
However, if BTC fails to hold the $67K support, the price may revisit the $62K–$64K zone, aligning with previous demand levels. Overall, Bitcoin price is currently in a range-bound accumulation phase, and the longer it continues within this structure, the stronger the eventual breakout is likely to be.
Bitcoin Price Prediction 2026
Bitcoin’s price structure in 2026 points toward a transition year, where the market is gradually shifting from consolidation into expansion rather than entering a fresh bearish phase.
The first key trigger remains the $75K–$80K range. A sustained reclaim of this zone would indicate strengthening momentum, allowing BTC to move toward the $90K–$100K region, where the next resistance is likely to emerge. If price stabilizes above this level, it would confirm a shift out of the current range, opening the path toward the $110K–$130K zone in the later part of the year.
At the same time, external uncertainties continue to keep the upside controlled. Periodic spikes in geopolitical tensions, sudden liquidity shifts, and risk-off reactions across global markets are creating intermittent pressure, preventing immediate breakout continuation. This is one of the key reasons why Bitcoin, despite holding strong support, is still struggling to trend decisively.
However, what stands out is the consistency in demand. Every dip toward lower levels is being absorbed, suggesting that the market is building a base rather than weakening. This kind of structure typically forms before expansion, especially when downside follow-through remains limited. On the downside, failure to hold the $67K support zone could trigger a temporary correction toward the $60K–$62K region. But unless this level breaks decisively, the broader structure remains intact.
Overall, 2026 is shaping up as a rebuilding and controlled expansion phase, where Bitcoin is stabilizing under external pressure while gradually preparing for its next major move.
Bitcoin Price On-chain Outlook
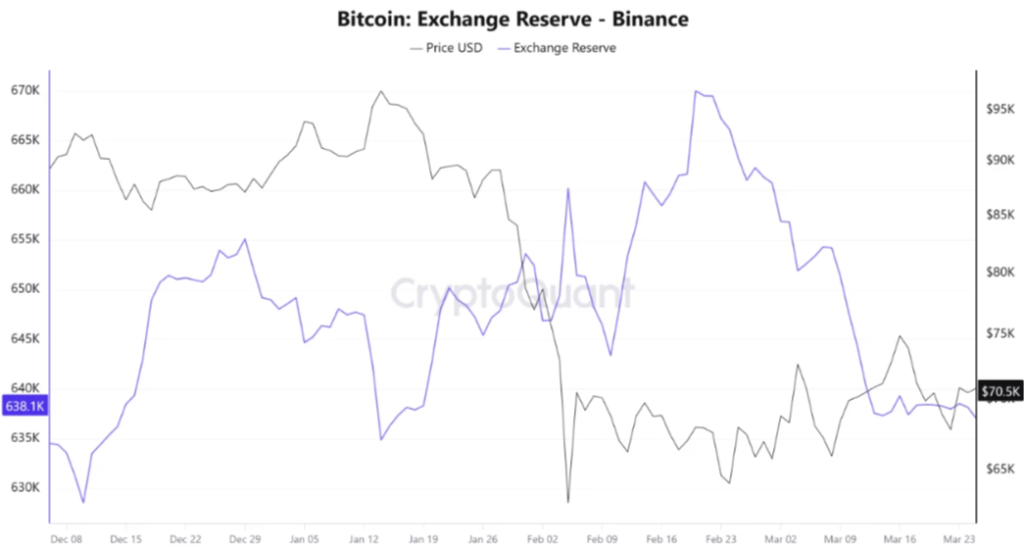
Bitcoin’s on-chain data is currently reflecting a strong shift in supply dynamics and holder behavior, aligning closely with the ongoing range-bound structure on the chart. One of the most notable developments is the decline in Bitcoin reserves on major exchanges like Binance, which have dropped to their lowest levels since the start of 2026. This reduction in available supply suggests that coins are increasingly being moved off exchanges into cold storage or long-term holdings, effectively reducing immediate selling pressure in the market.
At the same time, a contrasting trend is visible on platforms like Upbit, where reserves have climbed to their highest levels since 2024. This divergence highlights a shift in liquidity distribution, where global supply is tightening while regional trading activity, particularly in the Korean market, is increasing, often acting as an early signal of rising demand or short-term volatility.
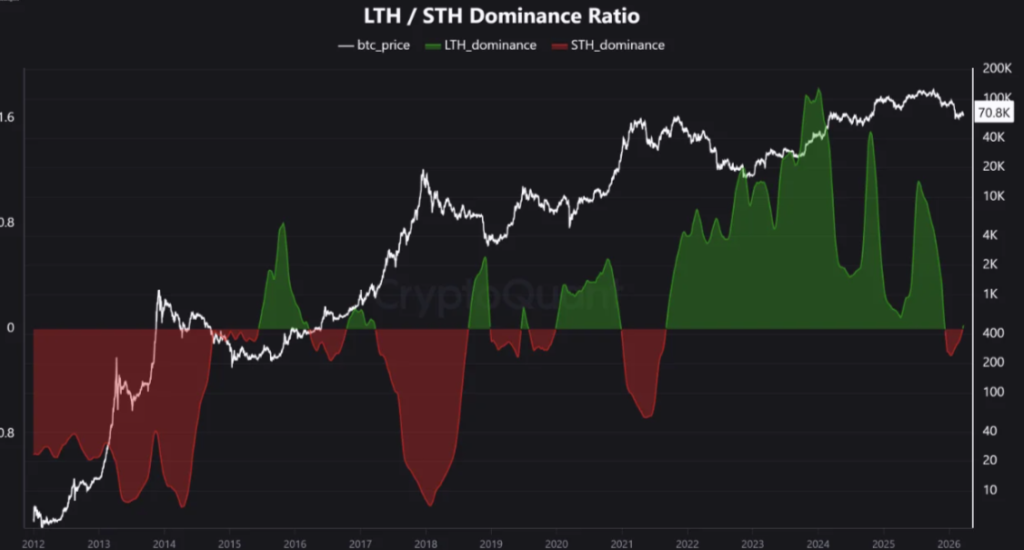
Alongside this, holder behavior is undergoing a significant transition. Data shows that Bitcoin accumulated during late 2025 has now crossed the 155-day threshold, moving into the long-term holder (LTH) category. This shift indicates that a large portion of previously active supply is no longer being traded, but instead held with conviction. Historically, the transition from short-term holder dominance to long-term holder dominance marks a move away from speculative trading toward accumulation-driven phases. The current environment reflects a similar pattern, where conviction-based holding is beginning to outweigh short-term market activity.
Taken together, these on-chain signals suggest that Bitcoin is in a phase where supply is tightening while holding behavior is strengthening, even as price remains range-bound. This kind of setup typically forms when the market is building a base, where reduced sell pressure and increasing long-term conviction gradually set the stage for a stronger directional move ahead.
Recent Events Affecting Bitcoin’s Price
The shift from late 2025 into 2026 has completely changed Bitcoin’s momentum. After hitting its peak near $120K+, the market entered a cooling phase as profit-taking kicked in and the price slipped into a prolonged consolidation. This marked the transition from a high-momentum rally into a structure-building phase, where volatility started to compress.
The biggest trigger in recent months has been the ongoing Iran conflict, which has injected uncertainty across global markets. Rising tensions, drone strikes, and threats around the Strait of Hormuz have disrupted energy markets and increased volatility, keeping risk assets like Bitcoin, capped despite strong support.
At the same time, the Trump factor has played a direct role in Bitcoin’s short-term moves. Announcements around delaying strikes on Iran or initiating negotiations have repeatedly triggered relief rallies, pushing BTC back above $70K. However, the lack of sustained resolution has also caused sharp reversals, keeping the price locked in a range.
Institutional behavior has also influenced price direction. Earlier outflows and profit booking created downward pressure, but recent sessions have shown renewed positioning near lower levels, preventing deeper breakdowns and supporting the current range-bound structure.
Another layer of uncertainty comes from ongoing regulatory developments in the U.S., where delays and debates around crypto legislation continue to impact sentiment. Proposals affecting stablecoins and broader market rules have created hesitation among investors, limiting aggressive upside momentum.
Meanwhile, global markets themselves remain unstable. Fluctuations in oil prices, shifts in bond yields, and defensive positioning by investors have created a mixed environment, where Bitcoin is reacting to both risk-on and risk-off signals without a clear trend.
Bitcoin Crypto Price Prediction 2026 – 2030
Year
Potential Low ($)
Potential Average ($
Potential High ($)
2026
100k
150k
180k
2027
170K
250K
330K
2028
200K
350K
450K
2029
275K
500K
640K
2030
380K
750K
900K
Bitcoin Price Prediction 2026 Forecast
The BTC price range in 2026 is expected to be between $100K and $180K.
BTC Price Prediction 2027
Subsequently, the Bitcoin price range can be between $170K to $330K during the year 2027.
Bitcoin (BTC) Price Prediction 2028
With the next Bitcoin halving, the price will see another bullish spark in 2028. Specifically, as per our Bitcoin Price Prediction, the potential BTC price range in 2028 is $200K to $450K.
BTC Price Target For 2029
Thereafter, the BTC price for the year 2029 could range between $275K and $640K.
Bitcoin (BTC) Price Prediction 2030
Finally, in 2030, the price of Bitcoin is predicted to maintain a positive trend. Indeed, the BTC price is expected to reach a new all-time high, ranging between $380K and $900K.
The long-term projection assumes Bitcoin (BTC) sustains relevance in overall cryptocurrency adoption and the continued development of blockchain payment solutions, with growth moderating over time as the asset matures.
Year
Potential Low ($)
Potential Average ($)
Potential High ($)
2031
540,830
901,383
1,261,936
2032
757,162
1,261,936
1,766,711
2033
1,059,945
1,766,711
2,473,477
2040
5,799,454
9,665,757
13,532,059
2050
161,978,188
269,963,647
377,949,106
Bitcoin Prediction: Analysts and Influencers’ BTC Price Target
“Jack Dorsey, former Twitter CEO (now X), predicts Bitcoin could exceed $1 million by 2030 due to its ecosystem growth and increasing adoption.”
Cathie Wood, CEO of Ark Invest, projects Bitcoin to reach $1.5 million by 2030, driven by institutional adoption and its position as digital gold.”
“Wall Street broker Bernstein believes 2026 will mark the start of a tokenization “supercycle,” maintaining its $150,000 Bitcoin price target for this year and $200,000 for the 2027 cycle peak.”
“Brad Garlinghouse, the Ripple CEO, predicts Bitcoin will hit $180,000 in 2026, due to favorable market and regulatory conditions.”
Never Miss a Beat in the Crypto World!
Stay ahead with breaking news, expert analysis, and real-time updates on the latest trends in Bitcoin, altcoins, DeFi, NFTs, and more.
FAQs
What is the Bitcoin price prediction for 2026?
Bitcoin is expected to range between $100K and $180K in 2026, with bullish momentum building as consolidation near $70K shifts into expansion.
How much will 1 Bitcoin be worth in 2030?
Bitcoin could range between $380K and $900K by 2030, with an average target near $750K as adoption, scarcity, and institutional demand grow.
What will 1 BTC be worth in 2040?
By 2040, Bitcoin could range between $5,799,454 and $13,532,059, with an average estimate near $9,665,757 as adoption and scarcity increase.
How much will Bitcoin be in 2050?
Bitcoin in 2050 could range from $161M to $377M, with an average estimate near $269M, driven by long-term adoption, scarcity, and global demand.
Is it safe to invest in Bitcoin today for long-term?
Bitcoin can be a strong long-term asset, but it remains volatile. Investing gradually and holding long-term may reduce risk and improve potential returns.
Is it worth putting $100 into Bitcoin?
Yes, investing $100 in Bitcoin can be a good start. It allows beginners to gain exposure, learn the market, and benefit from potential long-term growth.

 BIG DATA: SOLANA DOMINATES IN RWA AND TOKENIZATION