The crypto market March 2026 wasn’t driven by shiny upgrades or bullish hype cycles, per Santiments recent monthly report. Infact, this time it was war headlines, oil spikes, and pure confusion calling the shots. One minute markets panicked, the next they reversed because someone said something, then unsaid it. Welcome to a month review where narratives moved faster than charts.
Geopolitics Took Over Everything, No Exceptions
Let’s not sugarcoat it global tension involving the U.S., Israel, and Iran hijacked market behavior. Traders weren’t analyzing fundamentals; they were refreshing feeds.
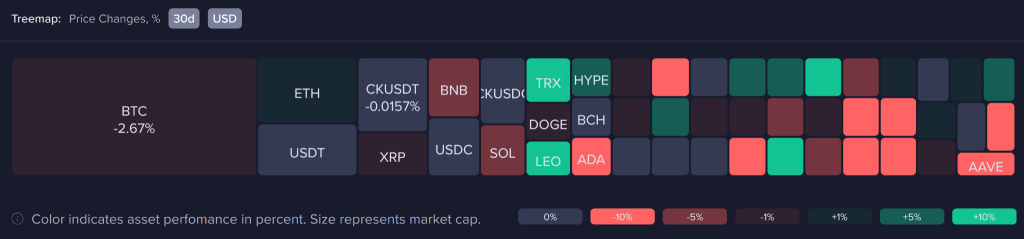
Per Santiment insights, Bitcoin slipped a modest -2.7%, while Ethereum somehow squeezed out a +2.1% gain. Sounds stable, right? Not quite. Underneath that calm surface, chaos was brewing.
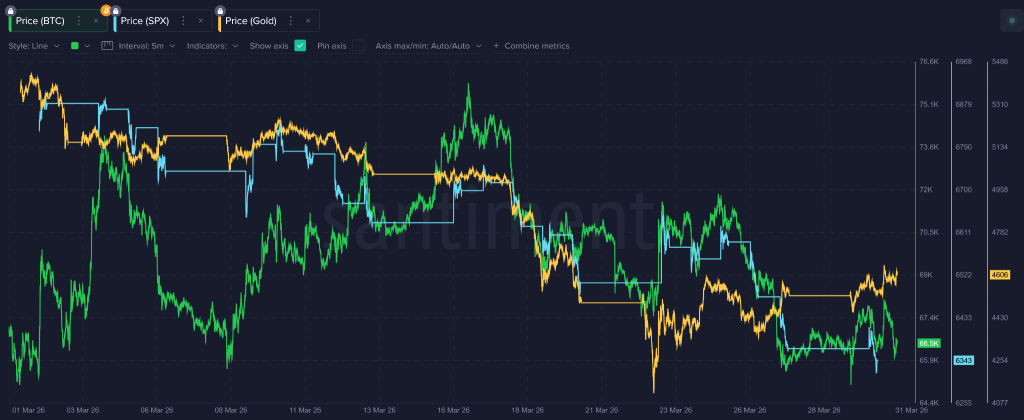
Oil spiked. Gold wobbled. The S&P 500 dropped around -9% from mid-February to late March. And crypto? Oddly resilient.
Crypto Held Strong, But Not For Obvious Reasons
A big chunk of forced selling was flushed out during February’s liquidation cascade. By March, there simply weren’t enough overleveraged positions left to unwind.
Meanwhile, crypto’s 24/7 nature meant it priced in fear faster than traditional markets. Stocks and commodities were late to the panic party.
And instead of exiting, capital rotated. Traders chased narratives AI, altcoins, anything with momentum. That’s how Bittensor (TAO) and MemeCore casually ripped +67% while the broader market stood still. Selective strength was seen.
Bitcoin Supply Shock Narrative Gets Louder
By March 9, over 20 million BTC were officially mined. Less than 1 million left. That’s it.
No fireworks followed but psychologically, it matters. Scarcity isn’t a theory anymore; it’s happening in real time. Issuance is slowing, supply is tightening, and long-term holders are paying attention.
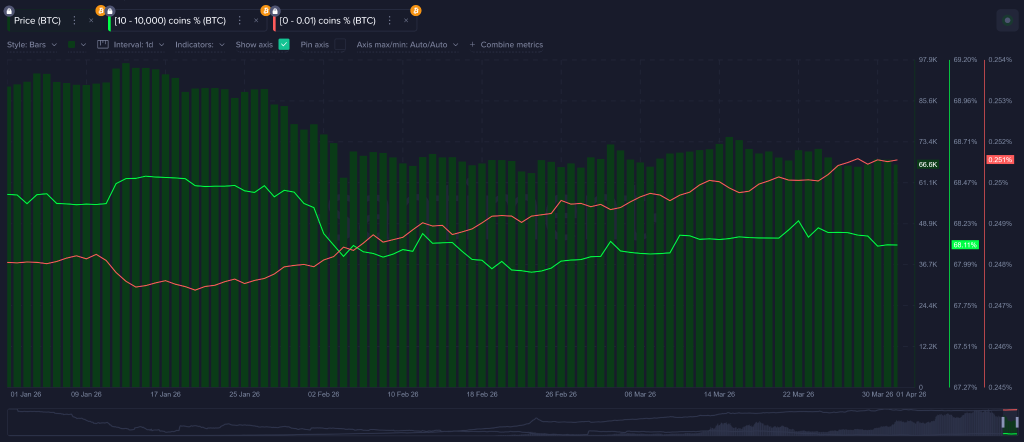
But here’s the twist retail kept buying anyway. Wallets holding under 0.1 BTC increased holdings by 0.52%.
Whales? Not so much. They added a modest +0.17% overall but dumped 25,500 BTC between March 22–31 near local highs. Even worse, large transaction activity declined. Translation: the big players aren’t confident either.
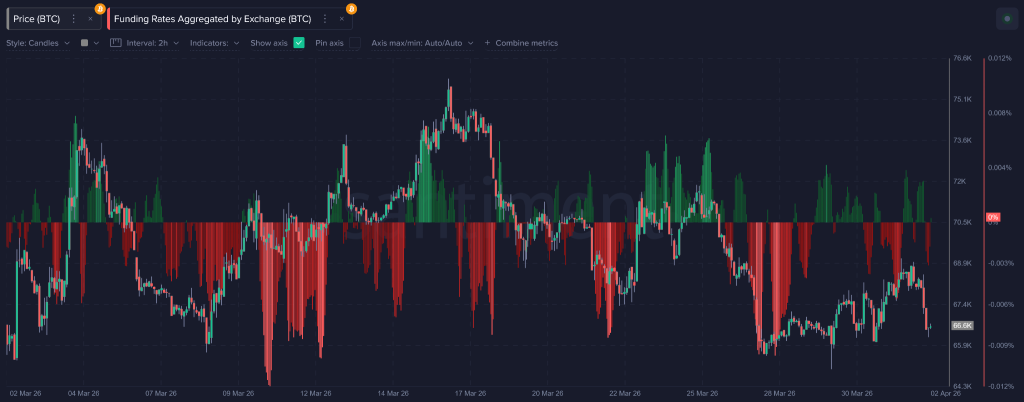
Shorting Frenzy Fueled Violent Market Moves
Now, let’s talk derivatives. Funding rates stayed deeply negative, meaning traders were aggressively short. And as usual, markets punished them for it.
Every dip attracted more shorts. Every bounce triggered liquidations. The result? Choppy, aggressive price action that felt random but practically it wasn’t.
Exploits, AI Narratives, And Institutional Moves
March wasn’t just macro noise. Crypto-native events added fuel. Santiment insights showed that the RESOLV exploit exposed a brutal truth because a system can fail even when it works exactly as designed. A single compromised key led to $23 million in profit via unbacked minting.
Then came Strategy’s aggressive $400 million raise, now extended into near 24/7 markets. That’s traditional finance adapting to crypto speed.
And finally, Bittensor. AI met crypto, and people actually cared. Not just traders even outsiders too. That’s rare.
So What’s Next For Crypto Market 2026?
Honestly? More of the same unless something breaks the cycle. If geopolitical tensions ease, the crypto market 2026 could shift from reactive to directional. If not, expect more sideways action, punctuated by violent moves on headlines.
Because right now, this market isn’t just trading charts. It’s trading uncertainty.
The ETH price is booming under the hood while barely moving where it actually counts. Sitting around $2,130, Ethereum looks… fine on the surface. But dig deeper, and the story gets a lot more interesting and honestly, a bit frustrating at the same time. Why? Because while price chops sideways, the network activity itself is quietly flexing heavily.
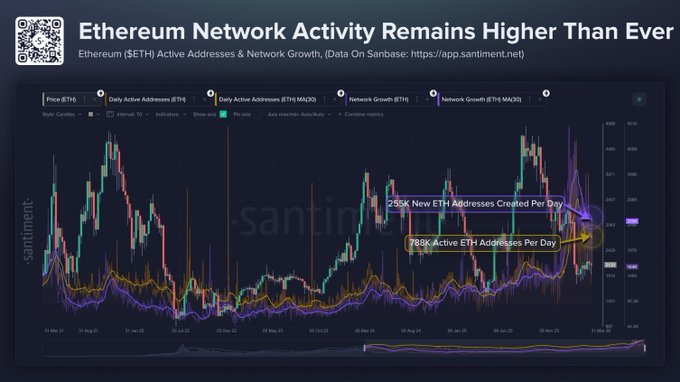
Network Activity Explodes While Price Lags Behind
Per the data, over 788,000 daily active addresses are seen. Another 255,000 new addresses are created every single day. That’s not just growth, that’s borderline obsession-level engagement. And yet, the ETH price chart doesn’t scream “bull run.”
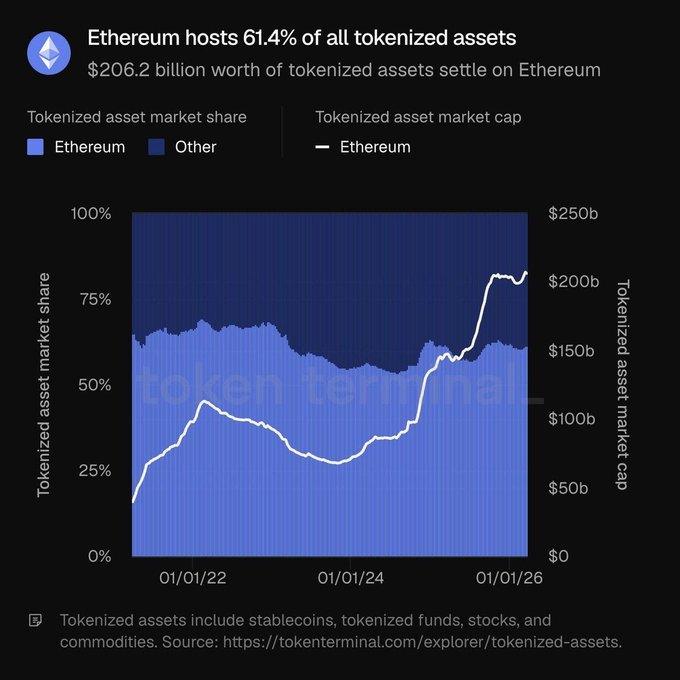
So, Ethereum isn’t just growing users, it’s dominating a much bigger narrative: tokenization. A massive 61.4% of all tokenized assets live on Ethereum. We’re talking stablecoins, funds, stocks, commodities, the whole package. The market has ballooned from $50 billion in 2022 to over $200 billion today. And Ethereum owns most of it. That’s not hype. That’s infrastructure.
Liquidity Shifts Hint At Brewing Supply Shock
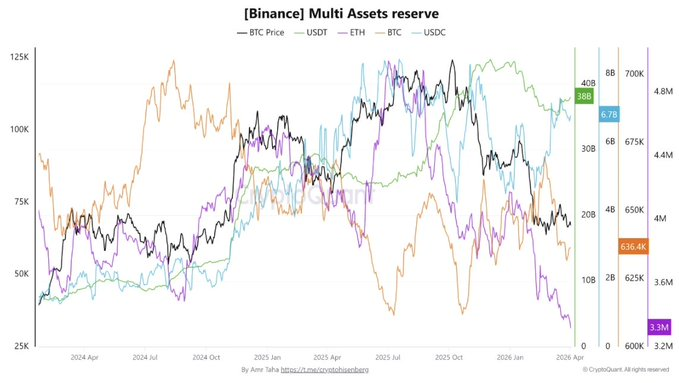
Now flip to the supply side, and things get even more interesting. Binance’s ETH reserves have dropped below their February 2024 lows, while USDT and USDC reserves are climbing meaning liquidity coming too.
Translation? ETH is quietly leaving exchanges and historically, when supply dries up while stablecoins pile in… well, it usually doesn’t end with sideways action for long. If this trend continues, it sets up a pretty compelling case for upward expansion in the ETH/USD pair.
ETH Price Prediction Hinges On Macro Relief
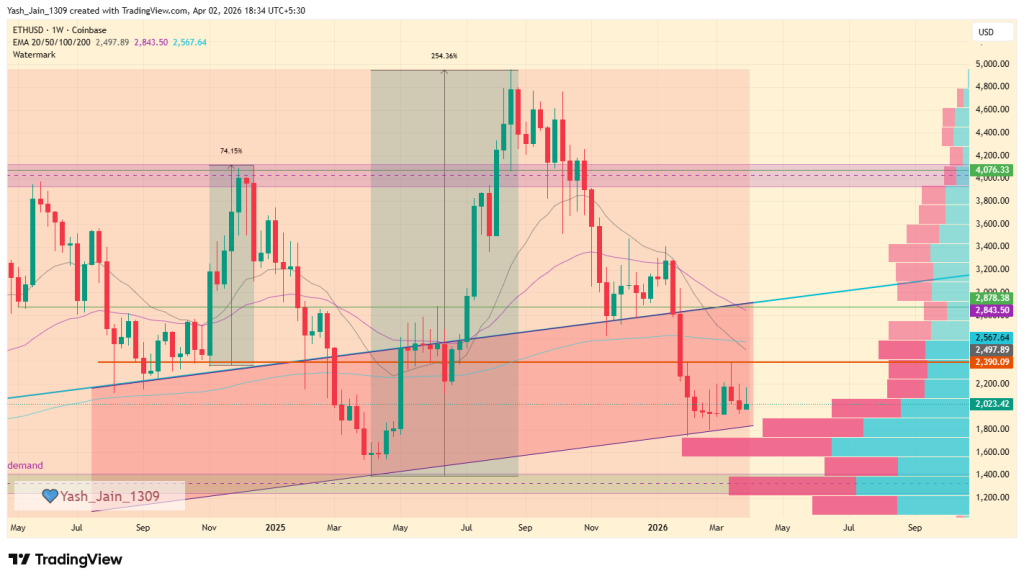
But for now, the Geopolitical uncertainty is still acting like a ceiling. The ETH price prediction in the short term still remains capped, with $2,390 acting as a stubborn resistance zone. Until that pressure eases, don’t expect fireworks just yet.
Still, the weekly structure tells a different story. Anchored VWAP data shows strong accumulation zones forming, with high-volume support holding firm. That’s not retail panic buying that’s calculated positioning. Smart money doesn’t chase headlines; it builds quietly.
So, may be Short term, we can expect chop to continue. Maybe even frustration will rise.
But long term? The ETH price is sitting on a coiled spring. Once macro conditions stabilize, all this underlying strength like network growth, tokenization dominance, supply shifts doesn’t just disappear. It erupts.
And when it does, the current ETH price levels might look like a bargain in hindsight.
SUI shows strong bullish momentum in early 2026, backed by rising TVL, ecosystem growth, and renewed investor confidence.
If key resistance breaks, SUI could target $3–$5 in 2026, with long-term potential extending toward $15–$18 by 2030.
As a next-generation Layer 1 blockchain, Sui is redefining the architecture of the decentralized web by introducing an object-centric model where assets, data, and permissions are natively ownable and programmable. Built to handle the demands of modern commerce, the Sui Stack provides a modular toolkit that allows developers to scale on resilient infrastructure while delivering high-performance experiences without typical blockchain trade-offs.
From powering institutional capital markets and DeFi to even revolutionizing the gaming sector, the network has already secured a significant foothold with a Total Value Locked (TVL) of $583 million, per the official website.
By prioritizing verifiable security and composable scaling, Sui ensures that value created within its ecosystem is shared rather than extracted. In this comprehensive SUI price prediction 2026–2030, we analyze how this business-ready infrastructure and growing industry adoption will impact SUI’s token and market valuation in the years to come.
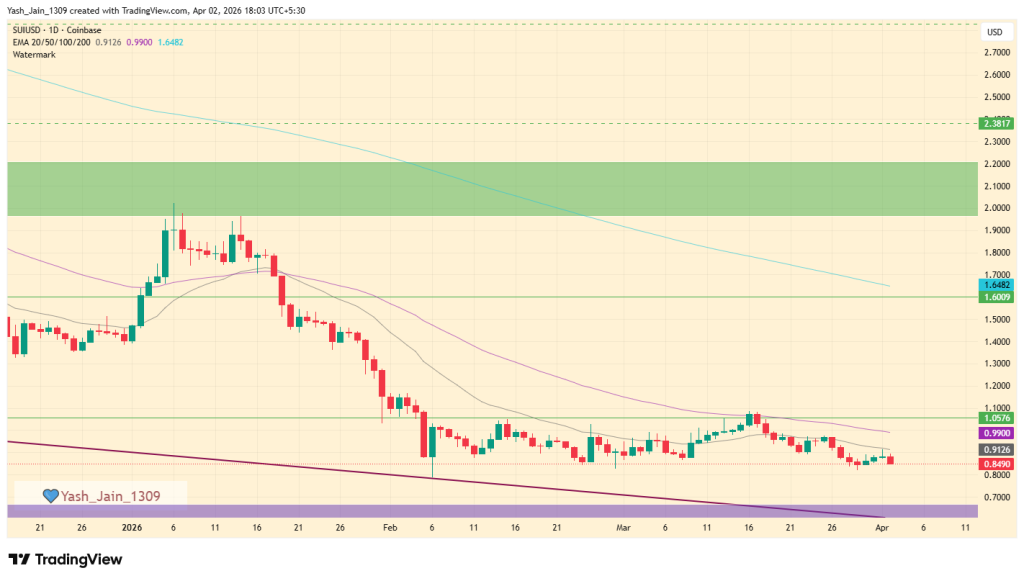
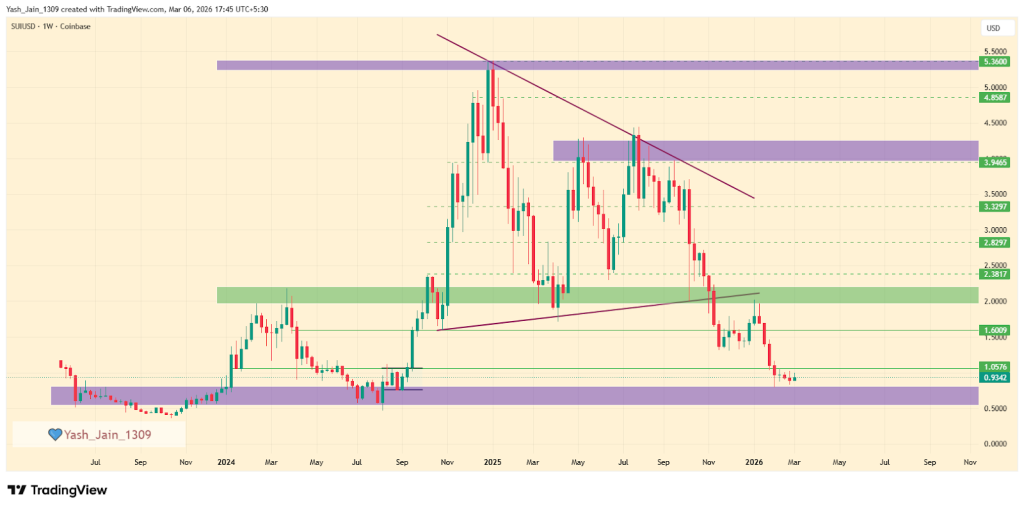
As we look back to early 2026, the SUI price initially encountered the $2.00 level, only to be met with substantial selling pressure, which led to a dip to $0.80 by February. Since then, the price has been steadily consolidating just beneath the important $1.00 mark.
As March has closed, SUI/USD finds itself at a critical juncture, grappling with the challenge of breaking through the $1 resistance level. If this struggle continues, we may witness a potential retreat to lower levels. It is particularly significant to note that if the essential $0.80 support level falters, we could see prices testing the $0.50 to $0.60 range in April.
On a more optimistic note, should the SUI price succeed in surpassing $1.05, it might indicate a local bottom and ignite a rally towards $1.60, with the exciting possibility of reattempting the $2.00 threshold by the end of the month.
Sui (SUI) Crypto Price Prediction 2026
The weekly price action for SUI/USD reveals a market in a major corrective phase after its late-2024 peak, currently in Q1 2026, searching for a definitive long-term bottom.
What we witnessed is that after the 2024’s explosive rally that topped out near $5.36, the asset entered a persistent downtrend, characterized by a series of “lower highs” capped by a prominent descending resistance line. This primary trendline has remained unbroken throughout 2025, consistently forcing the price toward deeper support levels as the initial hype cycle cooled.
Currently, the SUI price is testing $0.80 support after losing $1.05 support in Q1 2026. The odds suggest a chance of reaching the $0.50 support zone if it fails to hold $0.80, because the $0.50 area is of immense technical importance, as it represents the original “genesis” accumulation level from early 2024.
The price has dipped a lot, and now it’s showing signs of stabilization as sellers are about to reach exhaustion once it hits $0.50. Real consolidation could begin, and a true reversal to fruit has better odds. This area serves as the “line in the sand” for bulls; maintaining this floor is essential to prevent a complete technical breakdown and to begin building a new base for the next market cycle.
Looking ahead, the chart identifies several key resistance levels that SUI must reclaim to shift its bearish structure. The immediate hurdle lies at the $1.05, $1.60, and $2.00 horizontal zones. A successful bounce from the current demand floor would likely target these levels first.
However, a true trend reversal will only be confirmed if SUI breaks and closes above the long-term descending trendline, currently near $3.50. Until that breakout occurs, the asset remains in a “buy the dip” accumulation phase for long-term investors.
SUI Crypto Price Prediction 2026 – 2030
Year
Potential Low ($)
Potential Average ($)
Potential High ($)
2027
$4
$6
$8
2028
$8
$10
$12
2029
$10
$13
$16
2030
$12
$15
$18
Sui (SUI) Price Prediction 2027
Subsequently, the SUI price range can be between $4 to $8 during the year 2027.
SUI Prediction 2028
Beyond the previous ATH,SUI bullish momentum may gain pace and will see another bullish spark in 2028. Specifically, as per our SUI Price Prediction, the potential SUI price range in 2028 is $8 to $12.
SUI Price Forecast 2029
Thereafter, the SUI price for the year 2029 could range between $10 and $16
Sui (SUI) Price Prediction 2030
Finally, in 2030, the price of SUI is predicted to maintain a steady and positive. It can trade between $12 and $18.
SUI Price Prediction 2031, 2032, 2033, 2040, 2050
Based on the historic market sentiments and trend analysis of the largest cryptocurrency by market capitalization, here are the possible SUI price targets for the longer time frames.
Year
Potential Low ($)
Potential Average ($)
Potential High ($)
2031
$8
$10
$15
2032
$10
$13
$18
2033
$12
$15
$22
2040
$20
$32
$40
2050
$30
$70
$150+
Never Miss a Beat in the Crypto World!
Stay ahead with breaking news, expert analysis, and real-time updates on the latest trends in Bitcoin, altcoins, DeFi, NFTs, and more.
FAQs
What is the Sui Crypto (SUI) price prediction for 2026?
SUI could trade between $0.50 and $5 in 2026. If it breaks key resistance near $3.50, momentum may push the token toward the $3–$5 range.
How high can Sui Crypto go by 2030?
If adoption continues and the ecosystem expands, SUI could reach $12–$18 by 2030, driven by DeFi growth and network demand.
What is the Sui price prediction for 2040?
Long-term projections suggest SUI may trade between $20 and $40 by 2040, assuming strong blockchain adoption and sustained ecosystem growth.
What is the Sui Coin price prediction for 2050?
By 2050, SUI could potentially reach $30–$150+ if the network becomes widely used across finance, gaming, and Web3 infrastructure.
Where to buy Sui Crypto (SUI)?
You can buy SUI on major crypto exchanges like Binance, Coinbase, KuCoin, and OKX. Simply create an account, deposit funds, and trade for SUI.
Can SUI reach its all-time high again?
Yes, if SUI breaks above key resistance near $3 and market conditions stay favorable, a retest of its $5.35 ATH is possible.
Is SUI a good long-term investment?
SUI shows long-term potential due to its scalable Layer-1 design, growing DeFi adoption, and increasing developer and institutional interest.
What factors are driving SUI’s price growth?
Key drivers include rising TVL above $1B, strong on-chain activity, ecosystem expansion, and SUI’s reputation as a fast, scalable network.
The live price of the Monero crypto is $ 329.55173344.
Monero price made a strong move before but on a decline to a possible $130 low by 2026-end.
The XMR price, with a potential surge, could hit $5,828.30 by 2030
Envision the capability to conduct online payments without a digital footprint; that’s payment privacy. Numerous cryptocurrency assets possess a distinct selling proposition (USP); some safeguard transaction details concerning the parties or institutions involved, but some do not.
But this transparency enables larger investors and institutional capital to be easily traced. While unshielded transactions are valued by researchers for the accessible information they provide regarding investments, individuals whose data is subject to scrutiny often experience frustration, as they perceive a loss of privacy over their own financial assets.
This is where Monero (XMR) comes in. Since its inception in 2014, Monero has offered robust privacy features. It has become the top choice for users seeking to maintain a high standard of anonymity in blockchain transactions. The impact of Monero’s privacy capabilities was particularly evident in the fourth quarter of 2025.
Despite the government’s tightening of the rules around digital assets, Monero has ranked 21st globally. Driven by rising interest, XMR stands out as a privacy-focused coin. So, what’s coming next for Monero in 2026 and the years to come? In this Monero price prediction 2026-2030 article, we look at the potential price targets.
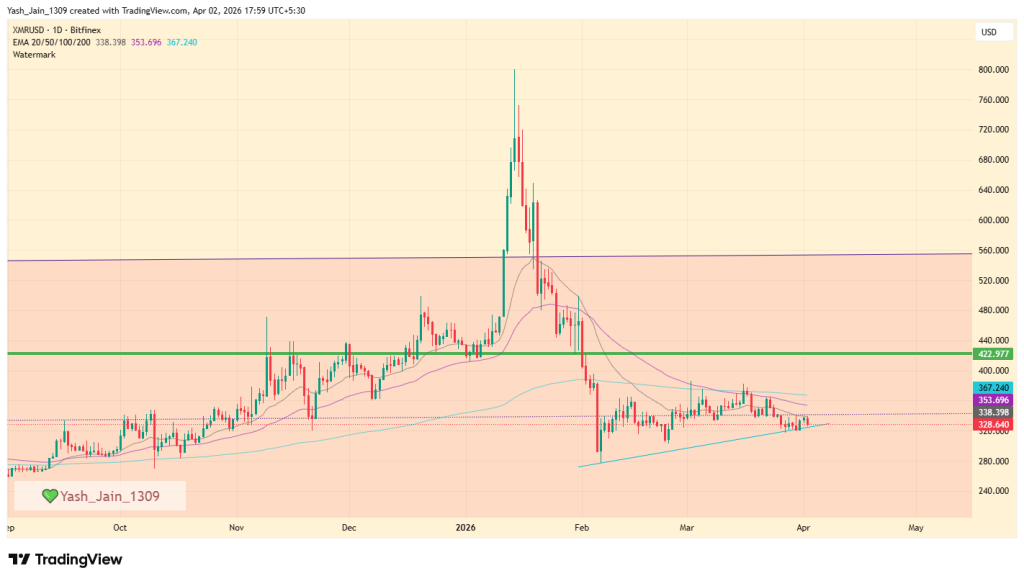
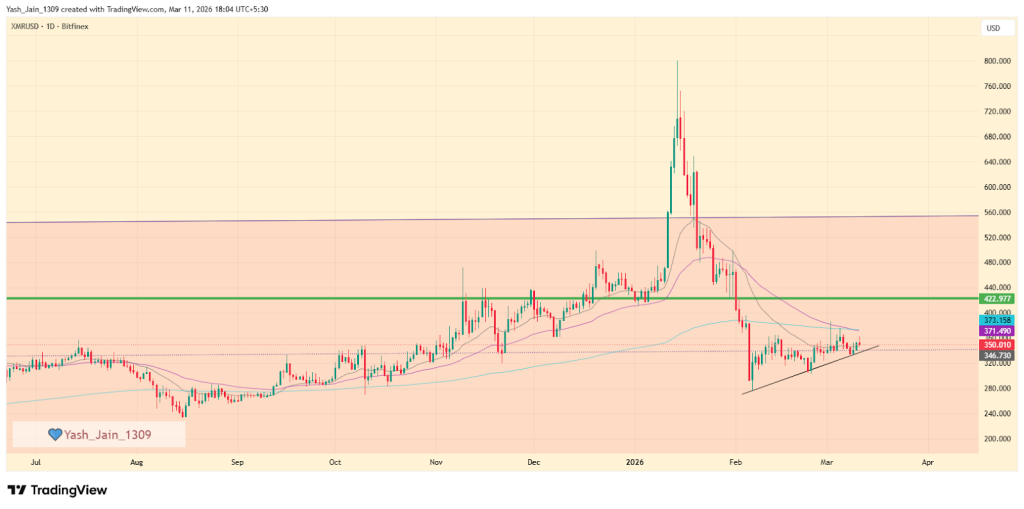
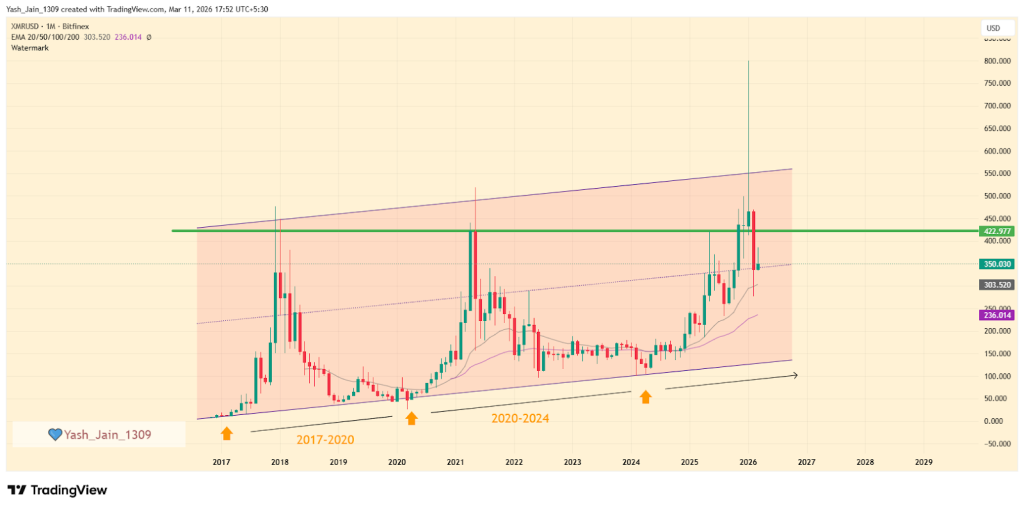
The daily price chart for Monero (XMR) reveals a captivating market trend marked by noteworthy fluctuations. After facing challenges in maintaining stability above $422 in January, XMR experienced a decline, falling below $370 in February. However, mid-March brought significant resistance near the 200-day EMA and the $370 threshold.
As we transition from March into April now, the XMR/USD pair has begun to form a short-term support trendline, which is an encouraging development. Should this support be breached, we might witness a rapid decline, potentially dropping below $300 this month. On a brighter note, if this support remains robust, we have an exciting opportunity for XMR to retest the $422 level by the end of April.
Recent News and Opinions
Per the late February 2026 post from ProbeLab, they show that findings confirm the Monero network’s resilience against surveillance. Analysis reveals that 46% of community nodes have proactively adopted a “ban list,” effectively neutralizing nearly all identified spy nodes. This grassroots defense highlights a robust, decentralized commitment to privacy, strengthening the network’s topology against potential deanonymization attempts.
Monero (XMR) Price Prediction 2026
The price action of Monero (XMR) showed remarkable bullish momentum, particularly in Q4 2025, driven by a broader trend in privacy coins, which resulted in a significant price surge during that period.
In 2026, Monero followed the same privacy narrative, continuing the rally and pushing the price to new all-time highs (ATH) of $800. However, this increase was short-lived, as the price dropped to around $285 in February, losing more than 60% from its peak. Additionally, the mid-trendline of an ascending channel was breached, confirming a bearish dominance in the market at that time.
But, the remaining days of Q1 2026 showed some improvements that pushed it back above mid-trendline support, and now we see consolidation going on.
Now, if demand for XMR price increases, it could potentially revisit the $422 mark. It’s important to note that a recovery to this level might not inspire much excitement, as it could form a significant trap for investors. To regain a bullish setup, a weekly close above $422 would be crucial for attracting investor interest.
Conversely, if the price fails to break through $422 or even collapses below mid-trendline support again, then the first half of 2026 could see a drop towards $200 area, which could accelerate to $130 by year’s end to touch the lower border of the ascending channels as a support, like in the past.
Furthermore, it’s essential to recognize that the price has reached the upper boundary of its ascending parallel channel. As with previous patterns, a correction appears to be imminent. When it pierced the upper boundary, it had two choices: break away from the earlier pattern and establish new price action, but it briefly exceeded the channel before falling back within it, echoing historical trends. Ultimately, it returned to the pattern, continuing its legacy from the past.
Monero Crypto Price Prediction 2026 – 2030
Year
Potential Low ($)
Potential Average ($)
Potential High ($)
2027
$910.00
$1000.00
$1200.00
2028
$863.46
$1,726.90
$2,590.35
2029
$1,295.19
$2,590.35
$3,885.53
2030
$1,942.76
$3,885.53
$5,828.30
Monero Price Forecast 2027
Looking forward to 2027, XMR’s price is expected to reach a low of $910, with a high of $1,200 and an average forecast price of $1,000.
XMR Price Prediction 2028
In 2028, the price of a single Monero is anticipated to reach a minimum of $863.46, with a maximum of $2,590.35 and an average price of $1,726.90.
Monero Price Prediction 2029
By 2029, XMR’s price is predicted to reach a minimum of $1,295.19, with the potential to hit a maximum of $3,885.53 and an average of $2,590.35.
Monero (XMR) Price Prediction 2030
In 2030, Monero is predicted to touch its lowest price at $1,942.76, hitting a high of $5,828.30 and an average price of $3,885.53.
The long-term projection assumes Monero sustains relevance in enterprise blockchain use cases, with growth moderating over time as the asset matures.
Year
Potential Low ($)
Potential Average ($)
Potential High ($)
2031
3800
5200
6800
2032
5500
7500
9500
2033
7700
10000
11500
2040
15000
22000
42000
2050
30000
40000
60000
Monero (XMR) Price Prediction: Market Analysis?
Year
2026
2027
2030
Changelly
$720
$900
$1900
CoinCodex
$680
$880
$1800
WalletInvestor
$740
$870
$2000
Never Miss a Beat in the Crypto World!
Stay ahead with breaking news, expert analysis, and real-time updates on the latest trends in Bitcoin, altcoins, DeFi, NFTs, and more.
FAQs
What is Monero (XMR) price prediction for 2026?
Monero could revisit the $422 level if buying demand strengthens. However, if bearish pressure continues, the price may fall toward $200 or even $130 during 2026.
How much will Monero be worth in 2030?
Projections indicate Monero could trade between about $1,942 and $5,828 by 2030, with an estimated average price around $3,885 if adoption continues growing.
How high can Monero price go by 2040?
Long-term projections vary widely, but some estimates place Monero between $2,000 and $5,000 by 2040, depending on adoption and regulation.
What factors influence the price of Monero?
Monero’s price is driven by privacy demand, regulatory developments, network adoption, market sentiment, and overall crypto market trends.
Will Monero be the next Bitcoin?
Monero serves a different role than Bitcoin. Bitcoin focuses on transparency, while Monero prioritizes privacy, making it a niche but valuable crypto asset.
The asset could reach a high of $6100 by the end of 2026.
The price of Ethereum could reach a high of $15,575 by 2030.
Since its launch in 2015, Ethereum has evolved from a pioneering smart-contract platform into the primary settlement layer for the global digital economy. What began as a space for experimental decentralized applications (dApps) has now transformed into a robust ecosystem attracting significant institutional interest. This shift is largely driven by Ethereum’s “Business Ready” infrastructure, which is designed to support high-assurance financial applications and large-scale tokenization initiatives.
The successful rollout of the Pectra and Fusaka upgrades has significantly improved Ethereum’s scalability and fee efficiency. These upgrades addressed long-standing network bottlenecks, making the platform more practical and cost-effective for enterprise adoption and high-volume blockchain activity.
As the ecosystem progresses through 2026, the narrative surrounding Ethereum has shifted from simple utility to institutional-grade resilience and infrastructure. With a well-defined roadmap emphasizing censorship resistance, modular scalability, and long-term sustainability, Ethereum is increasingly positioned to support the next generation of decentralized finance (DeFi) and global capital markets.
In this Ethereum price prediction for 2026–2030, we examine whether these structural improvements, combined with evolving macroeconomic conditions, could push ETH toward new valuation milestones over the coming years.
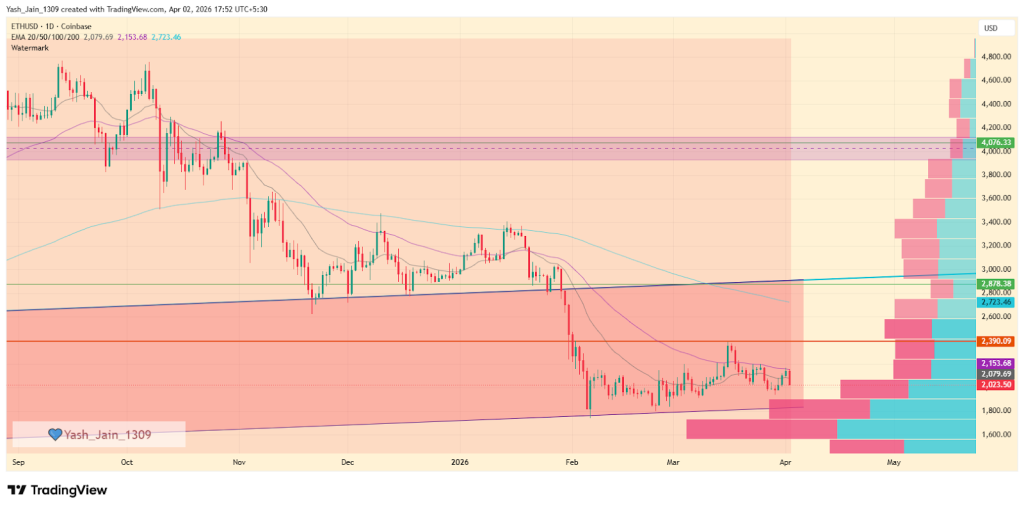
In the first quarter of the year, the Ethereum price encountered some significant challenges, experiencing a decline from the support level of $2800 to a low of $1750 in early February. Fortunately, February brought stabilization, and March witnessed a promising rise to $2370. Although ETH dipped below $2000 by late March, this suggests that demand dynamics are evolving.
Looking ahead, the ETH price action indicates that there is a building demand, positioning Q2 as an exciting opportunity for growth. While the anticipated momentum was not fully realized in Q1, consolidation presents a favorable outlook. April could be a pivotal month, potentially paving the way for a retest of $2878 or continued consolidation in the market.
Ethereum Price Prediction 2026
The Ethereum price currently exhibits a compelling long-term technical structure on the monthly timeframe, anchored by a multi-year 45-degree ascending trendline that has guided price action since 2020.
Historically, this trendline has served as a critical pivot point, with the market oscillating between periods of aggressive upward expansion above the line and phases of strategic consolidation below it.
Notably, when ETH trades beneath this trendline, it often forms a secondary short-term ascending channel lasting a few months. These channels act as accumulation zones, where price fluctuates until sufficient demand builds, eventually leading to a high-momentum breakout once bullish conditions are met.
In the current 2026 market environment, Ethereum appears to be following a familiar structural pattern, albeit with increased volatility and a broader trading range. The ongoing ascending channel, which began in 2025, aligns with the multi-year trendline but is significantly wider compared to previous cycles. While the price action indicates recovery potential, the market has not yet reached the specific demand threshold required to trigger a definitive vertical surge.
Overall, Ethereum’s multi-year trendline combined with the current ascending channel suggests a measured accumulation phase, setting the stage for a potential strong bullish breakout in the months ahead.
From a volume perspective, the anchored volume profile suggests that Ethereum (ETH) is finding significant support around key high-volume zones. These areas, particularly the ranges between $1,700–$1,900 and $1,200–$1,400, have historically attracted institutional interest, creating a solid floor that bears are unlikely to easily break.
If buyer demand strengthens at these levels, ETH could follow a recovery trajectory with an initial target near $2,878. A successful breach of this level would then pave the way for a retest of the $4,076 psychological resistance, signaling renewed bullish momentum.
However, a cautious approach remains warranted. If the market fails to generate sufficient demand at these support zones, the current consolidation phase below the multi-year trendline is likely to continue. In this bearish scenario, ETH would remain trading within its 2025 ascending channel, extending the accumulation period before a decisive trend emerges.
The interplay between this short-term ascending channel and the long-term trendline will ultimately determine whether Ethereum’s next move is a bullish continuation or a prolonged sideways consolidation.
ETH On-Chain Analysis
Ethereum’s price is currently stabilizing and 30-days On-chain data shows major whale transaction counts beyond $1 million has been rising in past 30-days. This is signaling “smart money” accumulation near the $2,000 support.
Moreover, the fundamentals of the network are growing. Since January 2025, the value of tokenized real-world assets (RWAs) on the blockchain has reached $20.4 billion. The Ethereum ecosystem now has 146 active Layer 2 networks, with a total value of $38.2 billion locked in these networks. Together, Ethereum’s mainnet and Layer 2 networks show that stablecoins account for over 60% of the market share, totaling about $179 billion.
This indicates a significant amount of liquidity in the ecosystem. Additionally, the number of ETH tokens on centralized exchanges is falling, meaning fewer ETH tokens are less available on CEX platforms meaning bullish pressure increasing.
Ethereum Price Prediction 2027-2030
Year
Potential Low ($)
Potential Average ($)
Potential High ($)
2027
7,071.08
14,142.16
21,213.24
2028
10,606.62
21,213.24
31,819.86
2029
15,909.93
31,819.86
47,729.79
2030
23,864.90
47,729.79
71,594.69
Ethereum (ETH) Price Prediction 2027
The Ethereum 2027 forecast expects the ETH coin price to make a new all-time high at $21,213.24. However, a correction based on market shortcomings may drive the ETH crypto to $7,071.08, with an average of $14,142.16.
ETH Price Prediction 2028
In 2028, the chances of Ethereum dominating the crypto market rise as the ETH price potentially makes a new high at $31,819.86. On the other hand, the altcoin might fall to $10,606.62, making an average of $21,213.24.
Ethereum Price Forecast 2029
Approaching its all-time high of $47,729.79 in 2029, the Ethereum price is expected to surpass the psychological barrier of $40,000. In case of a correction, $ETH may reach a low of $15,909.93, with an average price of $31,819.86.
Ethereum Price Prediction 2030
As per our Ethereum Price Prediction 2030, the ETH crypto price is projected to reach a new all-time high of $71,594.69 in 2030, with a potential low of $23,864.90 and an average price of $47,729.79.
Ethereum (ETH) Price Prediction: Market Analysis?
Year
2026
2027
2030
Changelly
$5,800
$7,500
$25,000
CoinCodex
$6,300
$7,850
$28,200
WalletInvestor
$5,940
$7,450
$21,500
Never Miss a Beat in the Crypto World!
Stay ahead with breaking news, expert analysis, and real-time updates on the latest trends in Bitcoin, altcoins, DeFi, NFTs, and more.
FAQs
What is the Ethereum price prediction for 2026?
Ethereum could reach $6,200 in 2026 if accumulation strengthens and demand at key support levels increases.
What will be the price of Ethereum in 2027?
ETH may hit around $21,200 in 2027, with potential lows near $7,071 depending on market conditions.
How much will 1 Ethereum be worth in 2030?
By 2030, 1 ETH could reach a new all-time high of $71,500 under strong adoption and network growth.
Could Ethereum reach $100,000 by 2040?
If adoption and blockchain integration continue rising, Ethereum could theoretically approach $100,000 by 2040.
How high will Ethereum go in 2050?
Long‑term, Ethereum could exceed $150,000–$200,000 by 2050 with widespread global adoption, DeFi and tokenization.
Is Ethereum a good investment?
Ethereum remains a strong long-term investment due to growing DeFi use, Layer 2 adoption, and rising institutional interest.
The MORPHO price today popped 15% intraday, and yeah it didn’t come out of nowhere. A fresh integration involving pyUSD vaults on a high-speed network lit the fuse, pulling traders back into a token that had already been quietly outperforming much of the altcoin pack this year.
But before anyone starts calling it a breakout, there’s a catch. There’s always a catch.
pyUSD Vault Launch Sparks Sudden Buying Interest
So, what triggered the move? New pyUSD vaults went live on a lending interface built on a network known for sub-second finality. Translation: faster settlement for lending, borrowing, and liquidations. That’s the kind of infrastructure upgrade markets love to front-run.
Add in extra stablecoin rewards and smoother liquidity routing, and suddenly the opportunity looks attractive enough to pull in fresh capital. The result? A sharp 15% spike in the MORPHO price. Simple story. Strong reaction
Derivatives Data Shows Speculation Driving Price Action
Well, what we saw on the chart didn’t happen solely on just spot demand stepping in.
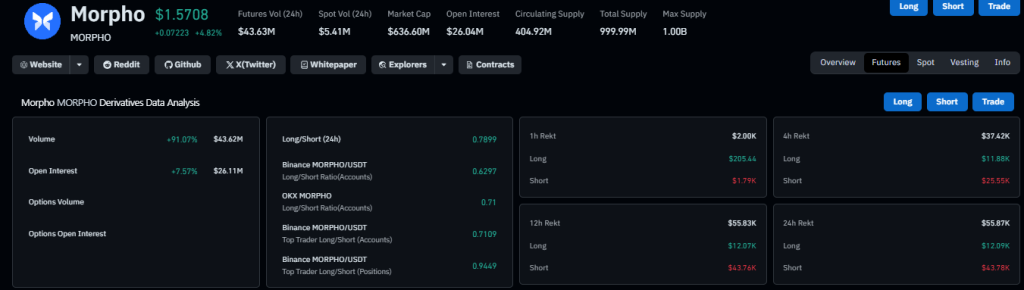
Infact, Derivatives volume surged 91% to $43.62 million, while open interest climbed 7.5% to $26.11 million. That’s a clear sign traders weren’t just buying they were leveraging the move.
This kind of setup usually means momentum is being chased, not built organically. And when leverage piles in, things can get… unstable. That’s why a wick appeared. Still, for now, buyers seems to have the upper hand.
MORPHO Price Faces Resistance After Strong Rally Attempt
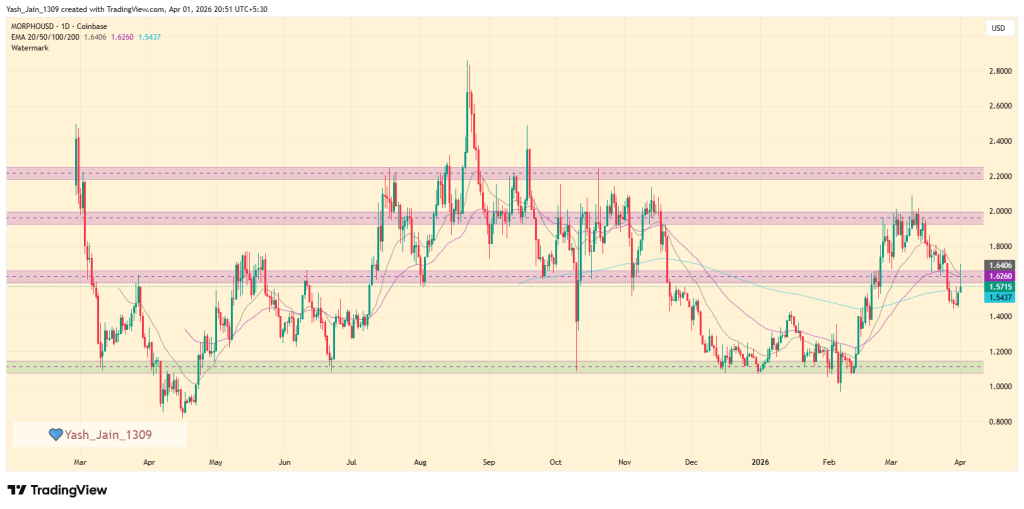
The intraday rally didn’t go unchecked, though. MORPHO Price ran straight into resistance around $1.69, and that’s where things slowed down. Not surprising, considering the broader structure. Since early February, the token had already surged 110% from $0.98 to $2.08 before macro pressure of iran war knocked it off balance.
So yeah, today’s move looks more like a counter-trend bounce at least for now. If buying pressure holds, it could attempt another push higher. If not, this turns into just another rejection at resistance.
On-Chain Signals Strong But Whale Activity Raises Concerns
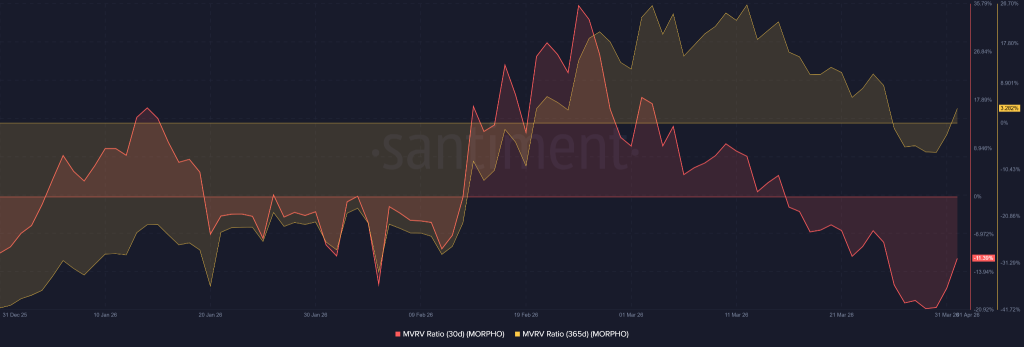
Now here’s where it gets messy. On-chain metrics actually look… decent. The 365-day MVRV sits at +3.28%, suggesting room for further upside without immediate overheating. But zoom in, and the story shifts 30-day MVRV is at -11.39%, meaning short-term traders are still underwater.
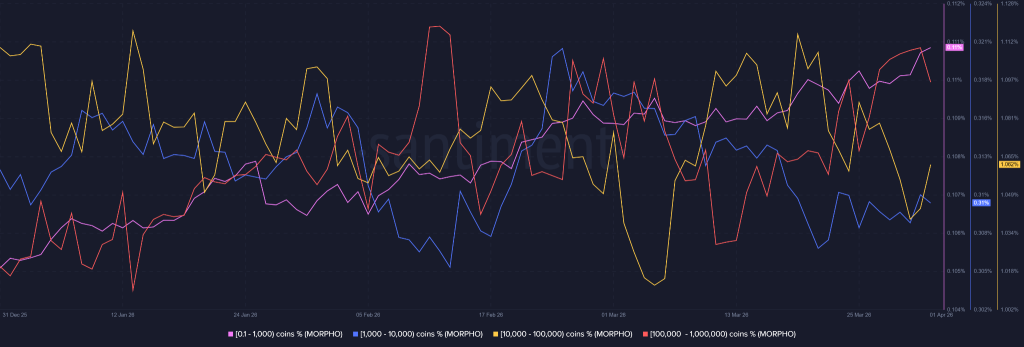
And then there’s supply distribution. Large holders in the 100K–1M token range have been selling, while retail and mid-sized wallets are buying aggressively. Sounds bullish, right?
Maybe. Or maybe it’s something else. Because when bigger players distribute into retail strength, it raises one uncomfortable possibility of an possible “exit liquidity” strategy. Not guaranteed, but definitely not something to ignore.
Can MORPHO Price Sustain Momentum Beyond Resistance Levels?
So, what’s next? The MORPHO price has momentum, narrative, and participation all the right ingredients. But sustaining it? That depends entirely on whether real demand steps in beyond leveraged speculation.
If buyers keep pushing, this could evolve into a continuation move. If not, resistance at $1.69 might hold firm, and this spike fades just as quickly as it came.
For now, it’s a classic crypto setup promising on the surface, questionable underneath.
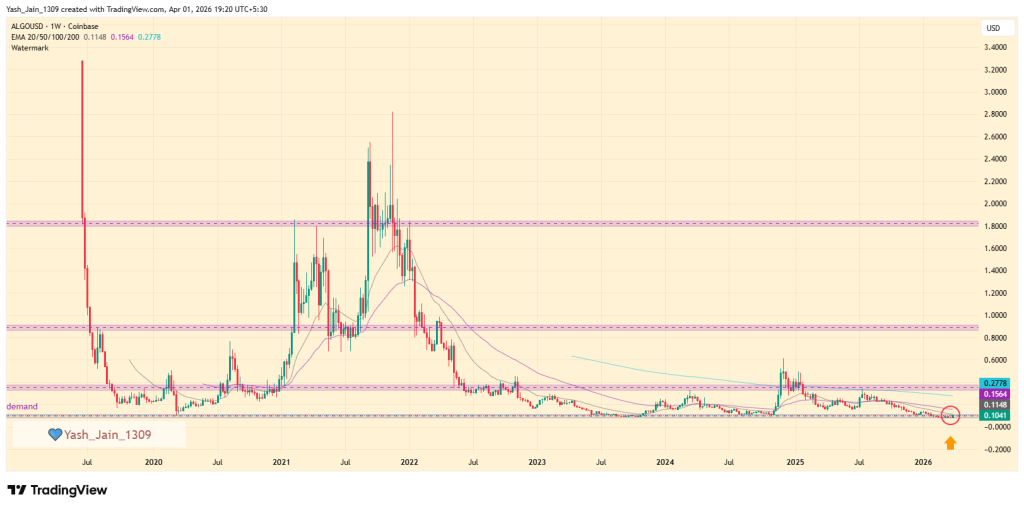
The ALGO price just pulled off a flashy 30% intraday move but zoom out for a second, and the weekly chart barely flinches. That’s the uncomfortable truth. Despite the sudden spike, price is still sitting inside a long-standing demand zone it has respected for years. No breakout. No structural shift. Just… movement inside the box. But flip over to the daily chart, and things look a bit more alive.
Weekly Chart Still Stuck Inside Demand Zone
Let’s not sugarcoat it nothing dramatic has changed on higher timeframes and no structure favored bullish atleast for now.
The ALGO price continues to hover within its established green demand area, the same zone that has acted as a base multiple times in the past. This isn’t a breakout story yet. It’s a “maybe something is forming” story.
And honestly, that’s where most altcoins are right now after a messy Q1 shaped by geopolitical pressure and weak momentum.
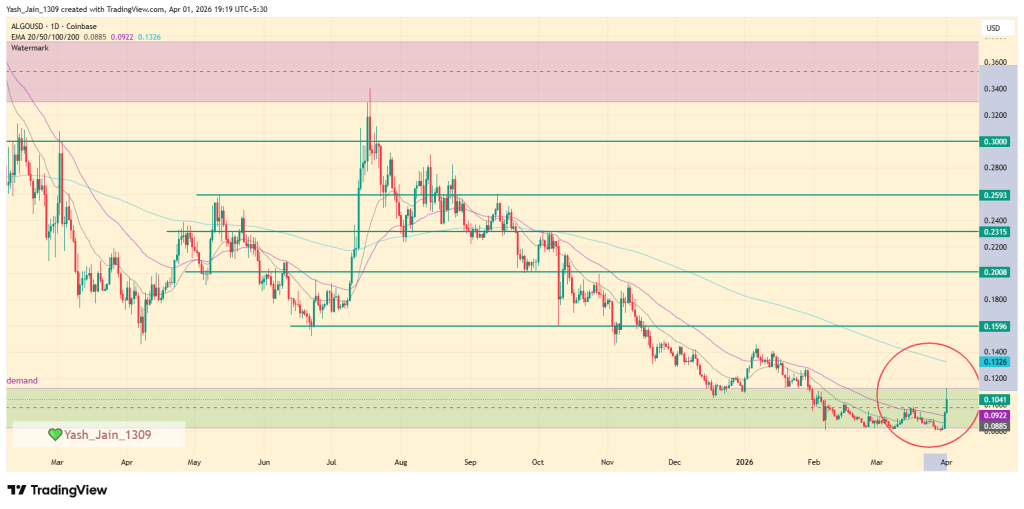
Daily Chart Shows Recovery Attempt Building Momentum
Now here’s where it gets interesting. From a low of $0.080, the price bounced to $0.116. Not massive in absolute terms, but in crypto? That’s a meaningful percentage move. The entire Q1 was basically consolidation inside this demand zone, and now, right at the start of Q2, there’s finally a pulse.
But let’s be real this isn’t a confirmed reversal yet, what its price structure was in past, it barely flinched compared to that.
But, here’s the deal, the next key hurdle sits at the 200-day EMA around $0.132. And before that, price needs to convincingly flip $0.116 into support, which is this green rectangles upper edge. Until then, it’s just testing the waters.
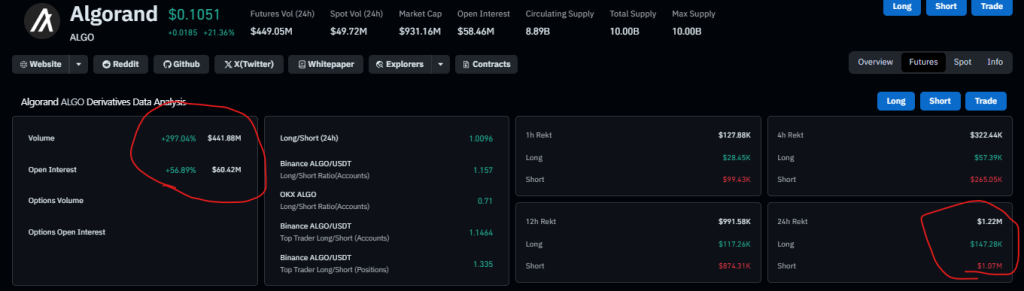
Short Squeeze Drives Derivatives-Led Price Spike
Well, what we saw flinch, kick, or a pulse whatever name you can call but still it was a move that broke atleast last three months low momentum behaviour. This move wasn’t exactly organic.
Derivatives data tells the real story. Around $1.07 million in short positions got wiped out, compared to just $147K in longs. That’s a classic short squeeze.
At the same time, derivatives volume exploded nearly 300% to $441.88 million, while open interest jumped over 50% to $60.42 million. That’s clearly leveraged speculation kicking in hard.
So yeah, the move is real. But it’s also heavily fueled by futures traders chasing momentum.
Catalysts Fuel Hopes For Bigger ALGO Price Move
Now, if you are intrigued at this point, why now of all times this even happen? So 2 things worked.
Two back-to-back catalysts gave the market something to chew on. First, staking for ALGO is now available to over 70 million users via a major neobank, opening up accessibility in a big way.
Then came the more technical narrative and that’s quantum security. A recent Google’s research paper highlighted vulnerabilities across crypto, and ALGO stood out for already implementing post-quantum cryptography like FALCON signatures, state proofs, and secure smart contract primitives. That’s not hype but that’s infrastructure positioning as it just got recognized by Google, which is a big thing.
So, what’s next? If the ALGO price clears the 200-day EMA and escapes this range, upside targets stretch toward $0.340–$0.370. That’s a long road odds suggests potentially a year-end play. But in crypto, timelines can compress fast. For now, though, it’s simple: still inside the zone, but finally showing signs of life.
The live price of the UniSwap crypto token is $ 3.31084035.
Price predictions for 2026 range from $5.00 to $10.00.
Long term forecasts suggest UNI price may hit $30.00 by the end of 2030.
Founded in 2018 by Hayden Adams, Uniswap has transcended its origins as a simple Ethereum-based Automated Market Maker (AMM) to become the undisputed backbone of the decentralized finance (DeFi) economy. By mid-2026, the protocol has achieved a staggering $4.0 trillion in all-time volume, supported by 119 million swappers and $2.6 billion in Total Value Locked (TVL).
Uniswap Labs continues to dominate the landscape by offering a seamless, no-fee trading experience backed by deep, on-chain liquidity. Beyond simple swaps, its sophisticated Liquidity Pools allow users to earn yield by powering the very markets they trade in. As Uniswap integrates deeply with the on-chain economy into a single platform, the central question for investors remains:
Will UNI reach $70? How high can UNI go in five years? Let’s take a look at Uniswap price prediction 2026 -2032 to provide answers to these queries.
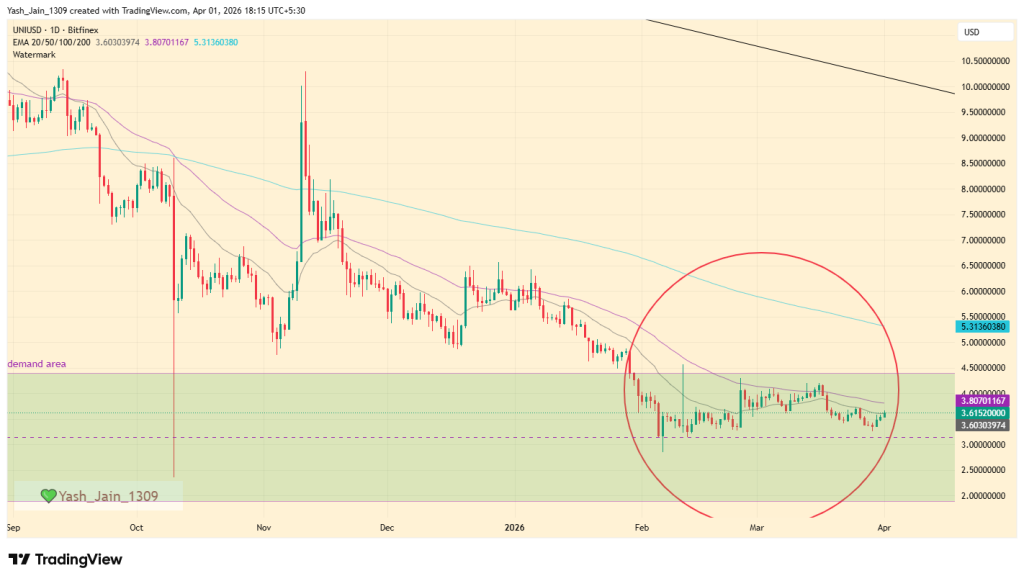
In the daily timeframe, Uniswap’s (UNI) price experienced a significant decline in the first quarter of 2026. A drop below the crucial $5.00 support level in January resulted in a decrease to approximately $3.00 by early February.
Nevertheless, February brought promising signs of recovery, characterized by heightened buying activity within a historical demand zone, signaling a transition from distribution to accumulation. By mid-March, this optimistic momentum continued to push UNI’s price upward, although it faced some pullback subsequently.
As we concluded Q1, UNI has successfully maintained its position above the $3.00 support level. If bullish demand returns in Q2 starting in April, we can anticipate targets of $4.50 and $5.45. However, should selling pressure intensify and the $3.00 support falter, we might observe a decline toward the $2.00 level for deeper liquidity.
Recent News / Opinions
On March 3, 2026, Judge Failla of the Southern District of New York dismissed the Risley class action against Uniswap Labs and Hayden Adams with prejudice. This ruling effectively clears the protocol of all federal and state claims, providing a massive regulatory green light for the DEX’s operations.
Uniswap recently announced a strategic collaboration with Securitize to integrate BlackRock’s USD Institutional Digital Liquidity Fund (BUIDL) into the UniswapX ecosystem. Launched on February 11, this integration allows institutional-grade assets to be traded directly on-chain, bridging the gap between TradFi and decentralized liquidity.
UNI Price Prediction 2026
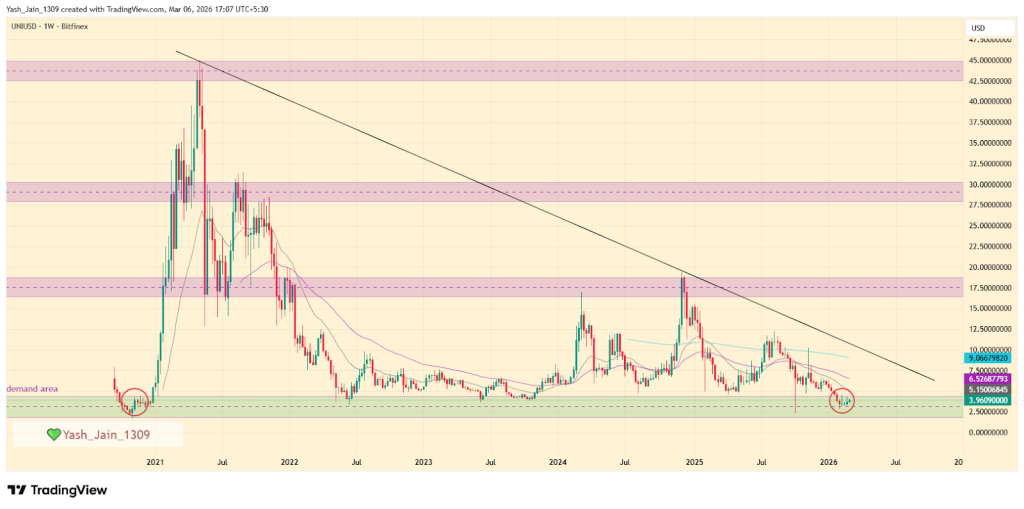
As of Q1 2026, Uniswap (UNI) is currently consolidating within a highly-crucial demand zone ranging from $1.80 to $4.50. This specific price floor carries immense historical weight, as it served as the original launchpad for the 2021 bull run that saw UNI skyrocket to its $44.50 all-time high.
For the first time in five years, the price has returned to this foundational level, effectively completing a full market cycle. This re-entry into the “genesis demand zone” suggests a significant long-term accumulation phase is underway, as long-term holders seek to front-run a potential structural shift in DeFi liquidity.
While the market awaits a catalyst as explosive as the 2021 rally, the current price action is also defined by a massive descending triangle pattern. This structure indicates that while selling pressure is exhausting at the multi-year floor, the price remains capped by a descending resistance line.
Throughout 2026, a steady recovery setup appears more likely than a vertical spike. Technical targets for the year point toward a possible retest of the $10.00 level, which aligns perfectly with the pattern’s upper border. A confirmed weekly breakout above this resistance could signal the end of the long-term bear cycle and the beginning of a sustained move toward mid-range targets.
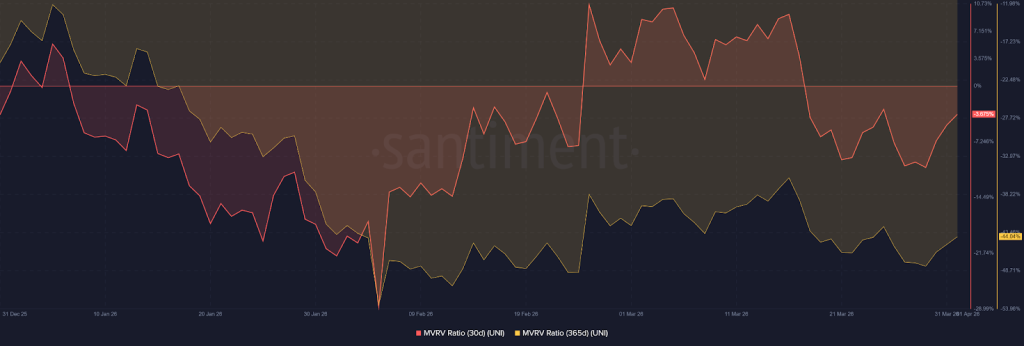
Uniswap On-Chain Analysis
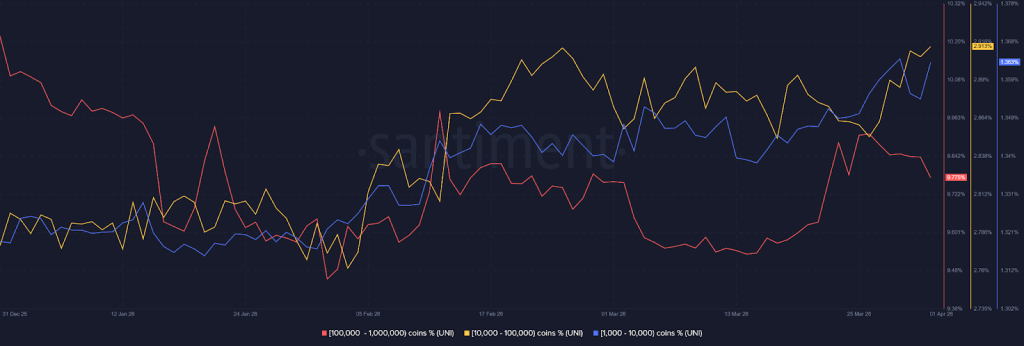
On-chain metrics for Uniswap (UNI) reveal a notable tug-of-war between investor classes. Over the past week, large-scale holders (100k–1M UNI) have significantly reduced their positions. This “whale” selling pressure has been largely absorbed by medium-sized investors (1k–100k UNI), whose steady accumulation has prevented a total collapse but effectively capped price upside.
From a valuation perspective, the 30-day MVRV Ratio has recovered from its February lows but remains in negative territory, indicating that recent buyers are still underwater. More starkly, the 365-day MVRV sits at -44%, signaling that long-term holders are facing substantial unrealized losses.
Historically, such deep “undervaluation” levels suggest that the current price stagnation is unsustainable; while the big players are dumping, the severe long-term losses often precede a market capitulation or a major trend reversal as the supply stabilizes.
UNI Crypto Price Prediction 2026 – 2030
Year
Potential Low ($)
Potential Average ($)
Potential High ($)
2027
7.00
10.00
13.50
2028
8.50
11.50
18.00
2029
10.00
15.50
22.00
2030
12.00
19.00
32.00
Uniswap Price Prediction 2027
The UNI price range can be between $7.00 to $13.50 during the year 2027.
Uniswap Price Forecast 2028
The UNI Network price for 2028 is anticipated to lie within the range of $8.50 to $18.00.
Uniswap Coin Price Prediction 2029
In 2030, the price of UNI is expected to systain trend and remain positive. It may trade between $10.00 and $22.00.
Uniswap (UNI) Price Prediction 2030
Finally, in 2030, the price of UNI is predicted to maintain a steady and positive. It may trade between $12.00 and $32.00.
UNI Price Prediction 2031, 2032, 2033, 2040, 2050
Based on the historic market sentiments and trend analysis of the largest cryptocurrency by market capitalization, here are the possible UNI price targets for the longer time frames.
Year
Potential Low ($)
Potential Average ($)
Potential High ($)
2031
19.00
29.00
39.00
2032
26.50
35.00
41.00
2033
35.00
37.00
44.00
2040
42.00
52.00
57.00
2050
55.00
62.00
70.00
UNI Price Prediction: Market Analysis?
Year
2026
2027
2030
Changelly
$13.25
$15.80
$20.10
CoinCodex
$10.90
$14.85
$19.45
Binance
$12.40
$15.10
$20.85
CoinPedia’s UNI Price Prediction
Uniswap (UNI) is currently consolidating within a key demand zone that ranges from $1.80 to $4.50. This area represents a return to its foundational level from the 2021 bull run. A descending triangle pattern indicates the potential for a gradual recovery throughout 2026, with targets set around $10.00. A breakout above this resistance level could signal the end of the bear market.
Never Miss a Beat in the Crypto World!
Stay ahead with breaking news, expert analysis, and real-time updates on the latest trends in Bitcoin, altcoins, DeFi, NFTs, and more.
FAQs
What is Uniswap (UNI) and how does it work?
Uniswap is a leading decentralized exchange protocol, allowing users to trade tokens directly on Ethereum and Layer-2 networks without intermediaries.
What is Uniswap’s price prediction for 2026?
UNI could trade between $5.00 and $10.00 in 2026 if demand for DeFi grows and the token breaks key resistance levels.
What is the price prediction for Uniswap in 2027
Analysts estimate UNI could trade between $7.00 and $13.50 in 2027 if DeFi activity expands and the broader crypto market remains bullish.
How much will $1 UNI be worth in 2030?
Forecasts suggest UNI could reach $12.00 to $32.00 by 2030 if adoption increases and Uniswap continues leading decentralized exchange trading.
Can Uniswap (UNI) be a long-term investment?
UNI offers long-term potential as a key DeFi token, supported by Layer-2 adoption, stable protocol activity, and growing Ethereum ecosystem usage.
SOL stabilized bullish momentum may assist in reclaiming $200 by 2026.
Solana (SOL) could open a path toward $1,400 by 2030.
Solana is a high-performance blockchain platform designed to host decentralized applications and power global internet capital markets. It distinguishes itself through a unique architecture that combines Proof of Stake with a “Proof of History” mechanism, allowing the network to process thousands of transactions per second with near-instant finality and minimal fees. This scalability makes it a preferred choice for developers building everything from decentralized finance (DeFi) protocols to massive consumer applications and stablecoin payment systems.
The native SOL token is the lifeblood of this ecosystem, used to pay for transaction fees, deploy smart contracts, and secure the network through staking. As adoption grows among major financial institutions, many enthusiasts are left wondering about the future value of the asset.
Questions regarding whether SOL price can realistically reach $1,000, or how it will maintain stability in longterm, remain central to the community’s curiosity. In this deep dive, we explore these burning questions and more.
SOL price trended downward into the first quarter. Dropped below $120 in January, then reached $67-$70 in early February but since then its price has since stabilized in March.
Right now, Immediate resistance level now at $97. Breaking the $97 threshold could lead to a retest of $110 in April. But, Losing $80 support could drop the price to $60.
Recent News & Opinions
On April 1, 2026, Symbiosis launched full support for Solana, enabling any-to-any token swaps with on-chain routing powered by Raydium. This integration allows users to move assets from any source chain to native Solana tokens in a single transaction.
Also on April 1, 2026, Interactive Brokers expanded its offerings by launching Solana trading for eligible European investors. Through this single integrated platform, SOL is now traded alongside traditional stocks, options, and bonds via a partnership with Zero Hash.
Solana (SOL) Price Prediction 2026
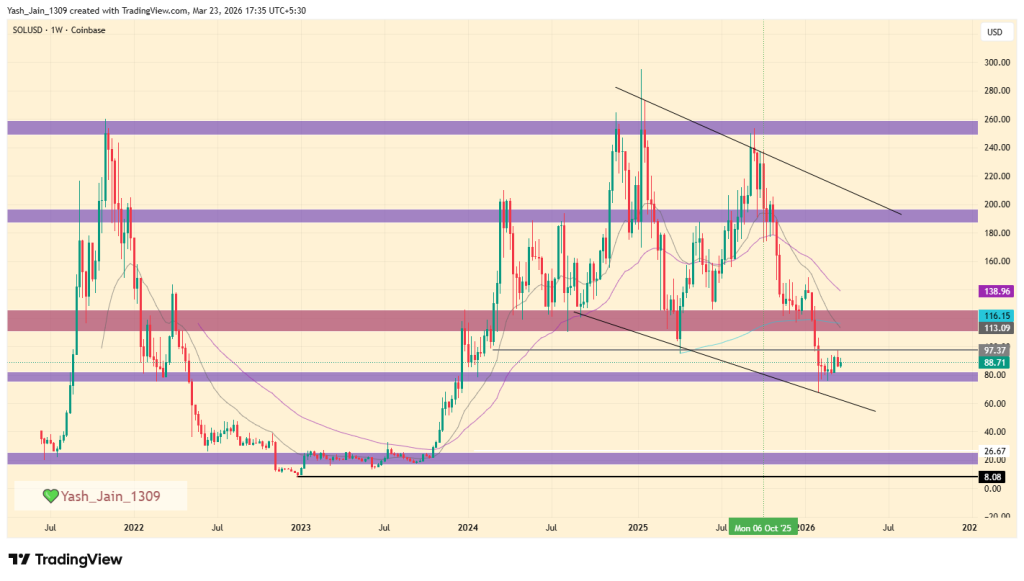
The weekly chart for Solana price (SOL) reveals a historical pattern of significant price surges followed by prolonged corrective phases. After a major spike in late 2021, the asset entered a multi-month downtrend that eventually found a bottom near the $8 mark.
A similar narrative played out in early 2025 as the price surged toward new highs, only to enter the current broader downtrend. This recent decline has been characterized by a falling wedge pattern, where the price action has consistently respected the converging trendlines, signaling a period of heavy consolidation.
Throughout early 2026, this downward trajectory extended until it tested the lower boundary of the wedge in January. However, a short-term recovery has since materialized, successfully reclaiming the $80 support level.
For a sustained bullish reversal, the price must first overcome the immediate resistance at $97, which would open the door for a move toward $116. If these levels are flipped into support, the next primary target lies within the $180 to $200 range, aligning with the upper border of the falling wedge.
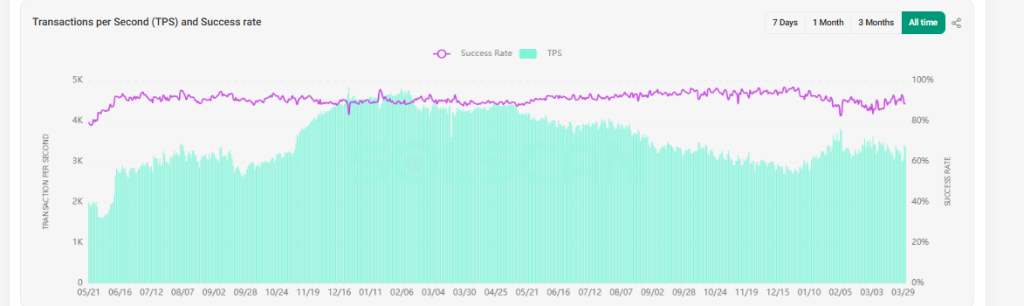
Solana’s Onchain Analysis
Solana’s on-chain data confirms a remarkably resilient ecosystem. Despite a dip in late 2025, the network maintained a steady success rate above 80%.
By Q1 2026, Solana demonstrated its strength as TPS climbed back above 3,000. This recovery, paired with high success rates, highlights a robust infrastructure capable of sustaining high-speed performance even under pressure.
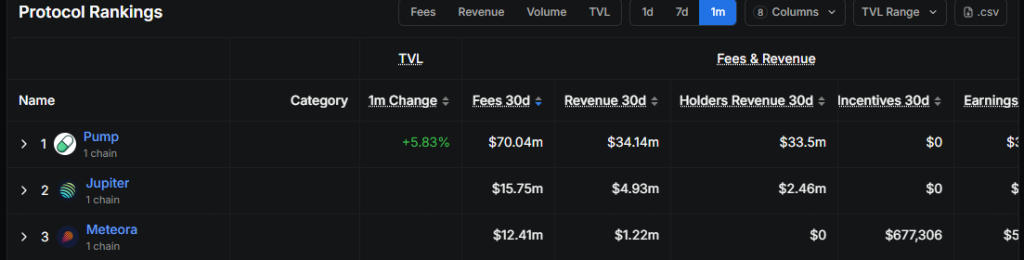
Moreover, The Solana ecosystem continues to see intense activity, with protocol rankings over the last 30 days highlighting the dominant fee-generating platforms. Leading the charge is Pump.fun, which recorded a staggering $70 million in fees, underscoring its massive role in the current market cycle.
This surge in fee generation is followed closely by Jupiter and Meteora, both of which remain cornerstone protocols for liquidity and trading on the network. Together, these three platforms represent the primary engines of on-chain value capture within the Solana ecosystem.
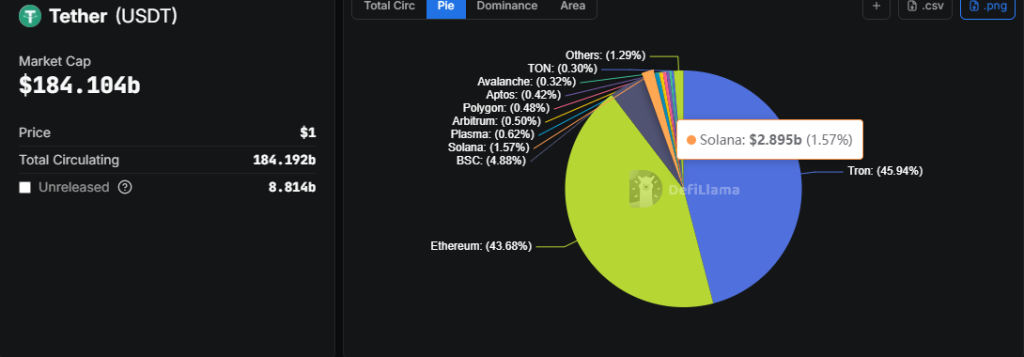
Additionally, Solana’s role as a primary hub for liquidity is further evidenced by its growing share of the stablecoin market. Tether (USDT) on the network currently accounts for 1.59% of the total $184.192 billion circulating supply.
This upward trend marks a significant expansion from the 1.15% dominance recorded in January 2026. For a Layer 1 platform, this increasing stablecoin concentration is a vital health indicator, signaling deepening liquidity and a more robust foundation for decentralized finance activities.
Solana ETF Analysis
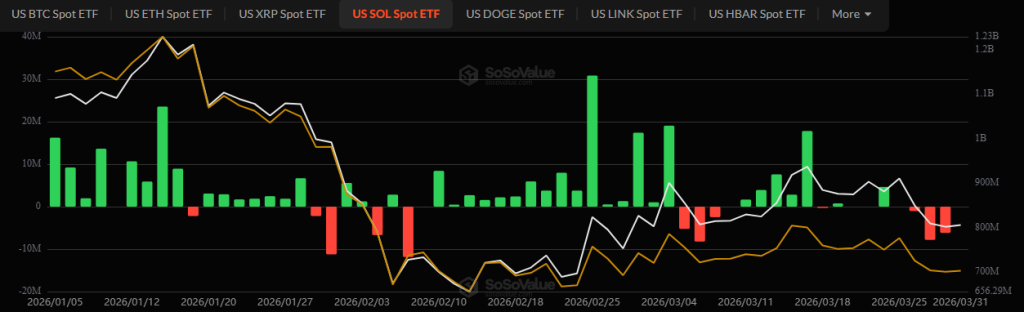
By the end of Q1 2026, the U.S. spot Solana ETF market has around eight sponsoring firms, with the Bitwise BSOL product on the NYSE emerging as the largest holder. These ETFs are distributed across major exchanges, including some on the NYSE, some on NASDAQ, and some on CBOE. Currently, these sponsors hold a combined $805.84 million in net assets, representing approximately 1.69% of Solana’s total market capitalization.
While cumulative net inflows since listing have reached a significant $979.37 million, recent momentum has shifted. After maintaining steady growth through February 2026, inflows began to stall in March. This cooling period culminated in the final week of the quarter, which recorded notable net outflows, reflecting a cautious shift in institutional sentiment.
Solana Crypto Price Prediction 2027 – 2030
Year
Potential Low ($)
Potential Average ($
Potential High ($)
2027
180
320
600
2028
300
420
720
2029
500
750
1000
2030
880
1200
1400
Solana Price Prediction 2027
As per the Solana Price Prediction 2027, Solana may see a potential low price of $180. The potential high for Solana price in 2027 is estimated to reach $600.
Solana Price Forecast 2028
In 2028, Solana price is forecasted to potentially reach a low price of $300 and a high price of $720.
SOL Price Prediction 2029
Thereafter, the Solana (Solana) price for the year 2029 could range between $500 and $1000.
Solana (SOL) Price Prediction 2030
Finally, in 2030, the price of Solana is predicted to maintain a steady positive. It may trade between $880 and $1400.
Expanding exchange-ecosystem demand could lift BNB price toward $2000 by the end of this year.
Long-term network usage growth may extend BNB price toward $10,000.
Binance Coin (BNB) suggests a fundamental shift in how the asset responds to broader market dynamics. In 2026, the token’s performance increasingly reflects on-chain utility and ecosystem liquidity rather than mere speculative volatility. This transition from reactive price swings to a more structured price action indicates a maturing market environment.
As the ecosystem stabilizes, the technical narrative centers on long-term accumulation and the absorption of supply within established demand zones. Sustained network activity across the Binance Smart Chain provides a foundational backdrop for this consolidation, potentially setting the stage for a period of extended price discovery. By focusing on fundamental network health and institutional integration, the outlook for the next several years leans toward organic growth and structural resilience within the global digital asset landscape.
So, what’s next for the BNB price in the rest of 2026 and beyond? What can be the future price movements? Let’s get into the Binance Coin (BNB) Price Prediction 2026–2030.
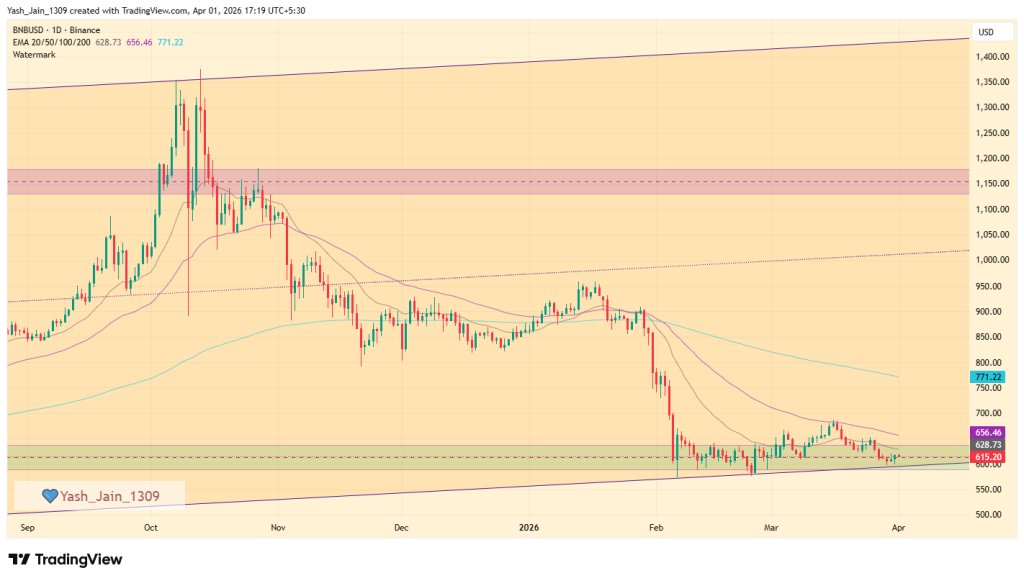
In the third quarter of 2025, we witnessed an impressive rally, soaring 125% from the $600 support level to an exhilarating $1,375. However, by the fourth quarter of 2025 and into the first quarter of 2026, the BNB price retreated back to the $600 demand zone, erasing those remarkable gains.
Since February, we have observed a steady accumulation around this vital $600 level, a trend that has continued into March, so Q1 was tough. But, as Q2 unfolds starting from April, this level appears to have solidified as a robust support point, suggesting that bullish momentum could very well resume this month.
Despite prevailing market challenges, the price has demonstrated remarkable resilience, remaining above $600 throughout March. Should bullish pressure intensify in April, we may see a potential retest of $750; otherwise, further consolidation may continue throughout the month.
Recent News/ Opinions
On April 1, 2026, Binance Earn launched new Yield Arena offers, providing limited-time opportunities to earn up to 35% APR. This weekly update spans across multiple products, including Simple Earn, ETH and SOL Staking, and Dual Investment.
On March 27, 2026, binance shared that equity and commodity perpetual futures on Binance surpassed $150 billion in cumulative trading volume. This milestone was supported by an immense processing of over 110 billion trades in one quarter, highlighting the growing crossover between traditional finance and digital markets.
A recent ruling news on March 7th came from the US federal court that it has positively dismissed all anti-terrorism claims against Binance, alleviating a significant legal burden. In the Southern District of New York, a judge concluded that the plaintiffs, comprising 535 individuals citing 64 attacks from 2017 to 2024, did not establish sufficient evidence to demonstrate that Binance had assisted or conspired with terrorist organizations. This decision marks a commendable step forward for Binance, affirming its commitment to compliance and integrity.
Binance Coin (BNB) Price Prediction 2026
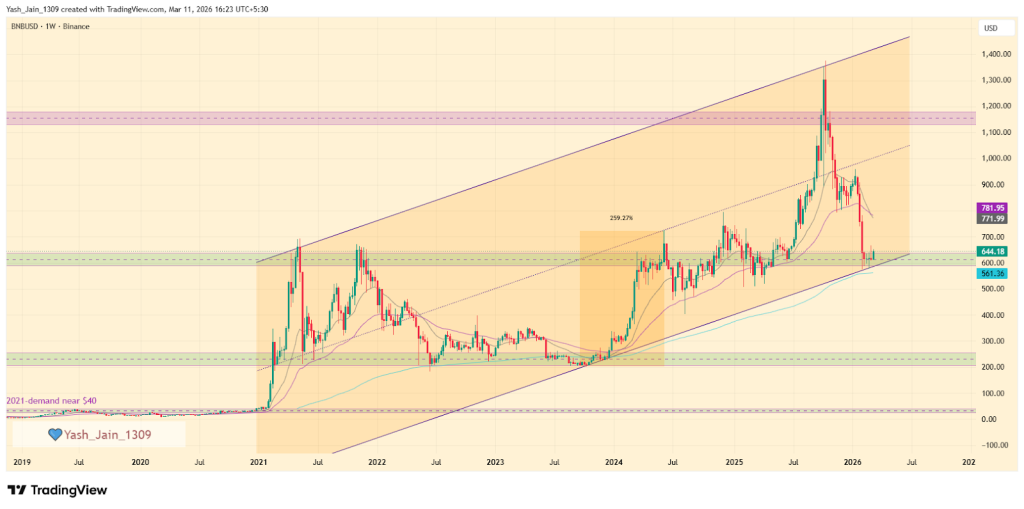
Based on the technical structure of the BNB/USD weekly chart, the price action reflects a long-term ascending channel (or wedge) that has defined the asset’s trajectory since the massive demand surge from the $40 level in early 2021. This multi-year uptrend culminated in a new all-time high of approximately $1,375 in late 2025, validating the token’s utility and its position within the Binance ecosystem. Currently, the market is witnessing a convergence of horizontal price levels with channel’s dynamic trendline support, which reinforces the technical significance of the current price zone.
As of Q1 2026, BNB price is testing a critical turning support zone around the $600 horizontal support, which aligns precisely with the lower boundary of the primary ascending channel. This area is currently serving as a consolidation floor, suggesting a period of institutional accumulation. Historical precedent highlights the importance of this trendline; a similar touchpoint in late 2023 at the $200 range served as the launchpad for a massive rally, though it took roughly 238 days to reach the channel’s median line.
Looking ahead through 2026, the primary bullish thesis anticipates a recovery toward the $1,000 psychological level. If the recovery pace mirrors previous cycles, BNB/USD could reach the channel’s middle band by Q3 2026. However, if consolidation extends further into the year, the recovery might be more gradual, stretching toward the year-end.
Conversely, a decisive break below the $600 footing would invalidate the current setup, significantly increasing the probability of a deeper correction toward the major $200 demand zone.
BNB On-Chain Analysis
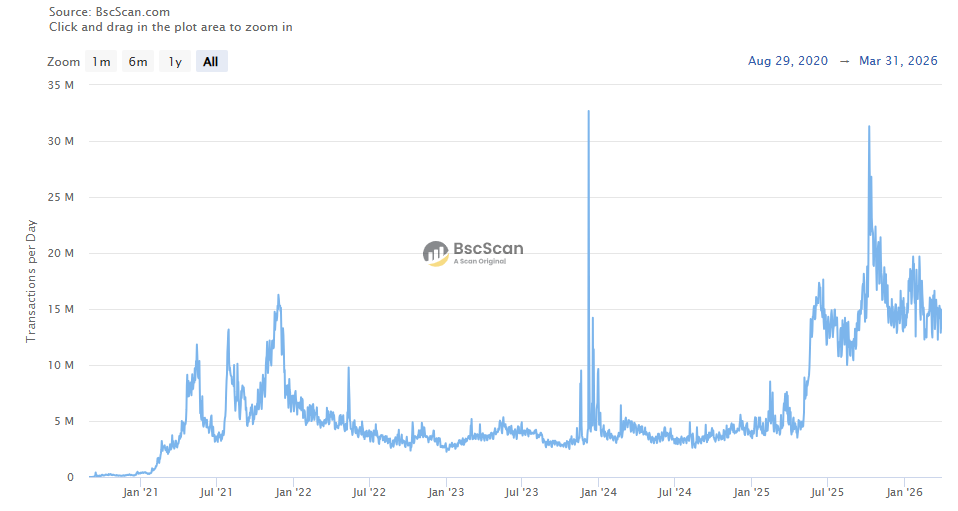
Recent on-chain data highlights the network’s resilience, with daily transactions stabilizing at 15 million in Q1 2026 despite market fluctuations. This sustained utility, paired with total unique addresses nearing the 800 million mark, signals a consistent rise in global adoption. These fundamental metrics suggest a robust foundation for long-term ecosystem growth and structural asset valuation.
Binance Coin Crypto Price Prediction 2027 – 2030
Year
Potential Low ($)
Potential Average ($
Potential High ($)
2027
1200
1420
1800
2028
1600
1950
2300
2029
2100
3250
3900
2030
2500
3800
4500
Binance Coin Price Prediction 2027
As per the Binance Coin Price Prediction 2027, Binance Coin may see a potential low price of $1200. The potential high for Binance Coin price in 2027 is estimated to reach $1800.
BNB Price Prediction 2028
In 2028, Binance Coin price is forecasted to potentially reach a low price of $1600 and a high price of $2300.
Binance Coin Price Forecast 2029
Thereafter, the Binance Coin (Binance Coin) price for the year 2029 could range between $2100 and $3900.
Binance (BNB) Coin Price Prediction 2030
Finally, in 2030, the price of Binance Coin is predicted to remain steadily positive. It may trade between $2500 and $4500.
The long-term projection assumes Binance Coin sustains relevance in enterprise blockchain use cases, with growth moderating over time as the asset matures.
Stay ahead with breaking news, expert analysis, and real-time updates on the latest trends in Bitcoin, altcoins, DeFi, NFTs, and more.
FAQs
What is the BNB price prediction for 2026?
BNB could recover toward $1,000 in 2026 if the $600 support holds and Binance ecosystem demand grows, supported by rising network usage and liquidity.
What will be the BNB price in 2030?
BNB could trade between $2,500 and $4,500 by 2030 if blockchain adoption grows and the Binance ecosystem maintains strong network activity.
How high can BNB price go by 2040?
Long-term projections suggest BNB could reach $13,000–$38,000 by 2040 if the network expands globally and maintains strong adoption across DeFi and Web3.
What factors influence Binance Coin’s price?
Price depends on exchange network usage, liquidity, adoption trends, historical support/resistance zones, and institutional participation.
Is Binance Coin (BNB) a good long-term investment?
BNB is often viewed as a strong long-term asset due to exchange utility, token burns, and ecosystem growth, though crypto investments always carry risk.