Reading view

Here’s Why XRP Price is Stuck Below $2—Is This Capitulation or a Setup for Reversal?

Will XRP Go Up Binance Just Flashed the Same Signal That Sent XRP From $1.60 to $3.65

The post Here’s Why XRP Price is Stuck Below $2—Is This Capitulation or a Setup for Reversal? appeared first on Coinpedia Fintech News

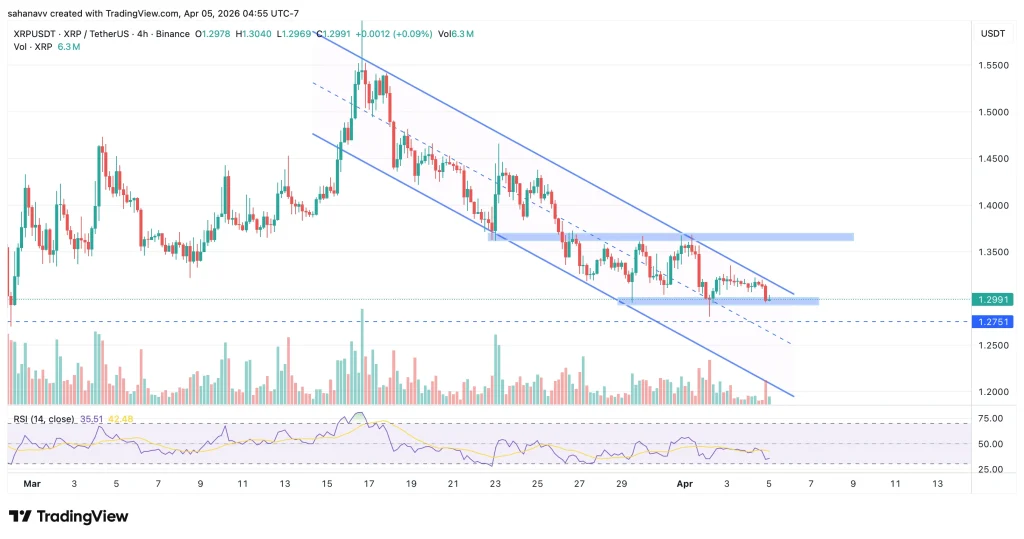
XRP price has been stuck within a strong descending trend for the past 8 months, which has kept the volume within a restricted range. The rally has been consistently printing lower highs and lows and is currently capped below the resistance for more than a month, which has prevented the bulls from pushing the price to $2. 

Another major reason for the price failing to break the resistance at $1.5 and reach $2 is a large chunk of XRP accumulated above this range. That pain is now visible on the chart as every bounce is sold into. But now, the trend is slowing as prices are no longer collapsing but compressing. 

Realized Loss Spikes Signal Capitulation Phase

The Glassnode data shows a sharp rise in realized losses across multiple holder cohorts, particularly in the 1d–1w and 1w–1m age bands, indicating that recent buyers are exiting positions at a loss. Historically, such clusters of realized losses tend to occur near local bottoms, as weaker hands exit and stronger hands absorb supply.

xrp price

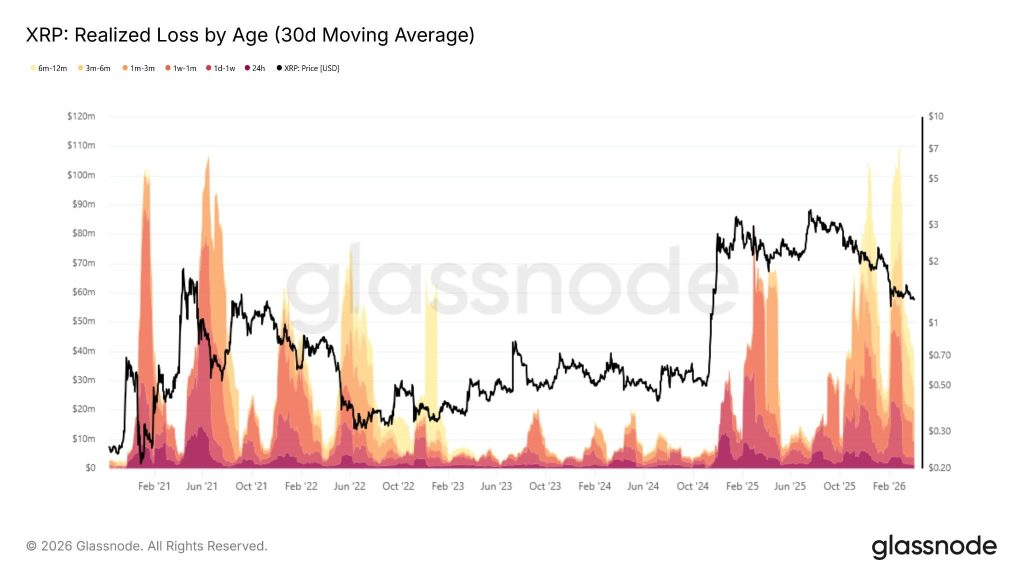
At the same time, the presence of losses across older cohorts (3m–12m) suggests that even mid-term holders—those who accumulated during the rally phase—are now capitulating. This aligns with the earlier insight that a large portion of XRP supply is underwater, reinforcing the idea that the market has already gone through a significant pain cycle. The data also suggests that, at the current price range, only 43.4% of the XRP supply is in profit, the lowest since July 2024. 

This type of behaviour usually results in a volatility expansion, not the continuation of a choppy phase. 

XRP Price Compressing at a Key Support

The XRP weekly chart is now entering a critical phase where price structure, momentum, and positioning are converging. Currently, XRP is consolidating between $1.27 support and the $1.35–$1.40 range, with a deeper support sitting at $1.12. This marks the area where buyers are beginning to step in after months of selling pressure. 

xrp price

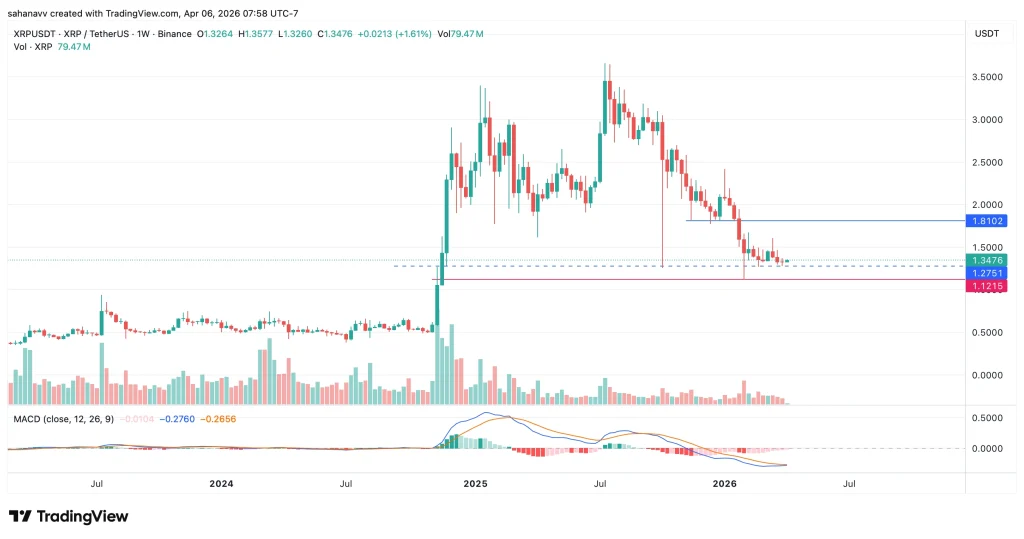
The MACD remains in bearish territory, with both lines still below zero, while heading for a bullish crossover. This suggests that the momentum could flip in favour of bulls at any time from now, as the downside momentum is slowly fading. Moreover, the selling volume has also declined, compared to the initial breakdown, while the candles are tightening, indicating a volatility compression. Therefore, the XRP price may be primed for a transition but not an immediate reversal. 

Key Levels That Define the Next Move

This entire structure now revolves around a few critical levels:

  • $1.27 → Immediate support (decision level)
  • $1.12 → Final support before deeper breakdown
  • $1.80 → Major resistance/trend invalidation level

As long as XRP trades below $1.80, the broader structure remains bearish. But holding above $1.27 keeps the market in a compression phase, where a breakout in either direction becomes increasingly likely.

The Bottom Line: What’s Next for XRP Price?

XRP price is now trading at a critical turning point after a prolonged downtrend, with price compressing near the $1.27 support zone while bearish momentum continues to fade. Although the broader structure remains weak below $1.80, the current range suggests seller exhaustion and a potential setup for volatility expansion. A sustained hold above support could drive a recovery toward $1.80, but losing $1.27 would likely accelerate downside toward $1.12, making this a decisive zone for the next major move.

TrueFi (TRU) Price Explodes 160%—Is it a Breakout or a Low-Liquidity Trap?

TrueFi (TRU) Price Explodes 160%—Is it a Breakout or a Low-Liquidity Trap (1)

The post TrueFi (TRU) Price Explodes 160%—Is it a Breakout or a Low-Liquidity Trap? appeared first on Coinpedia Fintech News

TrueFi (TRU) price is up by more than 157%, reaching $0.01112 from the lows of $0.0042 with a mammoth increase in the volume of nearly 8400%. This explosive move appears primarily driven by a massive, coordinated liquidity surge, as no specific catalyst was visible in the provided data. The token is one of the top performers in the crypto market, with the market cap reaching close to $17 million.

The move comes after months of decline, low liquidity, and weak participation, raising a key question for the traders: Is this the start of a trend reversal or just a short-term liquidity-driven spike?

Why is TrueFi (TRU) Price Rising Today?

TrueFi (TRU) price is rising sharply, driven by a surge in trading activity and a breakout from a prolonged downtrend. The token has gained over 90% in a single session, with trading volume jumping more than 2,000% to over $40 million, highlighting a sudden influx of liquidity. With a relatively small market cap of around $15–20 million, even moderate capital inflows can trigger outsized price movements, especially when combined with technical breakout signals.

  • Price surged ~90% intraday, signaling aggressive momentum
  • Trading volume spiked 2,000%+ to ~$40M–$160M, indicating strong participation
  • Market cap remains low (~$15M–$20M), amplifying volatility
  • Breakout above descending channel resistance near $0.005–$0.006 triggered buying
  • Short-term targets now seen around $0.012–$0.015, driven by momentum expansion

This move is being driven by liquidity and momentum, and its sustainability will depend entirely on whether volume and participation continue to hold.

TRU Price Breaks Out After Prolonged Downtrend

TrueFi (TRU) price has recorded a sharp breakout, surging nearly 90% in a single session after months of sustained downside pressure. The move comes after an extended consolidation phase within a descending channel, where price remained suppressed under key moving averages. This sudden expansion in price and volume signals a potential shift in short-term momentum, attracting trader attention across the market.

tru price

The chart shows TRU trading inside a well-defined descending channel for several months, consistently forming lower highs and lower lows. This structure reflects a prolonged bearish trend, reinforced by price staying below major moving averages, including the 100- and 200-day levels, which continue to slope downward.

The recent breakout above the channel resistance marks the first structural change in this trend. Price has moved sharply from the $0.005–$0.006 range to above $0.010, supported by a significant spike in volume. This indicates strong participation rather than a low-liquidity move.

Momentum indicators are also shifting:

  • MACD turning positive → bearish momentum fading
  • Volume expansion → confirms strength behind the move
  • Price reclaiming short-term moving averages → early sign of recovery

However, the broader trend remains cautious, as TRU is still trading below higher timeframe resistance zones and long-term moving averages. This suggests the move is currently a short-term momentum breakout rather than a confirmed trend reversal.

Wrapping it Up- Key Levels to Watch

TRU’s breakout has shifted short-term momentum, but sustainability now depends on holding above the breakout zone. Immediate support lies at $0.008–$0.009, while a loss of this level could drag the price back toward $0.006–$0.0055. On the upside, if momentum sustains, the TrueFi price could target $0.012, followed by a key resistance near $0.014–$0.015, where previous supply is likely to re-enter.

PEPE Price Shows Early Accumulation Signs — Is a Short Squeeze Coming?

PEPE Price

The post PEPE Price Shows Early Accumulation Signs — Is a Short Squeeze Coming? appeared first on Coinpedia Fintech News

The Pepe price has been stuck within a strong descending trend since the start of the year, highlighting the rising bearish influence. The price is rising today by nearly 6%, trading at $0.000003535 with a significant rise in volume by nearly 130%. These figures suggest PEPE is no longer in a clear downtrend—but it’s not breaking out either.

Price has stabilized near key support, holding its base despite consistent bearish positioning in the derivatives market. This kind of divergence doesn’t last but revolves with a sharp move, and the current setup indicates pressure is building beneath the surface. 

Will Pepe’s price trigger a breakout and break the bearish trend, as derivative data reveals a positioning imbalance?  

Funding Rate: Persistent Bearish Bias

Funding rates have remained consistently negative over the past sessions, indicating that short positions continue to dominate. Traders are actively paying to hold bearish bets, expecting the price to break lower.

pepe price

However, despite this sustained bearish positioning, PEPE has not followed through to the downside. Price continues to hold its base, suggesting that selling pressure is not translating into actual weakness. This is the first sign of imbalance.

Open Interest: Leverage Reset, Not Expansion

Open interest has declined sharply from its previous highs and is now stabilizing at lower levels. This indicates that excessive leverage has already been flushed out of the system.

pepe price

In trending moves, rising open interest typically supports continuation. But in this case, the decline suggests the market has entered a reset phase, where positions have been cleared, but new conviction has not yet entered. This reduces the risk of aggressive liquidations but also means the next move will require fresh participation.

Liquidations: Shorts Cleared, But No New Pressure

Earlier in the cycle, the market saw a wave of short liquidations, indicating that bearish traders were forced out during brief upside moves. Since then, liquidation activity has cooled, with no major long-side wipeouts.

pepe price

This is important as it shows that the downside move has already punished shorts and the market is no longer aggressively liquidating participants. Yet despite this reset, traders continue to lean bearish through funding.

Despite PEPE’s stabilization near its base and avoidance of further breakdown, derivative data indicate that traders continue to position themselves for a downside. This creates a clear mismatch between what the market expects and what the price is actually doing. The derivatives market is misaligned with price, and this kind of divergence usually resolves quickly.

PEPE Price Analysis: Is the Memecoin Heading for a Short Squeeze?

After a prolonged decline, the PEPE price has started to stabilize near the 0.0000029–0.0000032 support zone, forming a base. At the same time, a descending trendline continues to cap upside, keeping the broader structure under pressure. This creates a tightening range, indicating PEPE is no longer in a clean downtrend—it’s transitioning into a compression phase.

pepe price

The chart suggests a clear falling wedge structure where the price is forming consecutive lower highs, indicating consistent pressure from the top. The support has become more or less stable as the buyers continue to defend the same price range. This combination reflects supply weakening over time. 

The RSI is incremental and moving above the middle line, suggesting momentum is shifting from bearish to neutral to bullish. Besides, Accumulation/Distribution is trending sideways to slightly rising, suggesting selling pressure is no longer dominant. Hence, the current trade setup suggests the market is stabalising before the expansion, not trending lower. 

What’s Next for the PEPE Price Rally?

PEPE is trading in a compression phase where price structure and derivatives positioning are diverging, with strong support holding at 0.0000029–0.0000032 despite persistent bearish sentiment reflected in negative funding and cooling open interest. This suggests weakening selling pressure and a potential early accumulation setup. 

For traders, the key trigger remains a breakout above the 0.0000036 resistance trendline, which could open upside toward 0.0000051 and extend to 0.0000074 if momentum builds, while a breakdown below 0.0000029 would invalidate the setup and expose lower liquidity zones, keeping the current range intact until a decisive move occurs.

Bitcoin Awaits Breakout as Macro Tension Builds — Key Levels to Watch in Next 48 Hours

Bitcoin Exchange Reserves Drop to 2019 Levels Is a BTC Supply Shock Coming

The post Bitcoin Awaits Breakout as Macro Tension Builds — Key Levels to Watch in Next 48 Hours appeared first on Coinpedia Fintech News

The Bitcoin price experienced a strong bullish push and closed the weekly trade above $69,000. The volume also increased to some extent, highlighting the rise in trader participation. In the meantime, the token has entered a crucial phase where the next move could largely depend on the macro factors rather than the chart breakouts. 

The technicals are in favour of the bulls, while the growing geopolitical developments are inducing enough pressure on the BTC price. Therefore, the crypto markets and Bitcoin may witness massive price action in the next few days. 

Macro Tension Builds — Why Bitcoin Is at Risk

Iran, Israel, and the US are currently in a phase of heightened geopolitical tension, even as President Trump pushes for de-escalation. Recent reports suggest that the US and Iran are discussing terms for a potential 45-day ceasefire, which could pave the way for a broader resolution. This comes at a critical time, with oil prices rising sharply and risk assets like stocks and crypto showing signs of pressure.

As a result, analysts believe the next 48 hours could be crucial for global markets, with two clear scenarios emerging. In a de-escalation outcome, a confirmed deal could push oil below $100, ease yields, and trigger a relief rally across equities, potentially allowing Bitcoin to reclaim the $72,000 level.

However, if no agreement is reached and tensions escalate further, oil could surge toward $125, tightening liquidity and weighing heavily on risk assets, including crypto. That said, current signals suggest efforts remain focused on avoiding escalation, keeping markets on edge but cautiously optimistic.

Bitcoin Price Outlook: BTC Awaits Breakout as Macro Catalyst Builds

Bitcoin is not trending—it’s compressing into a key range as markets brace for a potential macro trigger. Price continues to trade around $69K, holding above support but failing to reclaim higher levels, reflecting indecision across risk assets. With geopolitical developments likely to drive short-term sentiment, Bitcoin is now positioned at a critical reaction point where the next move will depend more on external catalysts than internal momentum.

btc price

Technically, BTC is trading inside a tight consolidation range between $65.6K and $72K, with a clear descending trendline acting as short-term resistance. Multiple rejections near the $71K–$72K supply zone confirm strong overhead pressure. At the same time, price continues to defend the $65K–$66K demand zone, forming a base. The MACD is flattening near the zero line, signaling a loss of bearish momentum, while CMF remains slightly negative, showing weak capital inflows. 

This creates a compression setup. A breakout above $72K opens upside toward $75K–$76K, while a breakdown below $65.6K exposes $62K as the next major support.

Wrapping it Up—What’s to Expect in the Next 48 Hours?

The Iran–US situation serves as a binary catalyst, determining direction based on market reactions to headlines rather than indicators. A de-escalation would shift sentiment back to risk-on, allowing Bitcoin to build on its current structure and attempt a continuation move. An escalation, however, would tighten liquidity and likely trigger a broad risk-off reaction, putting pressure on BTC despite its underlying strength.

At this stage, the setup is clear. This is not about predicting direction; it’s about watching how Bitcoin (BTC) price reacts when the catalyst hits.

Avalanche Is Quietly Exploding, But AVAX Price Is Still Stuck Below $10—What’s Next?

Avalanche Partners with Japan’s TSI

The post Avalanche Is Quietly Exploding, But AVAX Price Is Still Stuck Below $10—What’s Next? appeared first on Coinpedia Fintech News

The Avalanche price has entered a significant phase since the start of the year. As layer-1 is gaining traction, on-chain activity is climbing, institutional players are steadily increasing, and real-world assets are beginning to take shape within its ecosystem. By most fundamental measures, the network is gaining traction at a time when much of the market remains uncertain.

However, the price presents a starkly contrasting narrative. AVAX price continues to struggle below the $10 mark, showing little urgency despite the visible growth happening on-chain. This gap between rising usage and stagnant price action is not just unusual—it’s where some of the most important setups begin to form.

The question now is simple: is the market failing to recognise Avalanche’s growth, or is something still missing beneath the surface?

Avalanche Usage Is Surging — But Price Isn’t Following

Avalanche activity isn’t fading. It’s holding at elevated levels. As the chart from DeFilama shows, daily active addresses are consistently in the ~6M–6.5M range through early April, with no real drop after the earlier spike. At the same time, daily transactions have climbed from ~2.3M to ~3.5M+, making higher highs over the past few sessions.

avax price

That’s the key shift. Addresses are stable at the top end, but transactions are rising.
This isn’t users leaving—it’s users doing more. In other words, usage isn’t just high; it’s deepening. That’s a stronger signal than a one-off spike. And yet, despite millions of daily users and rising transaction throughput, AVAX is still stuck below $10.

AVAX Price Analysis: Compression Builds as Avalanche Holds Key Support

Avalanche (AVAX) is showing early signs of a structural shift after months of downside pressure, but price action remains capped below a critical resistance zone. Despite rising on-chain activity and stronger fundamentals, AVAX continues to trade around the $9–$10 range, reflecting a clear disconnect between usage and price. This has led to a tightening structure on the chart, where volatility is compressing, and a decisive move is likely approaching.

avax price

Technically, AVAX has formed an ascending channel since February, printing consistent higher lows while facing repeated rejection near the $10–$10.5 zone. This suggests accumulation rather than trend continuation. The RSI is trending upward near 56, holding above the midline, which indicates building momentum. At the same time, Bollinger Bands are tightening, signaling an upcoming volatility expansion. 

However, the lack of strong volume on recent moves shows that a breakout is not yet confirmed. If the price breaks above $10.5, the next upside target sits near $12, while a failure to hold the rising structure could push AVAX back toward lower support levels.

Key Levels to Monitor

  • Resistance: $10 – $10.5 (breakout trigger)
  • Upside Target: $12
  • Support: $8.8 – $9 (invalidation level)

The Bottom Line: What’s Next?

The Avalanche price is up by 5.58% to $9.45 in the past 24 hours, with a volume surging by more than130%. AVAX is sitting at a decision point. On-chain activity remains strong, and the structure has shifted into higher lows, but the price is still capped below the $10–$10.5 resistance zone.

As long as this level holds, the move stays incomplete. A confirmed breakout above $10.5 can push AVAX toward $12, with further upside toward $13–$14 if momentum follows. On the downside, failure to hold $9 keeps the range intact, while a break below $8.8 would invalidate the current structure and expose $8.

Solana Price Under Pressure as Selling Activity Rises—Is More Downside Ahead?

Solana-Focused DeFi Dev Corp Partners with Hylo to Boost Treasury Through Yield Farming

The post Solana Price Under Pressure as Selling Activity Rises—Is More Downside Ahead? appeared first on Coinpedia Fintech News

Solana price is down by 1.5%, reaching $78.82, plunging below $80, and underperforming the broader market, primarily driven by continued fallout from a major ecosystem hack. The $285 million exploit on Solana-based Drift Protocol on April 01, 2026, remains a dominant overhang. The hack by the North-Korean hackers dropped Drift’s TVL from $530 million to $230 million, creating a liquidity crisis and community distrust. This has also pressured the SOL price as investors reassess ecosystem security risks. 

As a result, the SOL price is showing a structural weakness in times when the broader market attempts to stabilise. Hence, the increase in the sell-side pressure is shaping a cautious outlook for the short term.

Price Structure Shows Weakness Near Key Support

Solana is trading at a critical support zone near $75–$78, with the current price hovering around $78–$80, showing clear signs of weakness after failing to sustain its recovery above $85. While the broader market is attempting to stabilise, SOL continues to lag, indicating a lack of strong buyer conviction at higher levels. This is not a trend continuation — it’s a pressure phase at support, where holding or losing this range will define the next move.

sol price

On the daily chart, SOL has broken down from an ascending channel and is now consolidating just above the $77 support, which aligns with key short-term levels. Repeated retests of this zone without a strong bounce suggest weakening demand. RSI is below neutral, reflecting fading momentum, while the structure shows lower highs forming after rejection near $90–$95 resistance. 

If this support fails, the next downside targets open toward $73, followed by a deeper move toward $67–$70. On the upside, SOL needs to reclaim $85–$86 to regain short-term strength, with $93–$95 acting as the next key resistance zone.

TVL Decline Signals Capital Outflow

TVL reflects actual capital deployed within the ecosystem. A decline of this scale indicates reduced DeFi activity, lower user participation and Capital rotating out of the network. The DeFiLlama data shows a consistent drop in Solana’s TVL, falling from above $9 billion to nearly $5.5–$6 billion in recent weeks.

SOL price

This indicates the funds withdrawn may be converted to stablecoins or other assets and rotated into other ecosystems. As TVL is a confidence metric, new capital hesitates when it drops, and existing holders reduce exposure. Therefore, the current decline, combined with the price sitting near support, indicates weak demand while the supply is rising. 

What’s Next—Will SOL Price Secure Range Above $85 This Week?

The Solana price is not just reacting to price pressure; it is reflecting a broader slowdown in capital participation. The drop in TVL indicates that liquidity and user activity within the ecosystem are declining, which reduces the strength of any potential recovery.

At the same time, the price is holding near a key support zone around $75–$78, but without strong follow-through. This combination — weak structure on the chart and declining TVL — suggests that the current phase is more of a fragile hold than a strong base.

In practical terms, this limits upside in the near term. Even if SOL attempts a bounce, the absence of capital inflow makes it difficult to sustain higher levels. For a meaningful move higher, the price needs to stabilise while TVL either stops declining or begins to recover. Until that shift happens, the current setup points toward slow, reactive price action with downside risk remaining elevated rather than a clear trend reversal.

Bitcoin, Ethereum & XRP Price Outlook: Key Levels That Could Decide This Week’s Move

Bitcoin Ethereum XRP

The post Bitcoin, Ethereum & XRP Price Outlook: Key Levels That Could Decide This Week’s Move appeared first on Coinpedia Fintech News

The crypto market is entering a decisive week, with Bitcoin price holding above $67,000, Ethereum price stabilising near $2,000, and XRP price hovering around the $1.3 zone. While the total market cap remains above $2.3 trillion, the price action lacks conviction. It could appear as if the rally is heading towards a breakout, but in a wider perspective, it resembles a pause. 

Bitcoin is struggling below key resistance, Ethereum is compressing without momentum, and XRP continues to move sideways after failing to sustain its recent push. With liquidity thinning and volatility contracting, the next move is likely to be expansion-driven, making this week critical for short-term trend direction.

Bitcoin (BTC) Price Analysis For the Coming Week

Bitcoin is entering a compression phase just below key resistance, with price holding around the $66,000–$67,000 zone. Despite maintaining support above $65,000, the price action lacks expansion, signaling hesitation rather than strength. This is not a trend continuation yet — it’s a decision zone, where the next move will likely be driven by liquidity and breakout confirmation.

btc price

Bitcoin is trading below a descending trendline in the short term while repeatedly testing a horizontal resistance near $67,000. The structure shows lower highs compressing into resistance, a classic squeeze setup. CMF remains slightly positive, indicating mild inflows, but RSI is neutral, reflecting weak momentum. Volume is also declining, suggesting reduced participation. This combination points to an impending breakout or breakdown, with price coiling tightly between $65,600 support and $67,000 resistance.

Ethereum (ETH) Price Analysis This Week

Ethereum is trading within a tightening range near the $2,000–$2,050 zone, showing signs of compression rather than trend strength. While the price continues to hold above the $2,000 psychological level, the lack of expansion suggests fading momentum. This is not a breakout phase — it’s a coiling structure, where volatility is contracting ahead of a directional move.

eth price

On the 4-hour chart, ETH is forming a symmetrical triangle, with lower highs and higher lows converging toward the apex. Price is currently sitting near the decision point, with resistance descending from the $2,400 region and support gradually rising from below $1,900. Bollinger Bands are tightening, RSI remains neutral, and volume is declining — all classic signs of volatility compression. This setup typically leads to a sharp move, with $2,050 acting as immediate resistance and $2,000 as key support.

XRP Price Analysis For This Week

XRP continues to trade under pressure, holding near the $1.28–$1.30 zone after a steady decline from recent highs. Unlike Bitcoin and Ethereum, which are showing signs of compression, XRP remains in a controlled downtrend, with the price failing to reclaim higher levels. This is not consolidation but a weak continuation, where buyers are unable to shift momentum.

xrp price

XRP is moving within a descending channel, consistently forming lower highs and lower lows. Price is currently attempting to stabilise near a short-term support zone around $1.27, but repeated rejections from the $1.34–$1.36 resistance area confirm strong overhead supply. RSI remains below neutral, and volume shows no meaningful expansion, indicating weak demand. Until XRP breaks out of this channel and reclaims higher resistance, the structure remains bearish and trend-driven rather than range-bound.

What to Expect in the Coming Week?

The market is entering a phase where direction will be defined by confirmation, not speculation. Bitcoin and Ethereum prices are nearing key turning points, while XRP price continues to lag, creating a mixed but decisive setup across major assets. In the coming week, the buyers’ conviction could have a major impact on the prices. 

A sustained increase in the volume with a rise in the broader market participation will drive a meaningful upside. However, if participation remains weak, expect continued slow movement and selective underperformance across certain assets. The key signal to watch is follow-through—not just price movement, but whether it is supported by volume and capital inflow.

Why Cardano (ADA) Price Is Lagging While Other Altcoins Move — What Traders Are Missing

ADA Holds Near $0.25 as Bearish Sentiment Builds

The post Why Cardano (ADA) Price Is Lagging While Other Altcoins Move — What Traders Are Missing appeared first on Coinpedia Fintech News

The crypto market is attempting to stabilise, with leading assets like Bitcoin and Ethereum holding above key support levels. However, Cardano continues to lag, trading near multi-year lows and slipping out of the top 10 by market capitalisation. This consolidation appears structural rather than natural, as ongoing development, upgrades, and adoption have failed to translate into price momentum. As the gap between progress and ADA price widens, the next phase of price action becomes increasingly critical to watch.

Why is Cardano Price Stuck While Other Cryptos are Moving?

Since the Bitcoin price began to consolidate, the capital rotation to the altcoins has been observed, but it has been largely selective. The high-beta tokens have been experiencing explosive moves as the breakout setups are attracting buyers. Moreover, the narrative-driven coins are capturing the liquidity; meanwhile, the ADA price remains stuck below $0.3. It has been failing to break the resistance and showing weak follow-through. 

Here are the possible reasons why capital is diverging from Cardano:

  • Currently, crypto is driven by narratives, not just fundamentals, as AI is trending, memecoins have high retail participation, and L1S are capturing attention. 
  • The CMF is negative, volume is declining, and price is stuck at the support, hunting towards a drop in capital flow
  • In the past few days, the platform saw new upgrades, real-world adoptions and governance improvements. Hence, the on-chain growth is not translating 
  • Lastly, the technical structure is also weak as it is making lower highs, failing to reclaim $0.3, holding the range between $0.22 and $0.26

Cardano Price Holds Multi-Year Support, But Weak Structure Raises Concerns

Cardano (ADA) continues to trade near a critical long-term support zone, even as the broader crypto market attempts to stabilise. On the weekly timeframe, ADA is trading within a well-defined range, with the lower boundary around $0.22–$0.26 acting as a key support zone. This level has been tested multiple times since 2023, making it a critical area for bulls to defend.

ada price

Price continues to form lower highs, indicating that buying strength is fading with each rally attempt. The repeated rejection near the $0.30 level further reinforces the presence of strong overhead supply. The Bollinger Bands show price compressing near the lower band, which typically signals either a relief bounce or continued weakness. 

At the same time, the Chaikin Money Flow (CMF) remains deeply negative, pointing to sustained capital outflows rather than accumulation. Volume also remains subdued, suggesting a lack of strong participation from buyers at these levels.

Unless ADA reclaims higher levels with conviction, the repeated tests of this zone increase the probability of a breakdown. On the other hand, holding this range could still trigger a short-term relief move, but only if supported by improving volume and inflows.

Cardano Price Prediction: Will ADA Reach $0.3 This Month?

Cardano (ADA) price is currently trading within a critical range between $0.22 and $0.30, with weak momentum and limited capital inflows restricting any strong upside move. Despite ongoing network upgrades and ecosystem developments, ADA continues to lag behind other altcoins due to declining volume and a lack of sustained buying pressure. 

For Cardano to reclaim the $0.30 level, the price must establish a stable base above $0.26 and attract higher trading volume, supported by broader crypto market strength. Until then, ADA is likely to remain range-bound, with resistance near $0.30 and key support holding around $0.22.

Zcash (ZEC) Price Nears Breakout Zone— Will a Rise to $280 Trigger a Trend Reversal Above $300?

Zcash (ZEC) Bounces 7% After Core Developer Exit Selloff: What’s Next?

The post Zcash (ZEC) Price Nears Breakout Zone— Will a Rise to $280 Trigger a Trend Reversal Above $300? appeared first on Coinpedia Fintech News

Ever since its rejection from the 2025 highs above $740, the Zcash price has remained trapped within a strong descending trend. Besides, the start of the monthly trade was not explosive but rather a sustained one. With these developments, the popular privacy token has reached a crucial turning point as it is now testing a long-standing descending trend line near the $250 to $300 range. Hence, it appears that it is not just another bullish move but a decision phase. 

Now it would be fascinating to watch whether the ZEC price breaks out and shifts the structure or it gets rejected and continues its broader downtrend. 

Zcash Price Analysis: ZEC Stuck in a Descending Trend

The ZEC price has been compressing below a descending resistance trendline, forming a tightening range that usually precedes a volatile move. Besides, momentum is gradually improving, but the strength lacks confirmation. This suggests that the price is rising but lacks conviction, which is why the current upswing is failing validation. 

zec price

RSI is trending upward and holding above mid-levels, signaling early bullish strength, while CMF remains slightly negative, indicating that strong capital inflows are still missing. This analysis indicates the ZEC price remains in a downtrend, defined by consistent lower highs and rejection from key resistance zones. 

Key Levels to Watch

  • Immediate Resistance: $260–$280
  • Major Resistance: $300
  • Breakout Confirmation: Above $280 with strong volume
  • Immediate Support: $220–$230
  • Breakdown Level: $200
  • Next Major Support: $170

Price is currently testing resistance from below, making this a high-stakes zone. 

The Bottom Line: Will ZEC Price Reach $300 This Month?

The Zcash price continues to coil under the resistance, regardless of the current recovery, which suggests the move is not a confirmed breakout. Therefore, a rise above $280 could activate the target at $300, which may further extend to $320-$350. On the other hand, a rejection from the current levels could drag the levels to $220 or lower than $200 to $170 in an extreme bearish case.

​​SIREN Price Jumps 100%, But Charts Signal a Bull Trap Ahead

siren (SIREN) Price Prediction 2026, 2027 – 2030: Can AI Narrative Push SIREN Toward $10.00?

The post ​​SIREN Price Jumps 100%, But Charts Signal a Bull Trap Ahead appeared first on Coinpedia Fintech News

The SIREN price is back in the spotlight after a sharp bounce from recent lows. The price had gained massive attention with a 1600% jump in the first few days of March, which resulted in an 88% correction by the end. The token further dropped by 70% this month, and the latest rebound has recovered all the losses. However, the current price action does not appear to be its strength but a strong reaction. 

While the data leans heavily on one side, the question that arises now is, is this movement the start of a new trend or just a temporary bounce before another leg down?

Why SIREN Price Is Rising Today — Can This Bounce Sustain or Is a Reversal Coming?

The current move is not driven by fresh fundamentals. It’s driven by structure. First, price bounced from a strong demand zone near $0.40–$0.45, where buyers stepped in aggressively. This is visible through a spike in volume, suggesting short-term accumulation or short covering.

Second, the broader market environment still favors high-volatility altcoins, especially those tied to AI narratives. SIREN continues to benefit from that positioning.

siren price

The most important driver is technical, as the oversold conditions triggered a relief rally. RSI recovered from oversold levels (~30) to neutral (~50), confirming this is a bounce—not a trend reversal. Siren’s price structure remains clearly bearish on the short-term frame. The token has been forming lower highs and lows with strong rejection candles after topping near $3. This confirms a distribution phase followed by a downtrend. 

Key Levels to Watch

  • Immediate Resistance: $0.60–$0.65
  • Major Resistance: $0.80–$1.00
  • Trend Reversal Zone: Above $1.50
  • Key Support: $0.40–$0.45
  • Breakdown Level: $0.30

Price is currently struggling below resistance, showing weak continuation. The volume spike at the bottom shows reactive buying, while a weak follow-through displays a lack of conviction. The RSI is neutral, indicating no strong trend momentum, and this combination signals a temporary bounce, not a sustained rally.  

Siren Price Prediction: What’s Next?

SIREN price is not in an uptrend. It is in a corrective bounce within a larger downtrend. If the price breaks and holds above $0.65, the rally could extend and test the resistance between $0.8 and $1. Meanwhile, a rejection near $0.55 to $0.6 could activate the lower target at $0.45 to $0.3. 

This is not early accumulation but is a mid-trend noise after a major crash. Unless buyers reclaim key resistance with volume, the path of least resistance remains negative. 

❌