Reading view

Stellar (XLM) Price Prediction for 2026, 2030: Is a Structural Breakout Ahead?

Stellar Price Prediction

The post Stellar (XLM) Price Prediction for 2026, 2030: Is a Structural Breakout Ahead? appeared first on Coinpedia Fintech News

Story Highlights

  • The live price of the Stellar crypto is  $ 0.15909815
  • XLM is holding its $0.13–$0.16 demand zone, with a breakout above $0.30 and $0.50 needed to confirm a structural trend reversal toward 2026 targets.
  • If payment adoption and tokenization expand, Stellar could trend toward $2.50 by 2026 and potentially $5–$7 by 2030 in a strong cycle.

Stellar is entering 2026 at a critical inflection point, with price stabilizing after a prolonged downtrend while attempting to build a base near key demand levels.  As a core player in cross-border payments, Stellar continues to expand its role in low-cost, high-speed financial infrastructure, supporting real-world transaction flows across global markets. With market structure tightening and downside pressure easing, the next phase will be defined by whether demand can translate into a sustained breakout.

In this Stellar (XLM) price prediction 2026, we examine key levels, structural shifts, and potential catalysts shaping its trajectory ahead.

Stellar Price Today

Cryptocurrency Stellar
Token XLM
Price $0.1591 up 2.24%
Market Cap$ 5,264,728,143.62
24h Volume$ 143,995,009.6586
Circulating Supply33,091,070,282.6774
Total Supply50,001,786,883.6590
All-Time High$ 0.9381 on 04 January 2018
All-Time Low$ 0.0012 on 18 November 2014

Stellar (XLM) Price Prediction For April 2026 

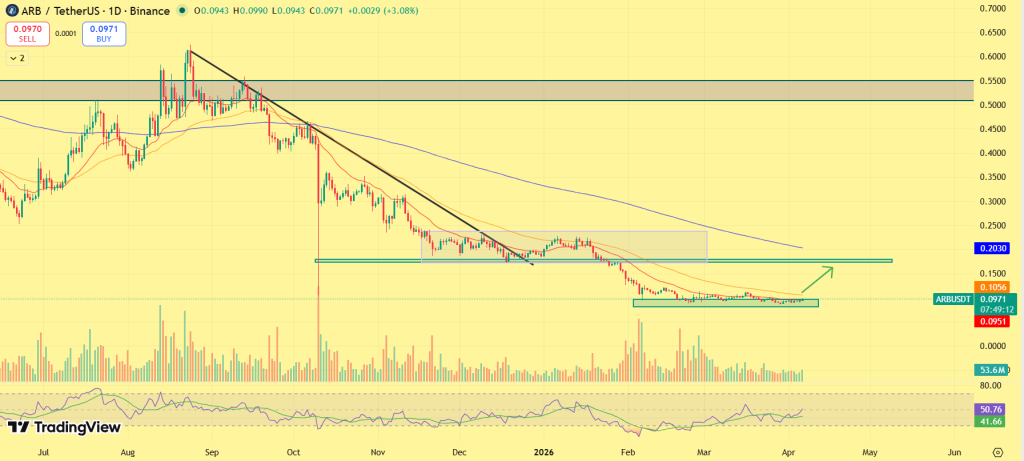
Stellar’s price action is transitioning from decline into consolidation, with early signs of compression forming near the $0.15–$0.17 range. After an extended downtrend, XLM has begun holding above its immediate support zone, while a descending resistance trendline continues to limit upside. 

This setup reflects a market preparing for a directional move. The immediate resistance lies near $0.20–$0.22. A breakout above this zone could shift short-term structure and open the path higher. In this context, Stellar in April may reach the $0.30–$0.50 range, provided resistance is reclaimed and momentum expands. However, failure to break higher may keep price range-bound, with support expected near the $0.14 level.

Coinpedia’s Stellar (XLM) Price Prediction 2026

The broader structure for Stellar in 2026 reflects a market attempting to transition out of a prolonged downtrend, with early signs of base formation but no confirmed reversal yet. After a sustained decline marked by lower highs and persistent selling pressure, XLM has moved into a compression phase near its lower demand zone. This shift indicates that downside momentum is weakening while price stabilizes within a tighter range.

Stellar price prediction

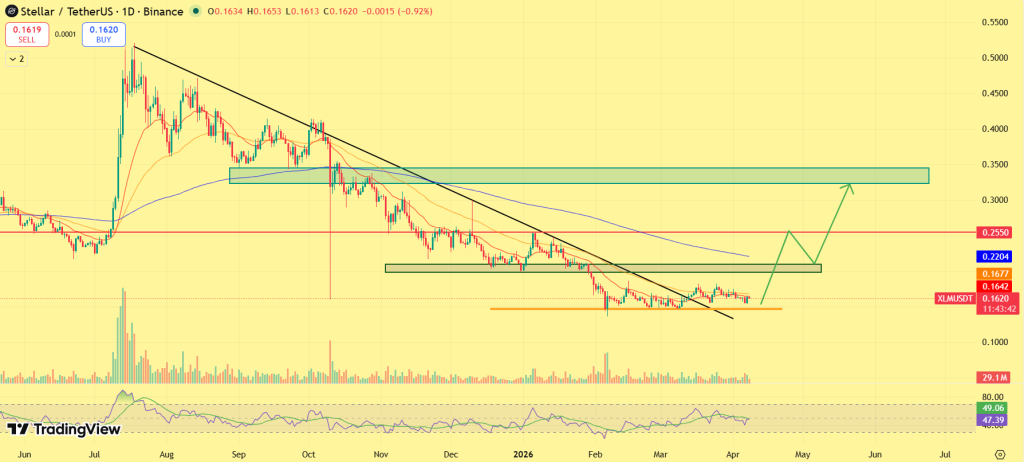
The next phase depends on reclaiming key resistance levels. The immediate barrier lies near $0.22, followed by stronger zones at $0.30 and $0.50. These levels act as structural checkpoints for recovery. A sustained move above $0.50 would signal a clear shift in market structure, opening the path for a broader expansion phase.

In this scenario, Stellar could advance toward the $1.20–$2.50 range over the course of 2026, supported by a step-by-step recovery across resistance zones. However, until these levels are reclaimed, the market remains in a rebuilding phase. A breakdown below $0.14 would invalidate the current base and delay recovery.

Recent Catalysts For Stellar (XLM)

Growing focus on cross-border payment solutions, reinforcing Stellar’s relevance in global financial infrastructure.

Increased institutional exploration of blockchain-based settlements, supporting networks like Stellar.

Ongoing ecosystem development and partnerships, strengthening long-term network positioning.

Stellar Crypto Price Prediction 2026 – 2030

YearPotential Low ($)Potential Average ($Potential High ($)
20261.201.802.50
20271.802.403.20
20282.803.804.80
20294.205.306.20
20305.506.207.00

Stellar (XLM) Price Forecast 2026

In 2026, Stellar price could project a low price of $1.20, an average price of $1.80, and a high of $2.50.

Stellar Price Prediction 2027

As per the Stellar Price Prediction 2027, Stellar may see a potential low price of $1.80 The potential high for the Stellar price in 2027 is estimated to reach $3.20.

XLM Price Prediction 2028

In 2028, the Stellar  price is forecasted to potentially reach a low price of $2.80, and a high price of $4.80

Stellar Price Targets 2029

Thereafter, the Stellar price for the year 2029 could range between $4.20 and $6.20.

Stellar (XLM) Price Prediction 2030

Finally, in 2030, the price of Stellar is predicted to remain steady and positive. It may trade between $5.50 and $7.00.

Stellar Price Prediction 2031, 2032, 2033, 2040, 2050

The long-term projection assumes Stellar sustains relevance in enterprise blockchain use cases, with growth moderating over time as the asset matures.

YearPotential Low ($)Potential Average ($)Potential High ($)
20316.207.509.00
20328.0010.0012.00
20339.1013.0016.00
204025.0050.0080.00
2050100.00140.00200.00

Stellar (XLM) Price Prediction: Market Analysis?

Year202620272030
Changelly$1.90$2.50$3.40
CoinCodex$1.40$2.70$4.00
WalletInvestor$2.00$3.40$4.40
Never Miss a Beat in the Crypto World!

Stay ahead with breaking news, expert analysis, and real-time updates on the latest trends in Bitcoin, altcoins, DeFi, NFTs, and more.

FAQs

What is Stellar (XLM) price prediction for 2026?

Stellar could trade between $1.20 and $2.50 in 2026 if it reclaims key resistance and adoption in payments and tokenization accelerates.

What is XLM price prediction for 2027?

XLM could trade between $1.80 and $3.20 in 2027 if adoption expands and broader crypto liquidity supports payment-focused blockchains.

How high will XLM go in 2030?

Under strong market conditions, XLM may reach $5.50 to $7.00 by 2030, driven by enterprise settlement growth and stablecoin usage.

How much will XLM be worth in 10 years?

Long-term projections suggest XLM could exceed $10 if institutional adoption scales, though outcomes depend on regulation and market cycles.

What is the XLM price prediction for the next bull run?

In the next crypto bull run, XLM could target the $0.80–$1.50 range initially. A sustained breakout above $1.00 may open upside toward $2.00+, depending on market liquidity and adoption momentum.

Internet Computer (ICP) Price Prediction 2026, 2027 – 2030: Is ICP Preparing a Move Toward $25?

Internet Computer Price Prediction

The post Internet Computer (ICP) Price Prediction 2026, 2027 – 2030: Is ICP Preparing a Move Toward $25? appeared first on Coinpedia Fintech News

Story Highlights

  • The live price of the ICP crypto is  $ 2.49609415.
  • If the recovery structure develops, ICP could gradually climb toward the $27 region by the end of 2026.
  • With stronger Web3 infrastructure adoption, ICP price could potentially expand toward $70 by 2030.

Internet Computer (ICP), one of the leading decentralized compute platforms, is currently navigating a phase where strong technological relevance contrasts with prolonged price weakness. While the protocol continues to expand its role in decentralized web infrastructure, its price action has remained under sustained pressure.

After an extended downtrend, ICP is now stabilizing near lower demand zones, suggesting that selling momentum may be gradually easing. However, the lack of strong upside continuation indicates that the token remains in a transitional phase rather than a confirmed recovery.

This sets up a key question: Is ICP forming a base after prolonged weakness, or does the structure still reflect insufficient demand? With 2026 already underway, attention now shifts to whether ICP can reclaim key resistance levels and transition into a recovery phase. So, let’s dive into Coinpedia’s Internet Computer (ICP) Price Prediction 2026, 2027 – 2030.

Internet Computer Price Today

Cryptocurrency Internet Computer
Token ICP
Price $2.4961 up 8.97%
Market Cap$ 1,374,800,272.05
24h Volume$ 127,967,954.5018
Circulating Supply550,780,615.9515
Total Supply550,780,615.9515
All-Time High$ 750.7305 on 10 May 2021
All-Time Low$ 1.9773 on 10 October 2025

Internet Computer (ICP) Price Prediction for April 2026 

ICP is entering April from a position of compression, where price is no longer trending lower but has yet to transition into expansion. After a prolonged decline, the asset has begun to stabilize within a tight range around the $2.20–$2.60 region. This behavior typically reflects a shift in market dynamics, where aggressive selling fades and price starts to balance between buyers and sellers.

The key trigger now sits above the current range. A move through the $3.20–$3.50 zone would indicate that demand is returning, potentially initiating a recovery phase. Under this scenario, ICP in April could move toward the $5–$8 range, driven by a breakout from its current consolidation structure. If this breakout fails to materialize, ICP price is likely to remain contained, with the $2.00 area continuing to act as a base.

Coinpedia’s Internet Computer (ICP) Price Prediction 2026

ICP’s broader trajectory in 2026 is centered around whether the current stabilization phase evolves into a sustained recovery structure. The token has spent an extended period in decline, forming a series of lower highs that defined its previous market cycle. That phase now appears to be slowing, with price beginning to compress near its lower range, often a precursor to structural transition.

ICP price prediction

The recovery path, however, is not immediate. It requires a sequential reclaim of key zones, starting with $3.50, followed by $5 and $8. These levels represent the points where previous selling pressure emerged and must now be absorbed. Once these zones are cleared, the market typically shifts into a higher trading regime, where upside momentum begins to build more aggressively.

In such a progression, ICP could gradually expand toward the $10–$27 range during 2026, reflecting a full-cycle recovery rather than a short-term bounce. Until that transition is confirmed, the asset remains in a rebuilding phase. Loss of the $2.00 level would weaken this structure and extend the consolidation period.

Recent Catalysts

Major exchange listing expanded access, improving liquidity and global participation.

AI narrative gaining traction, positioning ICP within the decentralized compute and infrastructure segment.

Strong developer activity continues, reflecting sustained ecosystem growth and ongoing network development.

Internet Computer Crypto Price Prediction 2026 – 2030

YearPotential Low ($)Potential Average ($Potential High ($)
2026101827
2027142434
2028183045
2029254055
2030355070

Internet Computer Price Projection 2026

In 2026, Internet Computer  price could project a low price of $10, an average price of $18, and a high of $27

ICP Crypto Price Action 2027

As per the Internet Computer price Prediction 2027, Internet Computer   may see a potential low price of $14, The potential high for Internet Computer  price in 2027 is estimated to reach $34

Internet Computer Price Target 2028

In 2028, Internet Computer price is forecasted to potentially reach a low price of $18, and a high price of $45.

ICP Token Price Forecast 2029

Thereafter, the Internet Computer (ICP) price for the year 2029 could range between $25 and $55.

Internet Computer Price Prediction 2030

Finally, in 2030, the price of Internet Computer (ICP) is predicted to maintain a steady positive. It may trade between $35 and $70

Internet Computer Price Prediction 2031, 2032, 2033, 2040, 2050

Over the long term, the value of Internet Computer (ICP) will depend on Web3 adoption and the expansion of decentralized cloud services, which could support gradual growth across future market cycles.

YearPotential Low ($)Potential Average ($)Potential High ($)
2031406085
20324570100
20335085120
2040120185250
2050350520700

Internet Computer (ICP) Price Prediction: Market Analysis?

Year202620272030
Changelly$15$35$35
CoinCodex$18$42$50
WalletInvestor$20$38$45
Never Miss a Beat in the Crypto World!

Stay ahead with breaking news, expert analysis, and real-time updates on the latest trends in Bitcoin, altcoins, DeFi, NFTs, and more.

FAQs

What is Internet Computer (ICP) and what is it used for?

Internet Computer (ICP) is a layer-1 blockchain that lets developers build fully on-chain apps without traditional cloud servers.

What is the Internet Computer (ICP) price prediction for 2026?

ICP is projected to trade between $6 and $25 in 2026, depending on market momentum, support levels, and broader crypto sentiment.

How high can ICP price go by 2030?

If adoption of decentralized cloud platforms expands and crypto markets strengthen, ICP could potentially reach around $70 by 2030 in a strong growth cycle.

How much will ICP cost in 2035

Long-term models suggest ICP could trade between about $80 and $150 by 2035 if decentralized computing platforms gain wider adoption.

What will ICP be worth in 2040?

Long-term projections estimate ICP could range between roughly $120 and $250 by 2040, depending on Web3 adoption, developer activity, and broader crypto market growth.

What factors influence ICP price movements?

ICP’s price is influenced by market trends, developer adoption, token supply dynamics, network upgrades, and overall crypto sentiment.

Is ICP a good long-term investment?

ICP may suit long-term investors who believe in decentralized cloud computing, but price volatility means risk management is essential.

Render Price Outlook: Bullish Setup Forms as AI Demand Surges

Render (RNDR) Price Action Shows Bullish Momentum Key Resistance and Support Levels

The post Render Price Outlook: Bullish Setup Forms as AI Demand Surges appeared first on Coinpedia Fintech News

Render is emerging as one of the strongest performers in today’s crypto rally, surging over 10% to trade near $2.07, as bullish momentum spreads across the broader market. The move is being driven by a combination of macro tailwinds and project-specific catalysts. With Bitcoin pushing higher and liquidity rotating into high-growth narratives, AI-focused tokens like RNDR are attracting aggressive inflows.

With RENDER price now pressing against a major resistance zone, the market focus is shifting quickly: Is RENDER preparing for a breakout toward $2.50 next?

What’s Driving the RENDER Price Rally?

Render’s current momentum is rooted in tangible ecosystem growth, not just sentiment. A major catalyst comes from the approval of RNP-023 governance proposal, which adds ~60,000 GPUs to the network via decentralized providers. This significantly expands Render’s compute capacity at a time when global AI demand is surging.

At the same time, on-chain and network metrics confirm real adoption:

  • Over 71.4 million frames processed
  • More than 5,700 active GPU nodes
  • AI workloads now approaching ~40% of total network activity

This indicates that Render is transitioning from a narrative-driven asset to a usage-driven infrastructure protocol. Adding to the bullish case, the protocol has burned over 1.24 million RNDR tokens, tightening supply through its burn-and-mint equilibrium model, creating a supply-demand imbalance in favor of price appreciation.

Further strengthening sentiment, upcoming events like RenderCon 2026 and enterprise-level integrations continue to position the network at the center of the AI  and decentralized compute narrative.

Futures Market Data Shows Strong Bullish Positioning

Render’s derivatives data confirms that the rally is supported by active market participation. Futures volume has surged by over 50%, while open interest has increased nearly 20%, indicating that traders are entering fresh positions. This alignment of rising price and open interest signals new long exposure, rather than short covering.

RENDER open interest

At the same time, funding rates remain stable, suggesting the market is not overheated, and the trend still has room to extend. This positioning reflects a continuation setup, with momentum supported by sustained participation.

Render Price Analysis: Breakout Setup Hints a Move Toward $2.50 Next

Render price has broken above its descending trendline resistance, confirming a shift from consolidation into expansion. Price is now testing the 200-day EMA, a key level that often determines trend continuation. The structure has already turned bullish. RNDR formed a double bottom near $1.20, rebounded from that demand zone, and has now printed a higher high, confirming a clear uptrend.

RENDER price chart

This move reflects accumulation followed by expansion, with buyers stepping in consistently and absorbing previous sell pressure. If RNDR sustains above the breakout zone and reclaims the 200 EMA, the next move is likely toward $2.40–$2.50, where the next major resistance lies. On the downside, $1.80–$1.85 remains the key support zone. Holding this level keeps the bullish structure intact.

RENDER Price Outlook

Render has transitioned from accumulation into a high-conviction expansion phase, supported by both fundamental growth and derivatives strength. As long as momentum holds and key levels are sustained, Render price remains positioned for a move toward $2.50, with further upside dependent on continuation of the AI-driven narrative.

Solana Price Rally Gains Momentum: Can SOL Flip $100 Hurdle?

Solana Price Rally Gains Momentum Can SOL Flip $100 Hurdle

The post Solana Price Rally Gains Momentum: Can SOL Flip $100 Hurdle? appeared first on Coinpedia Fintech News

Solana price rally is gaining momentum as the broader crypto rally lifts market sentiment. SOL has surged over 5% in the last 24 hours, reclaiming ground near the $85 level and drawing renewed attention from traders. With Bitcoin pushing higher and market sentiment flipping decisively risk-on, capital is rotating into high-beta altcoins, and Solana is emerging as a clear leader in this phase.

But beyond the price rally, the underlying signals suggest something bigger is building. Is this the early stage of a breakout move toward $100?

Derivatives Data Signals Aggressive Bullish Positioning

The real story behind Solana’s rally lies in the derivatives market. Data shows futures volume has exploded 69% to $15.82 billion, while open interest has climbed above $5.12 billion, indicating fresh capital entering the market. At the same time, options volume has jumped over 44%, reinforcing expectations of increased volatility ahead.

SOL derivatives data

When rising price is accompanied by expanding open interest, it typically reflects new long positioning, not just short covering. In simple terms, traders are not exiting, they are adding exposure, betting on further upside. Equally important, funding rates remain relatively balanced, suggesting the rally is not yet crowded or overheated. This keeps the door open for continuation.

Solana Price Prediction: Cup-and-handle Pattern in focus

Zooming out, Solana’s higher timeframe structure is beginning to attract institutional attention. The monthly chart reveals a large cup formation, built over an extended accumulation phase. The current SOL price action is unfolding within a controlled downward channel, forming the handle just below key resistance.

SOL price

This is a classic bullish continuation pattern. Historically, such setups represent consolidation before expansion. A confirmed breakout from this structure would signal a transition from recovery into a full trend continuation phase, often accompanied by strong momentum. In this context, Solana’s current move is not just a bounce, it is potentially a setup for a much larger breakout cycle.

Key levels to watch: $90 breakout could unlock $100

Solana is now approaching a decisive technical zone. The immediate resistance sits at $90–$92, a region that has repeatedly capped upside attempts. A strong breakout above this level would confirm bullish control and likely trigger accelerated momentum toward the $100 psychological barrier.

Solana price prediction

On the downside, $78–$80 remains a critical support band. Holding above this zone is essential to maintain the current bullish structure. Any breakdown below it would weaken momentum and delay the breakout scenario.

SOL Price Outlook: Momentum Builds As Breakout Pressure Rises

Solana is entering a high-conviction phase where price action, derivatives expansion, and macro structure are aligning, a combination that often precedes strong directional moves. The sharp rise in volume and open interest suggests this is early-stage positioning, not late-cycle exhaustion. Traders are preparing, not exiting. If the broader crypto rally sustains and SOL clears the $90 resistance, the move toward $100 could unfold rapidly, driven by both spot demand and leveraged positioning.

Crypto Rally Returns: Bitcoin Price Near $72K: What’s Driving the Move?

Crypto Rally Returns Bitcoin Price Near $72K What’s Driving the Move

The post Crypto Rally Returns: Bitcoin Price Near $72K: What’s Driving the Move? appeared first on Coinpedia Fintech News

The crypto rally is accelerating, with Bitcoin price sprinting toward $72,000 as markets react to a sharp improvement in global sentiment following ceasefire developments. This shift has triggered a risk-on wave across financial markets, with crypto leading the move. Unlike previous rebounds, this rally is showing clear strength and follow-through, not hesitation.

But what exactly is driving this crypto rally?

What’s Driving the Crypto Rally? Ceasefire Trigger Sparks Market-Wide Reaction

The primary catalyst behind today’s crypto rally is a major geopolitical development. A 2-week ceasefire agreement between the US, Iran, and Israel has significantly eased global uncertainty, particularly around the Strait of Hormuz, a critical oil supply route. This development has triggered a broad risk-on sentiment shift, pushing capital back into high-risk assets like crypto. The market reaction was immediate.

  • Bitcoin surged above $70K
  • Ethereum moved past $2,200

Both marking multi-week highs Adding to this, social data shows a clear shift in sentiment. For only the second time since late February, more than 1% of total crypto discussions are focused on the conflict ending, a strong signal that market participants are turning optimistic.

This combination of macro relief + sentiment spike + technical breakout is what is driving the current crypto rally, not speculation, but a clear catalyst-backed move.

Bitcoin Price Prediction: Can BTC Smash $75K?

Bitcoin price is rallying strongly today, gaining over 4% to trade near $71,600–$72,000, as bulls step in aggressively and reclaim control of the trend. The move above the $70,000 level is critical. This zone previously acted as resistance, and its successful reclaim now flips it into strong support, signaling a shift from consolidation into expansion. BTC price is also holding near intraday highs, indicating continued buying pressure rather than profit-taking.

Bitcoin price prediction

Structurally, Bitcoin is now forming a higher high, confirming bullish continuation and strengthening the case for further upside. As long as BTC holds above $70K, the rally is likely to extend toward $74K–$76K. A clean breakout above $72K could accelerate momentum, while a drop below $69K would be the first sign of short-term weakness.

Ethereum Price Prediction: What’s Next for ETH?

Ethereum is gaining momentum, rising over 6% to trade near $2,230, as the crypto rally expands across major assets. The reclaim of the $2,100–$2,200 range marks a key structural shift. This zone had capped price during consolidation, and its breakout now confirms bullish continuation, with ETH holding steady above resistance-turned-support. Unlike volatile spikes, Ethereum’s move is showing controlled expansion, suggesting sustained demand and growing market confidence.

Ethereum price prediction

Holding above $2,100 keeps Ethereum positioned for a move toward $2,300–$2,500. A break below $2,050 would weaken the short-term structure, but current momentum favors upside continuation.

XRP Price Spikes 5%: Can It Reach $2?

XRP price is moving higher today, gaining around 5% to trade near $1.38, as bullish momentum builds across large-cap altcoins. The breakout above $1.30 is a key development. This level acted as a consolidation ceiling, and its reclaim confirms a shift into bullish structure, with XRP now forming higher lows and sustaining upward pressure.

XRP price prediction

XRP price is also holding above breakout levels, indicating acceptance rather than rejection, which typically supports continuation moves. As long as XRP holds above $1.30, the rally could extend toward $1.75–$2.00. A move below $1.25 would be the first signal of weakening momentum, but current structure remains firmly bullish.

Outlook: What’s Next for the Crypto Market?

The crypto market is shifting into a clear expansion phase, with momentum building across Bitcoin, Ethereum, and XRP. As long as Bitcoin holds above $70K, the broader crypto rally is likely to extend, with upside targets opening higher across majors. Near-term, the focus remains on breakout continuation, not reversal. Any pullbacks are likely to be viewed as buy-on-dip opportunities, rather than trend weakness. In short: momentum favors bulls, and the crypto rally still has room to run.

Zcash (ZEC) Price Prediction 2026, 2027–2030: Privacy Coin Growth Ahead

Zcash (ZEC) Price Prediction

The post Zcash (ZEC) Price Prediction 2026, 2027–2030: Privacy Coin Growth Ahead appeared first on Coinpedia Fintech News

Story Highlights

  • The live price of the Zcash token is  $ 322.50605034
  • Zcash price could see a potential upside toward $850 by the end of 2026.
  • ZEC’s long-term expansion scenario points toward $7000 by 2030.

While the broader crypto market remains selective with capital deployment, Zcash (ZEC) is beginning to show structural resilience near the $260 level. Unlike high-beta altcoins chasing speculative momentum, ZEC’s movement is increasingly tied to a deeper theme, digital privacy infrastructure. As surveillance debates intensify globally and compliance frameworks evolve, privacy-centric protocols often move from regulatory uncertainty to strategic importance. Zcash, with its zero-knowledge proof architecture, sits at the center of that discussion.

ZEC has transitioned from prolonged decline into base-building behavior, compressing volatility while defending macro support. The convergence of narrative relevance and structural stabilization is gradually reshaping sentiment around ZEC. With March approaching, traders are watching closely to determine whether this consolidation phase evolves into breakout expansion.

Zcash Price Today

Cryptocurrency Zcash
Token ZEC
Price $322.5061 up 22.08%
Market Cap$ 5,359,325,697.07
24h Volume$ 897,476,598.0350
Circulating Supply16,617,752.4155
Total Supply16,617,812.9155
All-Time High$ 5,941.7998 on 29 October 2016
All-Time Low$ 15.9691 on 05 July 2024

Zcash (ZEC) Price Prediction for April 2026 

Zcash is entering April with momentum intact, but continuation now depends on clearing a key resistance band. After holding above the $250–$270 support zone, ZEC has shifted into a higher range, signaling sustained buying interest. The structure remains constructive, with higher lows forming as price compresses below resistance.

The immediate barrier stands at $300–$320. This zone is critical, not just as resistance, but as the trigger for the next leg higher. A decisive breakout could accelerate price toward the $380–$450 range in the near term.

In this setup, Zcash in April may extend toward $380–$450, provided the $320 resistance is reclaimed with strength. However, rejection at this level may result in short-term pullbacks, with $220–$240 acting as the next support band.

Coinpedia’s Zcash (ZEC) Price Prediction 2026

Zcash’s 2026 outlook is shaping around expansion, but confirmation will come through levels, not narrative. The token has already moved out of its previous consolidation range and is now building a higher structure. The focus shifts to whether this momentum can sustain through key resistance zones and attract continued demand.

Zcash price prediction

The first confirmation lies at $320, followed by a broader breakout zone between $450 and $600. Clearing these levels would signal a transition into a full expansion phase. On the fundamental side, Zcash’s positioning as a privacy-centric asset places it in a unique segment of the market. With increasing attention on financial privacy and regulatory oversight, demand for privacy-focused networks could act as a structural tailwind. If momentum and narrative align, ZEC could advance toward the $600–$850 range over the course of 2026.

That said, failure to maintain higher lows or a breakdown below $220 would weaken the structure and delay this trajectory.

Recent Catalysts for Zcash (ZEC)

Privacy narrative regains momentum, driving sharp price spikes as demand for censorship-resistant assets increases.

Developer reshuffle creates short-term uncertainty, adding volatility despite strong underlying interest.

Funding and ecosystem support strengthen outlook, signaling continued confidence in Zcash’s long-term growth.

ZEC Price Prediction 2026 – 2030

YearPotential Low ($)Potential Average ($Potential High ($)
2026480650850
20277209801200
2028100015002000
2029180030004500
2030310055007000

Zcash (ZEC) Price Forecast 2026

In 2026, the Zcash price could project a low price of $480, an average price of $650, and a high of $850.

ZEC Price Prediction 2027

As per the Zcash Price Prediction 2027, Zcash may see a potential low price of $720 The potential high for Zcash price in 2027 is estimated to reach $1200.

Zcash (ZEC) Price Prediction 2028

In 2028, the Zcash price is forecasted to potentially reach a low price of $1000, and a high price of $2000.

ZEC Price Targets 2029

Thereafter, the Zcash  (Zcash) price for the year 2029 could range between $1800 and $4500.

Zcash (ZEC) Price Prediction 2028

Finally, in 2030, the price of Zcash is predicted to maintain a steady positive. It may trade between $3100 and $7000.

Zcash Price Prediction 2031, 2032, 2033, 2040, 2050

The long-term projection assumes Zcash sustains relevance in enterprise blockchain use cases, with growth moderating over time as the asset matures.

YearPotential Low ($)Potential Average ($)Potential High ($)
2031520065008500
20326800780010000
203377001000011500
2040150002200025000
2050300004000050000

Zcash (ZEC) Price Prediction: Market Analysis?

Year202620272030
Changelly$610$720$1500
CoinCodex$581$690$1400
WalletInvestor$740$800$2000
Never Miss a Beat in the Crypto World!

Stay ahead with breaking news, expert analysis, and real-time updates on the latest trends in Bitcoin, altcoins, DeFi, NFTs, and more.

FAQs

What is Zcash (ZEC) and how does it work?

Zcash is a privacy-focused cryptocurrency using zk-SNARK technology to keep transactions private while still secure on the blockchain.

What is the ZEC price prediction for 2026?

ZEC price prediction for 2026 ranges between $480 and $850, with $650 as a projected average if bullish momentum sustains.

How much will Zcash be worth in 2030?

Zcash could trade between $3,100 and $7,000 by 2030 if privacy adoption expands and the broader crypto market enters a strong cycle.

How high can ZEC price go by 2040?

By 2040, ZEC could potentially reach $25,000 in a mature adoption scenario, with projected averages near $22,000.

What factors influence ZEC’s price growth?

ZEC’s price depends on privacy demand, zk-upgrades, regulatory trends, institutional interest, and adoption of shielded transactions.

Is Zcash a good investment?

Zcash can be a good investment for those seeking privacy-focused crypto, but consider market volatility and technology adoption before investing.

Does ZEC have a future?

Yes, ZEC has a strong future potential as global interest in privacy tech and zk-proof systems grows in finance and blockchain.

Filecoin Price Prediction 2026,2027-2030: Is a Trend Reversal Ahead for FIL?

Filecoin Price Prediction

The post Filecoin Price Prediction 2026,2027-2030: Is a Trend Reversal Ahead for FIL? appeared first on Coinpedia Fintech News

Story Highlights

  • The live price of Filecoin crypto is  $ 0.90839708
  • Price predictions for 2026 range from $5.00 to $10.00.
  • Long term forecasts suggest FIL price may hit $50.00 by the end of 2030.

Filecoin (FIL) is a decentralized storage network that enables users to store and retrieve data securely without relying on centralized cloud providers. FIL has been trading close to its long-term support zones after prolonged corrective phases. Throughout 2025, the token remained largely range-bound, signaling seller exhaustion at lower levels. 

This extended consolidation has helped FIL to rebound from the support zone of $1.20. Connecting fundamentals with price action, Filecoin’s steady utility-driven narrative combined with a base-forming chart structure positions the asset for a potential trend transition. 

As FIL moves into 2026, the key question remains whether improving on-chain usage and network relevance can translate into sustained upside momentum, shaping the broader price prediction outlook ahead.

Filecoin Price Today

Cryptocurrency Filecoin
Token FIL
Price $0.9084 up 5.63%
Market Cap$ 698,820,676.22
24h Volume$ 137,358,733.3313
Circulating Supply769,289,872.00
Total Supply1,957,909,939.00
All-Time High$ 237.2418 on 01 April 2021
All-Time Low$ 0.6336 on 10 October 2025

Filecoin (FIL) Price Prediction April 2026

Filecoin’s price action is beginning to shift from persistent weakness toward early stabilization, but a confirmed recovery is still developing. After a steady decline through 2025, FIL has settled into a narrow range near the $0.80–$0.90 region, where downside pressure appears to be losing intensity. This phase reflects a market that is no longer trending lower, but has yet to establish upward momentum.

At present, price remains capped below the $1.00–$1.20 resistance band, a level that has repeatedly limited recovery attempts. This zone now acts as the immediate trigger point for any change in direction. A decisive move above $1.20 could initiate a recovery sequence, potentially lifting FIL toward the $1.50–$2.00 range, with additional upside toward $2.50 if momentum sustains.

Within this setup, Filecoin in April may move toward the $1.50–$2.00 range, conditional on a breakout above $1.20. On the downside, continued rejection at resistance would likely keep price contained, with the $0.70 level acting as the key support floor.

Coinpedia’s Filecoin (FIL) Price Prediction 2026

Filecoin’s broader trajectory in 2026 points toward a rebuilding phase, where price is attempting to transition from prolonged weakness into a more constructive structure.

Following its earlier highs, FIL experienced an extended period of decline, driven by fading momentum and consistent supply pressure. This phase pushed the asset into lower valuation zones, where it is now attempting to establish a base. The current structure suggests that the market is stabilizing, but a sustained uptrend will depend on reclaiming higher resistance levels. The first meaningful threshold remains at $1.20, followed by more significant barriers near $2.00 and $2.50.

FIL price prediction

A move through these levels would indicate strengthening demand and a shift in market positioning, allowing price to gradually expand into higher ranges. Filecoin continues to build its narrative around decentralized storage and data infrastructure. Growth in data demand, network utilization, or enterprise-level integrations could act as key drivers for renewed interest.

If these developments align with improving market conditions, FIL could reprice toward the $3 to $10 range over the course of 2026. However, this outcome would require sustained momentum and progressive confirmation across resistance levels. Until then, Filecoin remains in a recovery phase, with the $0.70 level acting as a critical support base.

FIL Price On-chain Outlook

Filecoin’s on-chain metrics continue to show steady structural improvement. One of the most talked-about developments is the launch and expansion of Filecoin OnChain Cloud (FOC), a major network upgrade designed to enhance on-chain storage usage and accessibility. 

FOC’s deployment marks a shift towards more practical decentralized storage use cases, which could stimulate real demand.

Additionally, whale accumulation activity which surged late in 2025 alongside the rising token holding by large investors may fuel confidence ahead.

FIL Crypto Price Prediction 2026 – 2030

YearPotential Low ($)Potential Average ($Potential High ($)
20263.006.0010.00
20275.208.8013.50
20289.0012.5018.00
202911.0017.0030.00
203016.0025.0050.00

Filecoin Crypto Price Prediction 2026

The FIL price range in 2026 is expected to be between $3.00 and $10.00.

Filecoin Price Prediction 2027

Filecoin (FIL) price range can be between $5.20 to $13.50 during the year 2027. 

FIL Price Prediction 2028

The FIL Network price for 2028 is anticipated to lie within the range of $9.00 to $18.00.

FIL Coin Price Prediction 2029

Thereafter, the FIL price for the year 2029 could range between $11 and $30.00.

Filecoin Price Prediction 2030

Finally, in 2030, the price of FIL is predicted to maintain a steady positive. It may trade between $16.00 and $50.00.

FIL Price Prediction 2031, 2032, 2033, 2040, 2050

Based on the historic market sentiments and trend analysis of the largest cryptocurrency by market capitalization, here are the possible FIL price targets for the longer time frames.

YearPotential Low ($)Potential Average ($)Potential High ($)
203155.0062.0072.00
203262.074.0090.00
203370.0088.00110.00
2040140.00200.00300.00
2050320.00350.00400.00

FIL Price Prediction: Market Analysis?

Year202620272030
Changelly$15.80$24.50$52.10
CoinCodex$11.90$17.85$29.45
Binance$13.40$21.10$44.85
Never Miss a Beat in the Crypto World!

Stay ahead with breaking news, expert analysis, and real-time updates on the latest trends in Bitcoin, altcoins, DeFi, NFTs, and more.

FAQs

What is Filecoin (FIL) and what does it do?

Filecoin is a decentralized storage network where users rent out unused space and store data securely without relying on centralized cloud providers.

What is the Filecoin price prediction for 2026?

Analysts expect Filecoin to trade between $5 and $10 in 2026, supported by network adoption, improving sentiment, and a long base near key support.

Can Filecoin reach $50 by 2030?

Long-term forecasts suggest FIL could approach $50 by 2030 if decentralized storage demand grows and Filecoin strengthens real-world usage.

Is Filecoin a good long-term investment?

Filecoin’s value depends on adoption of decentralized storage. Strong fundamentals and steady utility make it a project to watch long term.

AAVE Price Falls Below $100: Is a Bigger Crash Now Unfolding?

Aave Liquidation Shock $27M Wiped Out After wstETH Oracle Glitch

The post AAVE Price Falls Below $100: Is a Bigger Crash Now Unfolding? appeared first on Coinpedia Fintech News

AAVE price slips below the $100 level, dropping over 10% today, after a fresh bearish breakdown, as rising exchange reserves and recent developments around Chaos Labs’ exit add pressure to the outlook.  The combination of increasing supply on exchanges and weakening price structure points to growing sell-side intent rather than stabilization. Is this the early stage of a bigger crash for AAVE?

Exchange Reserves Surge as Distribution Signal Emerge 

On-chain data is increasingly pointing toward distribution.AAVE exchange reserves have climbed from 2.07 million to 2.23 million tokens, marking a clear reversal from the prior accumulation phase. A significant portion of this supply, around 1.63 million AAVE, is held on Binance, highlighting where liquidity is concentrating.

AAVE on-chain

This shift suggests that more tokens are being positioned for potential selling, rather than being held off-exchange. The move above the 90-day average in reserves further reinforces that the market is transitioning into a supply-heavy environment.

Chaos Labs Exit Deepens Sentiment Concerns Around AAVE

Beyond price and on-chain signals, recent developments within the Aave ecosystem are also influencing sentiment. Reports around the exit of Chaos Labs, along with earlier contributor departures, have raised concerns regarding governance continuity and long-term protocol direction. 

🚨JUST IN: CHAOS LABS TERMINATES AAVE ENGAGEMENT AFTER 3 YEARS DUE TO RISK MANAGEMENT@ChaosLabs announced Monday that it is proactively terminating its engagement with DeFi’s largest lending protocol @aave, citing a fundamental disagreement over how risk should be managed.… pic.twitter.com/pDeshahsx4

— BSCN (@BSCNews) April 6, 2026

While not immediately reflected in fundamentals, such developments tend to impact market confidence, particularly in DeFi ecosystems. This shift in sentiment appears to be aligning with on-chain behavior, where participants are reducing exposure rather than accumulating, adding to downside pressure.

AAVE Price Prediction: Is More Downside Ahead?

AAVE’s price action is now aligned with a bearish continuation framework. The loss of the $95–$100 support zone marks a structural shift, with price now forming lower highs and lower lows. Attempts to reclaim this region have failed, turning it into a resistance zone rather than support. This type of behaviour typically signals that the token is not consolidating, but repricing lower within a continuation trend.

AAVE price prediction

With price structure weakening, focus now shifts to the next key levels. Immediate support sits near $85, which is currently being tested. A sustained breakdown below this zone could open the path toward $55–$70, where the next major liquidity pocket is positioned. On the upside, $100 remains the critical invalidation level. A strong reclaim above this level would be required to shift momentum back toward buyers. Until then, the token continues to trade with a downside bias.

What’s Next for AAVE?

AAVE’s token current setup reflects alignment between rising supply, weakening sentiment, and bearish price structure. As long as AAVE price remains below $95–$100, the probability of further downside toward $55–$70 remains elevated. The increase in exchange reserves suggests that sell pressure has not yet fully played out, while the failure to reclaim key levels points to limited buyer conviction.

Polkadot Price Crash Alert: : Will $1.20 Support Collapse Next?

DOT price

The post Polkadot Price Crash Alert: : Will $1.20 Support Collapse Next? appeared first on Coinpedia Fintech News

Polkadot is flashing warning signs as bearish pressure intensifies, with price slipping sharply after a clean rejection at a key resistance zone. The latest structure suggests this isn’t just a pullback, it could be the start of a deeper downside move toward critical liquidity levels.

With sellers firmly in control and market positioning turning negative, the big question now is clear: Is the Polkadot price heading toward a breakdown below $1.20?

Shorts Dominate as Sentiment Turns Bearish

Market data is increasingly aligning with the downside narrative. Latest derivatives data shows a clear imbalance, with 32.82 million short positions versus 17.80 million longs, highlighting strong bearish conviction. At the same time, net delta remains negative, confirming that sell-side pressure continues to dominate order flow.

DOT net delta

This imbalance suggests that traders are actively positioning for a continuation lower, rather than preparing for a reversal. The absence of aggressive long buildup further reduces the likelihood of a short squeeze in the near term.

DOT Price Confirms Breakdown Setup At Resistance

Polkadot remains firmly within a bearish continuation framework. DOT price recently tapped into a higher timeframe premium zone near $1.30–$1.32, aligning with a weekly breaker level, before sharply rejecting. This move swept buy-side liquidity above the previous weekly high, a classic signal of distribution before downside expansion.

With the higher timeframe continuing to print lower highs, the broader structure remains bearish. Current price action suggests that DOT is now rotating toward sell-side liquidity below recent lows, reinforcing the continuation thesis.

Key Levels To Watch

Polkadot is approaching a critical range where the next move could accelerate quickly. Immediate support is located at $1.20, followed by $1.17, both acting as short-term liquidity zones. A decisive breakdown below these levels would likely open the door toward $1.10, which stands as the next major downside target.

Polkadot price

On the upside, $1.32 remains the invalidation level. A sustained move above this zone would disrupt the bearish structure and signal a potential shift in momentum. Until then, DOT price action continues to favor downside expansion over recovery.

Outlook: Breakdown risk rising fast

Polkadot is entering a phase where structure and positioning are fully aligned to the downside. As long as the price remains capped below $1.30–$1.32, the probability of a breakdown toward $1.20 and potentially $1.10 continues to increase.

Any short-term bounce is likely to be corrective, unless bulls reclaim resistance with strong conviction. For now, DOT remains in a high-risk zone, where a confirmed break below support could trigger accelerated downside continuation.

Dogecoin Price Tests Long-Term Support: Will DOGE Repeat History?

Dogecoin Approaches Multi-Year Compression Breakout—Is a Major Move Brewing

The post Dogecoin Price Tests Long-Term Support: Will DOGE Repeat History? appeared first on Coinpedia Fintech News

Dogecoin is back at a level that has historically preceded its biggest moves. After weeks of consolidation, DOGE is now testing its long-term ascending channel support, a zone that has repeatedly acted as a launchpad for explosive rallies in previous cycles. Unlike typical breakdown scenarios, price continues to hold structure, signaling that selling pressure is fading rather than accelerating.

At the same time, broader market conditions are beginning to stabilize, creating an environment where high-beta assets like DOGE tend to react aggressively. So, is Dogecoin quietly setting up for another cycle-defining rally, or is this support about to give way?

Accumulation Builds As Exchange Outflows Dominate Market Behaviour

On-chain data is beginning to confirm a shift in market dynamics. Recent spot flow trends show persistent net outflows, indicating that DOGE is steadily moving off exchanges. This behavior typically reflects accumulation rather than distribution, as investors withdraw assets instead of preparing to sell.

Doge on-chain data

Importantly, this trend is unfolding during a phase of price compression, suggesting that participants are positioning early ahead of a potential move, rather than reacting after confirmation.

Combined with declining sell-side pressure, this points toward a market transitioning into absorption, a phase that often precedes expansion.

DOGE tests macro support as structure mirrors previous rally setups

Dogecoin continues to respect its long-term ascending channel, a defining feature of its macro price behavior. DOGE price is now positioned at the lower boundary of this channel, a zone that has historically triggered strong impulsive rallies. Previous interactions with this level have consistently marked cycle lows before expansion phases, reinforcing its importance.

Dogecoin price analysis

Momentum indicators are also approaching reset levels, with early signs of bullish crossover formations beginning to emerge, another pattern commonly observed near market bottoms. This alignment between structure and momentum reset suggests that DOGE may be entering a high-probability bounce zone, rather than a breakdown phase.

Key levels define DOGE’s next move

Dogecoin is approaching a critical decision point where structure will either hold, or fail. The $0.085–$0.090 range remains the immediate support, aligning with both horizontal demand and channel structure. Holding this level keeps the broader bullish framework intact. On the upside, $0.10–$0.105 remains the key resistance that must be reclaimed to confirm momentum.

Dogecoin price prediction

A breakout above this region could open the path toward $0.12–$0.14, with further upside potential if market strength continues. Conversely, a breakdown below $0.085 would weaken the setup and expose $0.075 as the next downside level. At present, price action continues to favor support holding rather than structural failure.

Outlook: DOGE at a make-or-break level

Dogecoin is now trading at a structurally critical zone where the next move could define its near-term trajectory. As long as the $0.085–$0.090 support holds, the broader setup continues to favor a rebound scenario, particularly with accumulation signals building and macro structure intact. A confirmed move above $0.105 would strengthen bullish momentum and open the path toward $0.12–$0.14. However, failure to hold support would weaken the structure and shift focus toward $0.075.

Arbitrum (ARB) Price Prediction 2026, 2027 – 2030: Will ARB Hit $6 by 2030?

Arbitrum Price Prediction

The post Arbitrum (ARB) Price Prediction 2026, 2027 – 2030: Will ARB Hit $6 by 2030? appeared first on Coinpedia Fintech News

Story Highlights

  • The live price of the ARB token is $ 0.0935.
  • Price predictions for 2026 range from $0.70 to $1.20.
  • ARB could extend toward $6 by 2030, if recovery structure holds.

Arbitrum (ARB), one of the leading Layer-2 scaling solutions on Ethereum, is currently navigating a phase where strong ecosystem relevance contrasts with prolonged price weakness. While the network continues to play a key role in DeFi and Layer-2 infrastructure, its price action has remained under sustained pressure.

Following an extended downtrend, ARB is now stabilizing near lower demand zones, suggesting that selling momentum may be gradually easing. However, the absence of strong upside movement indicates that the market remains in a transitional phase rather than a confirmed recovery.

This creates a critical question: is Arbitrum forming a long-term base after capitulation, or does the structure still reflect weak demand? With 2026 already underway, attention now shifts to whether ARB can reclaim key resistance levels and transition into a recovery phase. Read on as we break down Arbitrum’s April outlook and full-year price trajectory.

Arbitrum Price Today

Cryptocurrency Arbitrum
Token ARB
Price $0.0935 down -2.03%
Market Cap$ 564,658,517.71
24h Volume$ 73,355,249.8390
Circulating Supply6,040,824,145.00
Total Supply10,000,000,000.00
All-Time High$ 2.3975 on 12 January 2024
All-Time Low$ 0.0886 on 23 February 2026

Arbitrum (ARB) Price Prediction for April 2026

As we move through early 2026, Arbitrum’s price action reflects a market transitioning from a prolonged downtrend into a stabilization phase. After consistent downside pressure, ARB found support near the $0.08–$0.10 demand zone, where selling momentum has started to ease. Since then, price has been consolidating, indicating early signs of base formation. 

Currently, ARB is trading just below a key resistance zone near $0.10–$0.12, which remains critical for any shift in structure. A sustained move above this level could trigger a recovery toward the $0.15–$0.18 range, with further upside toward $0.20 if momentum strengthens.

In this context, Arbitrum in April may reach the $0.15–$0.18 range, provided resistance is reclaimed. However, failure to break higher may keep ARB range-bound, with downside risk toward $0.06 if the $0.08 support fails.

Coinpedia’s Arbitrum (ARB) Price Prediction 2026

The broader outlook for Arbitrum in 2026 suggests a market transitioning from a prolonged downtrend into a potential recovery phase, with scope for a significant structural shift if key levels are reclaimed. Following its earlier cycle highs, ARB entered a sustained bearish phase throughout 2025, marked by a descending resistance structure and consistent lower highs. This trend extended into early 2026, eventually pushing the price into a deep value zone where it is now attempting to stabilize.

ARB price prediction

At present, ARB is forming a base near its lower demand region, indicating that downside pressure is gradually weakening. This phase typically reflects early accumulation, where long-term participants begin positioning ahead of a potential trend reversal.

Looking ahead, the primary objective for ARB is to reclaim its immediate resistance near $0.12, followed by stronger structural levels around $0.18 and $0.20. A breakout above these zones would signal a shift in market structure, opening the path for a broader recovery. If this recovery phase gains traction, supported by renewed liquidity, Layer-2 adoption, and ecosystem growth, ARB could gradually move toward the $0.70 to $1.20 range, representing a return toward higher valuation bands seen in previous cycles.

However, such a move would require sustained strength and confirmation across multiple resistance levels. Until then, the asset remains in a rebuilding phase, where failure to hold the $0.08 support could delay recovery and extend consolidation.

Recent Catalysts For Arbitrum (ARB)

Ecosystem development and upgrades continue, reinforcing long-term positioning within Ethereum scaling.
Layer-2 competition intensifies, keeping pressure on Arbitrum despite strong ecosystem presence. DeFi liquidity on Arbitrum remains stable, supporting underlying network activity.

Arbitrum Crypto Price Prediction 2026 – 2030

YearPotential Low ($)Potential Average ($Potential High ($)
20260.701.001.20
20271.002.002.80
20281.402.704.00
20293.004.205.20
20304.605.007.00

Arbitrum Price Forecast 2026

The Arbitrum price range in 2026 is expected to be between $0.70 and $1.20.

ARB Crypto Price Prediction 2027

Arbitrum (ARB) price range can be between $1.70 to $2.80 during the year 2027. 

Arbitrum Coin Price Prediction 2028

In 2028, the Arbitrum price is forecasted to potentially reach a low price of $1.40. and a high price of $4.00.

ARB Price Prediction 2029

Thereafter, the Arbitrum (ARB) price for the year 2029 could range between $3.00  and $5.20.

Arbitrum(ARB) Price Prediction 2030

Finally, in 2030, the price of Arbitrum is predicted to remain steadily positive. It may trade between $4.60 and $7.00.

Arbitrum Price Prediction 2031, 2032, 2033, 2040, 2050

Based on the historic data and trend analysis of the cryptocurrency along with the market sentiments, here are the possible Arbitrum price targets for the longer time frames.

YearPotential Low ($)Potential Average ($)Potential High ($)
20314.005.808.00
20325.007.309.80
20336.508.2011.00
20409.0013.0020.00
205013.0022.0032.00

Arbitrum (ARB) Price Prediction: Market Analysis?

Year202620272030
Changelly$1.20$2.40$6.00
DigitalCoinPrice$1.90$2.60$5.70
WalletInvestor$25.60$1.00$5.20
Never Miss a Beat in the Crypto World!

Stay ahead with breaking news, expert analysis, and real-time updates on the latest trends in Bitcoin, altcoins, DeFi, NFTs, and more.

FAQs

What is the Arbitrum (ARB) price prediction for 2026?

In 2026, ARB is expected to trade between $0.70 and $1.20 if it holds key support and confirms a long-term recovery trend.

What is the ARB price prediction for 2030?

ARB price prediction for 2030 suggests a potential range between $4.60 and $7.00, assuming sustained adoption and market growth.

What is the Arbitrum price prediction for 2040?

Arbitrum price prediction for 2040 indicates a possible range of $9 to $20 if Ethereum scaling demand remains strong long term.

What is the Arbitrum price prediction for 2050?

Arbitrum price prediction for 2040 indicates a possible range of $9 to $20 if Ethereum scaling demand remains strong long term.

What could impact Arbitrum’s price the most?

ARB price is influenced by Ethereum activity, Layer-2 adoption, overall crypto market trends, and broader investor sentiment.

Is Arbitrum a good long-term investment?

Arbitrum shows long-term potential due to Ethereum adoption, but ARB remains volatile and best suited for investors with risk tolerance.

Polygon (MATIC) Price Prediction 2026, 2027 – 2030: Will MATIC Price Surge to $1?

Polygon (MATIC) Price Prediction 2026, 2027 - 2030

The post Polygon (MATIC) Price Prediction 2026, 2027 – 2030: Will MATIC Price Surge to $1? appeared first on Coinpedia Fintech News

Story Highlights

  • The live price of the Polygon coin is  $ 0.21819891.
  • POL price prediction for 2026 suggests potential highs of $0.7548.
  • Long-term forecasts indicate POL could reach $4.94 by 2030.

Polygon (POL) remains one of the most recognized scaling ecosystems built around Ethereum. Designed to improve transaction speed and reduce fees, the network has grown into a multi-layer infrastructure supporting decentralized finance, gaming platforms, and enterprise blockchain applications.

The transition from MATIC to POL reflects Polygon’s broader ambition to build a multi-chain ecosystem, where the token supports multiple networks within the Polygon architecture. As Ethereum continues expanding its ecosystem, scaling solutions such as Polygon are expected to play a significant role in supporting decentralized applications. At present, POL is trading near $0.1005, reflecting the broader correction seen across Layer-2 tokens

However, Polygon continues to maintain strong developer activity and partnerships across Web3 sectors, which could support long-term growth. As blockchain adoption expands and demand for scalable networks increases, Polygon’s infrastructure could remain a critical component of the decentralized ecosystem.

Polygon Price Today

Cryptocurrency Polygon
Token MATIC
Price $0.2182 up 2.88%
Market Cap$ 402,374,198.74
24h Volume$ 1,217,344.7306
Circulating Supply0.00
Total Supply10,000,000,000.00
All-Time High$ 2.92 on 27 December 2021
All-Time Low$ 0.0030 on 10 May 2019

Polygon (POL) Price Prediction for April 2026

As we move through early 2026, Polygon’s price action reflects a market that has been under sustained pressure following its previous cycle highs, gradually forming a prolonged downtrend structure. After repeated rejections near the $0.70–$0.80 region in earlier cycles, MATIC entered a corrective phase, marked by lower highs and weakening momentum throughout 2025. This trend has extended into early 2026, pushing the price toward lower valuation zones.

In recent weeks, however, MATIC has begun to stabilize near the $0.08–$0.10 demand zone, where selling pressure appears to be easing. Price action is now compressing within a narrow range, suggesting that the market is attempting to form a base. Currently, MATIC is trading below a key resistance zone near $0.11–$0.13, which aligns with both horizontal resistance and the broader trend structure. A sustained move above this level would be the first indication of recovery, potentially driving the price toward the $0.15–$0.18 range.

In this context, Polygon in April may reach the $0.15–$0.18 range if resistance is reclaimed, with a possible extension toward $0.20 under stronger momentum. However, if the resistance continues to hold, MATIC may remain range-bound. A breakdown below the $0.08 level could push the price toward the $0.06 zone, delaying recovery.

Coinpedia’s Polygon Price Prediction 2026

The broader outlook for Polygon in 2026 suggests a market attempting to transition from a prolonged correction into a potential recovery phase, but confirmation remains limited. Following its strong performance in previous cycles, MATIC has undergone a significant drawdown, forming a descending structure that has persisted into 2026. This indicates that while the long-term narrative remains intact, price has yet to reflect renewed demand.

POL price prediction

At present, the coin is attempting to establish a base near lower demand zones, where downside pressure is gradually stabilizing. This phase is often associated with accumulation, but requires confirmation through breakout above key resistance levels. Looking ahead, the primary resistance lies at $0.50, followed by stronger barriers near $0.7400 and $0.7550. These levels will determine whether MATIC can shift its broader structure.

Polygon’s continued focus on zkEVM scaling solutions, enterprise partnerships, and Layer-2 adoption could act as key catalysts. Any acceleration in ecosystem activity or capital inflows may support a recovery in valuation. If these developments align with technical breakout, MATIC could gradually move toward the $0.75–$0.88 range over time.

However, until resistance levels are reclaimed, the asset remains in a recovery phase rather than a confirmed uptrend. Failure to hold the $0.48 support could extend consolidation and delay upside.

POL On-Chain Analysis

The on-chain landscape for POL is flashing a major recovery signal as the 30-day moving average of Daily Active Addresses (DAA) shows a clear and sustained upward trend in early 2026.

Polgon On Chain

This metric serves as the vital heartbeat of the ecosystem, indicating that organic utility and user engagement are returning to the network at a steady, reliable pace. Unlike temporary spikes that often signal speculative noise, a rising 30-day average suggests a strengthening network effect and a growing demand for blockspace.  For investors, this return of on-chain activity is a fundamental precursor to price appreciation, as it confirms that the ecosystem is not only retaining its base but actively expanding its reach.

Complementing this surge in network activity is a powerful development in supply distribution, specifically within the “whale” and institutional cohorts. Addresses holding between 100,000 and 10 million POL have seen significant growth, signaling a phase of high-conviction accumulation by “smart money.”

Matic On Chain Data

This specific bracket often represents mid-to-large-scale investors who lead market cycles by absorbing supply during consolidation phases. This strategic positioning by larger entities reduces sell-side pressure and creates a robust fundamental floor for the asset. 

When rising active addresses align with such aggressive whale accumulation, it speaks a definitively bullish language for the POL trajectory, suggesting that the most influential market participants are preparing for a major expansion in value.

Polygon Price Prediction 2026 – 2030

YearPotential Low ($)Potential Average ($Potential High ($)
20260.188700.47179$0.7548
20270.301940.754881.20782
20280.483111.207821.93252
20290.772971.932523.09205
20301.236763.092054.94729

Polygon (MATIC) Price Prediction 2026

Anticipating further expansion, MATIC’s potential high for 2026 is projected to be $0.75488, while the potential low is estimated at $0.18870, resulting in an average price of $0.47179.

Polygon Price Prediction 2027

POL crypto can make a potential high of $1.20782 in 2027, with a potential low of $0.30194, leading to an average price of $0.75488.

Polygon Crypto Price Forecast 2028

As the POL price progresses, the potential high price for 2028 is projected to be $1.93252, with a potential low of $0.48311, resulting in an average price of $1.20782.

MATIC Coin Price Projection 2029

Polygon coin price potential high for 2029 could be $3.09205, while a potential low of $0.77297, with an average price of $1.93252.

Polygon Price Prediction 2030

With an established position in the market, POL’s potential high for 2030 is projected to be $4.94729. On the flip side, a potential low of $1.23676 will result in an average price of $3.09205.

Polygon Price Prediction 2031, 2032, 2033, 2040, 2050

The long-term projection assumes Polygon sustains relevance in enterprise blockchain use cases, with growth moderating over time as the asset matures.

YearPotential Low ($)Potential Average ($)Potential High ($)
20312.504.006.00
20323.005.007.20
20334.206.508.50
204014.2024.3035.00
205028.2035.5050.00

Polygon (POL) Price Prediction: Market Analysis?

Year202620272030
Changelly$ 0.50$1.50 $2.90
CoinCodex$0.26$$1.75$3.80
WalletInvestor$0.36$$1.88$2.08
Never Miss a Beat in the Crypto World!

Stay ahead with breaking news, expert analysis, and real-time updates on the latest trends in Bitcoin, altcoins, DeFi, NFTs, and more.

FAQs

Is Polygon (POL) a good long-term investment?

Polygon is considered a strong long-term project due to its Ethereum scaling role, active development, and growing ecosystem, but it still carries market risk.

What is the Polygon (MATIC) price prediction for 2026?

Polygon could reach up to $0.7548 in 2026, depending on market conditions and continued network growth.

How much could Polygon be worth by 2030?

Forecasts suggest POL could reach around $4.94 by 2030 if adoption grows and Polygon strengthens its role in scaling Ethereum.

What could Polygon be worth by 2040?

Long-term projections vary, but sustained adoption and strong ecosystem growth could push POL significantly higher over time.

How high can the Polygon price Go By 2050?

By 2050, POL’s price will depend on global blockchain adoption, but strong infrastructure use could support substantial long-term value.

MATIC
BINANCE

Hyperliquid Price Prediction: Momentum Builds – Is $60 the Next Target?

Hyperliquid (HYPE) flips Cardano

The post Hyperliquid Price Prediction: Momentum Builds – Is $60 the Next Target? appeared first on Coinpedia Fintech News

Hyperliquid price is gaining traction with the broader crypto market rally, rising nearly 4% today while holding firm after a breakout retest. HYPE price is consolidating just below the $45 resistance zone, with no clear rejection, suggesting buyers are absorbing supply and maintaining control.

But can HYPE price break above $45 and push toward a new higher high toward $60? Read our HYPE price prediction below.

Bullish Positioning Strengthens As On-chain and Derivatives Align

Market positioning around HYPE is strengthening as both derivatives and on-chain metrics begin to align in favor of continuation. The long/short ratio remains elevated near 1.47, indicating that long positions are dominating and traders are increasingly positioning for upside. This shift typically reflects growing directional confidence rather than short-term speculation.

HYPE traders

Beyond derivatives, on-chain data reinforces the strength of the setup. Hyperliquid L1 continues to hold $1.65 billion in Total Value Locked (TVL), signaling sustained capital presence within the ecosystem. At the same time, perpetual futures volume has surged to $5.19 billion over the past 24 hours, highlighting strong participation and liquidity depth.

HYPE TVL data

Network activity also remains stable, with DEX volume around $93.7 million and application revenue exceeding $1 million, suggesting that underlying usage is holding steady despite recent consolidation. This convergence between capital inflows, active trading participation, and bullish positioning points toward a structurally supported move, rather than a fragile rally.

HYPE Price Prediction: Is a Rally to $60 Next?

Hyperliquid price continues to maintain a constructive bullish structure following its breakout retest, with no signs of weakness emerging in the current range. The $35–$37 zone is acting as immediate support, where price has consistently found demand. On the upside, the $45 level remains the primary resistance, marking the boundary for the next expansion phase.

Hyperliquid price

HYPE price action is now compressing beneath this resistance, forming a tightening range that reflects building pressure rather than distribution. Importantly, repeated tests of this zone have failed to produce strong downside reactions, indicating that sell-side liquidity is gradually being absorbed. If price manages to secure a decisive breakout above $45, the structure opens the path toward $48–$60, followed by an extended move into the $55–$60 range.

Conversely, a breakdown below $30 would invalidate the immediate bullish setup and expose $25 as the next support level. However, current price behavior continues to favor continuation over rejection.

Final Outlook

HYPE is now entering a phase where both market structure and participation metrics are aligned toward a potential expansion move. The token has successfully held its retest, while liquidity, trading activity, and positioning continue to support the current range. This type of setup typically precedes directional continuation rather than prolonged consolidation. If $45 is reclaimed with confirmation, HYPE token is likely to transition into a higher high structure, reinforcing the current move as a continuation phase within a broader uptrend.

SUI Price Prediction: Can SUI Lead the Next Altcoin Rally?

SUI Coin Price Surges Nearly 12%, Eyes $3.3 in Coming Months

The post SUI Price Prediction: Can SUI Lead the Next Altcoin Rally? appeared first on Coinpedia Fintech News

As broader crypto market conditions begin to stabilize, SUI is quietly shifting its structure, showing early signs of strength after an extended period of downside pressure. The asset is holding firm near key support levels while liquidity metrics improve, with trading volume rising sharply and DeFi activity remaining stable. This combination suggests that selling momentum is fading as demand gradually returns, a dynamic often seen during early accumulation phases.

At the same time, price action has started to compress within a defined range, signaling that volatility is declining while positioning builds beneath the surface. In previous cycles, similar setups have preceded directional expansion moves across altcoins. Does this evolving structure position SUI as one of the early leaders in the next altcoin rally? Read our SUI price prediction below.

Volume and TVL Signal Early Accumulation

SUI’s underlying data is beginning to align with its improving price structure. SUI’s trading volume has surged more than 60% in the past 24 hours, reaching approximately $304 million, indicating renewed market participation. This increase is supported by rising derivatives activity, suggesting that both spot and leveraged traders are returning.

SUI TVL data

At the same time, Total Value Locked (TVL) remains stable near $550–$560 million, reflecting consistent capital presence. This indicates that long-term participants are maintaining exposure rather than exiting positions. Together, these signals point toward a transition from a passive downtrend into a structured accumulation phase.

SUI Price Prediction: SUI Stagnates In Range as Breakout Pressure Builds

SUI price is trading within a defined consolidation range between $0.85 and $0.97, following its prior corrective move. SUI token price continues to hold the $0.85 support zone, with repeated downside attempts being absorbed, indicating sustained buyer interest. On the upside, the $0.97–$1.00 resistance zone remains intact, though weakening with each test. This tightening range reflects ongoing compression, where volatility declines as directional pressure builds. With price now positioned closer to resistance, the setup leans toward a potential upside resolution.

SUI price prediction

A confirmed breakout above $1.00 would likely open the path toward $1.20–$1.35, with further upside toward $1.50–$1.60 if momentum accelerates. On the downside, a loss of $0.85 would expose $0.75–$0.70 as the next support zone.

SUI May Lead Altcoin Rally If Breakout Confirms

SUI’s structure now reflects a convergence of price stability, rising participation, and steady liquidity conditions. The absence of aggressive selling, combined with improving activity, suggests that the market is transitioning toward recovery rather than continuation of the downtrend. If resistance above $1.00 is reclaimed, SUI is likely to act as an early mover in the next altcoin rally ahead.

XRP Price About to Explode? This Setup Says Yes

xrp-news (1)

The post XRP Price About to Explode? This Setup Says Yes appeared first on Coinpedia Fintech News

XRP is extending gains alongside the broader market, but its structure suggests the move may carry further. XRP coin is up roughly 3% on the day, yet continues to hold a compressed range just below resistance, indicating stability rather than a reactive bounce. If this structure holds, XRP appears positioned for continuation, but does this setup now point to a breakout phase?

On-chain Activity Rebounds As Participation Returns

On-chain data is beginning to turn constructive. Active addresses have recorded a notable spike, pointing to renewed user participation after a period of cooling. This shift typically aligns with early-stage demand returning, rather than late-cycle speculation.

XRP on-chain

At the same time, metrics such as MVRV have normalized, suggesting that previous profit-taking pressure has largely cleared, reducing the likelihood of aggressive downside moves. The combination of rising activity and reset positioning indicates that XRP is transitioning from consolidation into a more supportive demand environment, reinforcing the ongoing price stability.

XRP Price Analysis: Is a Major Breakout Rally Next?

XRP price continues to trade within a tight consolidation range between $1.28 and $1.62, following its recent recovery move. XRP price is currently holding near the upper boundary, indicating that buyers remain active despite broader market uncertainty. The structure reflects ongoing compression, with volatility declining as price stabilizes just below resistance. This type of behaviour typically signals accumulation within a defined range, where supply is gradually absorbed before a directional move. Repeated attempts to break above the $1.62 resistance zone have not resulted in sharp rejection, suggesting that sell-side liquidity at this level is thinning. 

XRP price

At the same time, downside remains contained, with $1.28 acting as immediate support, followed by a stronger base near $1.15. As price continues to compress within this narrowing range, the setup is approaching resolution. A confirmed breakout above $1.62 would likely trigger an expansion move toward $1.88–$2.22, where the next liquidity cluster is positioned. On the downside, a rejection could extend consolidation, with a move below $1.58 opening the path toward $1.15 again. At this stage, XRP is not showing distribution, it is holding structure beneath resistance, with conditions increasingly favoring an upside resolution.

XRP Price Outlook: Structure and Activity Align for Potential Breakout

XRP is now showing alignment across price structure and on-chain activity, a combination that typically precedes directional moves. The spike in network participation, reduced selling pressure, and sustained compression beneath resistance suggest that the market is building toward expansion rather than continuation of the range.

While confirmation remains dependent on a breakout above $1.62, the overall setup is constructive. If resistance is cleared, XRP is likely to transition into a momentum-driven move, supporting the view that the current structure is not a pause, but preparation for expansion.

Ripple (XRP) Price Prediction 2026, 2027-2030: Will XRP Reach $5?

Ripple (XRP) Price Prediction

The post Ripple (XRP) Price Prediction 2026, 2027-2030: Will XRP Reach $5? appeared first on Coinpedia Fintech News

Story Highlights

  • The live price of the XRP is  $ 1.34331660.
  • XRP holds a strong demand zone at $1.30–$1.40. If support remains intact, the token could shift from consolidation to recovery as broader crypto market momentum builds..
  • Long-term forecasts suggest XRP could reach $5–$6 by 2026 and potentially $18 by 2030, driven by institutional adoption, Ripple partnerships, and global payment integration

Ripple (XRP) Ripple’s XRP remains one of the most closely watched assets in the crypto market, largely due to its strong positioning in the cross-border payments sector and the continued expansion of Ripple’s financial infrastructure. Over the years, Ripple has focused on building partnerships with banks and payment providers to streamline international settlements through blockchain technology. XRP’s long-term outlook continues to revolve around global payment integration, institutional partnerships, and the adoption of RippleNet and On-Demand Liquidity solutions. These developments could gradually strengthen XRP’s role as a bridge asset for international payments.

XRP price structure around $1.30–$1.40 has emerged as an important demand zone where buyers have shown consistent interest. If this area continues to hold, the market could gradually shift from consolidation to recovery. With the broader crypto market entering another potential expansion phase, XRP remains positioned as one of the major altcoins that could benefit from renewed institutional and retail participation. Now, making this the most ideal time for XRP price prediction 2026-2030 to be in more focus. Read this to know in depth what’s coming next in XRP.

XRP Price Today

Cryptocurrency XRP
Token XRP
Price $1.3433 up 3.50%
Market Cap$ 82,487,069,990.02
24h Volume$ 1,878,776,946.0370
Circulating Supply61,405,531,717.00
Total Supply99,985,687,636.00
All-Time High$ 3.8419 on 04 January 2018
All-Time Low$ 0.0028 on 07 July 2014

XRP Price Prediction April 2026

As we move through early 2026, XRP’s price action reflects a market that has been under sustained pressure since its previous cycle highs, forming a clear descending structure over the past few months. After facing repeated rejection near the $2.80–$3.00 region, the asset entered a corrective phase, characterized by a series of lower highs and a well-defined descending channel. This structure remained intact into Q1 2026, consistently pushing the price toward lower support levels.

By February, XRP tested the lower boundary of this channel, finding support near the $1.20–$1.30 demand zone. Since then, price action has begun to stabilize, with volatility compressing as sellers show signs of exhaustion. Currently, XRP is trading just below a descending resistance trendline, placing it at a critical juncture. The immediate hurdle lies at the $1.40–$1.50 zone. A successful breakout above this level could indicate a short-term bottom, potentially driving the price toward $1.80 and then $2.20.

In this context, XRP in April may reach the $1.80–$2.20 range if resistance is reclaimed, with an extended move toward $2.60 possible under stronger momentum. However, if resistance continues to hold, XRP may remain range-bound. A breakdown below the $1.20 support could push the price back toward the $1.00 level, delaying recovery.

CoinPedia’s XRP Price Prediction 2026

The broader price structure for XRP in 2026 suggests a market transitioning out of a corrective phase, but still awaiting confirmation of a sustained trend reversal. Following its rally in previous cycles, XRP peaked near the $3.50 region before entering a prolonged downtrend, defined by a descending resistance structure and consistent lower highs throughout 2025. This trend has carried into early 2026, with price recently stabilizing near the $1.20–$1.30 demand zone as selling pressure begins to ease.

At this stage, the focus shifts toward whether XRP can reclaim key resistance levels and attract renewed demand. The immediate barrier remains at $1.70, followed by stronger resistance at $2.50 and the major supply zone between $2.60–$2.80. Beyond technical structure, regulatory and institutional catalysts are likely to play a decisive role in XRP’s trajectory through 2026.

XRP price prediction

Developments around U.S. crypto legislation, particularly frameworks such as the CLARITY Act, aimed at defining digital asset classifications, could provide long-awaited regulatory certainty. For XRP, which has been heavily influenced by legal outcomes, clearer classification could significantly improve institutional confidence and unlock broader participation.

At the same time, ongoing expansion of Ripple’s enterprise payment solutions and XRP Ledger (XRPL) integrations in cross-border settlement continues to strengthen its real-world use case. Any acceleration in adoption among financial institutions or payment corridors could act as a direct demand driver. Additionally, increasing discussion around spot crypto ETF expansion beyond Bitcoin and Ethereum introduces a longer-term narrative tailwind. While speculative at this stage, any progress toward broader altcoin ETF inclusion could materially shift liquidity flows toward assets like XRP.

If these catalysts align with a breakout above key resistance levels, XRP could transition into a recovery phase. A sustained move above $2.50 would signal structural improvement, with a breakout above $3.80 opening the path toward the $6.00–$9.50 range over time. However, until both regulatory clarity and technical confirmation materialize, XRP remains in a transitional phase. Failure to hold the $1.20 support could extend consolidation and delay upside momentum.

Recent Catalysts (April 2026)

  • CLARITY Act progress remains a key trigger, with potential regulatory clarity expected to influence institutional participation.
  • Ripple’s push into banking and payment integrations is strengthening XRP’s real-world use case.
  • Ongoing institutional partnerships continue to support XRP’s role in cross-border settlement.

XRP On-Chain Outlook

XRP’s on-chain data is currently pointing toward a cooling market environment, where activity has slowed but structural conditions are quietly improving. Spot trading volume across exchanges has dropped to its lowest level since 2024, reflecting reduced participation and weaker short-term momentum. This decline indicates that the market is no longer driven by aggressive trading, but is instead moving through a low-liquidity consolidation phase. At the same time, liquidity remains concentrated on major platforms like Binance, Upbit, and Coinbase, suggesting that while overall activity has declined, core market interest is still intact.

XRP On Chain Data

On the derivatives side, a more significant shift is unfolding. XRP’s leverage and open interest in Binance have dropped sharply, signaling a major reset in speculative positioning. The estimated leverage ratio has fallen substantially from previous highs, while open interest has cooled to much lower levels. This indicates that leveraged traders have largely exited or reduced exposure, removing excess risk from the market.

XRP Ledger

This combination of declining spot activity and reduced leverage suggests that XRP is transitioning from a highly speculative phase into a cleaner, more stable structure. With the market now less crowded and less prone to liquidation-driven volatility, the current setup reflects a reset phase, where pressure is building more gradually.

Overall, XRP’s on-chain signals point toward a market that is not weakening, but resetting after excess, creating conditions that often precede a more sustainable and directional move once momentum returns.

Ripple (XRP) Price Prediction 2026 – 2030

YearPotential Low ($)Potential Average ($Potential High ($)
20263.406.509.50
20277.5010.0012.00
20288.8011.5016.00
202914.2019.0022.00
203018.8023.0030.00

Ripple (XRP) Price Prediction 2026

The XRP price range in 2026 is expected to be between $3.40 and $9.50

XRP Price Prediction 2027

Ripple (XRP) price range can be between $7.50 to $12.00 during the year 2027. 

XRP Price Forecast 2028

In 2028, Ripple is forecasted to potentially reach a low price of $8.80, an average price of $11.50, and a high price of $16.00.

XRP Price Targets 2029

Thereafter, the XRP price for the year 2029 could range between $14.20  and $22.00.

Ripple (XRP) Price Prediction 2030

Finally, in 2030, the price of XRP is predicted to remain steady and positive. It may trade between $18.80 and $23.00.

Ripple (XRP) Price Projection 2031, 2032, 2033, 2040, 2050

Based on historical market sentiment and trend analysis, the following are the possible XRP price targets for longer-term time frames.

YearPotential Low ($)Potential Average ($)Potential High ($)
203125.0029.5035.25
203231.5036.7541.25
203335.7542.2547.75
204097.50135.50179.00
2050219.25331.50526.00

Market Analysis

Year202620272030
Changelly$3.00$6.50$17.76
DigitalCoinPrice$4.20$7.50$18.00
WalletInvestor$4.80$7.90$20.00
Never Miss a Beat in the Crypto World!

Stay ahead with breaking news, expert analysis, and real-time updates on the latest trends in Bitcoin, altcoins, DeFi, NFTs, and more.

FAQs

What is the XRP price prediction for 2026?

XRP could trade between $3 and $6 in 2026 if crypto market momentum strengthens and Ripple expands partnerships with banks using RippleNet and ODL.

How high will XRP go in 2030?

XRP could potentially reach $18–$30 by 2030 if the crypto market enters a strong bull cycle and Ripple expands global payment partnerships.

What is the price prediction for XRP in 2031?

Market projections suggest XRP could trade around $25–$35 in 2031, depending on global crypto adoption and Ripple’s continued growth in payment infrastructure.

How much will 1 XRP be worth in 2040?

If adoption of blockchain payments grows and Ripple strengthens its financial network, XRP could trade between $97 and $179 by 2040.

How much will 1 XRP be worth in 2050?

Long-term projections indicate XRP could reach $219–$526 by 2050 if blockchain payment networks become widely used across global financial systems.

What could drive XRP’s price growth long term?

XRP’s long-term growth may depend on global payment adoption, institutional partnerships, and wider use of Ripple’s blockchain infrastructure.

Is XRP a good investment?

XRP may be a promising investment due to its role in cross-border payments and growing institutional adoption, but price volatility and regulation risks remain.

Ethereum Just Flashed a Rare Signal: What Happens Next?

Ethereum (ETH) Price Rally Incoming Whales and Charts Say the Same Thing

The post Ethereum Just Flashed a Rare Signal: What Happens Next? appeared first on Coinpedia Fintech News

Ethereum is flashing a rare market signal, and it’s not showing up in price yet. While the broader crypto market remains stuck in consolidation, ETH supply on exchanges has dropped to multi-year lows, just as early signs of buy-side pressure begin to reappear.

This type of divergence doesn’t last. When supply tightens and demand quietly returns, prices tend to move fast, raising the question of whether Ethereum price is now on the verge of its next breakout.

ETH Supply Tightens As Exchange Balances Hit Multi-Year Lows

Ethereum’s exchange supply has now dropped to its lowest level since 2016, marking a significant shift in market structure. This decline suggests that investors are moving ETH off exchanges, either into cold storage or staking, reducing the amount of liquid supply available for immediate selling. As available liquidity contracts, price becomes increasingly sensitive to changes in demand.

ETH on-chain data

This dynamic is further reinforced by Ethereum’s staking mechanism. With entry queues extending to nearly 50 days, a growing portion of ETH is being locked away from circulation. At the same time, exit queues remain minimal, indicating that holders are not rushing to unlock and sell.

Derivatives Data Shows Demand Is Beginning To Return

Alongside tightening supply, early signs of demand are starting to emerge. Net Taker Volume has flipped positive, with approximately $104 million in buy-side pressure, indicating that market participants are beginning to execute more aggressive buy orders in derivatives markets. This marks a shift from the previous regime, where selling pressure dominated even during price recoveries.

Ethereum on-chain

Importantly, this change is occurring without excessive leverage buildup, suggesting that the market is not yet overcrowded or overheated. Instead, it reflects early positioning, where traders begin building exposure ahead of a potential move. This alignment, tightening supply and returning demand, is what defines the current setup.

Ethereum Price Analysis: Compression Beneath Trendline Signals Imminent Move

Ethereum price remains capped within a broader downtrend structure, with the descending trendline continuing to reject upside attempts since the $4,000 peak. The recent decline toward the $1,800–$2,000 zone marked a local bottom, where selling pressure eased and price transitioned into consolidation.

Ethereum price

Since then, ETH has been trading in a compressed range just below resistance, reflecting a shift from directional selling to absorption. ETH price is now positioned directly beneath a key confluence zone around $2,100–$2,200, where the trendline, horizontal resistance, and moving averages intersect.

This structure suggests a market at an inflection point. A clean break and hold above resistance would invalidate the lower-high sequence and open upside toward $2,400–$2,700, while failure to reclaim this level keeps ETH range-bound with support near $1,900–$2,000.

Outlook: Breakout Setup Builds, Awaiting Trigger

Ethereum’s setup is structurally constructive, supported by tightening supply and early demand signals. However, confirmation remains key. A sustained move above resistance would likely trigger expansion, while rejection keeps the range intact. The setup points toward a decisive move ahead, with direction dependent on breakout confirmation.

❌